Abstract
Firing test campaigns were carried out on a 200 N thrust-class hybrid rocket engine, using gaseous oxygen as an oxidizer and a paraffin-wax-based fuel. Different fuel grain lengths were adopted to extend the fuel characterization under different operating conditions, and to evaluate rocket performances and internal ballistics in the different configurations. In addition to data collected under a 220 mm propellant grain length, two further test campaigns were carried out considering 130 mm and 70 mm grain lengths. Two different injector types were adopted in the 130 mm configuration; in particular, a showerhead injection system was used with the aim to contain high-amplitude pressure oscillations observed during some firing tests in this engine configuration. Parameters such as the chamber pressure and temperature inside the graphite nozzle, space-averaged fuel regression rate and nozzle throat diameter were measured. The results allowed for the investigation of different issues related to hybrid rockets (e.g., fuel regression rate, engine performance, nozzle ablation under different conditions). The focus was mainly directed to the nozzle heat transfer, through the reconstruction of the convective heat transfer coefficient for different tests in the 70 mm grain length engine configuration. The reconstruction took advantage of the experimental data provided by the nozzle embedded thermocouple. Then, the experimental convective heat transfer coefficient was used to validate the results from some empirical correlations. The results showed significant differences between the experimental convective heat transfer coefficients when considering tests with different oxidizer mass flow rates. Furthermore, the predictions from the empirical correlations proved to be more reliable only in cases characterized by oxidizer-rich conditions.
1. Introduction
The renewed interest in hybrid rockets is due to several reasons, including the growing demand for cheaper access to space due to the increase in the number of small satellites, and the simultaneous need for mini-launchers capable of precise multi-payload/multi-orbit injections. Indeed, for many applications, such as small launchers and sounding rockets, the potential advantages of hybrid rockets with respect to solid and liquid rockets are undeniable, and they have been widely discussed in the literature [1]. Several companies are currently developing hybrid rockets for commercial applications, mainly targeting the small-satellite market [2]. Among the advantages of hybrid rockets, simplicity and safety play an important role. For this purpose, the use of liquefying fuels is definitely favorable since they are characterized by very high regression rates, with respect to conventional pyrolyzing fuels, thus keeping the engine design simple, i.e., a single-port fuel grain, while preserving high engine performances. Because of these characteristics, paraffin-based fuels have been largely investigated in the past.
Nevertheless, some critical aspects need to be further assessed to increase the knowledge on hybrid rocket engines. For example, general and reliable scale laws for the engine design, as well as the nozzle heat transfer and ablation phenomena in paraffin-based fuel systems, still require more studies. Concerning the latter topic, while numerical studies can be found in the literature [3], extensive experimental data concerning nozzle heat transfer and thermal protection material erosion rates are difficult to find, especially when considering paraffin-based fuel engines operating in a wide range of oxidizer-to-fuel (OF) mixture ratios. In fact, the numerical models—which are able to predict the chemical interactions between the reacting flow and the protective material with good reliability—have mostly been validated using experimental data from solid rocket motors [4]. However, in hybrid engines, different physical and chemical conditions (e.g., combustion products, oxygen concentration) with respect to solid motors can be found, requiring an extension of the validation of numerical models. Different experimental data and numerical methods for estimating nozzle throat erosion can be found in the literature when considering fuels other than paraffin-based fuels, such as high-density polyethylene (HDPE) [5] or hydroxyl-terminated polybutadiene (HTPB) [6].
In this context, studies on hybrid propulsion with paraffin-based fuels have been initiated, developing and testing different engines in the thrust class of 100 to 1000 N [7,8]. In this study, following the experimental activities performed on a paraffin-based 200 N engine [9], where a 220 mm propellant grain length was adopted to perform an extensive firing test campaign, additional firing tests were conceived, reducing the propellant grain length to 130 mm and 70 mm. The fuel blend formulation was unchanged, being mainly composed of SASOL® 0907, and the oxidizer was gaseous oxygen. The main objective was the fuel characterization at increased OF values, including an evaluation of the new operating conditions of engine performance and nozzle heat transfer. The latter topic is mainly treated here, considering the lack of extensive graphite nozzle characterization of oxygen/paraffin-based fuel engines operating at different OF values. The experimental results showed that nozzle throat erosion was extremely limited in the adopted graphite G348 material, as long as the OF values remained below the stoichiometric value during the 4 s of firing. In the new engine configurations (70 mm and 130 mm grain length), the graphite nozzle was modified to host an embedded thermocouple. Taking advantage of the temperature measurement by the nozzle embedded thermocouple, a reconstruction of the nozzle wall convective heat transfer coefficient was performed for some tests in the 70 mm grain length engine configuration. The results were used to validate numerical models and typical empirical correlations often adopted for nozzle convective heat transfer estimation.
2. Experimental Setup
2.1. Description of 200 N Rocket Engine
The 200 N thrust-class engine layout is shown in Figure 1. It is composed of a replaceable injection system (axial conical mono-injector with a 6 mm exit diameter, or showerhead injector made of 13 elements, each with a 1.5 mm diameter), a pre-combustion chamber, a propellant grain, an aft mixing chamber and a graphite nozzle. The different parts were contained inside a shell made of steel. A new case, named shell-short, was realized with a shorter length to host the 70 mm propellant grain. Furthermore, an extension of 50 mm was realized to host the 130 mm grain. One of the shell-shorts was constructed via the ALM (additive layer manufacturing) process using the CIRA EBM (electron beam melting) machine (see Figure 2b). The engine ignition was established with a methane/oxygen mixture with a spark plug. Two high-frequency pressure transducers, Setra C206, were separately located in the engine pre-chamber and aft chamber. The graphite nozzle hosted an embedded thermocouple, type K, for temperature acquisition in the proximity of the nozzle throat.

Figure 1.
Layout of the engine with a 130 mm grain length.
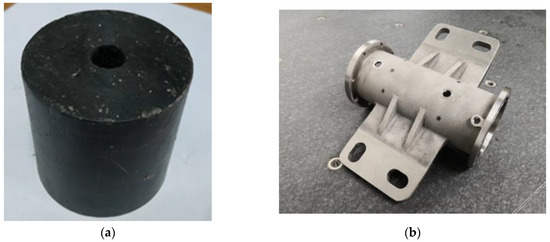
Figure 2.
Propellant grain before a test (a), and 200 N engine shell-short constructed via ALM (b).
The rocket had an axisymmetric combustion chamber, with a 69 mm case inner diameter and a variable length. The motor forward closure can accommodate both the converging nozzle injector and the showerhead injector.
Upstream and downstream of the solid grain, a dump plenum (25 mm long with a 44 mm inner diameter) and an aft mixing chamber (38 or 58 mm long with a 45 mm inner diameter) were set up, respectively. A graphite converging–diverging nozzle with a 9.8 mm throat diameter and an area expansion ratio equal to 2.87 was employed.
Figure 2a shows a propellant grain adopted in the engine before a test, in the 70 mm configuration. Figure 2b shows the 200 N thrust-class engine shell (named shell-short, to make a distinction with respect to the shell adopted for the 220 mm grain length) constructed with the ALM technique, manufactured using the CIRA EBM machine. Two wings were added to the shell to directly fix the engine to the test bench, without the use of additional clamps, which are usually adopted.
2.2. Test Facility Description
The test facility has a versatile experimental setup primarily designed for firing hybrid rocket engines of several sizes [9]. The equipment includes a test rig and a general-purpose data acquisition system, which allow several types of tests to be performed.
Figure 3 shows the piping and instrumentation schematic of the test rig. Gaseous oxygen is supplied by a reservoir connected to several cylinders; an electronic pressure regulator (TESCOM ER3000) sets the operating pressure along the motor feed line. The oxygen mass flow rate is evaluated through gas temperature and pressure measurements upstream of the throat of a chocked Venturi tube placed along the line. Nitrogen is purged into the chamber for the burn-out and in case of an emergency shutdown. The gaseous methane feed line, used for the engine ignition, is also highlighted.
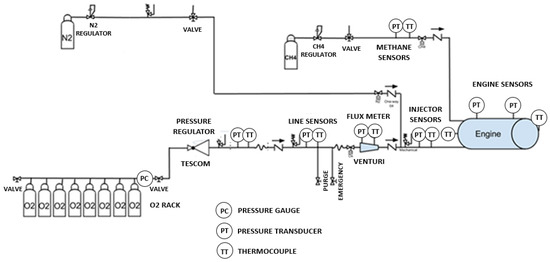
Figure 3.
Schematic of the test facility.
The test facility allows the acquisition of engine thrust by means of four load cells at a frequency of 5 kHz.
2.3. Test Campaign Conception and Test Matrix
The test campaign was conceived to further investigate the engine performance and paraffin-fuel behavior under the new operating conditions, considering a gradual increase in the flame temperature and oxygen concentration coming from the increase in the OF mixture ratio when reducing the grain length. The test matrix was conceived to explore a wide range of oxidizer mass flow rates, starting from about 15 g/s up to about 60 g/s. The assessment also included data obtained with the 220 mm grain length from [9], in addition to the 70 mm and 130 mm test results. Higher oxidizer-to-fuel mixture ratios associated with the 70 mm grain length engine configuration were also used to eventually determine ablation phenomena in the graphite nozzle, due to the increase in the oxygen concentration and flame temperatures.
Concerning the labeling (Figure 4), L refers to the grain length of 220 mm tested in the previous campaign [9], M refers to the 130 mm grain length engine configuration with the showerhead injector, S refers to the 70 mm grain length engine configuration with mono-injector and MU refers to the 130 mm grain length engine configuration adopting the mono-injector.
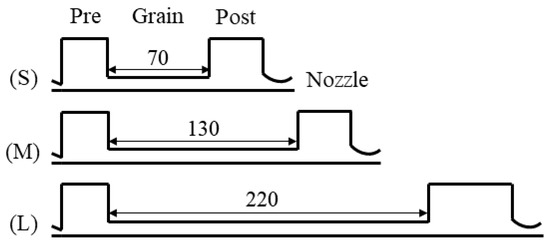
Figure 4.
Motor configurations S, M and L. Grain length and post-chamber length in mm.
Finally, there was a difference in the aft chamber length. Specifically, the L engine configuration adopted a post-chamber length equal to 58 mm, while in the M/MU and S engine configurations, the post-chamber length was 38 mm.
The nominal test matrix is reported in Table 1.

Table 1.
Nominal test matrix.
3. Experimental Results
3.1. Experimental Acquisitions and Measurements
Data were acquired at a rate of 5 kHz. All the signals were processed and down-sampled at 100 Hz with a boxcar average. The main parameters directly acquired in the firing tests, with the relative uncertainty, were as follows:
- Chamber pressure (±7∙103 Pa);
- Engine thrust (;
- Oxidizer mass flow rate ( g;
- Nozzle temperature (.
The quantities measured after the firing test were the fuel grain mass consumption () and the nozzle throat diameter.
Starting from the fuel grain mass consumption and the burning time, the average fuel mass flow rate was calculated as
The final space-averaged port diameter was calculated from the mass loss as
where and L are the initial grain diameter and length, respectively. The time–space-averaged port diameter was then calculated as
and the average oxidizer mass flux was calculated as
Finally, the time–space-averaged fuel regression rate was calculated as
Table 2 summarizes the main experimental results, including the effective oxygen mass flow rate, burning time, initial and final nozzle throat diameters, average oxidizer mass flux, average fuel regression rate, average overall oxidizer-to-fuel mixture ratio, average chamber pressure and average thrust. The engine burning time was computed starting from the half of the pressure rise to the half of the final pressure drop.

Table 2.
Main experimental results.
As shown in the results, in all cases, the effective oxidizer mass flow rate and burning time were very close to the nominally required conditions. Tests 4S and 5S were the only tests to show graphite nozzle throat erosion. In these tests, the effective oxidizer mass flow rate reached the maximum value, about 60 g/s, and the average oxidizer-to-fuel mixture ratio was between 4.8 and 4.9, leading to a highly oxidizing environment. Note that the initial nozzle throat diameter was slightly different for the M/MU tests, since in the second test campaign, another nozzle was adopted.
In the following figures, the acquired signals—pressure, thrust and nozzle temperature—are shown. For the sake of clarity, the curves were grouped using only some tests. Unless specified, the pressure signals in the engine post-combustion chamber can be considered to be similar to those in the pre-chamber, and therefore only the latter are reported.
The pressure signals and thrust acquisitions are reported in Figure 5a,b, respectively, for the S tests. Note that the pressure for test 6S is not available, as the PT did not acquire data due to paraffin occlusion.
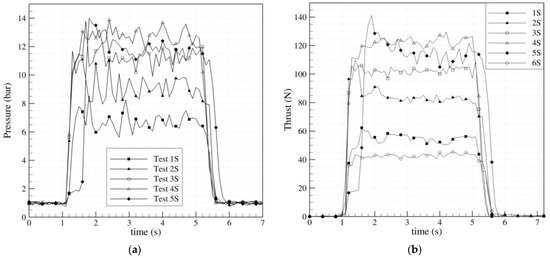
Figure 5.
Acquisitions of pressure in the engine pre-chamber (a) and thrust (b) for the S tests.
The pressure acquisitions for the MU and M tests are reported in Figure 6a,b, respectively. They are separated for the sake of clarity. The tests performed with the conical mono-injector were characterized by high-pressure oscillations, despite the increase in the oxidizer mass flow rate (60 g/s in test 8MU). Switching to the showerhead injection system (M tests) led to a completely different behavior, where the engine showed good combustion stability in all the testing conditions.
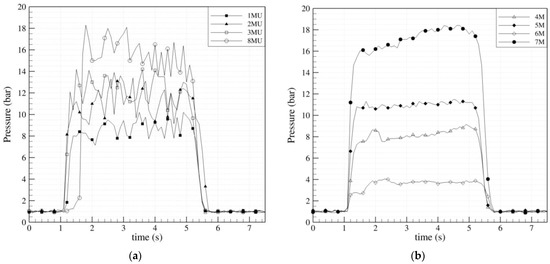
Figure 6.
Pressure acquisitions in the engine post-chamber for the MU (a) and M (b) tests.
Comparing the high-frequency (5 kHz) pressure acquisitions, the down-sampled trends were confirmed, pointing out pressure oscillations between 30 and 40% of the average value in the unstable MU conditions, which were reduced to the order of 5% in the M cases.
The observed oscillating phenomenon has not yet been reported in the literature. Numerical simulations were carried out, which pointed to major differences in the fluid dynamics among the two injection systems.
Figure 7 shows the thrust acquisitions for the MU (a) and M (b) tests. The curves exhibit the same trends as those observed for the pressure. Specifically, tests 4M and 7M showed a visible increase in thrust over the firing time, while for tests 3MU and 8MU, the trend was the opposite. For all the other tests, the thrust values were nearly constant with the firing time. Considering that, in all cases, the nozzle throat diameter remained unchanged, the engine thrust was related to the fuel mass flow rate. In tests 3MU and 8MU, the engine stability increased over time, leading to a decrease in the fuel regression rate and thrust. Concerning tests 4M and 7M, the more pronounced increase in engine thrust over time was probably related to higher axial fuel consumption, which led to a higher increase in the fuel mass flow rate.
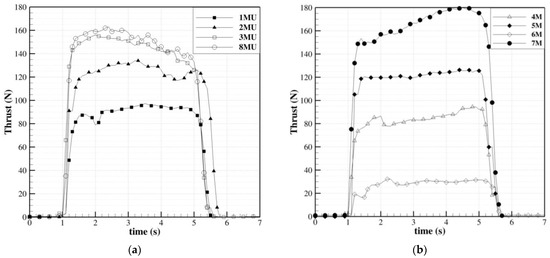
Figure 7.
Engine thrust acquisitions for the MU (a) and M (b) tests.
The temperature profiles in the nozzle are reported in Figure 8 for all of the S (a) and M/MU (b) tests. Looking at the S tests, it can be noticed that with the increase in the oxidizer mass flow rate, the temperature increased. This was expected because of the pressure increase, which directly affected the wall heat flux, while the flame temperatures were expected to slightly decrease due to the increase in the average oxidizer-to-fuel mixture ratio over the stoichiometric value. It can also be noticed that the curves were characterized by peak values (approaching 1000 K for test 6S) upon engine shutdown, except for test 1S. Comparing the S and M tests, higher values were generally registered in the first case, even though the average chamber pressure values were lower with respect to the M tests because of the lower fuel mass flow rate. Clearly, the effect of temperature was predominant due to the average oxidizer-to-fuel mixture ratio being closer to the stoichiometric value. Concerning the M tests, the same trend of the curves was observed, characterized by peak values upon engine shutdown. However, a different trend was observed among the M tests with the same oxidizer mass flow rate, due to the different engine behaviors, which affected the fuel regression rate. To provide an example, comparing test 2MU and test 5M, which were performed under the same conditions (oxidizer mass flow rate of 41.2 vs. 41 g/s, respectively), considerably higher temperatures were acquired in the M case. Even though the average chamber pressure was nearly the same (11.32 vs. 11.29 bar), in the MU case, the fuel regression rate was significantly higher, leading to a considerable difference in the average oxidizer-to-fuel mixture ratio (1.07 vs. 1.76). As a consequence, the flame temperature in the M case was higher (the slope of the T–OF curve is very steep in that OF range). Note that the average chamber pressure was the same for the two tests, despite the considerably higher fuel mass flow rate in test 2MU, because of the higher engine efficiency associated with test 5M. Similar considerations are applicable when comparing test 2M and test 4 under the same oxidizer mass flow rate conditions.
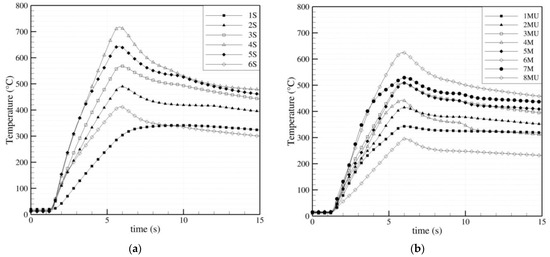
Figure 8.
TC nozzle acquisitions for the S (a) and M (b) tests.
Figure 9 shows the fuel regression rate values vs. the oxidizer mass flux, for tests in the S and M/MU configurations. As can be seen, the regression rates of the M tests were similar (slightly higher) to those of the S tests, even if tests 4S and 5S showed lower values than expected. This issue was not investigated in depth, but a relationship with the nozzle throat erosion can be hypothesized since this phenomenon represents a major difference among tests 4S/5S and the other tests. The MU tests exhibited higher regression rates with respect to the others. For this reason, tests 1MU/2MU/3U were excluded in the power law fitting curve reported in the figure. This anomalous recession was attributed to high-pressure oscillations that emerged during these tests.
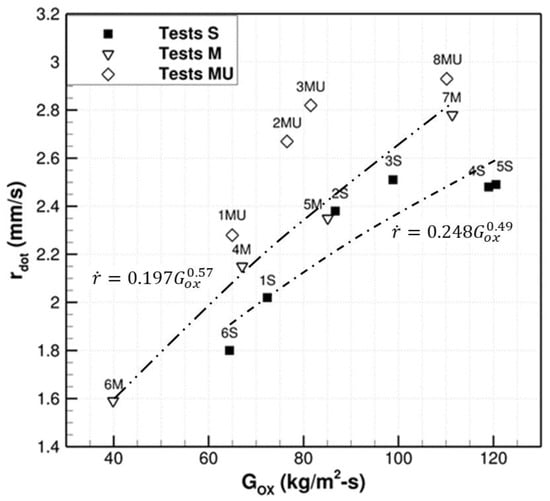
Figure 9.
Regression rate vs. oxidizer mass flux of the S, M and MU tests.
3.2. Preliminary Engine Performance Assessment
The engine performances are summarized in Table 3, including the operating conditions (for the sake of completeness) and the experimentally computed values of characteristic velocity (c*), specific impulse (Isp) and thrust coefficient (CF).

Table 3.
Main engine performances calculated for all tests.
Specifically, the aforementioned parameters were computed with the following formulations:
Figure 10 shows the experimental characteristic velocity vs. the mean oxidizer-to-fuel mixture ratio. The ideal , computed using in CEA software [10] a paraffin-based fuel with the chemical formula C32H66 at a temperature of 293 K with a formation enthalpy of −967.8 kJ/mol, is represented by the solid line. It can be observed, that for the M tests, the trend increased with OF, as expected for the considered mixture ratio range. The engine combustion efficiency ) in this configuration was close to 0.9. The characteristic velocities of the S tests were significantly lower and much less sensitive to OF, leading to a combustion efficiency close to 0.75 in this different engine configuration.
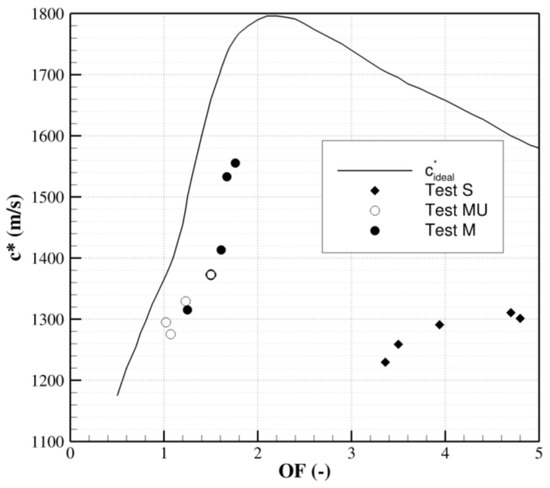
Figure 10.
Characteristic velocity vs. overall mixture ratio for the S, M and MU tests.
4. Nozzle Wall Heat Transfer Reconstruction
Using the experimental temperature profiles acquired using the embedded thermocouple (TC) in the graphite nozzle material, the experimental nozzle wall heat transfer was calculated for tests 2S, 4S and 5S, corresponding to the S engine configuration—the most critical from a thermal point of view. In particular, in tests 4S/5S, nozzle throat erosion was observed, and therefore the estimation of the corresponding heat transfer to the wall is relevant. Test 2S, with a lower oxidant mass flow rate, did not show throat erosion, and the heat transfer estimation was carried out to compare the wall heat transfer differences in the two testing conditions. In this study, a comparison between the experimental nozzle wall heat transfer and the modeled one, with different empirical correlations, is presented, allowing for a preliminary validation of the numerical tool.
4.1. Numerical Setup and Procedure
4.1.1. Procedure for Nozzle Wall Heat Transfer Reconstruction
The iterative procedure adopted to estimate the experimental convective heat transfer coefficient ( at the nozzle wall is presented in Figure 11. As shown in the figure, the first convective heat transfer coefficient was imposed on the nozzle hot-gas side wall at the initial time, with an axial profile distribution derived using the numerical tool, based on a modified Bartz correlation. With the initial boundary condition along the nozzle wall, a transient thermal simulation was started by means of the ANSYS Fluent commercial code, simulating the thermal wave propagation inside the solid material. The numerical temperature values, computed in the TC location, were compared with the experimental values. Depending on the result of the comparison (the error is defined), the convective heat transfer coefficient increased or decreased (due to the profile error) until the resulting profile distribution over time was found.
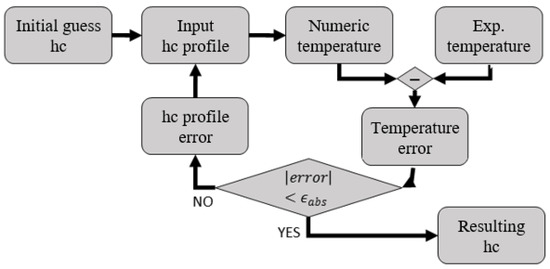
Figure 11.
Iterative procedure adopted to estimate the wall profile.
As mentioned previously, in the adopted procedure, an axial profile distribution extracted using the numerical tool with the modified Bartz equation was assumed. This assumption included an approximation due to the fact that the Bartz equation is not expected to be extremely accurate in the whole nozzle. Nevertheless, the comparison with the profile distribution coming from CFD simulation of the reacting flow [9] seemed to be in good agreement.
4.1.2. Numerical Setup
Numerical simulations inside the material were carried out with ANSYS Fluent ver. 18.1.0. The 3D domain with boundary conditions and the computational mesh are presented in Figure 12. As shown in the figure, the walls were considered adiabatic, except for the hot-gas side nozzle wall, where the convective heat transfer coefficient was applied. In this case, the free-stream temperature value was set to 3250 K for both tests 2S and 4S, which is very close to both values returned by RPA (Rocket Propulsion Analysis) [11] under the two operating conditions. The domain in Figure 12a also shows the thermocouple positioning inside the nozzle wall. As previously mentioned, the imposed axial profile distribution was preliminary derived using numerical calculations [7]. The gas properties in these calculations took into account the OF variation over time, as reported elsewhere [7]. The computational 3D mesh, as shown in Figure 12b, is a hybrid grid made of tetra elements in the volume and prism layers along all the domain walls. The mesh details are reported in Table 4.
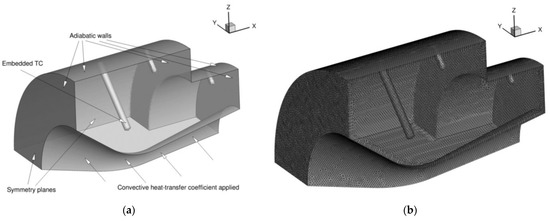
Figure 12.
Computational domain/boundary conditions (a) and mesh (b) used for the simulations.

Table 4.
Mesh characteristics.
Transient simulations were carried out considering a fixed time step equal to s. A pressure-based solver was adopted, and the solution method included the SIMPLE scheme for the pressure–velocity coupling and least square cell-based spatial discretization second-order accuracy.
The graphite material properties used for the calculations are presented in Figure 13, including the specific heat capacity (a) and the thermal conductivity (b) inside the solid [12].

Figure 13.
Properties adopted for graphite G348 [12]: specific heat capacity (a) and thermal conductivity (b).
4.2. Results of the Reconstruction
The reconstruction was performed for three different tests, specifically tests 2S, 4S and 5S. As shown in Table 2, tests 4S and 5S were characterized by very similar conditions, and both presented nozzle throat erosion. Test 2S, characterized by a lower oxidizer mass flow rate and time–space-averaged OF, did not show appreciable nozzle throat erosion. To reproduce the experimental temperature trends in Figure 8a, transient simulations were performed by applying different convective heat transfer coefficient profiles over time (see Figure 11). The profiles shown in Figure 14, at different times, allowed for reproducing the experimental temperature values measured with the thermocouple with a good approximation. As shown in the figure, it was necessary to considerably increase the values at the beginning of the simulation, varying from peak values approaching at the initial time to after about 1 s. Subsequently, increased to about and in the last two seconds of the test.
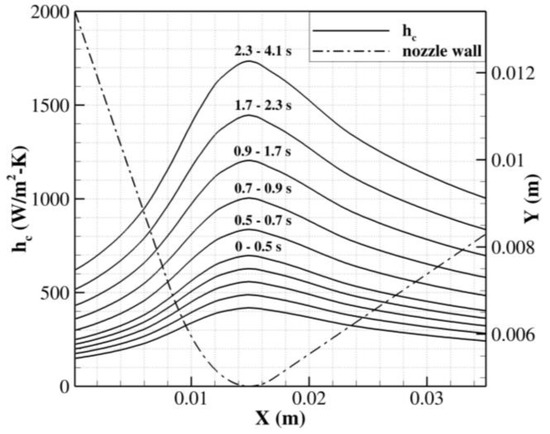
Figure 14.
Convective heat transfer coefficient profiles over time applied at the hot-gas side nozzle wall for test 2S.
Figure 15 shows the result of the reconstruction of tests 4S (a) and 5S (b). Once again, strong variation was necessary at the beginning of the simulation to properly follow the experimental temperature trends. As shown in the figure, the peak values changed by about one order of magnitude ( to ) in the first second. Almost the same profiles were applied in the two different cases, leading to some negative temperature errors in test 4S and some positive errors in test 5S. This means that the profiles in Figure 15 were slightly underestimated for test 4S and slightly overestimated for test 5S. With respect to the profiles of test 2S, a strong difference was observed, since the values for tests 4S/5S were about 3 times higher.
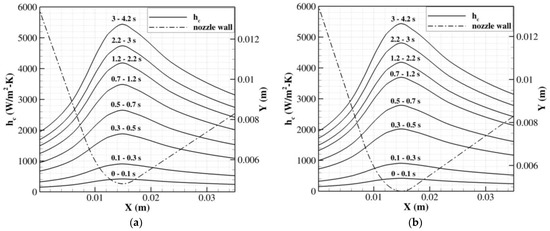
Figure 15.
Convective heat transfer coefficient profiles applied at the hot-gas side nozzle wall for tests 4S (a) and 5S (b).
Figure 16 shows the comparison between the numerical (solid lines) and experimental (symbols, filled for test 5S) temperature values over time for tests 2S, 4S and 5S. In all cases, the temperature error (numerical minus experimental temperature; see Figure 11) was always below the prescribed margin (5% of the experimental value was defined). It is also shown, as mentioned previously, that the numerical temperature was lower with respect to the experimental temperature for test 4S at the end of the simulation (meaning that the applied profile needed to be increased slightly), and higher for test 5S (meaning that the applied profile needed to be decreased slightly).
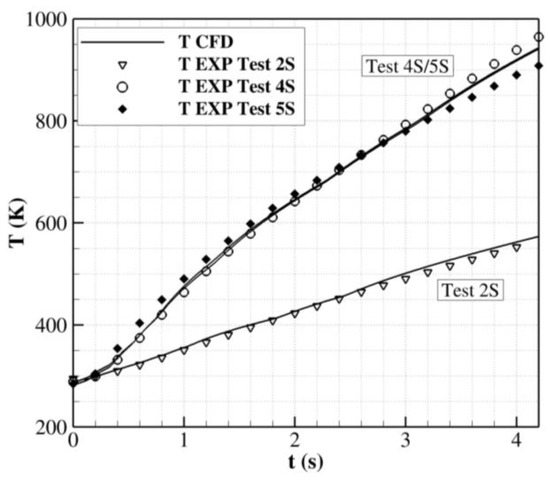
Figure 16.
Numerical (solid line) and experimental (dashed line) temperature profiles vs. time for test 2S.
This observation is in line with the experimental temperature trends in Figure 8a, where it can be observed that at the end of the firing, the temperature acquisition for test 4S showed higher values with respect to test 5S. The difference can be related to the combination of minor differences in both the engine operating conditions and nozzle throat radius of curvature.
4.3. Empirical Correlations and Comparison
The prediction of the gas side heat transfer coefficient represents a very complex problem. Comparisons of analytical results with experimental heat transfer data have often shown disagreements in the literature [13]. Differences are mainly attributed to the initial assumptions in the analytical calculations. Conventional formulations adopted to estimate the convective heat transfer coefficient are usually given in terms of dimensionless parameters (e.g., and ) [13]:
where represents the hydraulic diameter, and .
Based on experience with turbulent boundary layers, some relatively simple correlations have been developed. The Bartz correlation [14] is a well-known equation used for the estimation of rocket nozzle convective heat transfer coefficients based on the thermal properties of combusted gases and isentropic gas equations:
Different modifications have been proposed in the literature, including the following one based on the studies of Ciniaref and Dobrovoliski [15]. Please note that this correlation is the default one implemented in the used numerical tool and the one adopted to estimate the axial distributions, which were previously presented.
Another correction of the Bartz equation was proposed by Pavli [16]:
where is a correction factor corresponding to the temperature.
The empirical correlations reported in Equation (11) (default) and Equation (12) were implemented in the numerical tool to evaluate the results and to compare them with those presented above. It should be noted that the used numerical tool performed a transient calculation where the properties of combusted gases (, , and ) were updated step by step [7], by means of polynomial interpolations based on data from the RPA combustion analysis tool [11]. The chemical formula adopted to simulate the paraffin-based fuel was .
Figure 17a shows the different profiles predicted at the final time (4.2 s), considering the case of test 4S. Appreciable differences can be observed between the rebuilt experimental and the one predicted with the use of correlations. However, the default correlation proposed by Ciniaref and Dobrovoliski (Equation (11)) led to smaller differences ( vs. peak values), about of the peak value, while the correlation suggested by Pavli (Equation (12)) led to overestimations by about of the peak value (). Considering test 2S, Figure 17b shows that the predictions using the correlations were similar to those found for test 4S ( peak values between and ). This result was expected since the pressure and temperature conditions did not present remarkable differences. Test 2S was characterized by a lower chamber pressure, but the OF ratio was closer to the stoichiometric value, leading to an increase in the flame temperature; therefore, the parameters adopted in the correlations were not expected to be very different. On the other hand, strong differences were highlighted between the experimentally rebuilt and the predictions using the correlations, once again with higher overestimations in the case of the Pavli correlation (Equation (12)).
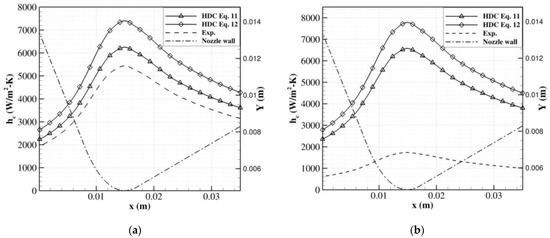
Figure 17.
Comparison of predictions with different methods: tests 4S (a) and 2S (b).
Figure 18 shows the comparison between the experimental profiles over time (0 to 4.2 s) and those obtained with the implementation of the default correlation (Equation (11)), considering test 4S. Two major differences can be observed, particularly the strong variation in the experimental over time, which was more contained when adopting the numerical tool, and the trend returned by the tool, which predicted decreasing values over time. The variation over time, predicted with the use of the correlation, was expected to be not too wide, since the variation in the operating conditions over time was somehow contained. The simulations predicted adiabatic temperature variation over time between 3300 and 3200 K; at the same time, the pressure also decreased due to nozzle throat erosion, and thus decreased over time. The strong variation over time found in the experimental reconstruction, on the other hand, was not related to changes in the engine operating conditions but to strong variation in the fluid properties inside the boundary layer, depending on the nozzle wall temperature.
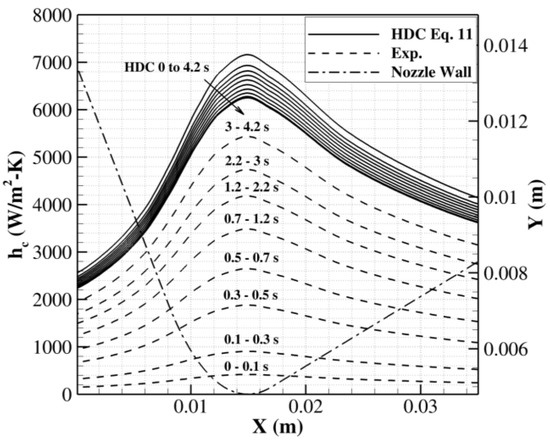
Figure 18.
Comparison between experimental and numerical (Equation (11)) profiles over time for test 4S.
4.4. Discussion
As highlighted previously, a strong difference was observed between the rebuilt for tests 2S and 4S/5S. As shown through the use of correlations, the difference between the experimental values found for tests 2S and 4S/5S was not related to differences in the pressure and temperature conditions; on the contrary, some higher values were even expected for test 2S. Therefore, some mechanisms occurred in the case of test 2S that were not evident in tests 4S/5S. From the performed reconstruction calculations, the temperature profiles inside the nozzle material were extracted to evaluate wall temperature differences among the different cases. Figure 19 shows the temperature profiles inside the nozzle material, extracted along the highlighted line, from the TC position to the hot-gas side nozzle wall, at different simulation times (from 1 s to 4 s) for tests 2S and 4S (representative of test 5S too). The results refer to the application of the rebuilt convective heat transfer coefficients presented in Figure 14 and Figure 15a. As shown in the results, a strong difference was noted, since in test 2S, the highest temperature value at the nozzle wall approached about 700 K, while for test 4S, this value was obtained only after 1 s (although the temperature value at the end was about 1300 K). This result suggests that in the case of test 2S, the nozzle wall temperature remained almost below the gasification temperature of the paraffin-based fuel blend, which is around 750 K.
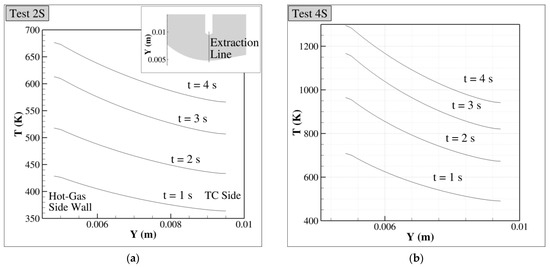
Figure 19.
Temperature profiles from the TC to the hot-gas side wall at different times for tests 2S (a) and 4S (b).
This finding suggests that under the conditions of test 2S, a paraffin fuel liquid layer at the wall could exist, while this event can be excluded in the case of test 4S unless the first second of the firing test is considered. The paraffin fuel liquid layer acts as a sort of insulator, and the thermal energy is absorbed, in part, by the endothermic process of gasification. Thus, the thermal and transport properties of the fluid in the boundary layer are expected to be very different from those adopted in the empirical correlations, leading to strong differences in the convective heat transfer coefficient prediction that cannot be modeled with a simplified model. When the nozzle wall temperature is above the paraffin-based fuel gasification value, the thermal energy is widely directly transferred from the hot combustion gases to the nozzle wall. This was the case for tests 4S/5S for most of the firing time, where the wall temperatures were above the gasification temperature, and the fluid properties were predicted with good accuracy using the correlations.
This can also be considered the reason why, at the beginning of the firing test, in all cases, a small value must be applied to properly follow the experimental temperature trend. In fact, until the wall temperature remains below the gasification threshold, the thermal energy is absorbed by the endothermic process of gasification, as the wall temperature is low.
The reason why tests 2S and 4S/5S presented very strong differences in the wall temperature and thus in the predicted and thermal nozzle behavior (including erosion for tests 4S/5S), even though the engine operating conditions were not too different, is probably dependent on several factors. However, the most important one is, without a doubt, the OF ratio, which approached averaged values of 3.5 for test 2S and close to 5 for tests 4S/5S. Even if this OF difference does not have a significant effect on the adiabatic flame temperature, the difference in the amount of unburnt fuel has a significant effect.
The present study suggests that the estimation of the nozzle heat transfer in paraffin-based hybrid engines by means of classical empirical correlations, e.g., the Bartz correlation, is reliable, with slight overestimations returned by the Ciniaref and Dobrovoliski equation, only in oxidizer-rich conditions; otherwise, significant overestimation should be expected if the gas properties are not properly corrected.
5. Conclusions
The experimental results from a 200 N thrust-class hybrid engine firing test campaign were obtained. Different experimental acquisitions (e.g., data acquisition of several parameters such as the oxidizer mass flow rate, chamber pressure and nozzle temperature) and measurements (e.g., propellant grain weight and dimensions, and graphite nozzle throat diameter) allowed us to characterize each test in terms of the fuel regression rate and engine performance, and to validate numerical models. The nozzle wall convective heat transfer coefficient (h_c) was estimated for different tests in the 70 mm grain length configuration—the most critical engine configuration, from a thermo-chemical point of view. Among the different tests, important differences in the nozzle wall convective heat transfer coefficient were found. The results showed that the engine operating conditions, in terms of the pressure and temperature, had a limited impact on the theoretical h_c. Instead, an important role was attributed to the oxidizer-to-fuel mixture ratio, and specifically to the amount of unburnt fuel available during the firing test. In fuel-rich conditions, part of the thermal energy transferred from the hot gases to the wall was absorbed by the endothermic process of gasification, leading to changes in the gas properties of the boundary layer, affecting the effective thermal conductivity. In this case, empirical correlations failed to correctly estimate the value of h_c, because this flow effect was not considered. In oxidizer-rich conditions, the nozzle wall temperature increased above the gasification temperature of the paraffin-based fuel blend. The thermal energy was widely transferred from the hot gases to the wall, leading to a strong increase in the convective heat transfer coefficient. In this case, the use of empirical correlations proved to be valid, leading to slight overestimations of the h_c value.
Author Contributions
Conceptualization, D.C.; methodology, F.B., G.G., S.M. and R.S. All authors have read and agreed to the published version of the manuscript.
Funding
The research has been financed by MUR (Italian Ministry of University and Research) within the HYPROB-NEW project.
Acknowledgments
This work was developed in the framework of the HYPROB-NEW program, supported by the Italian Ministry of University and Research (MIUR).
Conflicts of Interest
The authors declare no conflict of interest.
Nomenclature
| a | regression rate pre-exponential factor, m3/kg |
| Ae | nozzle exit area, m2 |
| At | nozzle throat area, m2 |
| cp | specific heat, J/kg·K |
| characteristic velocity, m/s | |
| thrust coefficient | |
| D | fuel grain port diameter, m |
| D1 | initial fuel grain port diameter, m |
| final space-averaged fuel grain port diameter, m | |
| hydraulic diameter, m | |
| critical diameter, m | |
| F | thrust, N |
| G | mass flux, kg/m2·s |
| gravitational acceleration, m/s2 | |
| specific impulse, s | |
| L | fuel grain length, m |
| mass flow rate, kg/s | |
| ΔMf | measured solid mass fuel loss, g |
| n | regression rate law exponent |
| OF | mixture ratio |
| p | pressure, Pa |
| Prandtl number | |
| curvature radius, m | |
| fuel regression rate, mm/s | |
| R | ideal gas constant, J/mol·K |
| Reynolds number | |
| T | temperature, K |
| tb | burning time, s |
| tr | residence time, s |
| PT | pressure transducer |
| TC | thermocouple |
| Greek Symbols | |
| numerical error | |
| thermal conductivity, W/m2·K | |
| μ | dynamic viscosity, kg/m·s |
| ρ | density, kg/m3 |
| η | characteristic velocity efficiency |
| Superscripts | |
| time average | |
| density-weighted average | |
| Subscripts | |
| c | combustion chamber |
| e | nozzle exit |
| f | fuel |
| g | grain, gas |
| inj | injection |
| ox | oxidizer |
References
- Davydenko, N.; Gollender, R.; Gubertov, A.; Mironov, V.; Volkov, N. Hybrid rocket engines: The benefits and prospects. Aerosp. Sci. Technol. 2007, 11, 55–60. [Google Scholar] [CrossRef]
- Schmierer, C.; Kobald, M.; Fischer, U.; Tomilin, K.; Petrarolo, A.; Hertel, F. Advancing Europe’s Hybrid Rocket Engine Technology with Paraffin and LOX. In Proceedings of the 8th European Conference for Aeronautics and Space Sciences (EUCASS), Madrid, Spain, 1–4 July 2019. [Google Scholar] [CrossRef]
- Bianchi, D.; Nasuti, F. Numerical Analysis of Nozzle Material Thermochemical Erosion in Hybrid Rocket Engines. In Proceedings of the 48th AIAA/ASME/SAE/ASEE JPC, Atlanta, GA, USA, 30 July–1 August 2012. [Google Scholar] [CrossRef]
- Bianchi, D.; Turchi, A.; Nasuti, F. Numerical Analysis of Nozzle Flows with Finite-Rate Surface Ablation and Pyrolysis-Gas Injection. In Proceedings of the 47th AIAA/ASME/SAE/ASEE JPC, San Diego, CA, USA, 31 July–3 August 2011. [Google Scholar] [CrossRef]
- Kamps, L.; Saito, Y.; Kawabata, R.; Takahashi, Y.; Nagata, H. Method for Determining Nozzle Throat Erosion History in Hybrid Rockets. In Proceedings of the Propulsion and Energy Forum, Salt Lake City, UT, USA, 25–27 July 2016. [Google Scholar] [CrossRef]
- Tian, H.; He, L.; Yu, R.; Zhao, S.; Wang, P.; Cai, G.; Zhang, Y. Transient investigation of nozzle erosion in a long-time working hybrid rocket motor. Aerosp. Sci. Technol. 2021, 118, 106978. [Google Scholar] [CrossRef]
- Battista, F.; Cardillo, D.; Fragiacomo, M.; Di Martino, G.D.; Mungiguerra, S.; Savino, R. Design and Testing of a Paraffin-Based 1000 N HRE Breadboard. Aerospace 2019, 6, 89. [Google Scholar] [CrossRef]
- Battista, F.; Cardillo, D.; Ricci, D.; Natale, P.; Fragiacomo, M.; Ferraiuolo, M.; Salvatore, V. Technological advancements in the HYPROB Project—Demonstrators development line. In Proceedings of the 69th International Astronautical Congress (IAC), Bremen, Germany, 1–5 October 2018. [Google Scholar]
- Di Martino, G.D.; Mungiguerra, S.; Carmicino, C.; Savino, R.; Cardillo, D.; Battista, F.; Invigorito, M.; Elia, G. Two-Hundred-Newton Laboratory-Scale Hybrid Rocket Testing for Paraffin Fuel-Performance Characterization. J. Propuls. Power 2019, 35, 224–235. [Google Scholar] [CrossRef]
- Gordon, S.; McBride, B.J. Computer Program for Calculation of Complex Chemical Equilibrium Compositions and Applications; NASA Reference Publication 1311: Cleveland, OH, USA, 1996. [Google Scholar]
- Ponomarenko, A. RPA Tool for Rocket Propulsion Analysis. In Proceedings of the Space Propulsion Conference, Cologne, Germany, 19–22 May 2014. [Google Scholar]
- McEligot, D.M.; Swank, W.D.; Cottle, D.L.; Valentin, F.I. Thermal Properties of G-348 Graphite; INL/EXT-16-38241; Idaho National Lab.(INL): Idaho Falls, ID, USA, 2016. [Google Scholar]
- Iqbal, M.J.; Sheikh, N.A.; Ali, H.; Khushnood, S.; Arif, M. Comparison of empirical correlations for the estimation of conjugate heat transfer in a thrust chamber. Life Sci. J. 2012, 9, 708–716. [Google Scholar]
- Bartz, D.R. A simple equation for rapid estimation of rocket nozzle convective heat transfer coefficients. Jet Propul. 1957, 27, 49–51. [Google Scholar]
- Ciniaref, G.D.; Dobrovoliski, M.B. Theory of Liquid-Propellant Rockets; Oborongiz: Moscow, Russia, 1957. [Google Scholar]
- Pavli, A.J.; Curley, J.K.; Masters, P.A.; Schwartz, R.M. Design and Cooling Performance of a Dump Cooled Rocket Engine; Technical Note TN D-3532; NASA: Washington, DC, USA, 1966.
Disclaimer/Publisher’s Note: The statements, opinions and data contained in all publications are solely those of the individual author(s) and contributor(s) and not of MDPI and/or the editor(s). MDPI and/or the editor(s) disclaim responsibility for any injury to people or property resulting from any ideas, methods, instructions or products referred to in the content. |
© 2023 by the authors. Licensee MDPI, Basel, Switzerland. This article is an open access article distributed under the terms and conditions of the Creative Commons Attribution (CC BY) license (https://creativecommons.org/licenses/by/4.0/).