Abstract
Environmental and socio-economic evaluations that imply techniques for mitigating greenhouse gas (GHG) emissions from rice cultivation are a challenging and controversial issue. This study was designed to investigate the potential use of mitigation techniques for rice cultivation. Mid-season drainage (MD), using ammonium sulfate instead of urea (AS), and site-specific nutrient management (SSNM) were chosen as mitigation techniques. Data were collected using field surveys and structured questionnaires at the same 156 farms, covering four crop years. The GHG emissions were evaluated based on the concept of the life cycle assessment of the GHG emissions of products. The farmers’ assessments of mitigation techniques, with multiple criteria evaluation, were obtained by face-to-face interviews. Opinions on all mitigation techniques were requested two times covering four years with the same 156 farm owners. The multinomial logistic regression model was used to examine the factors influencing the farmers’ decisions. The results show that SSNM was evaluated as the highest abatement potential (363.52 kgCO2eq ha−1), the negative value of abatement cost (−2565 THB ha−1), and the negative value of the average abatement cost (−14 THB kgCO2eq−1). Among the different techniques, SSNM was perceived as the most suitable one, followed by MD and AS. Highly significant factors influencing decision making consisted of planted area, land size, farmer liability, farmer perception of yield, and GHG emissions. Subsidies or cost-sharing measures to convince farmers to adopt new techniques can enhance their practices, and more support for the development of water systems can increase their availability.
1. Introduction
Rice paddies are considered to be one of the most important sources of anthropogenic emissions of greenhouse gases (GHGs), particularly nitrous oxide (N2O), methane (CH4), and carbon dioxide (CO2) [1] and therefore play an important role in climate change [2,3]. Notably, many studies state that N2O emissions are associated with nitrogen (N) fertilizer application and dry land conditions [4,5], while flooded fields are a significant source of CH4 and contribute little to N2O emissions [6,7,8]. The use of agricultural machines requires the use of fossil fuels, resulting in CO2 emissions. Projected increases in the demand for rice have raised considerable concerns about increasing greenhouse gas (GHG) emissions [9]. Thus, knowledge about trade-offs between rice yield increases and GHG emission reductions is urgently needed for the development of effective mitigation and adaptation strategies.
Considering possible strategies for mitigating GHG emissions from rice cultivation, those having no effect on rice yield would be the best techniques. Methane emissions vary markedly with water management. In particular, mid-season drainage, with the short-term removal of irrigation water, is one of the most promising strategies for reducing CH4 emissions [10,11,12]. Several field measurements indicate that mid-season drainage (MD) significantly reduces CH4 emissions and exerts a positive impact on rice yields by increasing N mineralization in the soil and increasing rice plant root development [13,14,15,16,17]. However, it also increases N2O emissions by creating nearly saturated soil conditions, which promote N2O production [18,19,20]. Fertilizer management has frequently been suggested as a mitigation option by substituting urea as N fertilizer with ammonium sulfate (NH4)2SO4 (inhibits methanogens) and ammonium phosphate (promotes rice plant growth) [21]. Ammonium sulfate has a significant effect on N2O reduction and slightly depresses CH4 production by 10–67% [22], because sulfate-reducing bacteria can outcompete CH4-producing bacteria under these conditions [23]. Moreover, site-specific nutrient management (SSNM) has been suggested as a method to reduce N2O emissions by controlling the use of fertilizers with synchronization and precise farming techniques, using slow-release nutrients (including nitrification inhibitors) [24,25] and avoiding their overuse [26]. Dobermann and Cassman [27] state that an N recovery of over 70% can be achieved for many cereal crops by using intensive site-specific nutrient management, based on the principles of the 4R nutrient stewardship—the right source at the right rate, time, and place [28]. However, the sources of CH4 and N2O from rice fields cannot be reliably identified and discriminated in various areas.
There is an urgent need to quantify the effects and costs of mitigation strategies in rice fields, which, at present, remain difficult to enumerate, and could result as being speculative. A significant problem is that most farmers do not apply these mitigation strategies, for various reasons such as no ownership on farmland [29,30], less education or training on mitigation strategies [30,31], low income and access to credit [30,31,32], or less farming experience [33]. An evaluation method is therefore required that highlights decision factors and provides insight into the balance between environmental impacts, economic productivity, and social acceptance regarding mitigation strategies. Another significant problem is that the decision-making processes in terms of employing mitigation strategies are complicated by financial incentives and because agricultural activities depend on, and have a large impact on, natural resources [34]. These factors indicate the need to better understand decision making by farmers and the barriers inhibiting the adoption of mitigation and adaptation strategies.
Mitigation and adaptation are two basic, but distinctly different responses. Farmers’ attitudes towards these two general responses to tackle changing climate conditions must be understood if scientists, policy makers, and others are to effectively support adaptive and mitigative actions [35,36]. Moreover, integrating mitigation and adaptation are win-win actions because they can mitigate the causes of climate change (mitigation) and adapt to changing climatic conditions (adaptation) [37]. Many studies have investigated farmer behavior and the associated socio-economic characteristics (e.g., [38,39,40]). Until now, mitigation costs caused by improvements in farming practices have rarely been reported, and information on the socio-economic feasibility of these mitigation techniques are still lacking, while their social acceptance and the minimization of their costs have not been discussed at any length. Therefore, the objectives of this study are: (1) to evaluate the GHG emissions of each mitigation technique for rice cultivation; (2) to clarify the farmers’ assessment with multiple criteria evaluation of each mitigation technique; and (3) to examine the factors influencing the farmers’ decisions to use a mitigation technique. The knowledge provided by this study can aid policy makers and other related agencies in their efforts to design and compare mitigation policies and reach mitigation goals.
2. Materials and Methods
2.1. Mitigation Technique Selection
Mitigation techniques were selected based on a literature review and on the recommendations of experts, provided in a report by the Office of Agricultural Economics [41], Ministry of Agriculture and Cooperatives, Thailand. Moreover, we expected that any mitigation techniques suggested to government agencies would be likely to be promoted and supported by the government in the near future. Based on these criteria, mid-season drainage (MD), replacement of urea with ammonium sulfate ((NH4)2SO4) (AS), and site-specific nutrient management (SSNM) were chosen as mitigation techniques for this study.
2.2. Site Selection
Multi-stage sampling was employed for this study as follows. Firstly, at the provincial level, purposive sampling was used, focusing on farmers who have grown rice. They voluntarily participated and provided their information and opinions. Secondly, at the district and sub-district levels, cluster sampling was used to determine two clusters: irrigated areas and rain-fed areas. Moreover, farmers’ average net household incomes (calculated by subtracting expenses from total revenue) for each district and sub-district were set as the criterion, based on the assumption that money is the major factor that can improve their livelihood and is the major factor likely to convince them to change their behavior. The four districts with the highest net incomes (Bang Mun Nak, Taphan Hin, Bueng Na Rang, and Pho Prathap Chang districts) and the four districts with the lowest net incomes (Sam Ngam, Wachira Barami, Wang Sai Phun, and Thap Khlo districts) in Phichit province were selected as samples.
2.3. Data Collection
Data were obtained from participatory observation, in-depth interviews, and a questionnaire survey at the same 156 farms (in irrigated and rain-fed areas of 78 farms, respectively) in four crop years (2012/2013, 2013/2014, 2014/2015 and 2015/2016) to avoid data variation. Data throughout the crop years from each crop, consisting of cultivation practices, agricultural inputs (e.g., fossil fuels, fertilizers, insecticides, herbicides, and water sources), yields, transportation costs, and benefits were collected from the farm owners. Data were also obtained from the record books for the standards for good agricultural practices (GAP) for farm owners, which was disseminated to the farmers by the Department of Agricultural Extension, Ministry of Agriculture and Cooperatives, Thailand.
2.4. Estimation of GHG Emissions
2.4.1. System Boundary and Functional Unit
The concept of the life cycle assessment of the greenhouse gas emissions of products, based on cradle-to-gate, was employed. It is because this approach is widely used for evaluating and comparing the environmental impacts of various products, and also to identify, quantify, and track the sources of GHG emissions throughout production process [42]. System boundary covers raw material production, transport of agricultural inputs (diesel fuel, gasoline fuel, chemical fertilizers, insecticides and herbicides) to the farm, land preparation, planting, harvesting, storing and post-harvest burning of crop residues (Figure 1). The transportation data were considered for two distances: the average distance from the farms to the retailer in the municipality of each sub-district and the average distance from the farms to the retailer in the community of each farm. Burning crop residues in the paddy field were included in this study because it is a common way to eliminate rice residues in Asia, including Thailand [43,44], and GHG emissions from open burning concentrated in the harvest season [45]. It is indicated that emissions from burning crop residues play an important role in the air pollution and climate change [46]. To assess the combined global warming potential (GWP), CH4, and N2O were calculated as CO2 equivalents over a 100-year time scale, using a radiative forcing potential relative to CO2 of 28 for CH4 and 265 for N2O [47]. The functional unit used in assessments was kg CO2eq ha−1 for each technique.
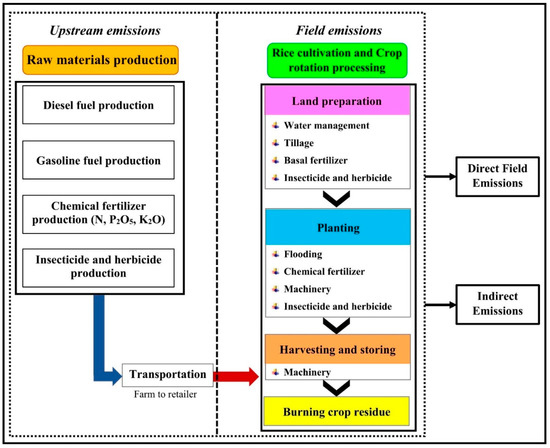
Figure 1.
System boundary from cradle to farm gate of the study (adapted from Arunrat et al. [48]).
2.4.2. Calculation of GHG Emissions
The GHG emissions were calculated for each farm using four scenarios, including the business as usual (BAU) case, and the use of MD, AS, and SSNM techniques. Upstream emissions were accounted for in terms of raw material production and the transportation of agricultural inputs to the farm. Fossil fuels, chemical fertilizers, as well as insecticide and herbicide production were estimated using specific emission factors, as characterized in Ecoinvent 3.2 [49]. Emissions from the transportation of agricultural inputs to the farm were estimated based on diesel fuel consumption, using the emission factors from the National Technical Committee on Product Carbon Footprinting (Thailand) [50]. In some cases, specific emission factors for gasoline or insecticides and herbicides were not available in Ecoinvent 3.2, so country-specific emission factors for Thailand from the National Technical Committee on Product Carbon Footprinting (Thailand) [50] were used instead.
Field CH4 emissions from rice cultivation were used as the model for the calculations, according to the 2006 Intergovernmental Panel on Climate Change (IPCC) Guidelines for National Greenhouse Gas Inventories [51]. The baseline emission factor was taken from Yan et al. [16], who adjusted region-specific emission factors for rice fields in east, southeast, and south Asian countries, and all scaling factors used were derived from the IPCC [51]. Direct and indirect N2O emissions and CO2 emissions from urea applications were also estimated using the methodology proposed by the IPCC [50]. The GHG emission calculations and parameters and emission factors for diesel and gasoline usage in stationary combustion were taken from the IPCC [51]. The GHG emissions from the mobile combustion of diesel fuel by farm tractors and harvesters were estimated from the emission factors of Maciel et al. [52], and GHG emissions from gasoline fuel were estimated following the EPA [53]. Figures for insecticides and herbicides were provided by the emission factors from Lal [54]. Equations, parameters, and emission factors for the calculation of GHG emissions are presented in the Supplementary Material by Arunrat et al. [48].
2.5. Economic Analysis
2.5.1. Estimation of the Costs of Each Technique
The production input of each technique consists of water (W), tillage (T), seed (S), labor (L), fertilizer (F), insecticide (P), herbicide (H), harvest (V), and land rental (R). The total production cost [] for each technique is the sum of production input costs Equation (1).
where i is each technique, C(Q) is the cost of crop production, in Baht ha−1, and CW, CT, CS, CL, CF, CP, CH, CV, and CR are costs of water management, tillage, seed, labor, fertilizer, insecticide, herbicide, harvest, and land rental, in Baht−1 unit, respectively.
In addition, the specific details of the methods used to estimate the costs of each technique are described below.
(1) MD Technique
The cost of the MD technique was calculated by multiplying the quantity of fuel used for pumping water back into the fields, using the fuel price per unit. The cost of this technique was investigated depending on the distance from the fields and the ownership of the water source by dividing the farms into two groups: (1) those far away from water sources (natural sources or irrigation systems at >100 m or >50 m from the fields, respectively); and (2) farms with their own surface pond or artesian well.
(2) AS Technique
The use of ammonium sulfate (21-0-0) instead of urea (46-0-0) requires changes in the quantities of the fertilizers used and their costs. The relevant calculations are as follows: (1) 1 kg of urea contains 0.46 kg N; (2) it takes 2.19 kg of ammonium sulfate to replace 1 kg of urea, providing 0.46 kg of N; (3) the amount of ammonium sulfate used, multiplied by its unit price, is equal to the total cost of the ammonium sulfate used.
(3) SSNM Technique
The cost of the SSNM technique was calculated based on the following steps. Firstly, the amount of each fertilizer to be used was calculated based on the instructions provided by the Land Development Department of Thailand after soil factor analysis. For instance, in the Nong Phra sub-district, Wang Sai Phun district, the soil series is Chiang Rai, suitable for growing photosensitive rice varieties. Suggested fertilizers are 31 kg ha−1 of 46-0-0, 71 kg ha−1 of 16-20-0, and 37 kg ha−1 of 0-0-60, to be applied 7–10 days after sowing or 25–30 days after transplanting, and 31 kg ha−1 of 46-0-0, to be applied again during the early flowering phase. After the suitable amounts of all fertilizers were established, the cost of each fertilizer used was calculated by multiplying the quantity by the price per unit. Finally, the total fertilizer cost of the SSNM technique was compared to the fertilizer cost of the BAU case.
2.5.2. Average Abatement Cost (AAC)
The AAC was used to assess the economic potential for the reduction of GHG emissions in this study; AAC refers to the cost of implementing a technique to reduce GHG emissions to an anticipated level. Similar to the GHG emission estimations, AAC was estimated using four scenarios comprising the BAU case and the use of the MD, AS, and SSNM techniques. The AAC (THB kgCO2eq−1) of each technique was calculated by dividing the total abatement cost (THB ha−1) (TAC) by the total abatement potential (kgCO2eq ha−1) (TAP), and each TAC and TAP were obtained by subtracting the cost under the BAU scenario. Indeed, the reduction of GHG emissions is involved with cropping system, mitigation techniques, and farmers’ behavior. Therefore, ACC was then presented to the farmers of each farm during their assessments on each mitigation technique. This is because ACC can help the farmers to visualize about being environmentally friendly and reducing production costs.
2.6. Farmers’ Assessment and Analysis Tools
After the last crop year (2015/2016) for data collection, the investigation of the farmers’ assessment for each farm was taken place in 2017. A multiple criteria evaluation was developed to assess farmers in the qualitative evaluation of the mitigation techniques. In this study, the criteria applied in the multiple criteria evaluation for farmers’ assessment on the three mitigation techniques were as defined in Table 1, adapted from Webb et al. [55]. To reduce the bias and uncertainty from the farmers’ assessment, the survey was administered via a face-to-face interview in November 2016 and August 2017, with the same 156 farm owners. The farmers were introduced and explained the purposes of the survey. The farmers’ assessment was investigated after calculating the AAC for each scenario and each farm, but the farmers were allowed to choose only one suitable technique to implement. A questionnaire was presented to the farmers to evaluate the rating of each mitigation technique. A four-Likert scale was adopted for the evaluation [56]. The rating scale for the farmers’ assessment was: ‘4′ = very good, ‘3′ = good, ‘2′ = poor, and, ‘1′ = very poor. We used a four-point scale to interpret the farmers’ response because a mid-point is considered as too ambiguous for decision making [57], which was also mentioned in Webb et al. [55]. The scores of each farmer were summed up from the scores of each criterion for the three mitigation techniques. For instance, 78 farmers gave a score of 4 (very good) to the MD technique on the criteria of effectiveness; the total score was 312 (78 × 4). Moreover, the farmers were asked about their needs for policies and incentives to support their farming.

Table 1.
Definitions of the criteria for farmers’ assessment (adapted from Webb et al. [55]).
2.7. Estimating the Determinants of Mitigation Techniques and Socio-Economic Variables
Factors that might influence the farmers’ decision to adopt or reject the mitigation techniques were examined using the multinomial logistic regression (MNL) model. The MNL model is an extension of logistic regression, which is generally effective when the dependent variable is composed of a polytomous category with multiple choices. Explanatory variables included in the MNL model were defined as two types: dichotomous and continuous variables, as detailed below (Table 2). The model was estimated using the following specification:
where is the acceptability of the mitigation technique; AREA is the planted area; EXP is the experience; OWN is the land owner; SIZE is the land size; INC is the farmer´s income; LIB is liability; LABOR is the amount of labor; MEM is the membership of the environment group; PYIELD is the perception of yield; PGHG is the perception of GHG emissions; MEA represents government measures; TRAIN represents attendance at training; DOUB is the double cropping system; TRI is the triple cropping system; and µ is the error term.
Table 2.
Definition and descriptive statistics of variables used in the MNL model.
3. Results and Discussion
3.1. Cost of Rice Production under BAU and Mitigation Techniques
Marked significant differences in costs between irrigated and rain-fed areas were revealed using the t-test (p < 0.05). The average production costs under BAU were 27,521 and 24,240 THB ha−1 for irrigated and rain-fed areas, respectively. Using cost structure analysis, the average variable cost was 22,375 THB ha−1, consisting of an average labor cost of 11,918 THB ha−1 and an average material cost of 10,456 THB ha−1, while the average fixed cost was 4213 THB ha−1. Furthermore, a lack of laborers and water for planting were the outstanding factors increasing the production costs. The average rice yields were 5.58 and 4.58 tons ha−1 for irrigated and rain-fed areas, respectively. The net profit in irrigated areas was higher than that in rain-fed areas, being 34,079 and 32,960 THB ha−1, respectively.
This study found that when implementing the MD technique, the average cost of rice production was 30,100 and 29,662 THB ha−1 for irrigated and rain-fed areas, respectively. Rain-fed areas were associated with higher average production costs than irrigated areas, about 2840 THB ha−1 or double the increase in costs. Comparing the cost of water source distance, farmers who owned their surface pond or artesian well, implementing MD, would face average costs 1946 THB ha−1 higher than those for BAU. Meanwhile, at distances of 100 and 50 m from the water sources, the costs would be 6843 and 5584 THB ha−1, respectively. Consequently, this study reflects that the cost of implementing MD is reduced by 28–35% if farmers own their own surface pond or artesian well for cultivation, while the average cost will be higher with increasing distance to the water source.
To implement the AS technique, the average production costs were 28,985 and 25,998 THB ha−1 for irrigated and rain fed-areas, respectively. An interesting point is that organic farmers following the AS technique can reduce their costs by about 645 and 863 THB ha−1 for irrigated and rain-fed areas, respectively, due to their lower costs for chemical fertilizer application under the BAU case. Therefore, if organic farmers switch from using urea to ammonium sulfate, their average costs will be reduced as well. A cost-benefit analysis showed that organic rice farming could generate higher net profits than conventional farming, of about 437 and 289 THB ha−1 for irrigated and rain-fed areas, respectively. Consequently, to effectively implement the AS technique, organic fertilizer should be applied in combination to further reduce costs and increase net profit while not affecting rice yields.
For SSNM, the average production costs were 26,450 and 23,354 THB ha−1 for irrigated and rain-fed areas, respectively. Following this technique, farmers could achieve reductions in the average production cost compared with BAU of 1068 and 885 THB ha−1 for irrigated and rain-fed areas, respectively. The average production costs in irrigated areas were about 182 THB ha−1 lower than those in rain-fed areas, as lower amounts of chemical fertilizer were applied under BAU conditions.
Comparing the cost of BAU and using mitigation techniques for both irrigated and rain-fed areas, performing SSNM can reduce the average production costs compared with BAU. However, MD and AS resulted in higher production costs than BAU. Overall, the average production costs were higher in irrigated areas than in rain-fed areas. This result reflects that the average production costs are higher when farmers own more land for growing rice, but this higher average cost tends to decrease when farmers adapt their rice cultivation behavior by adopting the option that has lower costs than BAU, without reducing the rice yields.
3.2. GHG Emissions, Abatement Potential, and AAC Under BAU and Mitigation Techniques
The results of estimates of GHG emissions, abatement potential, and AAC between BAU and the different mitigation techniques are presented in Table 3 and Figure 2 and Figure 3. There were highly significant differences in the first and second cultivations between irrigated and rain-fed areas and for each technique. These results reflect the fact that MD is more appropriate for implementation in irrigated rather than rain-fed areas and more appropriate for the second rice cultivation than for the first cultivation. The AS technique led to a higher abatement potential for the second rice cultivation than for the first one. Meanwhile, SSNM generated a 42.6% higher abatement potential for the second rice cultivation than for the first one, with a 9.8% lower AAC for irrigated than rain-fed areas. However, among all techniques, SSNM was the most appropriate one because its AAC was lower than that for BAU, and it had a 60.2 and 58.1% higher abatement potential than MD and AS, respectively.
Table 3.
Average abatement cost (AAC) using different mitigation techniques (Authors own calculation).
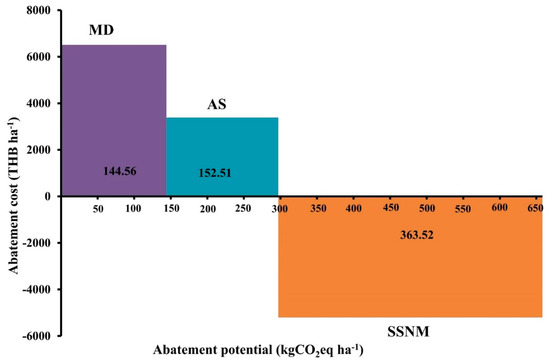
Figure 2.
Comparison between abatement cost and abatement potential for each mitigation technique (Authors own calculation).
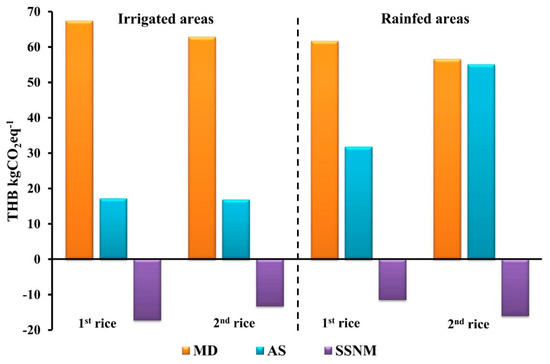
Figure 3.
Average abatement cost (AAC) under BAU and using mitigation techniques (Authors own calculation).
3.3. Farmers’ Assessment on Mitigation Techniques and Barriers
In the survey, farmers were requested to indicate their opinion on all mitigation techniques. Farmers’ assessments across multiple criteria and the total score of each mitigation technique are provided in Table 4. As a result, the SSNM technique was the most favored one and presented the highest score, followed by MD and AS, respectively. The criteria of effectiveness, flexibility, economic efficiency, and institutional compatibility indicated the highest score regarding the SSNM technique. This is in line with Dobermann et al. [58], who reported that the higher benefit for farmers from the implementation of nutrient management strategies can increase the profitability of rice cropping, enhance socio-economic conditions, and mitigate labor shortage. Moreover, efficient nutrient management can also result in environmental benefits through a reduction of chemical fertilizers without a reduction in yield [59]. The criteria “easy to implement” and “ability to trial” were implementing the MD technique because it is easy to drain the water out of the rice field, but farmers need reliable control over irrigation water to implement this technique, otherwise rice yields are impacted. On the other hand, the AS technique obtained the lowest scores for the criteria “economic efficiency”, “easy to implement”, and “institutional compatibility”.
Table 4.
Summary of farmers’ assessment with multiple criteria evaluation of each mitigation technique (Authors own calculation).
The percentage of farmers ranking the mitigation techniques for each criterion, indicating the level of agreement, across the survey is provided in Table 5. The SSNM technique was the technique most favored by the farmers, with 86.5% indicating that they strongly agreed with the highest economic efficiency compared with other mitigation techniques, while only 13.5% of farmers indicated that they strongly agreed that this technique is easy to implement. Indeed, 4.5% of the farmers considered its “ability to trial” as very poor. Similarly, Chinese farmers willing to adopt low-carbon technology when the expenses of required inputs increase less after application [60]. In terms of the MD technique, 50% of the farmers strongly agreed with “effectiveness”, followed by “institutional compatibility” (43.6%), “farmer implementability” (41.7%), and “ability to trial” (40.4%). However, 87.8% and 17.9% of farmers considered “flexibility” as poor and “economic efficiency” as very poor, respectively. Further, 32.1 and 10.9% of farmers evaluating the AS technique selected very good in terms of “flexibility” and “ability to trial”. On the other hand, 71.2% of the farmers considered “economic efficiency” of the AS technique as very poor.
Table 5.
The percentage of farmers showing a score of the level of agreement for each criteria (Authors own calculation).
When the farmers were asked to select one technique, 58.87% of the respondents were willing to implement SSNM, 29.29% AS, and 11.84% MD. Farmers in irrigated areas were most willing to perform SSNM, followed by AS and MD. In contrast, farmers in rain-fed areas were most willing to operate via SSNM, followed by AS, similar to those in irrigated areas, but no farmers were willing to implement MD. As a result, we suggest that state policies should encourage SSNM in both irrigated and rain-fed areas as a practice that can result in lower fertilizer use. However, the relative willingness, beliefs, attitudes, and perceptions concerning such choices are indicators of the future likelihood to adopt a certain practice, which have also been described by McCown [61], Morton [62], and Jones et al. [63].
The reasons for the unwillingness to implement MD were water shortage, fear of increased weeds and pests, worries about nutrient losses, potential declines in rice yield, and a perception of MD being time-consuming, labor-consuming, and requiring more investment. Concerning the AS technique, farmers were worried about lower yields when not using urea, as they believe that urea contributes to greater yields, and there was a lack of knowledge about implementing the use of ammonium sulfate. Farmers unwilling to implement SSNM were concerned about yield decrease and felt that SSNM is time-consuming and complex. They also reported a lack of knowledge to support the use of soil analysis and high expenditures on soil analysis as matters of concern.
3.4. Factors Determining Farmers’ Decisions
The results of the MNL model are presented in Table 6. The variables that were highly significant in the allocation of the farmers’ decisions concerning each mitigation technique were as follows: (i) planted area; (ii) land size; (iii) farmer liability; (iv) farmer’s perception of yield; and (v) farmer’s perception of GHG emissions. Multicollinearity was checked among independent variables. The variance inflation factor (VIF) for all independent variables ranged from 1.108 to 1.265 (VIF < 5), which means that multicollinearity should not be a serious concern in this regression (p < 0.01).
Table 6.
Estimated marginal effects of the farmers’ decision to use the mitigation technique.
In the area studied, a great number of rice fields are located in rain-fed areas. The negative coefficient for rain-fed areas for MD and AS implies that these techniques are considerably less likely to be implemented in rain-fed areas compared with the irrigated areas, or not implemented at all. The reason is that when implementing MD in rain-fed areas, it is difficult to drain water into rice fields after it has been drained out, resulting in higher costs. Similarly, in terms of the AS technique, the farmers felt unaccustomed to the use of ammonium sulfate fertilizers. If adopting AS, farmers face higher costs as more ammonium sulfate fertilizer is required to maintain the same level of nutrients while possibly achieving lower yields. On the other hand, SSNM has a positive and significant influence when implemented, and it is highly likely that farmers will implement this technique.
Land size is an important factor influencing farmers’ decisions in terms of various mitigation techniques. Land size had a negative and significant influence on MD, which probably means that the larger the land, the less likely the farmers are to implement MD. The same is true for AS, which can generate higher production costs in water and chemical fertilizer management. In contrast, farmers who owned more land were interested in SSNM because of its obvious cost savings. However, farmers with large areas of land were also worried about high expenses for soil characteristics analysis.
Of the significant variables, farmer liability had a positive influence favoring SSNM, while having a negative influence towards AS. Therefore, farmers with greater liabilities were interested in low-cost techniques and may reject high-cost techniques.
The effect on rice yield of each mitigation technique was the priority of the farmers. Consequently, farmers’ perception of yield was one of the significant variables influencing their decision making. The results show that farmers’ perception of yield had a positive and significant influence favoring SSNM. It can be inferred that farmers perceived that implementing SSNM could increase their yields, so they decided to use it.
Farmers’ perception of GHG emissions had a negative and significant influence favoring SSNM and AS, meaning that farmers perceived that implementing SSNM and AS techniques would reduce GHG emissions, which was particularly the case for SSNM. Likewise, MD had a negative but non-significant influence, which might be because most farmers still do not have sufficient knowledge about the mitigation potential of each technique. It should be noted that relevant and responsible organizations should encourage and provide knowledge on GHG reduction techniques. Sources of information, including extensions, workshops, and training can enhance the adoption of a certain technology [30]. However, there are several farmers who have less chances for training, probably due to a limitation of time and budget. Therefore, participatory action research should receive more attention both from research-funding organizations and researchers to support collaborations among academicians, local authorities/leaders, and farmers [64]. This would increase the effectiveness of transferring knowledge, the sharing of knowledge and experiences, and could serve as a means to raise awareness about the positive effects of mitigation techniques.
3.5. Prioritizing Incentive Measures for the Adoption of Mitigation Techniques
Understanding farmers’ decision-making behavior regarding their current practices is important and must be based on the knowledge of why farmers reject or accept different techniques [65]. Based on the results of the field survey and the in-depth interviews, three incentive measures were important from the point of the view of farmers: (1) cash incentives from governmental agencies to convince farmers to adapt their practices; (2) assistance for cost reduction—seed support and soil property analysis; and (3) support for water system development for agricultural activities—digging ponds and drilling wells near rice fields. The classification of farmers’ characteristics for prioritizing supporting measures were identified as follows.
3.5.1. Planted Area
Farmers in irrigated areas rated cash incentive measures as the highest priority, while farmers in rain-fed areas were more concerned about supports for water system development.
3.5.2. Land Size
According to land tenure, farmers could be grouped as: (1) small land owners (1.3–6.5 ha); (2) medium land owners (6.6–11.6 ha); and (3) large land owners (11.7–16.8 ha). Medium land owners rated supports for water system development as the highest priority, while small and large land owners rated assistance with cost reduction as their major concern.
3.5.3. Farmer Income
Farmers could be categorized into three groups based on their income: (1) low-income farmers (52,800–128,000 THB year−1 household−1); (2) medium-income farmers (128,001–203,200 THB year−1 household−1); and (3) high-income farmers (203,201–278,400 THB year−1 household−1). Farmers with medium and high incomes rated support for water system development as the first priority, followed by assistance with cost reduction and cash incentive measures. For farmers with low income, cash incentive measures were most important, because this measure had a direct impact on their income and expenses for implementing GHG mitigation techniques.
3.5.4. Farmer Liability
Regarding the levels of liability, there were three groups of farmers: low liability (58,400–538,933 THB household−1), medium liability (538,934–1,019,467 THB household−1), and high liability (1,019,468–1,500,000 THB household−1). Low liability farmers mainly highlighted support for water system development, while medium liability farmers stressed assistance with cost reduction. High liability farmers highly valued cash incentive measures due to their direct and immediate impact on income. Farmers with low or medium liability gave higher priority to investment in their land (seeds, soil property analysis, and water sources).
3.5.5. Number of Laborers in a Household
According to the number of household members, farms were grouped into low-labor households (1–3 persons) and high-labor households (3–5 persons). Low-labor households made seed support a higher priority than high-labor households. This was because most low-labor households conducted their agricultural activities on smaller areas, so seed support and soil property analysis could greatly help to reduce their production costs. High-labor households prioritized support for water system development, because potential improvements in their water systems could allow them to increase their agricultural activities and gain more income.
3.5.6. Cropping System Pattern
Farmers using a double cropping system preferred support for water system measures, followed by cash incentives and assistance for cost reduction measures. This was because although the farmers’ way of making a living in Thailand was based on rice cultivation, these farmers had limited water sources, so they selected crop rotation, which requires less water during the dry season. This could also reduce the cost of water management for agricultural activities. Among farmers using a triple cropping system, assistance for cost reduction measures was the first priority as it reduces the costs of seeds and soil property analysis.
The outstanding point was that cash incentives can be appropriate for low-income farmers or small land owners, who have fewer opportunities to increase their income and need more assistance. These farmers obviously considered subsidies are the priority. Besides, small land owners also placed emphasis on developing their land to be more appropriate for agricultural activities, as their main income relies on their land. On the other hand, high-income farmers and large land owners were aware of other alternatives to increase their income, whether from rice grain or crop rotation. Farmers with medium incomes or medium land owners were more concerned about water system development for agricultural activities than the other groups, because having enough water could lead to greater income and increased crop production efficiency [66]. For farmers with high liabilities, subsidies were of greater concern than for farmers with low or medium liabilities due to their direct and immediate effect on income.
4. Conclusions
Site-specific nutrient management (SSNM) was evaluated as the highest abatement potential (363.52 kgCO2eq ha−1), the negative value of abatement cost (−2565 THB ha−1), and the negative value of the average abatement cost (−14 THB kgCO2eq−1). Based on farmers’ assessment to be a mitigation technique for rice cultivation, SSNM reached the highest score for effectiveness, flexibility, economic efficiency, and institutional compatibility. This indicated that SSNM was obviously preferable and presented the highest scores for farmer acceptability, followed by the replacement of urea with ammonium sulfate ((NH4)2SO4) and mid-season drainage. Irrigation systems, land size, farmers’ liability, and perception of yield and GHG emissions were found as the main factors affecting the farmers’ decision to accept the mitigation techniques. Therefore, incentive measures, such as subsidies or cost-sharing measures can convince farmers to adopt new techniques and enhance their practices. More support of water system development can increase their availability.
Author Contributions
N.A. collected data and preformed life cycle assessment and average abatement cost analyses, wrote, and revised the manuscript. S.S. collected data, analyzed farmers’ assessment, and collaborated in discussion. N.P. provided the discussion and advice to this study.
Acknowledgments
This article was supported by the Thailand Research Fund (TRF) (grant number: TRG 5880123), and National Research Council of Thailand (NRCT) (KO-BO-NGO/2557-68). Furthermore, the author would like to thank the reviewers for their helpful comments to improve the manuscript.
Conflicts of Interest
The authors declare no conflict of interest.
References
- Smith, P.; Martino, D.; Cai, Z. Agriculture. In Climate Change 2007: Mitigation. Contribution of Working Group III to the Fourth Assessment Report of the Intergovernmental Panel on Climate Change; Metz, B., Davidson, O.R., Bosch, P.R., Dave, R., Meyer, L.A., Eds.; Cambridge University Press: Cambridge, UK; New York, NY, USA, 2007; pp. 497–540. [Google Scholar]
- Intergovernmental Panel on Climate Change (IPCC ). The Supplementary Report to IPCC Scientific Assessment; Houghton, J.T., Callander, B.A., Varney, S.K., Eds.; Cambridge University Press: Cambridge, UK, 1992. [Google Scholar]
- IPCC. Climate Change 2007: The Physical Science Basis. Contribution of Working Group I to the Fourth Assessment Report of the Intergovernmental Panel on Climate Change; Solomon, S., Qin, D., Manning, M., Chen, Z., Marquis, M., Averyt, K.B., Tignor, M., Miller, H.L., Eds.; Cambridge University Press: Cambridge, UK; New York, NY, USA, 2007. [Google Scholar]
- Adviento-Borbe, M.A.A.; Haddix, M.L.; Binder, D.L.; Walters, D.T.; Dobermann, A. Soil greenhouse gas fluxes and global warming potential in four high-yielding maize systems. Glob. Chang. Biol. 2007, 13, 1972–1988. [Google Scholar] [CrossRef]
- Zou, J.; Huang, Y.; Zheng, X.; Wang, Y. Quantifying direct N2O emissions in paddy fields during rice growing season in mainland China: Dependence on water regime. Atmos. Environ. 2007, 41, 8030–8042. [Google Scholar] [CrossRef]
- Shang, Q.; Yang, X.; Gao, C.; Wu, P.; Liu, J.; Xu, Y.; Shen, Q.; Zou, J.; Guo, S. Net annual global warming potential and greenhouse gas intensity in Chinese double rice-cropping systems: A 3-year field measurement in long-term fertilizer experiments. Glob. Chang. Biol. 2011, 17, 2196–2210. [Google Scholar] [CrossRef]
- Wang, W.; Dalal, R.; Reeves, S.; Butterbach-Bahl, K.; Kiese, R. Greenhouse gas fluxes from an Australian subtropical cropland under long-term contrasting management regimes. Glob. Chang. Biol. 2011, 17, 3089–3101. [Google Scholar] [CrossRef]
- Yao, Z.; Zheng, X.; Dong, H.; Wang, R.; Mei, B.; Zhu, J. A 3-year record of N2O and CH4 emissions from a sandy loam paddy during rice seasons as affected by different nitrogen application rates. Agric. Ecosyst. Environ. 2012, 152, 1–9. [Google Scholar] [CrossRef]
- Van Groenigen, K.J.; van Kessel, C.; Hungate, B.A. Increased greenhouse-gas intensity of rice production under future atmospheric conditions. Nat. Clim. Chang. 2013, 3, 288–291. [Google Scholar] [CrossRef]
- Yagi, K.; Tsuruta, H.; Minami, K. Possible options for mitigating methane emission from rice cultivation. Nutr. Cycl. Agroecosyst. 1997, 49, 213–220. [Google Scholar] [CrossRef]
- Towprayoon, S.; Smakgahn, K.; Poonkaew, S. Mitigation of methane and nitrous oxide emissions from drained irrigated rice fields. Chemosphere 2005, 59, 1547–1556. [Google Scholar] [CrossRef] [PubMed]
- Nayak, D.; Saetnan, E.; Cheng, K.; Wang, W.; Koslowski, F.; Cheng, Y.-F.; Zhu, W.Y.; Wang, J.-K.; Liu, J.-X.; Moran, D.; et al. Management opportunities to mitigate greenhouse gas emission from Chinese agriculture. Agric. Ecosyst. Environ. 2015, 209, 108–124. [Google Scholar] [CrossRef]
- Cai, Z.; Yan, X.; Yan, G.; Xu, H.; Tsuruta, H.; Yagi, K.; Minami, K. Methane and nitrous oxide emissions from rice paddy fields as affected by nitrogen fertilisers and water management. Plant Soil 1997, 196, 7–14. [Google Scholar] [CrossRef]
- Wassmann, R.; Neue, H.U.; Lantin, R.S.; Makarim, K.; Chareonsilp, N.; Buendia, L.V.; Rennenberg, H. Characterization of methane emissions from rice fields in Asia: II. Differences among irrigation, rainfed, and deepwater rice. Nutr. Cycl. Agroecosyst. 2000, 58, 13–22. [Google Scholar] [CrossRef]
- Lu, W.F.; Chen, W.; Duan, B.W.; Guo, W.M.; Lu, Y.; Lantin, R.S.; Wassmann, R.; Neue, H.U. Methane emissions and mitigation options in irrigated rice fields in southern China. Nutr. Cycl. Agroecosyst. 2000, 58, 65–73. [Google Scholar] [CrossRef]
- Yan, X.; Ohara, T.; Akimoto, H. Development of region-specific emission factors and estimation of methane emission from rice fields in the East, Southeast and South Asian countries. Glob. Chang. Biol. 2003, 9, 237–254. [Google Scholar] [CrossRef]
- Zou, J.; Huang, Y.; Jiang, J.; Zheng, X.; Sass, R.L. A 3-year field measurement of methane and nitrous oxide emissions from rice paddies in China: Effects of water regime, crop residue, and fertilizer application. Glob. Biogeochem. Cycl. 2005, 19, GB2021. [Google Scholar] [CrossRef]
- Zheng, X.H.; Wang, M.X.; Wang, Y.S.; Shen, R.X.; Shangguan, X.J.; Heyer, J.; Kögge, M.; Papen, H.; Jin, J.S.; Li, L.T. CH4 and N2O emissions from rice paddies in southeast China. Chin. J. Atmos. Sci. 1997, 21, 167–174. [Google Scholar]
- Zheng, X.; Wang, M.; Wang, Y.; Shen, R.; Gou, J.; Li, J.; Jin, J.; Li, L. Impacts of soil moisture on nitrous oxide emission from croplands: A case study on the rice-based agro-ecosystem in South-east China. Chemosphere Glob. Chang. Sci. 2000, 2, 207–224. [Google Scholar] [CrossRef]
- Cai, Z.C.; Xing, G.X.; Shen, G.Y.; Xu, H.; Yan, X.Y.; Tsuruta, H. Measurements of CH4 and N2O emissions from rice paddies in Fengqiu, China. Soil Sci. Plant Nutr. 1999, 45, 1–13. [Google Scholar] [CrossRef]
- Towprayoon, S. Greenhouse Gas Mitigation Options from Rice Field. 2004. Available online: https://unfccc.int/files/meetings/workshops/other_meetings/application/vnd.ms-powerpoint/towprayoon.ppt (accessed on 30 June 2014).
- Wassmann, R.; Lantin, R.S.; Neue, H.U.; Buendia, L.V.; Corton, T.M.; Lu, Y. Characterization of methane emissions from rice fields in Asia. III. Mitigation options and future research needs. Nutr. Cycl. Agroecosyst. 2000, 58, 23–36. [Google Scholar] [CrossRef]
- Sela-Adler, M.; Ronen, Z.; Herut, B.; Antler, G.; Vigderovich, H.; Eckert, W.; Sivan, O. Co-existence of Methanogenesis and Sulfate Reduction with Common Substrates in Sulfate-Rich Estuarine Sediments. Front. Microbiol. 2017, 8, 766. [Google Scholar] [CrossRef] [PubMed]
- Akiyama, H.; Yan, X.; Yagi, K. Evaluation of effectiveness of enhanced-efficiency fertilizers as mitigation options for N2O and NO emissions from agricultural soils: Meta-analysis. Glob. Chang. Biol. 2009, 16, 1837–1846. [Google Scholar] [CrossRef]
- Edmeades, D.C. Nitrification and Urease Inhibitors—A Review of the National and International Literature on Their Effects on Nitrate Leaching, Greenhouse Gas Emissions and Ammonia Volatilisation from Temperate Legume-Based Pastoral Systems; Technical Report 2004/22; Environment Waikato: Hamilton, New Zealand, 2004. [Google Scholar]
- Xiang, Y.; Jin, J.Y.; Ping, H.E.; Liang, M.Z. Recent advances on the technologies to increase fertilizer use efficiency. Agric. Sci. China 2008, 7, 469–479. [Google Scholar]
- Dobermann, A.; Cassman, K.G. Plant nutrient management for enhanced productivity in intensive grain production systems of the United States and Asia. Plant Soil 2002, 247, 153–175. [Google Scholar] [CrossRef]
- Bruulsema, T.W.; Witt, C.; Garcia, F.; Li, S.; Rao, T.N.; Chen, F.; Ivanova, S. A global framework for fertilizer BMPs. Better Crops 2008, 92, 13–15. [Google Scholar]
- Iheke, O.R.; Echebiri, R.N. Rural Land tenancy and Resource Use Efficiency of cassava farmer in South Eastern Nigeria. J. Food Fibre Prod. 2010, 3, 455–465. [Google Scholar]
- Arunrat, N.; Wang, C.; Pumijumnong, N.; Sereenonchai, S.; Cai, W. Farmers’ intention and decision to adapt to climate change: A case study in the Yom and Nan basins, Phichit province of Thailand. J. Clean. Prod. 2017, 143, 672–685. [Google Scholar] [CrossRef]
- Sani, S.; Chalchisa, T. Farmers’ Perception, Impact and Adaptation Strategies to Climate Change among Smallholder Farmers in Sub-Saharan Africa: A Systematic Review. J. Ressour. Dev. Manag. 2016, 26, 1–8. [Google Scholar]
- Krause, M.A.; Deuson, R.R.; Baker, T.G.; Preckel, P.V.; Lowenberg-DeBoer, J.; Reddy, K.C.; Maliki, K. Risk-Sharing Versus Low-cost Credit Systems for International Development. Am. J. Econ. 1990, 72, 911–922. [Google Scholar] [CrossRef]
- Tazeze, A.; Haji, J.; Ketema, M. Climate Change Adaptation Strategies of Smallholder Farmers: The Case of Babilie District, East Harerghe Zone of Oromia Regional State of Ethiopia. J. Econ. Sustain. Dev. 2012, 3, 1–13. [Google Scholar]
- Sasaki, H. Farmer Behaviour, Agricultural Management and Climate Change. Available online: http://www20.iadb.org/intal/catalogo/pe/2012/09774.pdf (accessed on 18 June 2016).
- Howden, S.M.; Soussana, J.F.; Tubiello, F.N.; Chhetri, N.; Dunlop, M.; Meinke, H. Adapting Agriculture to Climate Change. Proc. Natl. Acad. Sci. USA 2007, 104, 19691–19696. [Google Scholar] [CrossRef] [PubMed]
- McCarl, B.A. Analysis of climate change implications for agriculture and forestry: An interdisciplinary effort. Clim. Chang. 2010, 100, 119–124. [Google Scholar] [CrossRef]
- Grafakos, S.; Pacteau, C.; Delgado, M.; Landauer, M.; Lucon, O.; Driscoll, P.; Wilk, D.; Zambrano, C.; O’Donoghue, S.H.; Roberts, D. Integrating Mitigation and Adaptation as Win-Win Actions. In Climate Change and Cities: Second Assessment Report of the Urban Climate Change Research Network. Summary for City Leaders, Chapter: 4, Publisher: Urban Climate Change Research Network (UCCRN); Rosenzweig, C.W., Solecki, P., Romero-Lankao, S., Mehrotra, S., Dhakal, T., Bowman, S., Ibrahim, A., Eds.; Columbia University: New York, NY, USA, 2015; Volume 6, pp. 1–24. [Google Scholar]
- Vanslembrouck, I.; Van Huylenbroeck, G.; Verbeke, W. Determinants of the Willingness of Belgian Farmers to Participate in Agri-environmental Measures. J. Agric. Econ. 2002, 53, 489–511. [Google Scholar] [CrossRef]
- Maddison, D. The Perception and Adaptation to Climate Change in Africa; CEEPA Discussion Paper No. 10; Centre for Environmental Economics and Policy in Africa; University of Pretoria: Pretoria, South Africa, 2006. [Google Scholar]
- Ahnstrom, J.; Francis, C.; Hockert, J.; Skelton, P.; Bergea, H.; Hallgren, L. Farmers and nature conservation: What is known about attitudes, context factors and actions affecting conservation? Renew. Agric. Food Syst. 2009, 24, 38–47. [Google Scholar] [CrossRef]
- OAE (Office of Agricultural Economics). Mitigation Abatement Cost of Greenhouse Gases from Rice Production; Ministry of Natural Resources and Environment: Bangkok, Thailand, 2012; 355p. (In Thai) [Google Scholar]
- Lattanzio, R.K. Life-Cycle Greenhouse Gas Assessment of Coal and Natural Gas in the Power Sector; Congressional Research Service: Washington, DC, USA, 2015. [Google Scholar]
- Gadde, B.; Bonnet, S.; Menke, C.; Garivait, S. Air pollutant emissions from rice straw open field burning in India, Thailand and the Philippines. Environ. Pollut. 2009, 157, 1554–1558. [Google Scholar] [CrossRef] [PubMed]
- Kanokkanjana, K.; Cheewaphongphan, P.; Garivait, S. Black Carbon Emission from Paddy Field Open Burning in Thailand. In Proceedings of the 2011 2nd International Conference on Environmental Science and Technology, IPCBEE (6), Singapore, 26–28 February 2011; IACSIT Press: Singapore, 2011. [Google Scholar]
- Niu, H.; Cheng, W.; Hu, W.; Pian, W. Characteristics of individual particles in a severe short-period haze episode induced by biomass burning in Beijing. Atmos. Pollut. Res. 2016, 7, 1072–1081. [Google Scholar] [CrossRef]
- Zhang, X.; Lu, Y.; Wang, Q.; Qian, X. A high-resolution inventory of air pollutant emissions from crop residue burning in China. Atmos. Chem. Phys. Discuss 2018. [Google Scholar] [CrossRef]
- IPCC. The Physical Science Basis: Working Group I Contribution to the Fifth Assessment Report of the Intergovernmental Panel on Climate Change; Cambridge University Press: Cambridge, UK; New York, NY, USA, 2013. [Google Scholar]
- Arunrat, N.; Wang, C.; Pumijumnong, N. Alternative cropping systems for greenhouse gases mitigation in rice field: A case study in Phichit province of Thailand. J. Clean. Prod. 2016, 133, 657–671. [Google Scholar] [CrossRef]
- Ecoinvent Centre. Ecoinvent Database, version 3.2; Swiss Centre for Life Cycle Inventories: Duebendorf, Switzerland, 2005. Available online: http://www.ecoinvent.org/ (accessed on 25 August 2016).
- The National Technical Committee on Product Carbon Footprinting. The National Guideline on Product Carbon Footprint, 3rd ed.; Amarin Publishing: Bangkok, Thailand, 2011. [Google Scholar]
- IPCC. Agriculture, forestry and other land use. In 2006 IPCC Guidelines for National Greenhouse Gas Inventories; Eggleston, H.S., Buendia, L., Miwa, K., Ngara, T., Tanabe, K., Eds.; Institute for Global Environmental Strategies (IGES): Hayama, Japan, 2006; Volume 4. [Google Scholar]
- Maciel, V.G.; Zortea, R.B.; Silva da, W.M.; Cybis, L.F.A.; Einloft, S.; Seferin, M. Life Cycle Inventory for the agricultural stages of soybean production in the state of Rio Grande do Sul, Brazil. J. Clean. Prod. 2015, 93, 65–74. [Google Scholar] [CrossRef]
- EPA. Emission Factors for Greenhouse Gas Inventories; United States Environmental Protection Agency: Washington, DC, USA, 2014. Available online: https://www.epa.gov/sites/production/files/2015-07/documents/emission-factors_2014.pdf (accessed on 17 February 2016).
- Lal, R. Carbon emission from farm operations. Environ. Int. 2004, 30, 981–990. [Google Scholar] [CrossRef] [PubMed]
- Webb, N.P.; Stokes, C.J.; Marshall, N.A. Integrating biophysical and socio-economic evaluations to improve the efficacy of adaptation assessments for agriculture. Glob. Environ. Chang. 2013, 23, 1164–1177. [Google Scholar] [CrossRef]
- Likert, R. A technique for the measurement of attitudes. Arch. Psychol. 1931, 22, 1–55. [Google Scholar]
- Marshall, N.A. Understanding social resilience to climate variability in primary enterprises and industries. Glob. Environ. Chang. 2010, 20, 36–43. [Google Scholar] [CrossRef]
- Dobermann, A.C.; Witt, D.; Dawe, S.; Abdulrachman, H.C.; Gines, R.; Nagarajan, S.; Satawathananont, T.T.; Son, P.S.; Tan, G.H.; Wang, N.V.; et al. Adviento Site-specific nutrient management for intensive rice cropping systems in Asia. Field Crops Res. 2002, 74, 37–66. [Google Scholar] [CrossRef]
- Wang, G.H.; Dobermann, C.; Witt, Q.; Sun, Q.Z.; Fu, R.X. Performance of site-specific nutrient management for irrigated rice in Southeast China. Agron. J. 2001, 93, 869–878. [Google Scholar] [CrossRef]
- Zhu, H.J.; Tian, Z.H. Analysis on the rice farmer’s willingness to use low-carbon technologies measures: Based on the survey of the rice-producing areas in Southern China. J. Agric. Econ. 2013, 215, 62–71. [Google Scholar]
- McCown, R.L. New thinking about farmer decision makers. In The Farmer’s Decision; Hatfield, J.L., Ed.; Soil and Water Conservation Society: Ankeny, Lowa, 2005; pp. 11–44. [Google Scholar]
- Morton, L.W. Citizen involvement. In Pathways for Getting to Better Water Quality: The Citizen Effect; Morton, L.W., Brown, S.S., Eds.; Springer: New York, NY, USA, 2011. [Google Scholar]
- Jones, A.K.; Jones, D.; Edwards-Jones, G.; Cross, P. Informing decision making in agricultural greenhouse gas mitigation policy: A Best–Worst Scaling survey of expert and farmer opinion in the sheep industry. Environ. Sci. Policy 2013, 29, 46–56. [Google Scholar] [CrossRef]
- Abebaw, D.; Belay, K. Factors influencing adoption of high yielding maize varieties in South-western Ethiopia. An application of logit. Q. J. Int. Agric. 2001, 40, 149–167. [Google Scholar]
- Nowak, P. Why farmers adopt production technology. J. Soil Water Conserv. 1992, 47, 14–16. [Google Scholar]
- Richard, T.; Shively, E.G. Technical Change and Productive Efficiency: Irrigated Rice in the Philippines. Asian Econ. J. 2007, 21, 155–168. [Google Scholar]
© 2018 by the authors. Licensee MDPI, Basel, Switzerland. This article is an open access article distributed under the terms and conditions of the Creative Commons Attribution (CC BY) license (http://creativecommons.org/licenses/by/4.0/).