Abstract
This study investigates the future climatic impacts of different percentages of trees/shrubs, C4 and C3 plant functional types (PFTs) over the West Africa region. The ratio of co-existence among the different PFTs was done as a representation of agri-silviculture practices over the region. Nine sensitivity experiments of different percentages of trees/shrubs, and C4 and C3 PFTs were carried out with a regional climate model (RegCM4) driven by Global Climate Model (HADGEM2-ES) outputs. These experiments were carried out along the Guinea Savana zone of West Africa using both prescribed and dynamic vegetation options of the model. The model simulated the seasonal evolution of precipitation and temperature fields quite well, with correlations greater than 0.8, but exhibited cold and wet biases of about 1–2 °C and 1–4 mm/day, respectively. Widespread warming (1–3 °C) and drying (1–2 mm/day) is projected in the near future across most parts of West Africa all year round. The West African future climate change associated with the different percentages of trees/shrubs, and C4 and C3 PFTs varied with the vegetation state (prescribed or dynamic) and model domain sizes. The prescribed vegetation experiments induced cooling of about 0.5–2 °C in most areas along the designated agri-silviculture zone, except Liberia and Sierra Leone. Similarly, enhanced precipitation occurred over most parts of Ghana and coastal parts of Nigeria (0.5–3 mm/day). On the other hand, the dynamic vegetation option did not exhibit pronounced changes in temperature and precipitation, except with a larger domain size. This study suggests the implementation of agri-silviculture as a mitigation and adaptation land-use practice across West Africa if drought-tolerant crops and the deciduous trees are adopted.
1. Introduction
African forests constitute only 16% of the world’s total, but the rate of deforestation in Africa is more than six times the world’s average [1]. Increasing rates of deforestation and land degradation in the West Africa region has contributed immensely to the increase in atmospheric concentration of greenhouse gases and food insecurity in the region. The need to address the challenges of food insecurity and a failing economy in the region necessitates conversion of forests to agricultural lands for large-scale farming or for a developmental purpose, such as urbanization. The Food and Agricultural Organization (FAO) estimates the percentage of forest cover in African land areas to be 23% [1]. Between 1990 and 2010, there was approximately a 10% conversion of these land areas to other uses, such as for agricultural purposes, wood fuel, and building and construction [1]. The conversion of forests to agricultural lands for large-scale farming or developmental purposes, such as urbanization, is most pronounced in this region. Most recent global estimates of carbon emissions from deforestation suggest a decrease of over 25% for the period 2001–2010, compared to 2011–2015 [2]. However, the decline in deforestation corresponds to the deliberate large-scale tree plantation across the globe. For instance, a minimum of 10% tree cover was reported in more than a billion hectares of agricultural lands across sub-Saharan Africa, South East Asia, and South America [3], while approximately 15% of farmlands in sub-Saharan Africa have at least 30% tree cover [4]. Agroforestry is the intentional integration of trees/shrubs, crops, livestock, and pastures on the same piece of land [5,6]. It is recommended for its lower cost of carbon sequestration relative to pure forestation [7]. However, agri-silviculture—a branch of agroforestry—on the other hand, strictly involves the integration of trees and crops simultaneously on the same piece of land. Agri-silviculture practices in the semi-arid and sub-humid zones of West Africa are important as a buffer against the impacts of climate change [7,8]. This practice provides a wide range of environmental and economic benefits, such as improved micro-climate; increased crop yield; improved source of livelihood for farmers, landowners, and society at large; enhanced resilience during mid-season droughts; and decreased deforestation rates through a reduction in the demand and pressure on forested land [7,9,10,11,12,13,14]. Despite all the knowledge on the environmental and socio-economic benefits of agroforestry at the local scale, there are little to no studies providing information on its impact on the future climate at the regional or global scale.
Approximately over a decade ago, the United Nations Framework Convention on Climate Change (UNFCCC) adopted agroforestry as a climate change mitigation option under afforestation and reforestation activities [15]. The increasing areas of the world under agroforestry are expected to influence the flux and long-term storage of carbon in the atmosphere and living biomass [16,17]. Current understanding of the impact of agroforestry on the future climate at the regional and global scale is limited. However, investigating the effects of agri-silviculture (another form of modification to the vegetation structure), on the regional or global climate through field experiments is difficult, expensive, and unattainable. Hence, a numerical investigation could potentially provide a low-cost option to decision-makers with regard to land use planning under a changing climate. For instance, large-scale numerical reforestation experiments over West Africa [18,19], United States of America [20], Hungary [21], and other mid-latitude regions [22] have suggested induced cooling and enhanced precipitation over the reforested zones, but drying and warming outside these zones. In Africa, the climate is highly sensitive to changes in local processes, and most especially land use and land cover. Also, there are various studies which established a direct link between changes in land cover and decline in precipitation over the Sahel and Savannah regions of Africa (e.g., [23,24,25,26,27,28,29]. The changes in vegetation structure could potentially modify the climate and hydrological processes over West Africa [30,31].)
In this study, the impact of agri-silviculture on the future climate of West Africa is examined using different percentages of trees/shrubs. The C3 and C4 plant functional types (PFTs) provide cover along the Guinea Savanna zone of West Africa. C3 and C4 species are PFTs referring to the different pathways used by plants to capture carbon dioxide during photosynthesis. Most annual crops in West Africa are either C3 or C4 plants, while about 50% of the C4 species belongs to the grass family [32]. For instance, maize, sugarcane, sorghum, millets, and tropical pasture grasses are C4 plants, while beans, rice, wheat, fruit trees, nut trees, and potatoes are C3 plants. The integration of specific crops is outside the scope of this study since it requires a different land surface scheme [33,34]. However, the second C3 grass in the Community Land Model surface scheme is considered an unmanaged crop [34]. Previous studies examined the feedback effect of vegetation on the West African climate [30,35,36]. According to Wang et al. [36] climate simulations are sensitive to differences in vegetation mode (i.e., prescribed or simulated by the model). The response of vegetation to climate and anthropogenic forcing could influence the future climate over West Africa at a rate equal to or higher in magnitude relative to the radiative forcing from atmospheric CO2 [35]. To understand the impact of the various percentages of tree/shrub C3 and C4 PFTs cover on the future climate of West Africa, a regional climate model with prescribed and dynamic vegetation (i.e., the plant PFTs are simulated by the model) options in its land surface scheme is utilized. Therefore, the study attempts to: (i) evaluate the performance of the model (RegCM4) in the representation of surface and atmospheric processes over West Africa; and (ii) project the future climate change over West Africa with and without the agri-silviculture numerically designed experiments.
2. Model, Data, and Methods
2.1. RegCM4.4-CLM4.5 Model Description
The Abdus Salam International Centre for Theoretical Physics Regional Climate Model version 4.4 (RegCM4.4) is a hydrostatic model with dynamic characteristics and different physics options. RegCM4.4 has demonstrated robust capability in the simulation of the mean climate over different regions [37,38,39,40], and is therefore useful for climate projections and paleoclimate studies. The model has 18 vertical sigma levels extending from the surface to 50 hPa level, and provides different options for cumulus convection parameterizations and land surface schemes. A detailed description of the model is presented in References [41,42]. However, the Emmanuel scheme [43] and the Grell convective scheme [44] were adopted based on their suitability in the simulation of tropical convection [41,45]. RegCM4.4 was synchronously coupled to the National Center for Atmospheric Research Community Land Model version 4.5 (CLM4.5) in this study based on its capability to either simulate vegetation as prescribed (time-invariant; [46]) or dynamic [47]. In the dynamic vegetation option, carbon and nitrogen cycles, plant phenology and mortality, leaf area index, stem area index, and vegetation height are simulated. Similarly, the percentage cover of the different PFTs is simulated at annual time steps, according to specified bio-climatic rules (Table 1). In the CLM4.5 scheme, there are five different land unit types, 15 soil layers, five snow layers, and 16 different PFTs, which represent land surface heterogeneity [34]. The PFTs’ sub-grid level accounts for biogeophysical and biogeochemical differences between broad categories of PFTs. The percentage cover for the prescribed PFTs are derived from Moderate Resolution Imaging Spectroradiometer (MODIS) satellite data, as described in Lawrence et al. [48]. If dynamic vegetation is enabled, the establishment of new PFTs depends on the bioclimatic rules for each PFT, regarding the warmest minimum monthly air temperature and minimum growing days [34]. Also, a minimum precipitation of 100 mm/year is required for the existence of new PFTs, while survival is associated with the coldest minimum monthly air temperature threshold for specific PFTs. In this study, the numerically designed sensitivity to land cover changes for agri-silviculture experiments were carried out using two African domain sizes in a cartographic projection of Normal Mercator. The first domain (Figure 1a) extends from 35° S–35° N and 45° W–40° E, while the more extensive domain (Figure 1b) extends from 45° S–45° N and 42° W–70° E. The more extensive domain size conforms to the Coordinated Regional Climate Downscaling Experiment (CORDEX) recommended domain for Africa [49]. It is known that regional climate models are sensitive to domain sizes [50,51]. Hence, the choice of two domains to examine the sensitivity of the dynamic vegetation simulations to different domain sizes. The model configurations are summarized in Table 2.

Table 1.
Bioclimatic requirements for PFTs in dynamic vegetation simulation *. Coldest minimum monthly air temperature for the survival of previously established PFTs (Tc min); warmest minimum monthly air temperature for the establishment of new PFTs (Tc Max); minimum annual growing degree days above 5 °C for the establishment of new PFTs (GDD min).
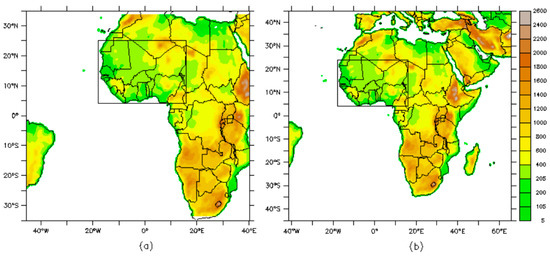
Figure 1.
Topography in meters for the (a) smaller Africa domain and (b) larger CORDEX Africa domain. The rectangular box indicates the region of interest in West Africa.
Table 2.
Summary of model configurations used in this study.
2.2. Data
Six hourly initial and lateral boundary conditions (e.g., air temperature, humidity, zonal wind, meridional wind, geopotential height, and surface pressure) for RegCM4.4 were obtained from the Met Office Hadley Centre for Global Environmental Model version 2 Earth System configuration (HadGem2-ES; https://verc.enes.org/models/earthsystem-models/metoffice-hadley-centre/hadgem2-es; Martin et al., 2011). Monthly output of Sea Surface Temperature (SST) from HadGem2-ES experiments provides the oceanic forcing for RegCM4.4. The boundary conditions dataset from HadGem2-ES spans the period from 1979–2004 and from 2029–2054 for both the historical and Representative Concentration Pathways 4.5 (RCP4.5) scenarios. HadGem2-ES is one of the models used in the Intergovernmental Panel on Climate Change (IPCC) Fifth Assessment Report (AR5) and the Fifth Phase of the Coupled Model Inter-comparison Project (CMIP5; https://www.ipcc.ch/report/ar5/wg1/). It is an atmospheric ocean global climate model (AOGCM), which has an atmospheric resolution of 1.875° × 1.25° and 38 vertical levels, while the ocean resolution is 1° (increasing to 1/3°) at the equator and 40 vertical levels. The model represents the interaction between land and ocean carbon cycles and dynamic vegetation, with an option to prescribe either atmospheric CO2 concentrations or prescribe anthropogenic CO2 emissions, and simulate CO2 concentrations. The components included in HadGem2-ES configuration are the atmosphere, land surface and hydrology, aerosols, ocean and sea ice, terrestrial carbon cycle, atmospheric chemistry, and ocean biogeochemistry.
Monthly gridded (0.5° × 0.5°) observational data of 2-m surface temperature and precipitation were obtained from the Climate Research Unit (CRU) [53]. The atmospheric data (i.e., zonal, meridional, and vertical winds) were obtained from the European Center for Medium-Range Weather Forecast (ECMWF) gridded (0.5° × 0.5°) ERA-interim reanalysis (hereafter refer to as ERAIN) [54].
2.3. Methods
2.3.1. Experimental Design with RegCM4.4
In this study, nine numerically designed experiments were conducted with the RegCM4.4 model. The first six experiments, designated as PRES, PRESd1, FUTU, FUTUd1, GUSAG, and GUSAGd1, were carried out in a smaller Africa domain (Figure 1a), while the last three experiments PRESd2, FUTUd2, and GUSAGd2 were integrated over the larger domain in Figure 1b. The different domain sizes are expected to give further information on how domain size will influence the simulated different percentages of tree/shrub C3 and C4 PFTs in each of the nine experiments. PRES, FUTU, and GUSAG experiments incorporate prescribed PFTs in the CLM4.5 land surface scheme (Figure 2a,g), while PFTs are simulated in PRESd1, PRESd2, FUTUd1, FUTUd2, GUSAGd1, and GUSAGd2 according to the bioclimatic limits in Table 1. The historical climate (i.e., 1979–2004) was simulated and denoted as PRES, PRESd1, and PRESd2. Similarly, the FUTU, FUTUd1, and FUTUd2 represent the near future climate (i.e., 2029–2054) under the RCP4.5 scenario, while GUSAG, GUSAGd1, and GUSAGd2 experiments investigate the impact of agri-silviculture on the future climate of West Africa along the Guinea Savanna zone. The deciduous trees used in GUSAG, GUSAGd1, and GUSAGd2 experiments are expected to decrease competition with crops, increase water use efficiency and enhanced streamflow in comparison to evergreens [55]. On the other hand, future warming might favor the expansion of C4 species [56], but the increased concentration of atmospheric CO2 would enhance the growth of C3 species [57]. The first years of all the simulation experiments were discarded to avoid the problem of initial conditions, while the results of the last 25 years (1980–2004 and 2030–2054) were analyzed.
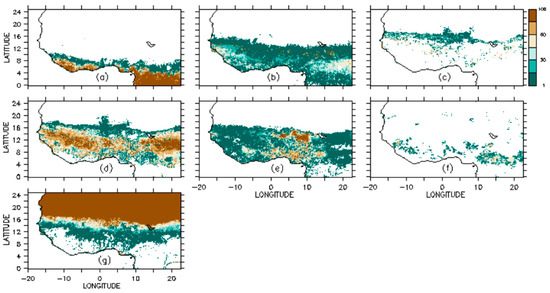
Figure 2.
Percentage cover of the prescribed Plant Functional Types (PFTs) over West Africa in the Community Land Model version 4.5 (CLM4.5). (a) Tropical broadleaf evergreen tree; (b) tropical broadleaf deciduous tree; (c) temperate broadleaf deciduous shrub; (d) C4 grass; (e) C3 arctic grass; (f) C3 grass; and (g) bare soil.
Figure 3a,f give an overview of the percentages covers of the modified PFTs in the simulated agri-silviculture experiments along the West Africa Guinea Savannah zone relative to the model’s default PFTs in this zone. However, the establishment or survival of a given PFT in the dynamic vegetation experiments (i.e., GUSAG, GUSAGd1, and GUSAGd2) depends on the bioclimatic limit specified in the model (Table 1). Table 3 summarizes the distinct characteristics of each of the nine experiments in this study.
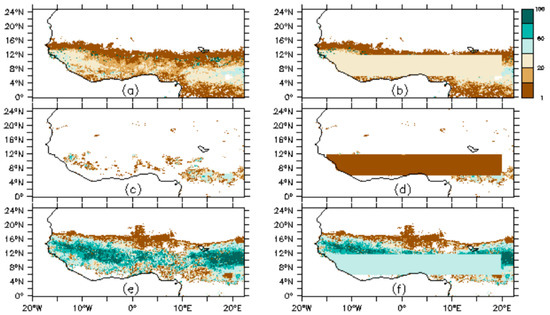
Figure 3.
Comparison between the model’s default and the modified percentage cover of broadleaf deciduous trees (a,b); C3 grass (c,d); and C4 grass (e,f) in GUSAG, GUSAGd1, and GUSAGd2 experiments.
Table 3.
Summary of RegCM4.4 numerical experimental set-ups.
2.3.2. Assessment of Model Performance
The capability of the model to simulate other circulation features of the West Africa monsoon system, such as the Inter-Tropical Convergence Zone (ITCZ), African Easterly Jet (AEJ), and Tropical Easterly Jet (TEJ) was investigated. The continental ITCZ is often referred to as the Inter-Tropical Discontinuity (ITD) [58], and its surface position was determined using the location of zero meridional wind. Similarly, AEJ and TEJ were located using the position of maximum westerly and zonal winds at 700 hPa and 200 hPa, respectively [18,58]. These three features of the West Africa monsoon contribute to the seasonal distribution and amount of rainfall over the region.
The evaluation of RegCM4.4 climate simulations was done using statistical metrics expressed in Equations (1)–(3), including pattern correlation coefficient (PCC), spatial root mean square difference (RMSD), and mean bias (MB). MB is the difference between the area-averaged value of the simulation and the observation. RMSD and PCC provided information at the grid-point level, while the MB did so at the regional level. Pattern correlation coefficient and RMSD gave information on the degree to which the model was able to reproduce the observed variable.
where is the number of grid points, is the value of the variable to the grid point of observation, is the value of the variable to the grid point of model simulations, and are the mean values, and and are the standard deviation values.
3. Results and Discussion
The performance of RegCM4 in the simulation of West Africa climate using both prescribed and dynamic vegetation options was examined for the period 1980–2004. Thus, the simulated precipitation, temperature, and winds are compared with observed and reanalysis data on a spatiotemporal scale. Similarly, the performance of the model in the representation of continental ITCZ, AEJ, and TEJ was also analyzed.
3.1. RegCM4 Model Validation
The time-latitude cross-section of temperature and precipitation average over the West Africa region between 15° E and 15° W for CRU observations, and the three RegCM4.4 simulations of historical climate are presented in Figure 4. The model, irrespective of the domain size or vegetation state (i.e., prescribed or dynamic) reproduced reasonably well the latitudinal distribution of temperature over West Africa. The peak position of the continental ITCZ over areas of maximum temperature in June and July was fully captured in PRES, PRESd1, and PRESd2 simulations. According to Reference [59], West Africa monsoon precipitation exhibits three distinct phases identified as the onset, peak, and cessation periods. The CRU observations of the historical climate identified the commencement of the onset period in April, and a vertical northward displacement of peak periods from 5° N in May/June to 8° N in August/September. Afterward, the cessation period commenced in October, with a southward retreat of the rain belt. However, the model’s historical simulations identified the onset period by a lag of 7–8 weeks in May/June, and did not capture the northward jump in the monsoon precipitation. The model’s delay in capturing the onset dates also correspond to its inability in the representation of the abrupt shift in precipitation observed from 5° N to 8° N. The spatiotemporal distribution of temperature, precipitation, and wind in PRES, PRESd1, and PRESd2 experiments were compared to observation and reanalysis data (Figure 5a,b). The simulated minimum temperature along the West African coast and maximum precipitation over the orographic region of the Guinea Highlands, Jos Plateau, and Cameroun Mountains during the peak of the monsoon from June to August (JJA), are in good agreement with observation data. Similarly, the transportation of cold, moist, south-westerly winds from the ocean to about 18° N during the peak of the monsoon, as well as the intensification of north-easterly dry winds during winter, was adequately captured in the model.
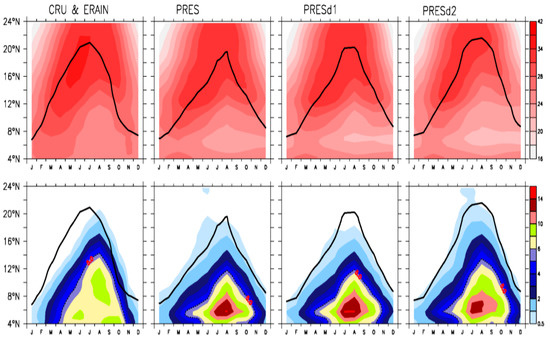
Figure 4.
Time-latitude cross section of surface (2 m) temperature (°C; upper row) and precipitation (mm/day; bottom row), averaged between 15° E to 15° W for the years (1980–2004) over West Africa as observed in the Climate Research Unit (CRU) and ERAIN (first column) and simulated (prescribed vegetation, second column; dynamic vegetation in smaller Africa domain, third column; dynamic vegetation in CORDEX domain, fourth column). The corresponding surface position of the continental Inter-Tropical Convergence Zone (ITCZ) in ERAIN and the model simulations are represented by thick continuous lines, while thin dashed lines indicate the onset of monsoon precipitation by an isohyet of 5 mm/day.
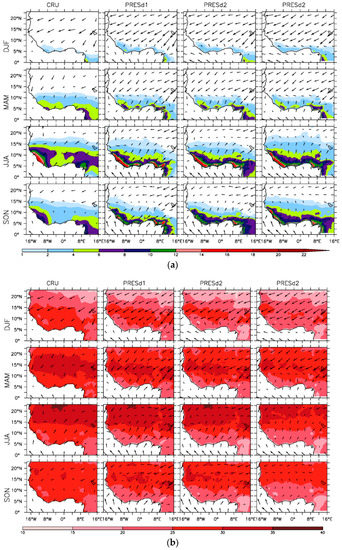
Figure 5.
(a) Spatial distribution of mean seasonal precipitation (mm/day) and 925 hPa wind (m/s) averaged for the years 1980–2004. First column: CRU and Era-Interim wind; Second column: Prescribed vegetation simulation; Third column: Dynamic vegetation simulation in a smaller Africa domain; Fourth column: Dynamic vegetation simulation in CORDEX Africa domain. (b) Spatial distribution of mean seasonal surface temperature (°C) and 925 hPa wind (m/s) averaged for the period 1980–2004. First column: CRU and Era-Interim wind; Second column: Prescribed vegetation simulation; Third column: Dynamic vegetation simulation in a smaller Africa domain; Fourth column: Dynamic vegetation simulation in CORDEX Africa domain.
Each of the three historical climate simulations exhibits a varying degree of cold and warm biases of about 2 °C with an associated wet and dry biases of 2–4 mm/day along the coasts and over the continent (Figure 6a,b). For instance, in the PRES experiment, the most pronounced range of warm biases (2–4 °C) occurred south of 14° N, within 10° E and 20° E, but these biases were reduced to 1 °C in PRESd1 (Figure 6a). It is worthy of note that the difference between the PRES and PRESd1 experimental set-ups was only the activation of dynamic vegetation in PRESd1, which was prescribed in PRES. The differences in domain sizes of PRESd1 and PRESd2 changed the magnitude of the tree and C4 grass abundance in both experiments at the end of the historical climate period of study (Figure 7). The PRESd1 experiment simulated a 40–90% increase in the abundance of broadleaf evergreen trees along the West African coast. In contrast, PRESd2 increased the abundance of broadleaf deciduous trees along the coast, while there was no change in the abundance of evergreen trees. Similarly, a sporadic increase of up to 90% in C4 species abundance was simulated inland in the PRESd2 experiment, but PRESd1 showed a homogeneous increase of 40%. These changes may be associated with the differences in the identified biases from the two dynamic vegetation simulations. PRESd2 introduced the highest magnitude of cold biases among the three historical climate simulations over most parts of West Africa, but PRES and PRESd1 underestimated temperature along the coast, orographic region, and north of 18° N.
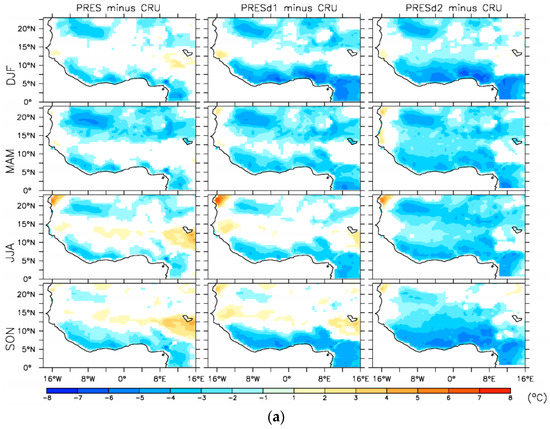
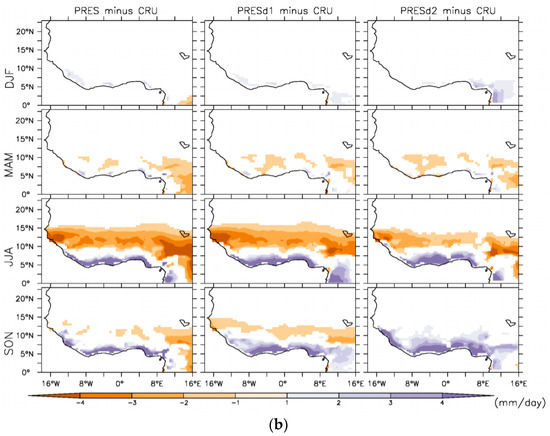
Figure 6.
(a) Spatial distribution of surface temperature biases (Model minus CRU: °C) for each season in RegCM4 prescribed vegetation simulation (first column), dynamic vegetation simulation in a smaller Africa domain (second column), and dynamic vegetation simulation in CORDEX Africa domain (third column), average for the period 1980–2004. (b) Spatial distribution of precipitation biases (Model minus CRU: mm/day) for each season in RegCM4 prescribed vegetation simulation (first column), dynamic vegetation simulation in a smaller Africa domain (second column), and dynamic vegetation simulation in CORDEX Africa domain (third column), averaged for the period 1980–2004.
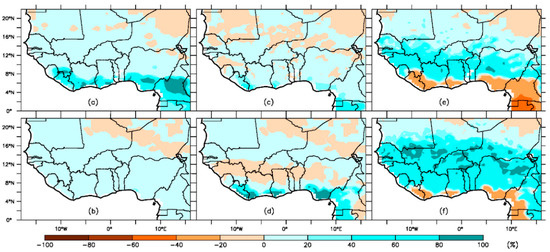
Figure 7.
Simulated changes in PFTs between the years 1980 and 2004. Tropical broadleaf evergreen tree (a,b); tropical broadleaf deciduous tree (c,d); and C4 grass (e,f). The upper row represents the PRESd1 experiment, and the lower row represents the PRESd2 experiment.
Similarly, precipitation along the West African coast was grossly overestimated (higher than 4 mm/day) for June to August (JJA) and September to November (SON) seasons, but underestimated by the same magnitude over the continent (Figure 6b). The pattern of the dry and wet bias was consistent with the temperature biases. The seasonal dry bias in PRES (Figure 6b) was reduced by about 2 mm/day in PRESd1 and PRESd2. The feedback from dynamic vegetation in PRESd1 and PRESd2 contributed partly to the reduction of temperature and precipitation biases in the respective experiments. On the other hand, the warmest bias of 8 °C was found over Western Sahara (approximately 23° N, 16° W) in all three historical simulations from June to August, while the coastal and orographic areas exhibited a cold bias of about 2–4 °C. Similarly, more pronounced wet biases of more than 4 mm/day occurred along the West African coast, but the dry biases were found inland. The magnitude of temperature and precipitation biases in all the seasons was not horizontally homogeneous, but appeared to be more intense over areas with complex terrains (e.g., Guinean Highlands, Cameroon Mountains, and Jos plateau in Nigeria). Previous regional climate model simulations over West Africa reported similar biases [18,30,60,61,62,63,64]. The model biases were associated with different factors, such as the absence of sufficient observing stations in the mountainous region, the influence of land/sea boundary conditions, physics configuration of the model, inherited biases from the driving global circulation models (GCMs), or the choice of cumulus convective parameterization [39,65,66,67].
The model reproduced reasonably well the amplitude of the seasonal variations of temperature and precipitation over West Africa in all seasons with a strong correlation, which ranged from 0.5 to 0.9 (Figure 8 and Figure 9). The simulated amplitude pattern which agreed well with observations lies to the nearest observation point on the x-axis. For instance, the amplitude of temperature variation in the PRESd2 experiment for March to May (MAM) and JJA seasons matched closely with observations by having the best normalized standard deviation (SD ≈ 1.0) and high correlation of 0.80 and 0.92, respectively (Figure 8b,c). However, during December to February (DJF) and SON seasons, the amplitude was slightly underestimated and overestimated by 0.1 °C and 0.2 °C, respectively (Figure 8a,d). On the other hand, PRES and PRESd1 overestimated the amplitude of temperature variation in all seasons, despite having strong correlations. The magnitude of overestimation during DJF and MAM seasons was similar in both PRES and PRESd1 experiments. In contrast, during the SON season, there was a marked difference in the magnitude of temperature variations among the three historical simulations of temperature. The performance of the model in the representation of temperature amplitude variation varied for each season, according to the domain size and vegetation state of the designed experiments. In general, the activation of dynamic vegetation in a smaller domain did not necessarily provide an improvement to the model’s simulation of the amplitude of temperature during DJF and MAM seasons. However, the integration of dynamic vegetation in a more extensive domain in PRESd2 experiment improved on the amplitude variations of temperature during MAM and JJA seasons.
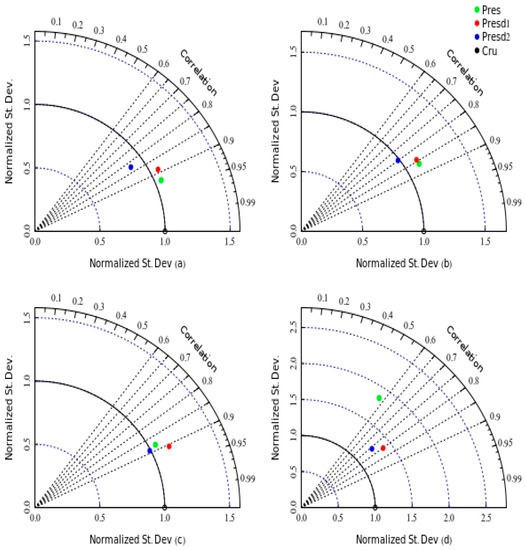
Figure 8.
Taylor’s diagram showing the correlation and normalized standard deviation of simulated and observed temperatures (°C). The standard deviation and correlation are computed for (a) DJF; (b) MAM; (c) JJA; and (d) SON seasons for the period 1980–2004.
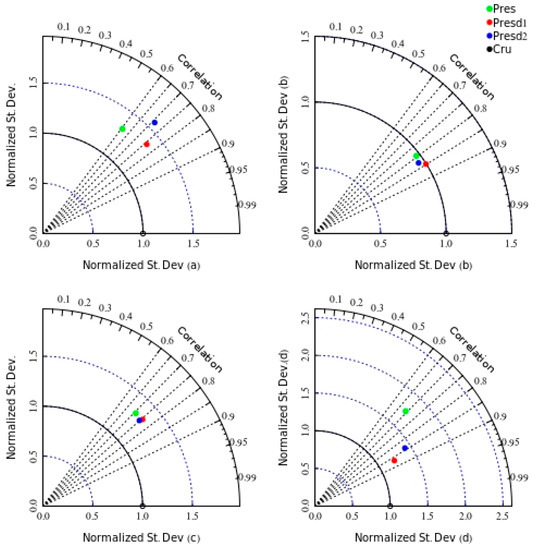
Figure 9.
Taylor’s diagram showing the correlation and normalized standard deviations of simulated and observed precipitation (mm/day). The standard deviations and correlations are computed for (a) DJF; (b) MAM; (c) JJA; and (d) SON seasons for the period 1980–2004.
The wet and dry biases along the coast and over the continent may be attributed to the choice of convective scheme employed in the model configuration. For instance, the integration of Emanuel’s scheme over the ocean assumed quasi-equilibrium, which can lead to the immediate stabilization of convective clouds in the environment as soon as large-scale processes destabilize it. This mechanism enhanced more precipitation and thereby resulted in overestimation of precipitation. Another assumption in the scheme is that mixing within clouds is highly episodic and inhomogeneous. Thus, convective fluxes are considered an idealized model of sub-cloud-scale updrafts and downdrafts. On the contrary, the Grell scheme which was applied to the land surface, assumed no mixing between the cloud and the environment, except at the top and bottom of the circulation, with no entrainment or detrainment along the clouds’ edges.
The seasonal variation of precipitation’s amplitude was simulated in PRES, PRESd1, and PRESd2 experiments, and are presented in Figure 9. All three historical climate experiments exhibited strong pattern correlations for precipitation in all of the seasons, irrespective of the domain size or vegetation state. However, the amplitude of variation was overestimated in all of the seasons, except for the MAM season. During the MAM season, the three historical experiments performed reasonably well in the representation of the amplitude of variation in precipitation, with a normalized standard deviation approximately equal to one and a strong correlation. Generally, the PRESd1 experiment showed the most outstanding performance with a high correlation (R = 0.85) and normalized standard deviation closest to observation during the MAM season.
The magnitude and position of the African Easterly Jet (AEJ), Tropical Easterly Jet (TEJ), and monsoon flow in August are presented in Figure 10. A simulated vertical cross section of the monsoon flow, AEJ, TEJ in August was compared with Era-Interim reanalysis data. At the lower levels, Era-Interim showed the monsoon flow below 800 hPa in areas within 0–20° N, while the Harmattan winds were observed north of 20° N. At the mid-tropospheric levels of 700 hPa, the core of the AEJ (9 m/s) was centered at 15° N, while at the TEJ was located at 200 hPa with a magnitude of 15 m/s centered at 10° N. The occurrence of the AEJ has been linked to meridional surface moisture and the temperature gradient between the Sahara and equatorial Africa [68], while the TEJ is linked to upper-level outflow from the Asian monsoon. The model simulated a small monsoon flow for PRES, PRESd1, and PRESd2 which spanned from 2° N and terminated between 18° N to 20° N. The Harmattan winds were well simulated over areas north of 20° N, in all the three historical climate simulations. However, the model underestimated the strength of the AEJ at 700 hPa by about 3–4 m s−1 and also displaced the core of the JET further northward (e.g., PRES was centered at 20° N; PRESd1 and PRESd2 were centered at 18° N; Era-Interim was centered at 15° N). Similarly, the strength of the TEJ at 200 hPa was grossly underestimated by about 8–9 m s−1 in PRES, PRESd1, and PRESd2. The model’s underestimation of both AEJ and TEJ contributed to another source of biases in the simulation of temperature and precipitation. On the other hand, the stronger vertical motions simulated between 4° N and 10° N could be associated with the broader maximum precipitation bands simulated along this zone.
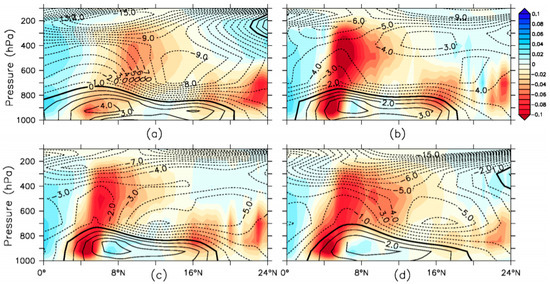
Figure 10.
The vertical structure of the zonal winds (m/s) averaged between 10° E and 10° W over West Africa in August for (a) Era-Interim reanalysis; (b) PRES; (c) PRESd1; and (d) PRESd2 experiments. The shadings indicate the corresponding vertical component of the wind (ω, units: Pa/s).
3.2. Projected Future Climate over West Africa Using Prescribed and Dynamic Vegetation
This section presents results of projected future climate change over West Africa as simulated by FUTU, FUTUd1, and FUTUd2 experiments using both prescribed and dynamic vegetation. The differences obtained from the results of future and historical climate simulations provide information on the impact of greenhouse gases (GHG) under RCP 4.5 on some of the simulated climate variables such as precipitation, temperature, winds, evapotranspiration, specific humidity, relative humidity, and sensible heat flux over West Africa. The spatial distribution of the projected future changes in precipitation (Figure 11), temperature (Figure 12), and winds (Figure 13) across West Africa are non-homogeneous in all seasons. The projection of widespread warming across most parts of West Africa persisted in each of the three future climate simulation experiments (FUTU, FUTUd1, and FUTUd2). An increased future warming of 0.5 °C occurred along the coastal and orographic regions (e.g., Guinea Mountains, Cameroon Mountain, and Jos Plateau in Nigeria) during the JJA season, which increased by more than 2 °C further inland during DJF, MAM, and SON seasons (Figure 11). The three different future climate projections agreed to a warmer (increase of 2 °C) climate over the western Sahel zone from March to May (MAM). FUTU, FUTUd1, and FUTUd2 all projected the most significant decrease in precipitation (more than 2 mm/day) over most parts of Liberia and Sierra Leone in JJA and SON (Figure 12). The model projected an increase or decrease of about 1 mm/day in other parts of West Africa all year round. The wetter condition over these areas corresponded with the enhancement of the westerlies north of 14° N in JJA (Figure 13), but the drying condition appeared not to correspond to the changes in the wind circulation over this region. It is somewhat linked to the influence of other local processes or boundary conditions from the driving global climate model.
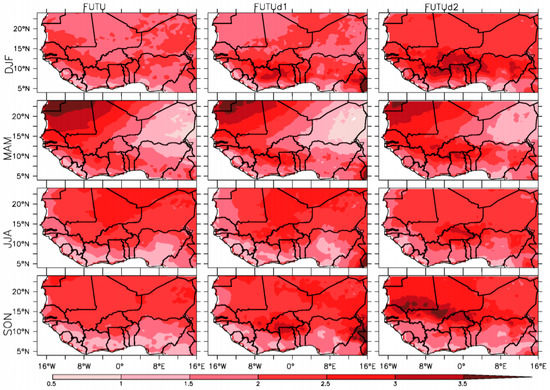
Figure 11.
Projected future changes in temperature (°C; 2030–2054 relative to 1980–2004). The first column shows the projection from RegCM4 prescribed vegetation simulations; the second column shows the dynamic vegetation simulations in a smaller Africa domain; and the third column shows the dynamic vegetation simulations in the CORDEX Africa domain.
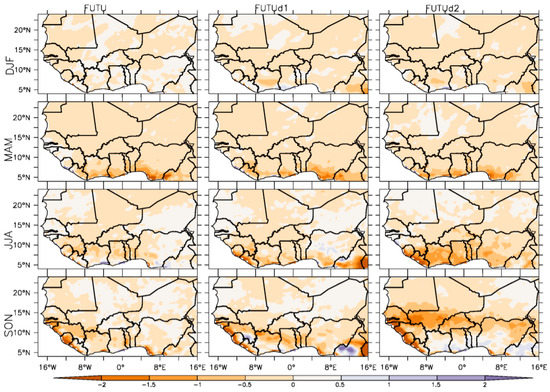
Figure 12.
Projected future changes in precipitation (mm/day; 2030–2054 relative to 1980–2004) as indicated in RegCM4 prescribed (FUTU) and dynamic vegetation (FUTUd1 and FUTUd2) experiments.
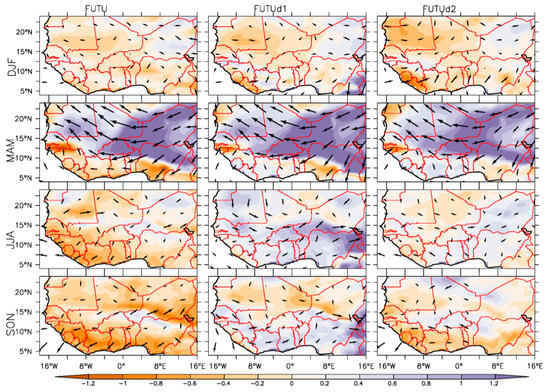
Figure 13.
Projected future (RCP 4.5; 2030–2054 relative to 1980–2004) seasonal changes in the wind (m/s) from both prescribed (FUTU) and dynamic vegetation (FUTUd1 and FUTUd2) experiments. The arrows show the changes in wind direction, while the color shadings indicate the magnitude of the changes in the wind at 925 hPa.
The further analysis of future changes in other surface variables (besides temperature and precipitation) is presented in Figure 14. FUTU simulated warmer future climates in all months, but the least warming (an increase of 0.5 °C) occurred south of latitude 12° N from July to September. With FUTUd1 and FUTUd2, the lowest warming of 1 °C was found south of 8° N from January to December. The three simulations projected a precipitation decrease of more than 2 mm/day over areas south of 8° N in March and October in the FUTU experiment, but were more pronounced from July to August in FUTUd1 and FUTUd2 experiments. The magnitude and latitudinal distribution of changes in evapotranspiration varied among the three simulations. The future latitudinal changes in the distribution of evapotranspiration in the three future experiments appeared to agree jointly with each other, except that FUTUd2 was drier (Figure 13g,i). On the other hand, the projected future increase in atmospheric moisture all year round (Figure 14j,l) over most parts of West Africa was not sufficient to enhance precipitation due to the projected decrease in relative humidity all year round (Figure 14m,o). There was a substantial agreement between the two dynamic vegetation simulations in the projection of an increase in sensible heat flux in all months (Figure 14p,r).
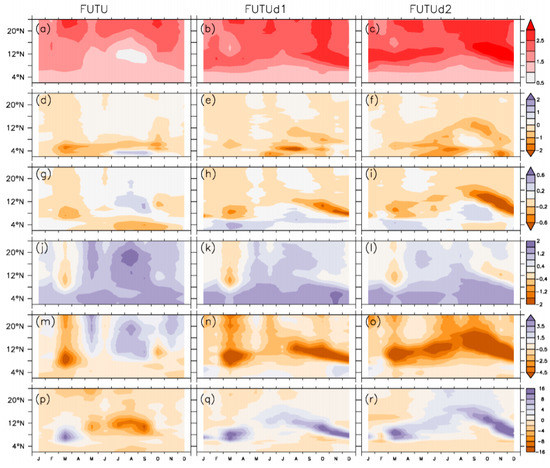
Figure 14.
Latitude-time future changes (2030–2054 minus 1980–2004) in surface (2 m) temperature (°C; a–c); precipitation (mm/day; d–f); evapotranspiration flux (mm/day; g–i); specific humidity (g/Kg; j–l); relative humidity (%; m–o); and sensible heat flux (W m−2; p–r) using prescribed vegetation (FUTU) and dynamic vegetation experiments (FUTUd1 and FUTUd2). The values are zonal averages between 10° E and 10° W over West Africa.
3.3. Impact of Different Percentages of Trees, C3, and C4 PFTs Cover on the Future Climate of West Africa
Evaluation of the impacts of the different percentages of tree and crop cover on the future climate of West Africa was assessed. The results obtained due to the modification of the percentage of trees/shrubs or crops cover was compared to the experiments with a prescribed vegetation state. These provided information on the potential future climatic changes due to the practice of agri-silviculture over West Africa. This section focuses mainly on the projected changes in the future climate over West Africa due to the numerically designed agri-silviculture experiments carried out in this study.
Agri-silviculture numerically designed experiments (GUSAG) along the Guinea Savannah zone of West Africa reduced the projected future warming by about 0.5–3 °C in most countries (e.g., Ghana, Cote d’Ivoire, Cameroon, Togo, Benin Republic, and Nigeria) located along this zone (Figure 15), with the exception of Liberia and Sierra Leone, which exhibited intense warming of about 3 °C. Drier conditions persisted over the coasts of Sierra Leone, Liberia, Cote d’Ivoire, and Ghana, with a precipitation decrease of up to 3 mm/day. However, a projected increase in precipitation of about 3 mm/day occurred along the coast of Nigeria. There were no further pronounced changes in precipitation or temperature in areas outside the designated zone of the GUSAG experiment. This suggests that the prescribed vegetation cover in the GUSAG experiment has the potential to exacerbate the projected warming and drying over most parts of Liberia and Sierra Leone, which could also intensify the drying along the coasts of Sierra Leone, Liberia, Cote d’Ivoire, and Ghana. Similar experiments were carried out in GUSAGd1 and GUSAGd2 with dynamic vegetation, but different domain sizes produced a different signal for temperature and precipitation patterns. The different signal exhibited by the dynamic and prescribed vegetation simulations of the agri-silviculture experiments arose from the satisfaction of the bioclimatic limit conditions before the establishment or survival of the specified PFTs. For instance, in the GUSAGd1 experiment, changes in temperature were not much pronounced in all seasons, but drying of about 1 mm/day occurred along the coasts of Togo, Benin, and Nigeria during the JJA season. Similarly, a sporadic increase in precipitation of about 1 mm/day (Figure 16) was induced in the inland parts of Nigeria, coastal parts of Cote d’Ivoire, Gambia, Senegal, Guinea-Bissau, and Liberia. An increase in the domain size of the GUSAGd2 experiment produced some noticeable changes outside and within the designated zone of the experiment. Warming of about 0.5 °C was enhanced over Senegal, Mauritania, Mali, Burkina Faso, and some parts of Niger during the JJA and SON seasons, but cooling of about 0.4–2 °C occurred over Chad, Cameroon, and north eastern parts of Nigeria in all seasons (Figure 15). The induced cooling corresponded to the increased precipitation (0.5 to 3 mm/day) during JJA and SON in areas south of 12° N and within 8° E to 16° E. However, widespread drying (0.5 to 3 mm/day) was projected in areas south of 12° N and within 15° W and 10° E during JJA and SON. Therefore, the climate mitigation potential of the GUSAGd2 agri-silviculture experiment appeared stronger and favorable over Cameroon, and the north eastern parts of Nigeria and Chad.
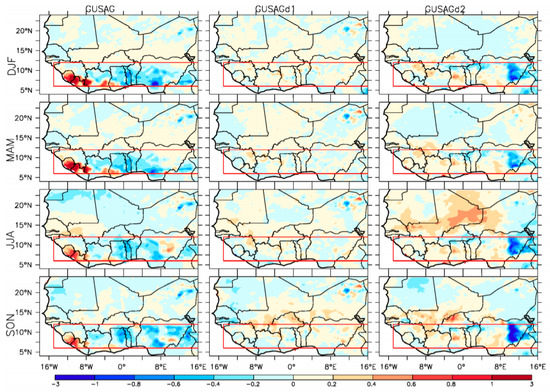
Figure 15.
Projected future seasonal changes in temperature (°C; 2030–2054 minus 1980–2004) over West Africa due to agri-silviculture practices along the Guinea Savanna zone simulated in the GUSAG, GUSAGd1, and GUSAGd2 experiments.
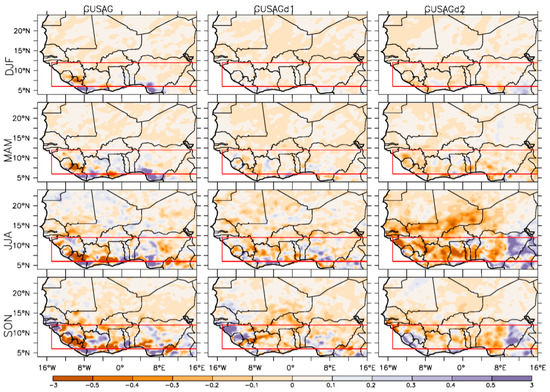
Figure 16.
Projected future seasonal changes in precipitation (mm/day; 2030–2054 minus 1980–2004) over West Africa due to agri-silviculture practices along the Guinea Savanna zone simulated in the GUSAG, GUSAGd1, and GUSAGd2 experiments.
4. Conclusions
Agri-silviculture is expected to provide a win-win solution for the impacts of climate change in West Africa by acting as a mitigation and adaptation strategy. However, there is limited information on its impact on the regional climate vis-à-vis temperature or precipitation. Its potential role as an adaptation and mitigation option to enhance food security and contribute to the reduction of accumulated atmospheric greenhouse gases was examined in this study. This was achieved using different percentages in cover of broadleaf deciduous trees/shrubs, C3, and C4 PFTs. The numerically designed experiments of land cover sensitivity were carried out using a regional climate model. The results obtained from the study are hereby summarized.
The RegCM4 model simulations, driven by the HadGEM2-ES global climate model, reasonably simulated the spatial distribution of temperature and precipitation fields over West Africa. However, the model exhibited cold and dry biases, which were reduced in the dynamic vegetation simulation. Other features of the West African Climate System, such as the ITCZ, AEJ, TEJ, and the monsoon flow were fully captured by the model simulations despite underestimating the strength of the Jets.
Spatial distribution of broadleaf deciduous trees, C4, and C3 grasses at 30%, 60%, and 10%, respectively, along the modified PFTs zone, reduced future warming over West Africa, except for Liberia and Sierra Leone. The influence of these PFTs exacerbated the dry conditions over most areas along the modified PFTs zone. Therefore, it is recommended that similar agri-silviculture experiments be carried out over the study area using regional climate models with dynamic vegetation capabilities and forced by two or more different GCMs. This will provide more robust information on the degree of uncertainties in the models, and will also suggest the most suitable drought-tolerant tree-crop for the region. However, before embarking on large-scale agri-silviculture practice, more biophysical measurements of its effects on the local climate should be carried out.
Author Contributions
Conceptualization, C.F.O.; Methodology, C.F.O., E.O.G. and P.G.O.; Software, C.F.O. and E.O.G.; Validation, C.F.O., E.O.G. and P.G.O.; Formal Analysis, C.F.O.; Investigation, C.F.O., E.O.G. and P.G.O.; Resources, C.F.O., E.O.G. and P.G.O.; Data Curation, C.F.O.; Writing-Original Draft Preparation, C.F.O.; Writing-Review & Editing, C.F.O., P.G.O. and E.O.G.; Visualization, C.F.O.; Supervision, P.G.O. and E.O.G.; Project Administration, C.F.O., P.G.O. and E.O.G.; Funding Acquisition, C.F.O.
Funding
This research was supported by funds received from the German Federal Ministry of Education and Research through the West African Science Service Centre for Climate Change and Adapted Land Use (WASCAL). The computing facility was provided by the Climate Systems Analysis Group (CSAG) of the University of Cape Town (UCT, South Africa) and Earth System Physics section of the Abdus Salam International Centre for Theoretical Physics (ICTP).
Acknowledgments
Thanks also to Abiodun Babatunde, Philip Mukwena, and Graziano Giuliani for their support in the experimental set-up.
Conflicts of Interest
The authors declare no conflict of interest. The founding sponsors had no role in the design of the study; in the collection, analyses, or interpretation of data; in the writing of the manuscript, and in the decision to publish the results.
References
- Martin, R.M.; Kneeland, D.; Brooks, D.; Matta, R. State of the World ’s Forests; FAO: Rome, Italy, 2012; ISBN 978-92-5-107292-9. [Google Scholar]
- MacDicken, K.; Jonsson, Ö.; Piña, L.; Maulo, S.; Contessa, V.; Adikari, Y.; Garzuglia, M.; Lindquist, E.; Reams, G.; D’Annunzio, R. Global Forest Resources Assessment 2015: How Are the World’s Forests Changing? Food and Agriculture Organization of the United Nations: Rome, Italy, 2015. [Google Scholar]
- Zomer, R.J.; Trabucco, A.; Coe, R.D.; Place, F.; van Noordwijk, M.; Xu, J.C. Trees on farms: An update and reanalysis of agroforestry’s global extent and socio-ecological characteristics. World Agrofor. Cent. Work. Pap. 2014. [Google Scholar] [CrossRef]
- Neufeldt, H.; Wilkes, A.; Zomer, R.J.; Xu, J.; Nang’ole, E.; Munster, C.; Place, F. Trees on farms: Tackling the triple challenge of mitigation, adaptation and food security. World Agrofor. Cent. Policy 2009, 7, 1–6. [Google Scholar]
- Nair, P.K.R. Classification of agroforestry systems. Agrofor. Syst. 1985, 3, 97–128. [Google Scholar] [CrossRef]
- Harvey, C.A.; Komar, O.; Chazdon, R.; Ferguson, B.G.; Finegan, B.; Griffith, D.M.; Martínez-Ramos, M.; Morales, H.; Nigh, R.; Soto-Pinto, L.; et al. Integrating agricultural landscapes with biodiversity conservation in the Mesoamerican hotspot. Conserv. Biol. 2008, 22, 8–15. [Google Scholar] [CrossRef] [PubMed]
- Mbow, C.; Smith, P.; Skole, D.; Duguma, L.; Bustamante, M. Achieving mitigation and adaptation to climate change through sustainable agroforestry practices in africa. Curr. Opin. Environ. Sustain. 2014, 6, 8–14. [Google Scholar] [CrossRef]
- Bayala, J.; Sanou, J.; Teklehaimanot, Z.; Kalinganire, A.; Ouédraogo, S.J. Parklands for buffering climate risk and sustaining agricultural production in the Sahel of West Africa. Curr. Opin. Environ. Sustain. 2014, 6, 28–34. [Google Scholar] [CrossRef]
- Haile, S.G.; Nair, P.K.R.; Nair, V.D. Carbon storage of different soil-size fractions in Florida silvopastoral systems. J. Environ. Qual. 2008, 37, 1789–1797. [Google Scholar] [CrossRef] [PubMed]
- Nair, P.K.R.; Kumar, B.M.; Nair, V.D. Agroforestry as a strategy for carbon sequestration. J. Plant Nutr. Soil Sci. 2009, 172, 10–23. [Google Scholar] [CrossRef]
- Takimoto, A.; Nair, P.K.R.; Alavalapati, J.R.R. Socioeconomic potential of carbon sequestration through agroforestry in the West African Sahel. Mitig. Adapt. Strateg. Glob. Chang. 2008, 13, 745–761. [Google Scholar] [CrossRef]
- Takimoto, A.; Nair, P.K.R.; Nair, V.D. Carbon stock and sequestration potential of traditional and improved agroforestry systems in the West African Sahel. Agric. Ecosyst. Environ. 2008, 125, 159–166. [Google Scholar] [CrossRef]
- Luedeling, E.; Neufeldt, H. Carbon sequestration potential of parkland agroforestry in the Sahel. Clim. Chang. 2012, 115, 443–461. [Google Scholar] [CrossRef]
- Mbow, C.; Van Noordwijk, M.; Luedeling, E.; Neufeldt, H.; Minang, P.A.; Kowero, G. Agroforestry solutions to address food security and climate change challenges in Africa. Curr. Opin. Environ. Sustain. 2014, 6, 61–67. [Google Scholar] [CrossRef]
- United Nations Framework Convention on Climate Change (UNFCCC). Options for Possible Additional Land Use, Land-Use Change and Forestry Activities and Alternative Approaches to Addressing the Risk of Non-Permanence under the Clean Development Mechanism; Technical Paper; UNFCCC: New York, NY, USA, 2014; pp. 1–18. [Google Scholar]
- Dixon, R.K. Agroforestry systems: Sources of sinks of greenhouse gases? Agrofor. Syst. 1995, 31, 99–116. [Google Scholar] [CrossRef]
- Smith, P.; Clark, H.; Dong, H.; Elsiddig, E.A.; Haberl, H.; Harper, R.; House, J.; Jafari, M.; Masera, O.; Mbow, C.; et al. Climate Change 2014: Mitigation of Climate Change. Contribution of Working Group III to the Fifth Assessment Report of the Intergovernmental Panel on Climate Change; Agriculture, Forestry and Other Land Use (AFOLU); Cambridge University Press: Cambridge, UK, 2014. [Google Scholar]
- Abiodun, B.J.; Adeyewa, Z.D.; Oguntunde, P.G.; Salami, A.T.; Ajayi, V.O. Modeling the impacts of reforestation on future climate in West Africa. Theor. Appl. Climatol. 2012, 110, 77–96. [Google Scholar] [CrossRef]
- Abiodun, B.J.; Salami, A.T.; Matthew, O.J.; Odedokun, S. Potential impacts of afforestation on climate change and extreme events in Nigeria. Clim. Dyn. 2013, 41, 277–293. [Google Scholar] [CrossRef]
- Chen, G.S.; Notaro, M.; Liu, Z.; Liu, Y. Simulated local and remote biophysical effects of afforestation over the Southeast United States in boreal summer. J. Clim. 2012, 25, 4511–4522. [Google Scholar] [CrossRef]
- Gálos, B.; Mátyás, C.; Jacob, D. Regional characteristics of climate change altering effects of afforestation. Environ. Res. Lett. 2011, 6, 44010. [Google Scholar] [CrossRef]
- Swann, A.L.S.; Fung, I.Y.; Chiang, J.C.H. Mid-latitude afforestation shifts general circulation and tropical precipitation. Proc. Natl. Acad. Sci. USA 2012, 109, 712–716. [Google Scholar] [CrossRef] [PubMed]
- Charney, J.; Quirk, W.J.; Chow, S.-H.; Kornfield, J. A comparative study of the effects of albedo change on drought in semi-arid regions. J. Atmos. Sci. 1977, 34, 1366–1385. [Google Scholar] [CrossRef]
- Zheng, X.; Eltahir, E.A.B. The response to deforestation and desertification in a model of West African monsoons. Geophys. Res. Lett. 1997, 24, 155–158. [Google Scholar] [CrossRef]
- Zheng, X.; Eltahir, E.A.B. The role of vegetation in the dynamics of West African monsoons. J. Clim. 1998, 11, 2078–2096. [Google Scholar] [CrossRef]
- Collins, M.; Knutti, R.; Arblaster, J.; Dufresne, J.-L.; Fichefet, T.; Friedlingstein, P.; Gao, X.; Gutowski, W.J.; Johns, T.; Krinner, G.; et al. Long-term Climate Change: Projections, Commitments and Irreversibility. In Climate Change 2013: The Physical Science Basis. IPCC Working Group I Contribution to AR5; Cambridge University Press: Cambridge, UK; New York, NY, USA, 2013; pp. 1029–1136. [Google Scholar] [CrossRef]
- Xue, Y. Biosphere feedback on regional climate in tropical North Africa. Q. J. R. Meteorol. Soc. 1997, 123, 1483–1515. [Google Scholar] [CrossRef]
- Zeng, N.; Neelin, J.D. A Land-Atmosphere Interaction Theory for the Tropical Deforestation Problem. J. Clim. 1999, 12, 857–872. [Google Scholar] [CrossRef]
- Olusegun, C.; Adeyewa, Z. Spatial and Temporal Variation of Normalized Difference Vegetation Index (NDVI) and Rainfall in the North East Arid Zone of Nigeria. Atmos. Clim. Sci. 2013, 3, 421–426. [Google Scholar] [CrossRef]
- Alo, C.A.; Wang, G. Role of dynamic vegetation in regional climate predictions over Western Africa. Clim. Dyn. 2010, 35, 907–922. [Google Scholar] [CrossRef]
- Oguntunde, P.G.; Abiodun, B.J.; Lischeid, G.; Merz, C. Modelling the impacts of reforestation on the projected hydroclimatology of Niger River Basin, West Africa. Ecohydrology 2014, 7, 163–176. [Google Scholar] [CrossRef]
- Sage, R.F.; Li, M.M.R. The Taxonomic Distribution of C4 Photosynthesis; Academic Press: San Diego, CA, USA, 1999. [Google Scholar]
- Levis, S.; Gordon, B.B.; Kluzek, E.; Thornton, P.E.; Jones, A.; Sacks, W.J.; Kucharik, C.J. Interactive Crop Management in the Community Earth System Model (CESM1): Seasonal influences on land-atmosphere fluxes. J. Clim. 2012, 25, 4839–4859. [Google Scholar] [CrossRef]
- Oleson, K.; Lawrence, D.M.; Authors, L.; Bonan, G.B.; Drewniak, B.; Huang, M.; Koven, C.D.; Levis, S.; Li, F.; Riley, W.J.; et al. Technical Description of Version 4.5 of the Community Land Model (CLM); National Center for Atmospheric Research: Boulder, CO, USA, 2013. [Google Scholar]
- Yu, M.; Wang, G.; Pal, J.S. Effects of vegetation feedback on future climate change over West Africa. Clim. Dyn. 2015. [Google Scholar] [CrossRef]
- Wang, G.; Yu, M.; Pal, J.S.; Mei, R.; Bonan, G.B.; Levis, S.; Thornton, P.E. On the development of a coupled regional climate-vegetation model RCM–CLM–CN–DV and its validation in Tropical Africa. Clim. Dyn. 2015. [Google Scholar] [CrossRef]
- Gu, H.; Wang, G.; Yu, Z.; Mei, R. Assessing future climate changes and extreme indicators in east and south Asia using the RegCM4 regional climate model. Clim. Chang. 2012, 114, 301–317. [Google Scholar] [CrossRef]
- Adeniyi, M.O. Sensitivity of different convection schemes in RegCM4.0 for simulation of precipitation during the Septembers of 1989 and 1998 over West Africa. Theor. Appl. Climatol. 2014, 115, 305–322. [Google Scholar] [CrossRef]
- Oh, S.-G.; Park, J.-H.; Lee, S.-H.; Suh, M.-S. Assessment of the RegCM4 over East Asia and future precipitation change adapted to the RCP scenarios. J. Geophys. Res. Atmos. 2014, 119, 2913–2927. [Google Scholar] [CrossRef]
- Wang, X.; Yang, M.; Pang, G. Influences of Two Land-Surface Schemes on RegCM4 Precipitation Simulations over the Tibetan Plateau. Adv. Meteorol. 2015, 2015, 1–12. [Google Scholar] [CrossRef]
- Pal, J.S.; Giorgi, F.; Bi, X.; Elguindi, N.; Solmon, F.; Rauscher, S.A.; Gao, X.; Francisco, R.; Zakey, A.; Winter, J.; et al. Regional climate modeling for the developing world: The ICTP RegCM3 and RegCNET. Bull. Am. Meteorol. Soc. 2007, 88, 1395–1409. [Google Scholar] [CrossRef]
- Giorgi, F.; Coppola, E.; Solmon, F.; Mariotti, L.; Sylla, M.B.; Bi, X.; Elguindi, N.; Diro, G.T.; Nair, V.; Giuliani, G.; et al. RegCM4: Model description and preliminary tests over multiple CORDEX domains. Clim. Res. 2012, 52, 7–29. [Google Scholar] [CrossRef]
- Emanuel, K.A.; Živković-Rothman, M. Development and evaluation of a convection scheme for use in climate models. J. Atmos. Sci. 1999, 56, 1766–1782. [Google Scholar] [CrossRef]
- Grell, G.A. Prognostic evaluation of assumptions used by cumulus parameterizations. Mon. Weather Rev. 1993, 121, 764–787. [Google Scholar] [CrossRef]
- Davis, N.; Bowden, J.; Semazzi, F.; Xie, L.; Önol, B. Customization of RegCM3 regional climate model for eastern Africa and a tropical Indian Ocean domain. J. Clim. 2009, 22, 3595–3616. [Google Scholar] [CrossRef]
- Lawrence, P.J.; Chase, T.N. Representing a new MODIS consistent land surface in the Community Land Model (CLM 3.0). J. Geophys. Res. Biogeosci. 2007, 112. [Google Scholar] [CrossRef]
- Castillo, C.K.G.; Levis, S.; Thornton, P. Evaluation of the New CNDV Option of the Community Land Model: Effects of Dynamic Vegetation and Interactive Nitrogen on CLM4 Means and Variability. J. Clim. 2012, 25, 3702–3714. [Google Scholar] [CrossRef]
- Lawrence, D.M.; Oleson, K.W.; Flanner, M.G.; Thornton, P.E.; Swenson, S.C.; Lawrence, P.J.; Zeng, X.; Yang, Z.-L.; Levis, S.; Sakaguchi, K.; Bonan, G.B.; Slater, A.G.; et al. Parameterization improvements and functional and structural advances in version 4 of the Community Land Model. J. Adv. Model. Earth Syst. 2011, 3, 1–27. [Google Scholar] [CrossRef]
- Giorgi, F.; Jones, C.; Asrar, G.R. Addressing climate information needs at the regional level: The CORDEX framework. World Meteorol. Org. Bull. 2009, 58, 175. [Google Scholar]
- Browne, N.A.K.; Sylla, M.B. Regional climate model sensitivity to domain size for the simulation of the West African summer monsoon rainfall. Int. J. Geophys. 2012, 2012. [Google Scholar] [CrossRef]
- Rauscher, S.A.; Seth, A.; Qian, J.-H.; Camargo, S.J. Domain choice in an experimental nested modeling prediction system for South America. Theor. Appl. Clim. 2006, 86, 229–246. [Google Scholar] [CrossRef][Green Version]
- Zeng, X.; Zhao, M.; Dickinson, R.E. Intercomparison of bulk aerodynamic algorithms for the computation of sea surface fluxes using TOGA COARE and TAO data. J. Clim. 1998, 11, 2628–2644. [Google Scholar] [CrossRef]
- Harris, I.; Jones, P.D.; Osborn, T.J.; Lister, D.H. Updated high-resolution grids of monthly climatic observations—The CRU TS3.10 Dataset. Int. J. Climatol. 2014, 34, 623–642. [Google Scholar] [CrossRef]
- Dee, D.P.; Uppala, S.M.; Simmons, A.J.; Berrisford, P.; Poli, P.; Kobayashi, S.; Andrae, U.; Balmaseda, M.A.; Balsamo, G.; Bauer, P.; et al. The ERA-Interim reanalysis: Configuration and performance of the data assimilation system. Q. J. R. Meteorol. Soc. 2011, 137, 553–597. [Google Scholar] [CrossRef]
- Muthuri, C.W.; Ong, C.K.; Black, C.R.; Mati, B.M.; Ngumi, V.W.; van Noordwijk, M. Modelling the effects of leafing phenology on growth and water use by selected agroforestry tree species in semi-arid Kenya. Land Use Water Resour. Res. 2002, 4, 11. [Google Scholar]
- Angelo, C.L.; Daehler, C.C. Upward expansion of fire-adapted grasses along a warming tropical elevation gradient. Ecography 2013, 36, 551–559. [Google Scholar] [CrossRef]
- Ehleringer, J.R.; Sage, R.; Flanagan, L.; Pearcy, R. Climate change and evolution of C4 Photosynthesis. Land Use Water Resour. Res. 2002, 4, 11. [Google Scholar] [CrossRef]
- Afiesimama, E.A.; Pal, J.S.; Abiodun, B.J.; Gutowski, W.J.; Adedoyin, A. Simulation of West African monsoon using the RegCM3. Part I: Model validation and interannual variability. Theor. Appl. Climatol. 2006, 86, 23–37. [Google Scholar] [CrossRef]
- Le Barbé, L.; Lebel, T.; Tapsoba, D. Rainfall variability in West Africa during the years 1950–1990. J. Clim. 2002, 15, 187–202. [Google Scholar] [CrossRef]
- Sylla, M.B.; Coppola, E.; Mariotti, L.; Giorgi, F.; Ruti, P.M.; Dell’Aquila, A.; Bi, X. Multiyear simulation of the African climate using a regional climate model (RegCM3) with the high resolution ERA-interim reanalysis. Clim. Dyn. 2010, 35, 231–247. [Google Scholar] [CrossRef]
- Nikulin, G.; Jones, C.; Giorgi, F.; Asrar, G.; Büchner, M.; Cerezo-Mota, R.; Christensen, O.B.; Déqué, M.; Fernandez, J.; Hänsler, A.; et al. Precipitation climatology in an ensemble of CORDEX-Africa regional climate simulations. J. Clim. 2012, 25, 6057–6078. [Google Scholar] [CrossRef]
- Sylla, M.B.; Diallo, I.; Pal, J.S. West African monsoon in state-of-the-science regional climate models. In Climate Variability-Regional and Thematic Patterns; InTech: Rijeka, Croatia, 2013. [Google Scholar]
- Gbobaniyi, E.; Sarr, A.; Sylla, M.B.; Diallo, I.; Lennard, C.; Dosio, A.; Dhiédiou, A.; Kamga, A.; Klutse, N.A.B.; Hewitson, B.; et al. Climatology, annual cycle and interannual variability of precipitation and temperature in CORDEX simulations over West Africa. Int. J. Climatol. 2014, 34, 2241–2257. [Google Scholar] [CrossRef]
- Klutse, N.A.B.; Sylla, M.B.; Diallo, I.; Sarr, A.; Dosio, A.; Diedhiou, A.; Kamga, A.; Lamptey, B.; Ali, A.; Gbobaniyi, E.O.; et al. Daily characteristics of West African summer monsoon precipitation in CORDEX simulations. Theor. Appl. Climatol. 2015. [Google Scholar] [CrossRef]
- Bergant, K.; Belda, M.; Halenka, T. Systematic errors in the simulation of European climate (1961–2000) with RegCM3 driven by NCEP/NCAR reanalysis. Int. J. Climatol. 2007, 27, 455–472. [Google Scholar] [CrossRef]
- Rockel, B.; Geyer, B. The performance of the regional climate model CLM in different climate regions, based on the example of precipitation. Meteorol. Z. 2008, 17, 487–498. [Google Scholar] [CrossRef]
- Druyan, L.M.; Feng, J.; Cook, K.H.; Xue, Y.; Fulakeza, M.; Hagos, S.M.; Konaré, A.; Moufouma-Okia, W.; Rowell, D.P.; Vizy, E.K.; et al. The WAMME regional model intercomparison study. Clim. Dyn. 2010, 35, 175–192. [Google Scholar] [CrossRef]
- Thorncroft, C.D.; Blackburn, M. Maintenance of the African easterly jet. Q. J. R. Meteorol. Soc. 1999, 125, 763–786. [Google Scholar] [CrossRef]


© 2018 by the authors. Licensee MDPI, Basel, Switzerland. This article is an open access article distributed under the terms and conditions of the Creative Commons Attribution (CC BY) license (http://creativecommons.org/licenses/by/4.0/).