Abstract
The main objective of this paper is to present an analytical methodological framework for the estimation of the external costs of air emissions from passenger ships. We used as a case study the two main ports of Crete (Souda and Heraklion) and studied all passenger ferries and cruise vessels that visited these ports in the last 5 years (2017–2021). A detailed inventory was created containing all technical details for 10 passenger ferries (owned by three different shipping companies) operating every day, following various itineraries all year around, and 88 different cruise vessels (which approached both ports mainly during the summer period). The estimated external costs due to air emissions cover health effects, materials and building damages, biodiversity and crop losses. Two levels of calculations for the total external costs per pollutant were implemented. At the first level, a bottom-up approach was applied to accurately calculate the total annual air emissions (CO2, SOX, NOX, PM2.5, PM10), while for the second level, the cost factors per pollutant were used as input values to estimate the annual total external costs. One of the most important findings is that externalities comprise a significant amount of shipping companies’ revenues (about 25–35%), thus, implying a substantial revenue loss in the case that they would be asked to bear these costs. Assuming that ship owners will pass these costs on to ticket fares, an attempt is made to allocate the “externalities surcharge” (i.e., the burden of external costs) to ticket fares per transportation category.
1. Introduction
Maritime passenger vessels are divided into two main categories: ferries and cruise vessels. The former follow routes that are characterized according to fixed time schedules, while the latter have annually scheduled routes, depending on country, region or touristic importance and can vary highly between years. The majority of maritime transportation passengers (excluding cruises) in the European Union (EU) are carried out between ports located in the same country (74% in 2020), pointing to the significant role of the national ferry sector []. Generally, each continent with populated or touristic islands has a frequent ferry connection between islands and large volume of freight and passengers. Due to Eurostat, this applies to Italy and Greece, which classifies them as the two leading maritime transportation passenger countries and some other Mediterranean countries follow, including Spain, Portugal, Croatia and Malta.
The latest environmental report by the European Sea Ports Organization (ESPO) [], shows that ports constantly focus on environmental priorities. Since 2013, air quality has been the top environmental issue for ports, whereas climate change has been the second during the last two years. Additionally, energy efficiency is ranked third in terms of priorities. Air pollution in port areas is caused mainly due to ships navigating in the port, maneuvering and at berth. Related land vehicle traffic within the port area and other commercial or industrial port activities are additional air pollution origins. Air quality is very important to safeguard and protect the health of citizens, working people around the port and visitors, since the majority of European ports are located near densely populated city areas.
A typical example is Piraeus port, which is one of the most populated areas in Greece, with a population of 163,688 for an area of 11.2 km2 (population density of 14,615 residents per km2) []. Another interesting case is the port of Barcelona, which has two main areas for cruise ships: one at a very short proximity (854 m) to the city center, while the other (which hosts the main terminals receiving cruise ships every day) is located at a larger distance (about 2–2.5 km) from the Barcelona center. It is very likely that air pollution due to activities related to cruises and ferries can affect the wider urban area of Barcelona and its residents. [].
One of the main challenges for ports in their relationship with the local community is to ensure that cruise and ferry operations remain as sustainable as possible. The potential impact of air pollutants to human health is emphasized in reports issued by the European Environment Agency (EEA) and the World Health Organization (WHO) on a regular basis. Air pollution and the effect to air quality is very often the target of regulatory control measures and is of constant high priority in public concern, not only for locals but also for visitors or workers in urban regions and port cities. A worrying fact that justifies the above is that every year, air pollution causes about 400 thousand premature deaths in the EU region and EUR hundreds of billions in health-related external costs [].
1.1. The Concept of External Costs
An external cost (or externality), in general, is interpreted as the cost of the impacts that arise from the activities (social or economic) of a group of people to another group of people []. External costs are not simple to calculate and they can be distinguished into seven categories: accident, noise, congestion, habitat damage, air pollution, climate change and well-to-tank emissions. In most cases, these costs are not taken into account by the group of people who cause them [] and, for example, shipping companies argue that external costs should not be considered at all for their sector due to the social nature of their activities. This is certainly not very realistic, and even though maritime transportation promotes economic growth and removes isolation between islands or different geographic areas in general, it also contributes to the above-mentioned seven impact categories. In order to evaluate the costs and benefits of shipping to society, it is necessary to consider all benefits and costs, including the externalities. Using market-based instruments to internalize external costs is generally regarded as an efficient way to limit the negative side effects of transport and/or to generate income for the government []. Applying these instruments in an efficient way requires detailed and reliable estimates of external costs. Τhis is the main objective of this study, which progresses compared to relevant previous studies and publications from the authors. The European Commission (EC) recently stated [] that the full impact of transport may only be accounted for by implementing the main principles of “polluter pays”. This urges the internalization of external costs, which means making the transport user accountable for the full costs of their transport decisions. Towards this, the EC will propose to extend the European Emissions Trading System (ETS) and include the maritime sector, and to reduce the EU emissions trading system allowances allocated for free to airlines [].
1.2. Air Emission Costs
This study focuses on the external costs due to air emissions from passenger ships (ferries and cruise vessels). The air emissions from shipping can lead to various types of damage, with the most relevant being the health impacts due to air pollutants. Further, also relevant is the damage caused to various buildings and monuments, biodiversity and crop losses. Hofbauer and Putz [], in their recent publication, presented a literature review to estimate the number of studies found in academic databases dealing with external costs for the transportation sector and identified the most commonly used external cost calculation methods for inland waterways. The results show that while there is already a significant amount of papers dealing with the external costs for road (556) and rail (242), the amount of papers focused on external costs for shipping is rather low (i.e., 20 for inland waterways and 30 for maritime transport). Thus, it is clear that there is available research space for more studies on the external costs of shipping with suitable and original case studies. Further, as far as the authors know, by the time of this analysis, there has been no recent similar study for passenger ships (both cruise and passenger ferries) for the presented ports. Additionally, it is always useful for the local communities to know the environmental burdens of specific sectorial activity (in our case ferries and cruise vessels), which promote economic development and growth, but ultimately, can cause external costs to local societies due to emitted air pollutants.
2. Methodological Framework
2.1. External Costs Estimation Methodologies
The externalities in this study cover health effects, materials and building damages, biodiversity and crop losses loss caused by air emissions. There are two levels of calculation, which results in the total external costs per pollutant and these are explained by the block diagram in Figure 1. In the first level, we perform a calculation of the fuel/energy consumption of ports/ships in study and in conjunction to specific emission factors (per emitted air pollutant) we calculate the total air emissions. In the second level for the calculation of the total external costs, we use as input values the cost factor per pollutant which is originally calculated based on the New Energy Externalities Developments for Sustainability (NEEDS) approach and by taking into account the most recent results presented in the “Handbook on the external costs of transport” []. This handbook was prepared for European Commission Directorate-General for Mobility and Transport and it presents the best practices on the methodology to estimate different categories of external costs of transport, extended to all EU member states, including emissions from other sources and maritime sector. The maritime sector and specifically the inland waterway transport is the part of the handbook that we focused on. The estimation of cost factors includes a broad update of the values originally provided by NEEDS. Overall, the cost factors per country and per air pollutant are derived from the updated cost factors, although further update is recommended, since NEEDS has not been updated and developed further from 2009. Additionally, the other similar method for estimation of cost factors, i.e., the “Clean Air for Europe” (CAFE) Program of the EU, was updated recently, as International Institute for Applied Systems Analysis (IIASA) reported []. For this reason the cost factors presented in NEEDS have been adjusted as presented in “Handbook on the external costs of transport” and in our detailed methodological approach.
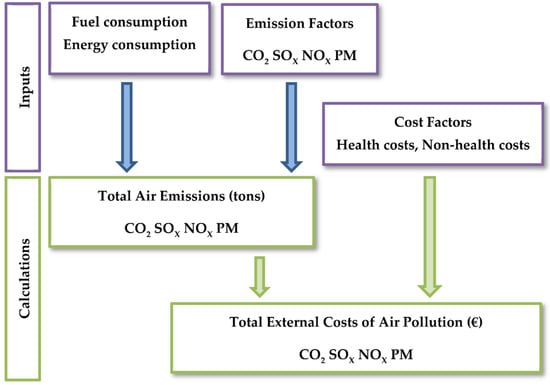
Figure 1.
Total external costs methodological framework.
2.2. First-Level Calculation—Air Emissions Estimation Methodology
Depending on the availability of data and technical parameters there are various studies regarding the existing methodologies for estimating ships’ air emissions, with many different case studies [,,,,,,,]. In this paper we present an extensive study for passenger ships (ferries and cruise vessels) for the last 5 years (2017–2021) for the two major ports of Crete (Souda and Heraklion) that connect the island with mainland Greece (i.e., the port of Piraeus). All passenger ferries and cruise vessels which approached the two studied ports for the five-year period, were elaborated and, thus, a detailed inventory was created containing all technical details for 10 passenger ferries (owned by three different shipping companies) operating every day following various itineraries all year around and 88 different cruise vessels (which approached both ports mainly during the summer period). This extensive technical record makes this work unique, since no similar study has been performed. The calculated results include the period of the last two years, which was negatively affected by the pandemic and allowed us to draw useful conclusions about the measured impacts on passenger ferries and the cruise sector for the studied ports.
All data regarding ships’ arrivals and duration of port calls were collected and validated from port authorities and one of the most reliable web-based cruise portals []. Additionally, in order to confirm the data and precisely determine the required duration of each operating phase per ship call, an extensive search in the related AIS database was conducted for the itineraries presented in this study.
As resulted from the available data for the last pre-COVID-19 era (year 2019), the 10 major Mediterranean cruise ports hosted a total of about 18.5 million cruise passenger movements. While this is a 9.23% increase compared to the previous year (2018), Barcelona reached an all-time record as a major Mediterranean cruise port for the second consecutive year, hosting more than 3 million cruise passenger movements []. Cruise industry was expected to exhibit a continuously increasing trend, not only for the Mediterranean region but also globally. Unfortunately, the forecasts have been negatively overtaken by the pandemic, following the social distancing measures and travel restrictions. Cruise industry was the travel sector, which has been severely affected, with revenues approaching nearly zero for several months.
2.2.1. Ship Calls
As presented in Figure 2, the cruise ship calls significantly decreased in the studied ports during the last two COVID-19 years 2020 and 2021 (2020 vs. 2019: −90.7% for Heraklion and −100% for Souda and 2021 vs. 2019: −43.1% for Heraklion and −52.7% for Souda) and as we will see later, this also affected fuel and energy consumption.
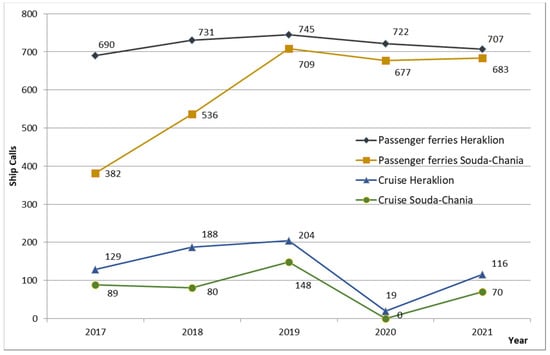
Figure 2.
Annual ship calls for ports Souda and Heraklion (years 2017–2021).
Although the assumption that passenger ferries’ ship calls would decrease due to COVID-19 (as happened with the cruise sector) seemed reasonable, finally, the observed reduction was not so significant (2020 vs. 2019: −3.1% for Heraklion and −4.5% for Souda and 2021 vs. 2019: −5.1% for Heraklion and −3.7% for Souda). Table 1 depicts the variation in relevant data compared to 2019 (passengers, vehicles and freight cargo vehicles). It is evident that even if the trend for all transportation categories (passengers, vehicles, cargo) from 2017 to 2019 is increasing, in 2020, there is a significant decrease, especially to passengers (around 50% for both ports) and vehicles (−39.6% for Souda and −37.9% for Heraklion), due to COVID-19 applied travel restrictions and the insecurity of people to move freely.

Table 1.
Passenger ferries data variation compared to 2019.
Even 2021 was not a recovery year since significant reduction occurred: passengers −41.9% for Souda and −43.4% for Heraklion, vehicles: −16.2% for Souda and −17.3% for Heraklion. After 2019, cargo vehicles had a decrease also, but not so significant (2020: −12.8% for Souda and −5.7% for Heraklion, 2021: −1.3% for Souda and +8% for Heraklion) such as passengers and vehicles. This is because the population has continuous needs of goods and freight cargo and this kind of transportation is not affected as much as others.
All the above significantly affected the revenues of the shipping companies. The Greek state from the beginning of the pandemic crisis realized that passenger ferries are closely linked to the viability of Greek islands, the preservation and increase in their population, the tourism development, the Greek economy and has actively supported shipping companies to compensate for the losses of revenues due to COVID-19 travel restrictions. This is mainly the reason for observing a significant decrease in transportation units (i.e., passengers, vehicles, cargo), while we do not note a similar decrease in ship calls.
2.2.2. Fuel and Energy Consumption
To calculate the fuel and energy consumption for the ships in our study, we followed a bottom-up methodology, which was described in detail in a recent publication []. This paper employs a well-defined and accurate bottom-up methodology for the calculation of fuel/energy consumption and air emissions (CO2, SOx, NOx, PM10) for passenger ships. Regarding PM, the quantities of PM10 were estimated, and it was reported that “there is virtually no difference between total PM and PM with sizes less than 10 microns for diesel-based fuels” []. Additionally, in the most recent 4th IMO GHG Study, the quantity of PM10 was reported, while PM2.5 are assumed to represent 92% of PM10 [], thus, providing a simple formula to estimate PM2.5.
The five-year results are depicted in Table 2, and as we observe, the most fuel-energy-consuming sector per ship call differs for the two ports: the passenger ferries dominate in terms of fuel-energy consumption in Heraklion (until 2019), while for Souda, cruise ships prevail all year. For 2020 and 2021, Heraklion cruises had a significant increase in average fuel and energy consumption in port and this is attributed to longer average duration of stay in port for the cruise vessels, as longer stay means more fuel-energy consumption at port.

Table 2.
Cruise and passenger ferries fuel and energy consumption.
2.2.3. Air Emissions
The quantities of air emissions are depicted in Table 3, and it is evident that CO2 represents the vast majority of all emissions in the study. Actually, they account for about 97–98% in terms of total air emissions every year.

Table 3.
Air emissions for ports Souda and Heraklion (years 2017–2021).
Not all components of air emissions are considered as air pollutants. CO2 is the primary greenhouse gas emitted due to human activities, but it is naturally present in the atmosphere as part of the Earth’s carbon cycle (the natural circulation of carbon among the atmosphere, oceans, plants, animals, etc.). Human activities are altering the carbon cycle, both by adding more CO2 to the atmosphere and by influencing the ability of natural sinks (forests and soils) to remove and store CO2 from the atmosphere. Thus, CO2 is not a pollutant and it has to be treated separately. The detailed annual CO2 air emissions quantities during the five-year period 2017–2021 are presented in Figure 3.
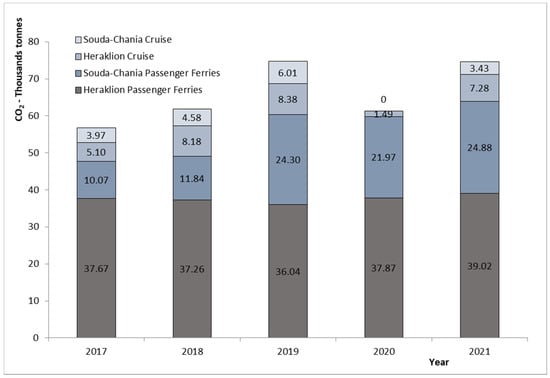
Figure 3.
Annual CO2 emissions during years 2017–2021 for Souda and Heraklion ports.
The estimated quantities of gaseous pollutants (i.e., SOX, NOX, PM2.5 and PM10) are depicted in Table 3 and in Figure 4 for the five years in study. We notice a significant reduction for SOX and PMs for the last two years and this is due to new IMO Global Sulfur Cap regulation, which currently, is the most significant regulation for air emissions in shipping. SOX emissions are based on the level of sulfur content in the fuel used. To achieve a reduction in SOX and PM in the environment, the use of low-sulfur fuel is globally mandatory from 2020 unless alternative technology, such as an Exhaust Gas Cleaning System (scrubber), is employed. All vessels that operate outside Emission Control Areas (ECAs) are required to use fuel oil with a maximum sulfur content of 0.5%, while vessels operating within ECAs will be required to use fuel oil with a maximum sulfur content of 0.1%.
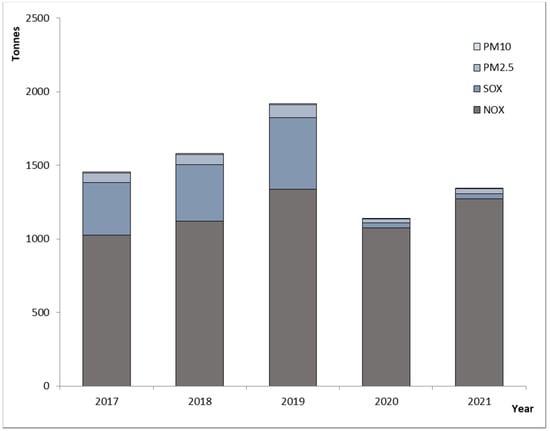
Figure 4.
Annual gaseous pollutants emissions for Souda and Heraklion ports.
2.3. Second-Level Calculation—Cost Factors—Total External Costs Estimation
In Table 4 (first line), the external cost factors for inland waterway transport of Greece are presented []. “Metropole” applies to port-cities with more than 500 thousand residents, while “City” applies to port-city population under 500 thousand and rural area is named when the port is outside of “City” or “Metropole”. In the first line of Table 4, the prices are per kg of gaseous pollutant during the year 2016. As this study focuses on the last five years (2017–2021), these cost values were adjusted using country-specific Harmonized Index of Consumer Prices (HICP). For Greece, the official authority for issuing HICP is the Hellenic Statistics Authority, and the corresponding value for 2016 is 100.02. Thus, all cost prices from 2016 onwards were adjusted based on this HICP.

Table 4.
Greece’s air pollution external costs in €/kg emission for inland waterway transport.
2.4. EU Emission Trading Scheme (ETS)
The overall EU policy regarding the reduction in maritime-originated GHG emissions focuses on the “polluters pay” principle and the implementation of the MRV system; the definition of reduction targets and the application of market-based measures [] aim at this direction with a long-term target on, including these in the EU ETS.
The estimated CO2 emissions in this study seem to be a good proxy to calculate the anticipated future cost of CO2 emissions. We could consider it as a variant of the avoidance cost approach but it is understandable that additional policy interventions are required to force users to switch to different forms of fuels and energy resources in general.
Figure 5 shows the analytical development of the market price of CO2 emissions (€/tCO2), data provided by European Energy Exchange (EEX), where the increasing trend is obvious until the end of 2020 and the strong increase for year 2021.
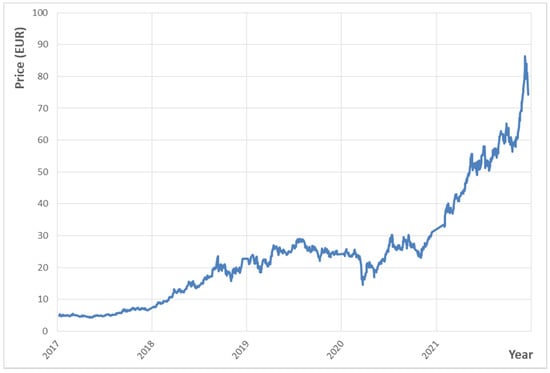
Figure 5.
EEX Emissions CO2 market (average price in EUR)—data source: [].
At this point, we have to clarify that this price is the CO2 emissions cost and not “Carbon cost”, since 3.67 tons of CO2 emissions are equivalent to one ton of carbon []. In Table 3, we presented annual CO2 emissions and the annual average market price was taken into account. In Figure 6 and Table 5, the annual market price cost of CO2 in EUR/t CO2 for years 2017 to 2021 is presented. We observe a significant annual increase, even from year to year (+168.6% from 2017 to 2018, +68% from 2018 to 2019 and +121% from 2020 to 2021) or from the first year 2017 (+340.5% from 2017 to 2019, +869.5% from 2017 to 2021).
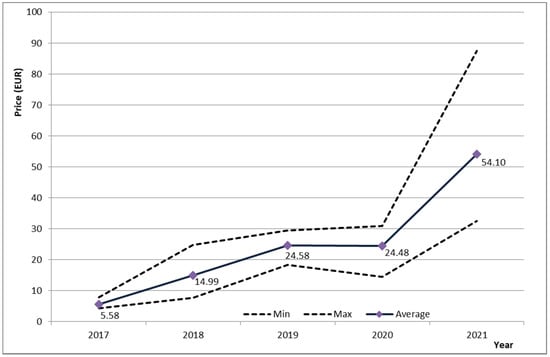
Figure 6.
Annual EEX Emissions CO2 market price (min, max and average price in EUR).

Table 5.
EEX Emissions CO2 market price for years 2017–2021 in EUR/tCO2 [].
3. Results
The application of the methodology described above (paragraphs 2.1, 2.3), in combination with air pollutants’ inventory (Table 3) and air pollution cost factors (Table 4 and Table 5), leads to the estimation of air pollutants’ external costs. The results are depicted in Table 6a for the cruise sector and Table 6b for the passenger ferries sector.

Table 6.
(a) Air emissions externalities for cruise sector of ports Souda and Heraklion. (b) Air emissions externalities for passenger ferries of ports Souda and Heraklion.
Figure 7 presents the external costs in EUR per ship call, and it is evident that the sector of passenger ferries at Heraklion port leads for all years, followed by the cruise sector at Souda port (for 2017–18–19) and cruise at Heraklion port (for 2020–21). For Souda port, the cruise sector leads with a wider difference for years 2017–18–19 and a small difference for the last year 2021.
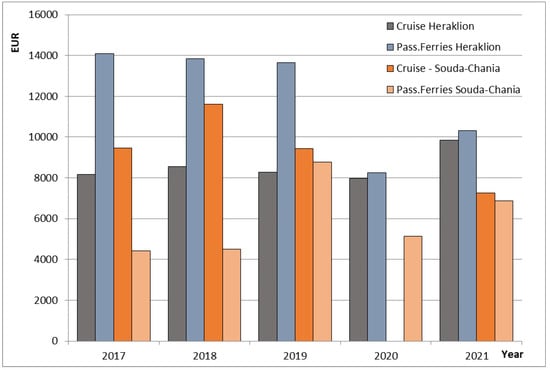
Figure 7.
External costs in EUR per ship call (2017–2021 for passenger ferries and cruise ships).
As we notice from the air emissions inventory (Table 3), there was a significant reduction in SOX and PMs for 2020–2021 due to new regulations initiated from 2020 (scrubbers, 0.5% S fuel). This reduction affected external costs also, even if at the last year (2021), CO2 price was +121% higher.
One way to understand the true cost of the externalities is by comparing them with the shipping companies’ revenues and estimate the impact they would incur if they were asked to pay this cost. Currently, this comparison is possible only for the passenger ferries sector, since there are publicly available data: average ticket fare price per transportation category of passengers, vehicles and cargo vessels, shipping companies’ annual financial statements and/or info from travel agents, which allows the calculation of the annual revenue per transportation category and route line. Table 7 depicts the total annual revenue and by combining the externalities per port and year, we can derive some important findings (last column). Thus, the externalities represent a significant amount of total revenue (about 25–35% from 2019 to 2021), which means that if shipping companies are called to pay for these costs, then a significant revenue loss will occur. Most likely, this is not something that ship owners could absorb and they would probably pass this cost to ticket fares and adopt it as “Externalities Surcharge”.

Table 7.
Annual revenue and external costs for passenger ferries (ports of Souda and Heraklion).
From this point of view, this “Externalities Surcharge” was estimated. Assuming that the total annual revenue represents the total annual external costs, then according to the revenue sharing per transportation category and year, we can share the external costs.
Using the same methodology that we followed to complete Table 7 and based on the data presented in Table 1, we calculate the percentage of annual revenue sharing, which is depicted in Table 8.

Table 8.
Sharing of annual revenue for passenger ferries per transportation category.
By combining the above data with annual external costs of passenger ferries (Table 6b), we can estimate the total annual external cost per transportation category (Table 9) and by this, it is possible to make an approach to the “Externalities surcharge”, by dividing the external cost amount, in EUR, of each category by its transportation units, provided by Table 1. This is depicted in Table 10a for Souda port and 10b for Heraklion port, where we observe a remarkable additional amount for each category.

Table 9.
Allocation of total annual external costs per transportation category (passenger ferries).

Table 10.
(a) Additional fare cost for per transportation category for passenger ferries (Souda port). (b) Additional fare cost for per transportation category for passenger ferries (Heraklion port).
This additional fare cost is a significant amount of the average fare per transportation category and corresponding surcharge percentages are depicted in Table 11.

Table 11.
Additional fare cost percentage per transportation category (passenger ferries).
4. Discussion and Conclusions
The main objective of this paper is to present an analytical methodological framework to estimate the external costs of air emissions from passenger ships. The studied ports reported significantly decreased cruise ship calls during the last two COVID-19 years (i.e., 2020 vs. 2019: −90.7% for Heraklion and −100% for Souda and 2021 vs. 2019: −43.1% for Heraklion and −52.7% for Souda) and this affected both fuel and energy consumption. Although the assumption that passenger ferries’ ship calls would decrease due to the pandemic (as happened with the cruise sector) seemed reasonable, finally, the observed reduction was not so significant (2020 vs. 2019: −3.1% for Heraklion and −4.5% for Souda and 2021 vs. 2019: −5.1% for Heraklion and −3.7% for Souda). Based on the presented results in this study, it is evident that even if the trend on all ship types (passengers, vehicles, cargo) from 2017 to 2019 is increasing, in 2020, there was a significant decrease, especially to absolute passenger numbers (around 50% for both ports) and vehicles (−39.6% for Souda and −37.9% for Heraklion), due to COVID-19 applied travel restrictions and the insecurity of people to move freely.
Even 2021 was not a recovery year, since a significant reduction was observed: in passengers −41.9% for Souda and −43.4% for Heraklion, in vehicles: −16.2% for Souda and −17.3% for Heraklion. After 2019, cargo vehicles had a decrease also, but not so large (2020: −12.8% for Souda and −5.7% for Heraklion, 2021: −1.3% for Souda and +8% for Heraklion) as for passengers and vehicles.
The most fuel-energy consuming sector, and as a consequence, the most air polluting sector per ship call, differs for the two ports: the passenger ferries dominate in terms of fuel-energy consumption in Heraklion (until 2019), while for Souda, cruise ships prevail for all years. For 2020 and 2021, the Heraklion cruise sector had a significant increase in average fuel and energy consumption in port and this is attributed to longer average duration of stay at port for the cruise vessels.
The calculated externalities in the study cover health effects, materials and building damages, biodiversity and crop losses, caused due to air emissions. We also examined and presented the annual CO2 emissions and calculated the annual market price cost of CO2 for the years 2017 to 2021, where we see a significant increase, even annually (+168.6% from 2017 to 2018, +68% from 2018 to 2019 and +121% from 2020 to 2021) or from the first year of study (+340.5% from 2017 to 2019, +869.5% from 2017 to 2021).
A useful index about externalities is the external costs in EUR per ship call (Table 6a,b—last column) where constantly, in first place per ship call is the sector of passenger ferries at Heraklion port, followed by the cruise sector at Souda port (for 2017–2019) and cruise at Heraklion port (for 2020–2021). The Souda port cruise sector is in first place (compared with passenger ferries) with wider differences for years 2017–2019 and a small difference for 2021. As we noticed, SOX and PM significantly reduced for 2020–2021 due to new regulations initiated from 2020 onward (scrubbers, 0.5% S fuel). This reduction affected external costs also, even if during the last year (2021), CO2 price was +121% higher.
From all the above, we conclude that the amount of port-related externalities is significant and when compared to revenues, it ends up being about 25–35% for the last 3 years of our study (2019 and onwards). Obviously, this is a significant revenue loss for shipping companies and assuming that ship owners will eventually pass these costs to ticket fares, an attempt was made to estimate the “Externalities surcharge” (which is defined as the burden of external costs to ticket fares per transportation category). This surcharge estimation indicates a significant additional ticket cost and, specifically, for the year 2021:
- ▪
- For Souda, about +25.5% to all transportation categories: EUR +8.13 for passengers, EUR +10.07 for vehicles and EUR +56.06 for cargo vehicles
- ▪
- For Heraklion, about +26.6 to +27% to all transportation categories: EUR +7.02 for passengers, EUR +11.31 for vehicles and EUR +68.91 for cargo vehicles.
Author Contributions
Writing—original draft preparation, E.D.; writing—review and editing, S.P. All authors have read and agreed to the published version of the manuscript.
Funding
This research received no external funding.
Institutional Review Board Statement
Not applicable.
Informed Consent Statement
Not applicable.
Data Availability Statement
Data is contained within the article.
Conflicts of Interest
The authors declare no conflict of interest.
References
- Eurostat. Maritime Passenger Statistics. 2021. Available online: https://ec.europa.eu/eurostat/statistics-explained/index.php?title=Maritime_passenger_statistics&oldid=550549#Most_EU_seaborne_passenger_transport_is_within_national_borders (accessed on 26 March 2022).
- ESPO. ESPO Environmental Report 2021. 2021. Available online: https://www.espo.be/media/ESP-2844 (Sustainability Report 2021) FINAL.pdf (accessed on 11 March 2022).
- Hellenic Statistical Authority. Urban Population in Greece. 2022. Available online: http://www.statistics.gr/documents/20181/1204266/resident_population_urban_census2011.xls (accessed on 20 February 2022).
- Perdiguero, J.; Sanz, A. Cruise activity and pollution: The case of Barcelona. Transp. Res. Part D Transp. Environ. 2020, 78, 102181. [Google Scholar] [CrossRef]
- European Environment Agency. Air Quality in Europe. 2019. Available online: https://www.eea.europa.eu/publications/air-quality-in-europe-2019 (accessed on 22 February 2022).
- European Commission, Directorate-General for Mobility and Transport; Essen, H.; Fiorello, D.; El Beyrouty, K.; Bieler, C.; van Wijngaarden, L.; Schroten, A.; Parolin, R.; Brambilla, M.; Sutter, D.; et al. Handbook on the External Costs of Transport: Version 2019–1.1; Publications Office of the European Union: Rue Mercier, Luxembourg, 2020. [Google Scholar]
- Ramalho, M.M.; Santos, T.A. The impact of the internalization of external costs in the competitiveness of short sea shipping. J. Mar. Sci. Eng. 2021, 9, 959. [Google Scholar] [CrossRef]
- European Commission. The European Green Deal. 2019. Available online: https://eur-lex.europa.eu/resource.html?uri=cellar:b828d165-1c22-11ea-8c1f-01aa75ed71a1.0022.02/DOC_1&format=PDF (accessed on 10 May 2022).
- Hofbauer, F.; Putz, L.M. External costs in inland waterway transport: An analysis of external cost categories and calculation methods. Sustainability 2020, 12, 5874. [Google Scholar] [CrossRef]
- Amann, M.; Wagner, F. A Flexibility Mechanism for Complying with National Emission Ceilings for Air Pollutants. 2014. Available online: http://pure.iiasa.ac.at/id/eprint/11149/1/XO-14-076.pdf (accessed on 10 May 2022).
- Maragkogianni, A. Combined Methodology for the Quantification of Emissions of Gaseous Pollutants by Cruise Ships. Estimation of Induced Social Costs and Evaluation of the Environmental Performance of Ports. Ph.D. Thesis, Technical University of Crete, Chania, Greece, 2017. [Google Scholar]
- Maragkogianni, A.; Papaefthimiou, S. Evaluating the social cost of cruise ships air emissions in major ports of Greece. Transp. Res. Part D Transp. Environ. 2015, 36, 10–17. [Google Scholar] [CrossRef]
- Moreno-Gutiérrez, J.; Calderay, F.; Saborido, N.; Boile, M.; Valero, R.R.; Durán-Grados, V. Methodologies for estimating shipping emissions and energy consumption: A comparative analysis of current methods. Energy 2015, 86, 603–616. [Google Scholar] [CrossRef]
- Moreno-Gutiérrez, J.; Pájaro-Velázquez, E.; Amado-Sánchez, Y.; Rodríguez-Moreno, R.; Calderay-Cayetano, F.; Durán-Grados, V. Comparative analysis between different methods for calculating on-board ship’s emissions and energy consumption based on operational data. Sci. Total Environ. 2019, 650, 575–584. [Google Scholar] [CrossRef] [PubMed]
- Trozzi, C.; de Lauretis, R. EMEP/EEA Air Pollution Emission Inventory Guidebook 2019; European Environmental Agency. 2019. Available online: https://www.eea.europa.eu/publications/emep-eea-guidebook-2019/part-b-sectoral-guidance-chapters/1-energy/1-a-combustion/1-a-3-d-navigation (accessed on 20 January 2022).
- Doundoulakis, E.; Papaefthimiou, S. A comparative methodological approach for the calculation of ships air emissions and fuel-energy consumption in two major Greek ports. Marit. Policy Manag. 2021, 86. [Google Scholar] [CrossRef]
- Papaefthimiou, S.; Sitzimis, I.; Andriosopoulos, K. A methodological approach for environmental characterization of ports. Marit. Policy Manag. 2017, 44, 81–93. [Google Scholar] [CrossRef]
- Hellenic Ports Association. Greekcruise.gr. Hellenic Ports Association. 2022. Available online: http://www.greekcruise.gr/index.php/routes (accessed on 31 March 2022).
- MedCruise. Cruise Activities in MedCruise Ports-Statistics 2019. 2019. Available online: https://www.medcruise.com/wp-content/uploads/2020/09/0-MEDCRUISE-STATISTICS-2019-FINAL-v22.pdf (accessed on 22 February 2022).
- Third IMO GHG Study. Third IMO GHG Study 2015. 2014. Available online: https://wwwcdn.imo.org/localresources/en/OurWork/Environment/Documents/Third Greenhouse Gas Study/GHG3 Executive Summary and Report.pdf (accessed on 15 January 2022).
- Fourth IMO GHG Study. Fourth IMO GHG Study 2020. 2020. Available online: https://wwwcdn.imo.org/localresources/en/MediaCentre/Documents/Fourth IMO GHG Study 2020 Executive Summary.pdf (accessed on 20 January 2022).
- European Commission. Integrating Maritime Transport Emissions in the EU’s Greenhouse Gas Reduction Policies. 2013. Available online: https://ec.europa.eu/clima/sites/clima/files/transport/shipping/docs/com_2013_479_en.pdf (accessed on 1 February 2022).
- EEX. European Energy Exchange. 2022. Available online: https://www.eex.com/en/ (accessed on 28 March 2022).
- OECD. Effective Carbon Rates on Energy. 2016. Available online: https://www.oecd.org/tax/tax-policy/effective-carbon-rates-on-energy.pdf (accessed on 1 February 2022).
- EEX. EEX Auction Market. 2022. Available online: https://www.eex.com/en/market-data/environmental-markets/auction-market (accessed on 31 March 2022).
Publisher’s Note: MDPI stays neutral with regard to jurisdictional claims in published maps and institutional affiliations. |
© 2022 by the authors. Licensee MDPI, Basel, Switzerland. This article is an open access article distributed under the terms and conditions of the Creative Commons Attribution (CC BY) license (https://creativecommons.org/licenses/by/4.0/).