BACE and BMA Variable Selection and Forecasting for UK Money Demand and Inflation with Gretl


Abstract
1. Introduction
2. The BACE Method
3. The BMA Method
BACE and BMA in Gretl
4. Autometrics
5. Empirical Results
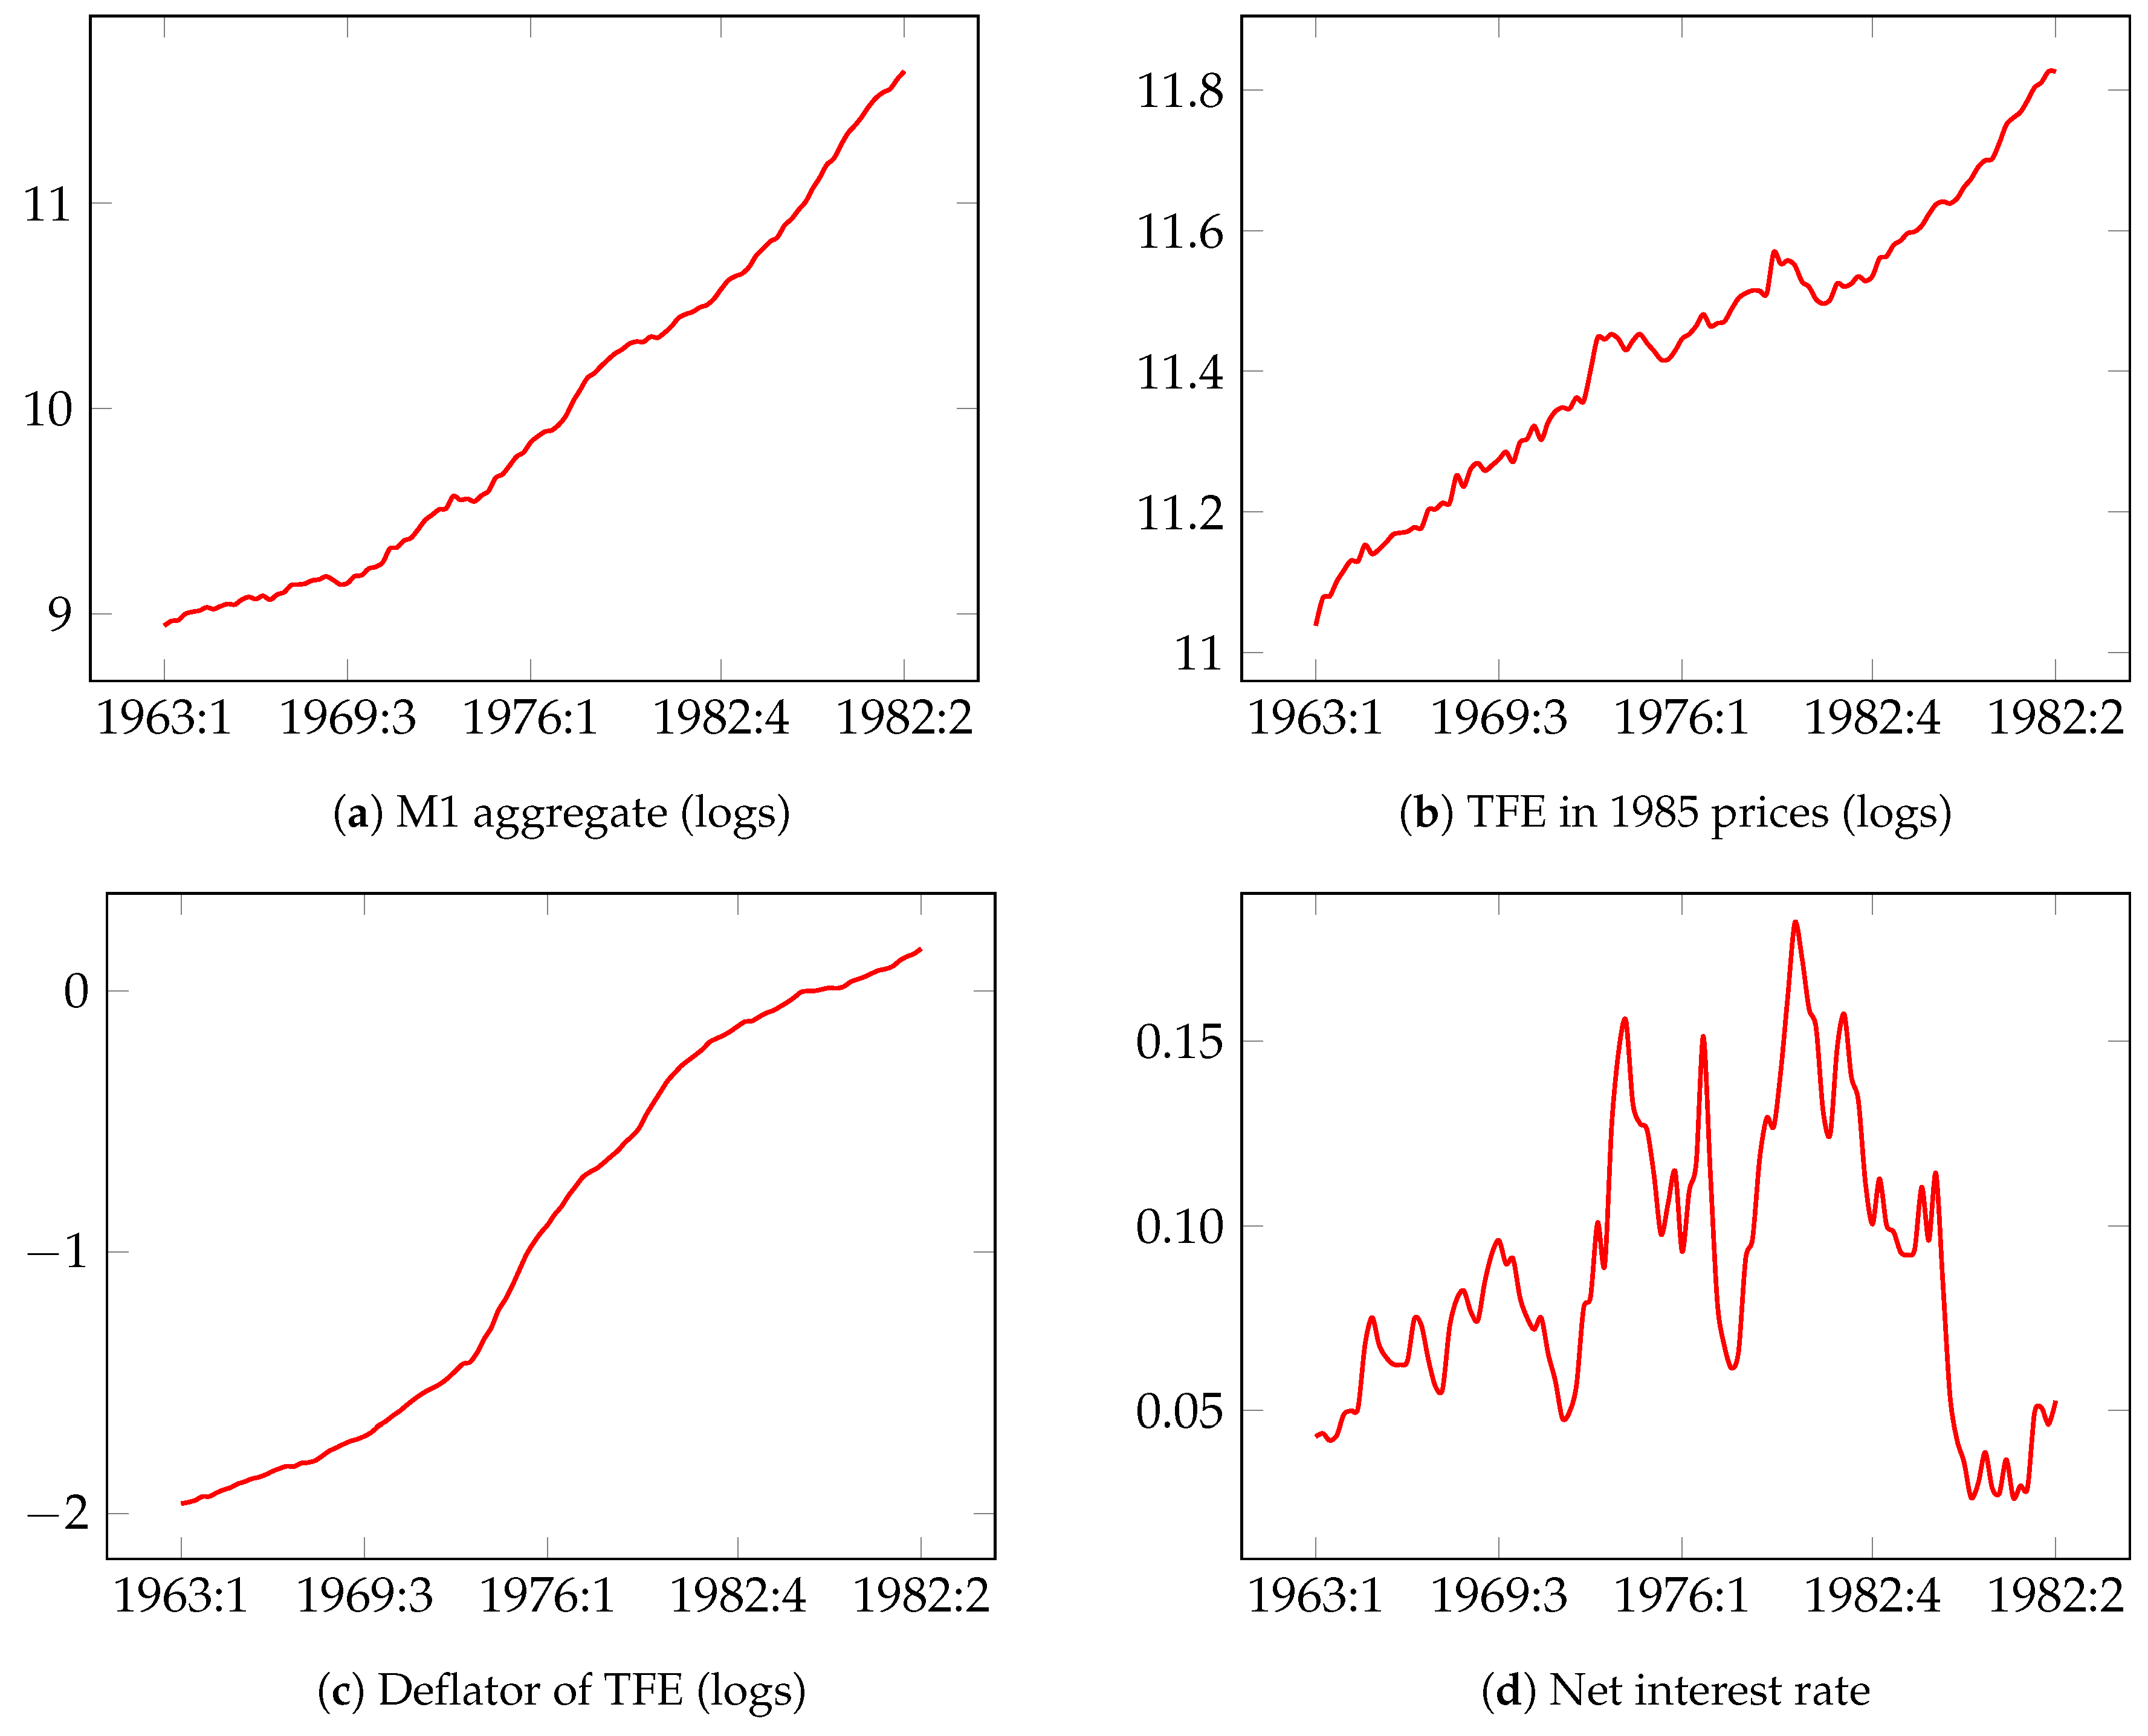
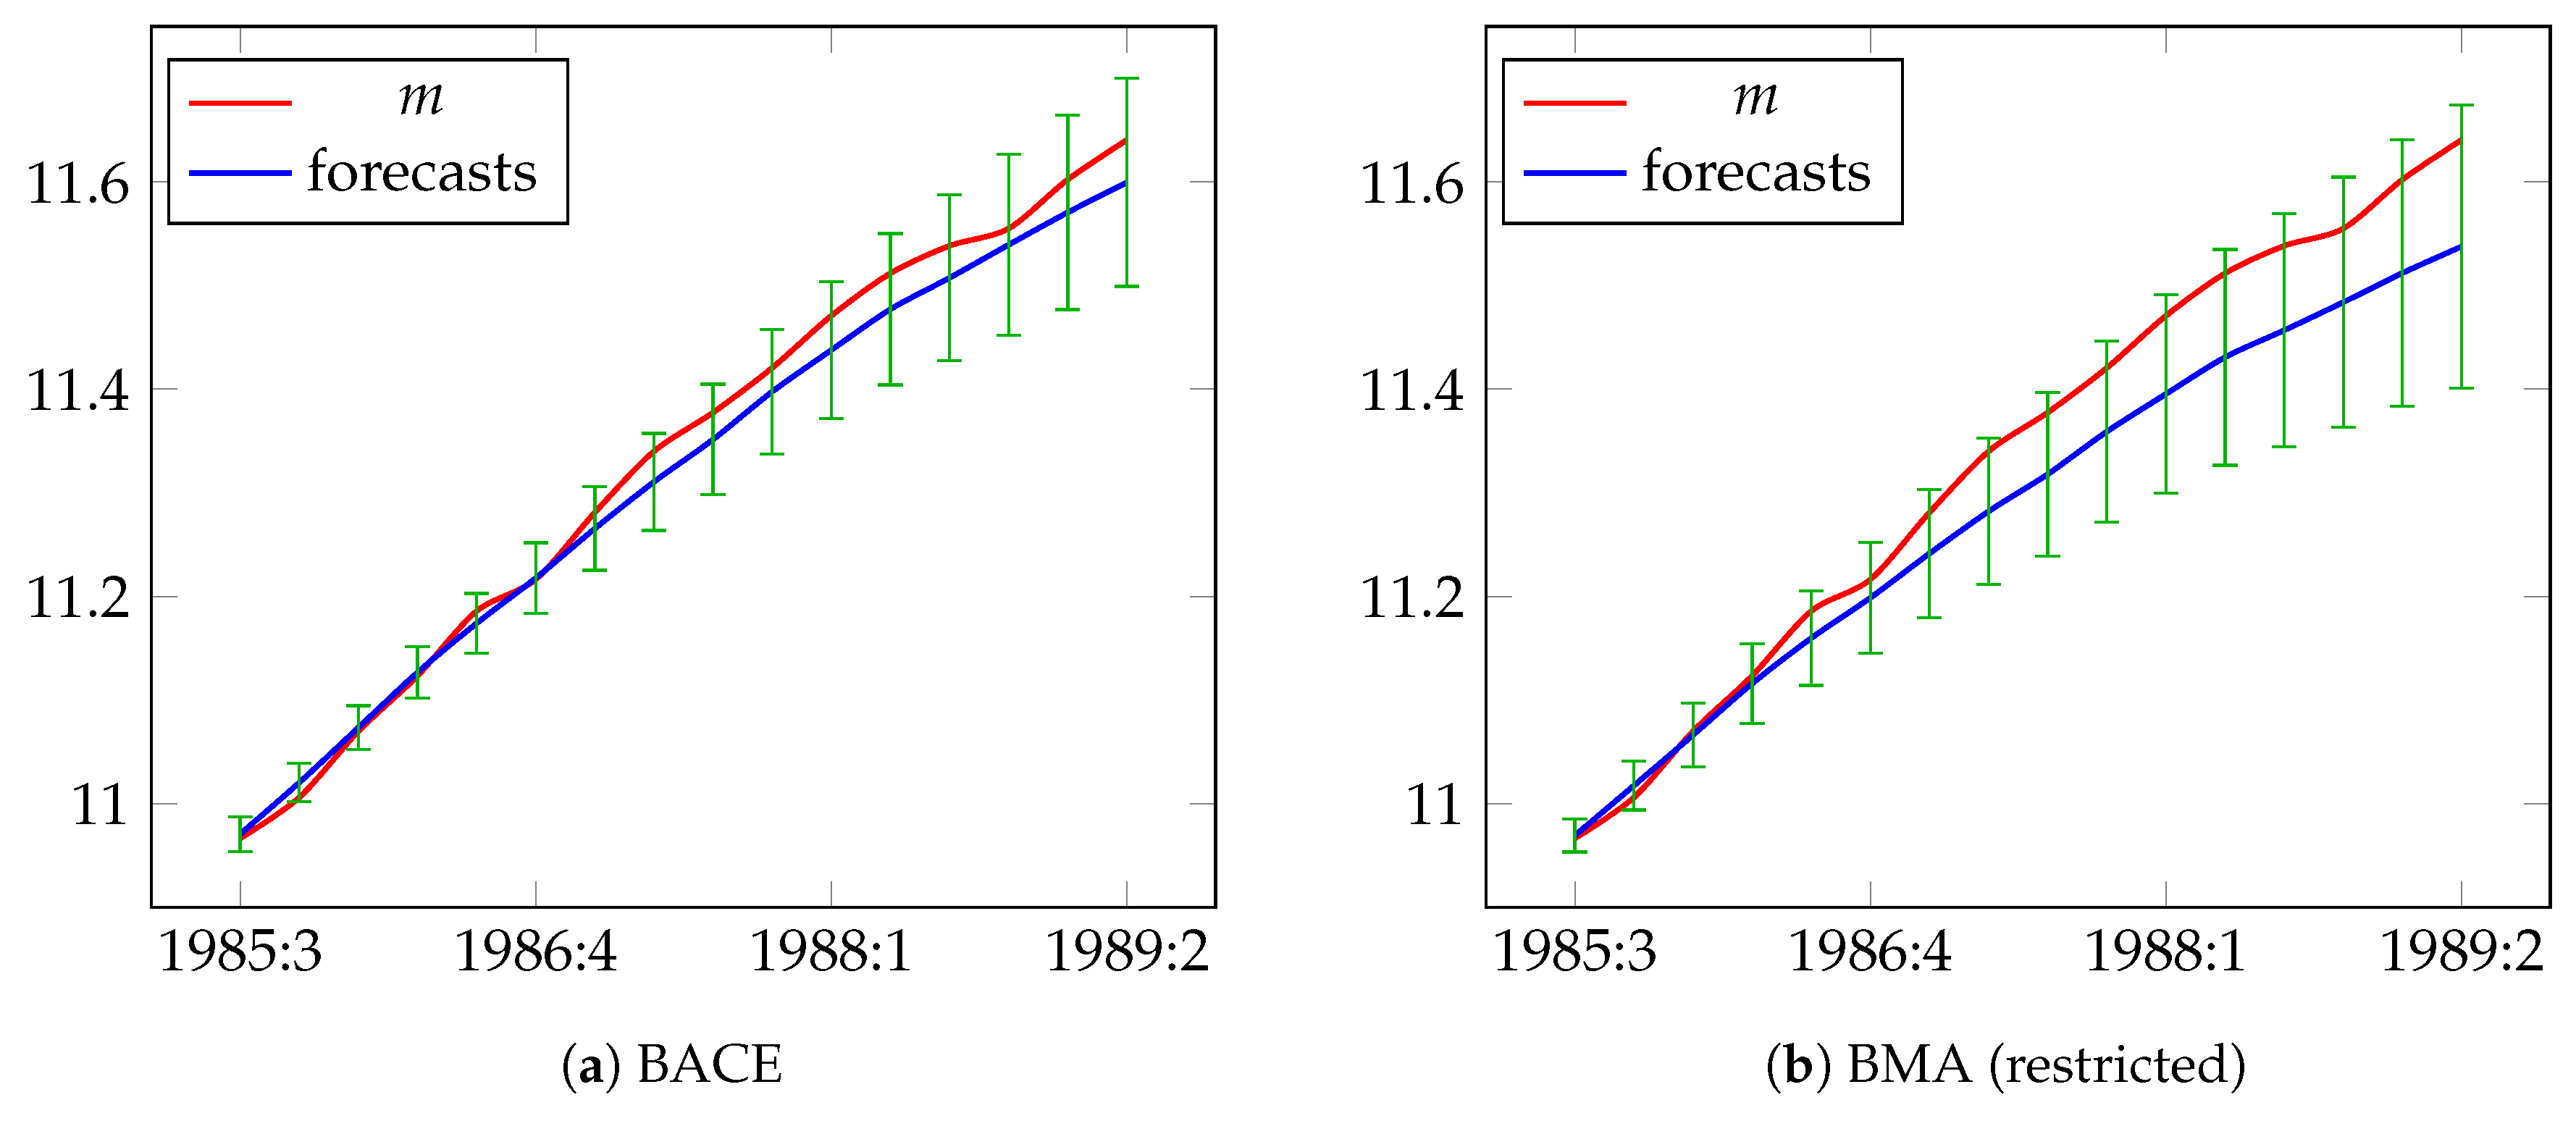
5.1. Modeling and Forecasting Demand for Narrow Money in the UK: UKM1
- : nominal narrow money, M1 aggregate in million £,
- : real total final expenditure (TFE) for 1985 prices in million £,
- : deflator of TFE,
- : net interest rate of the cost of holding money (calculated as the difference between the three-month interest rate and learning-adjusted own interest rate).
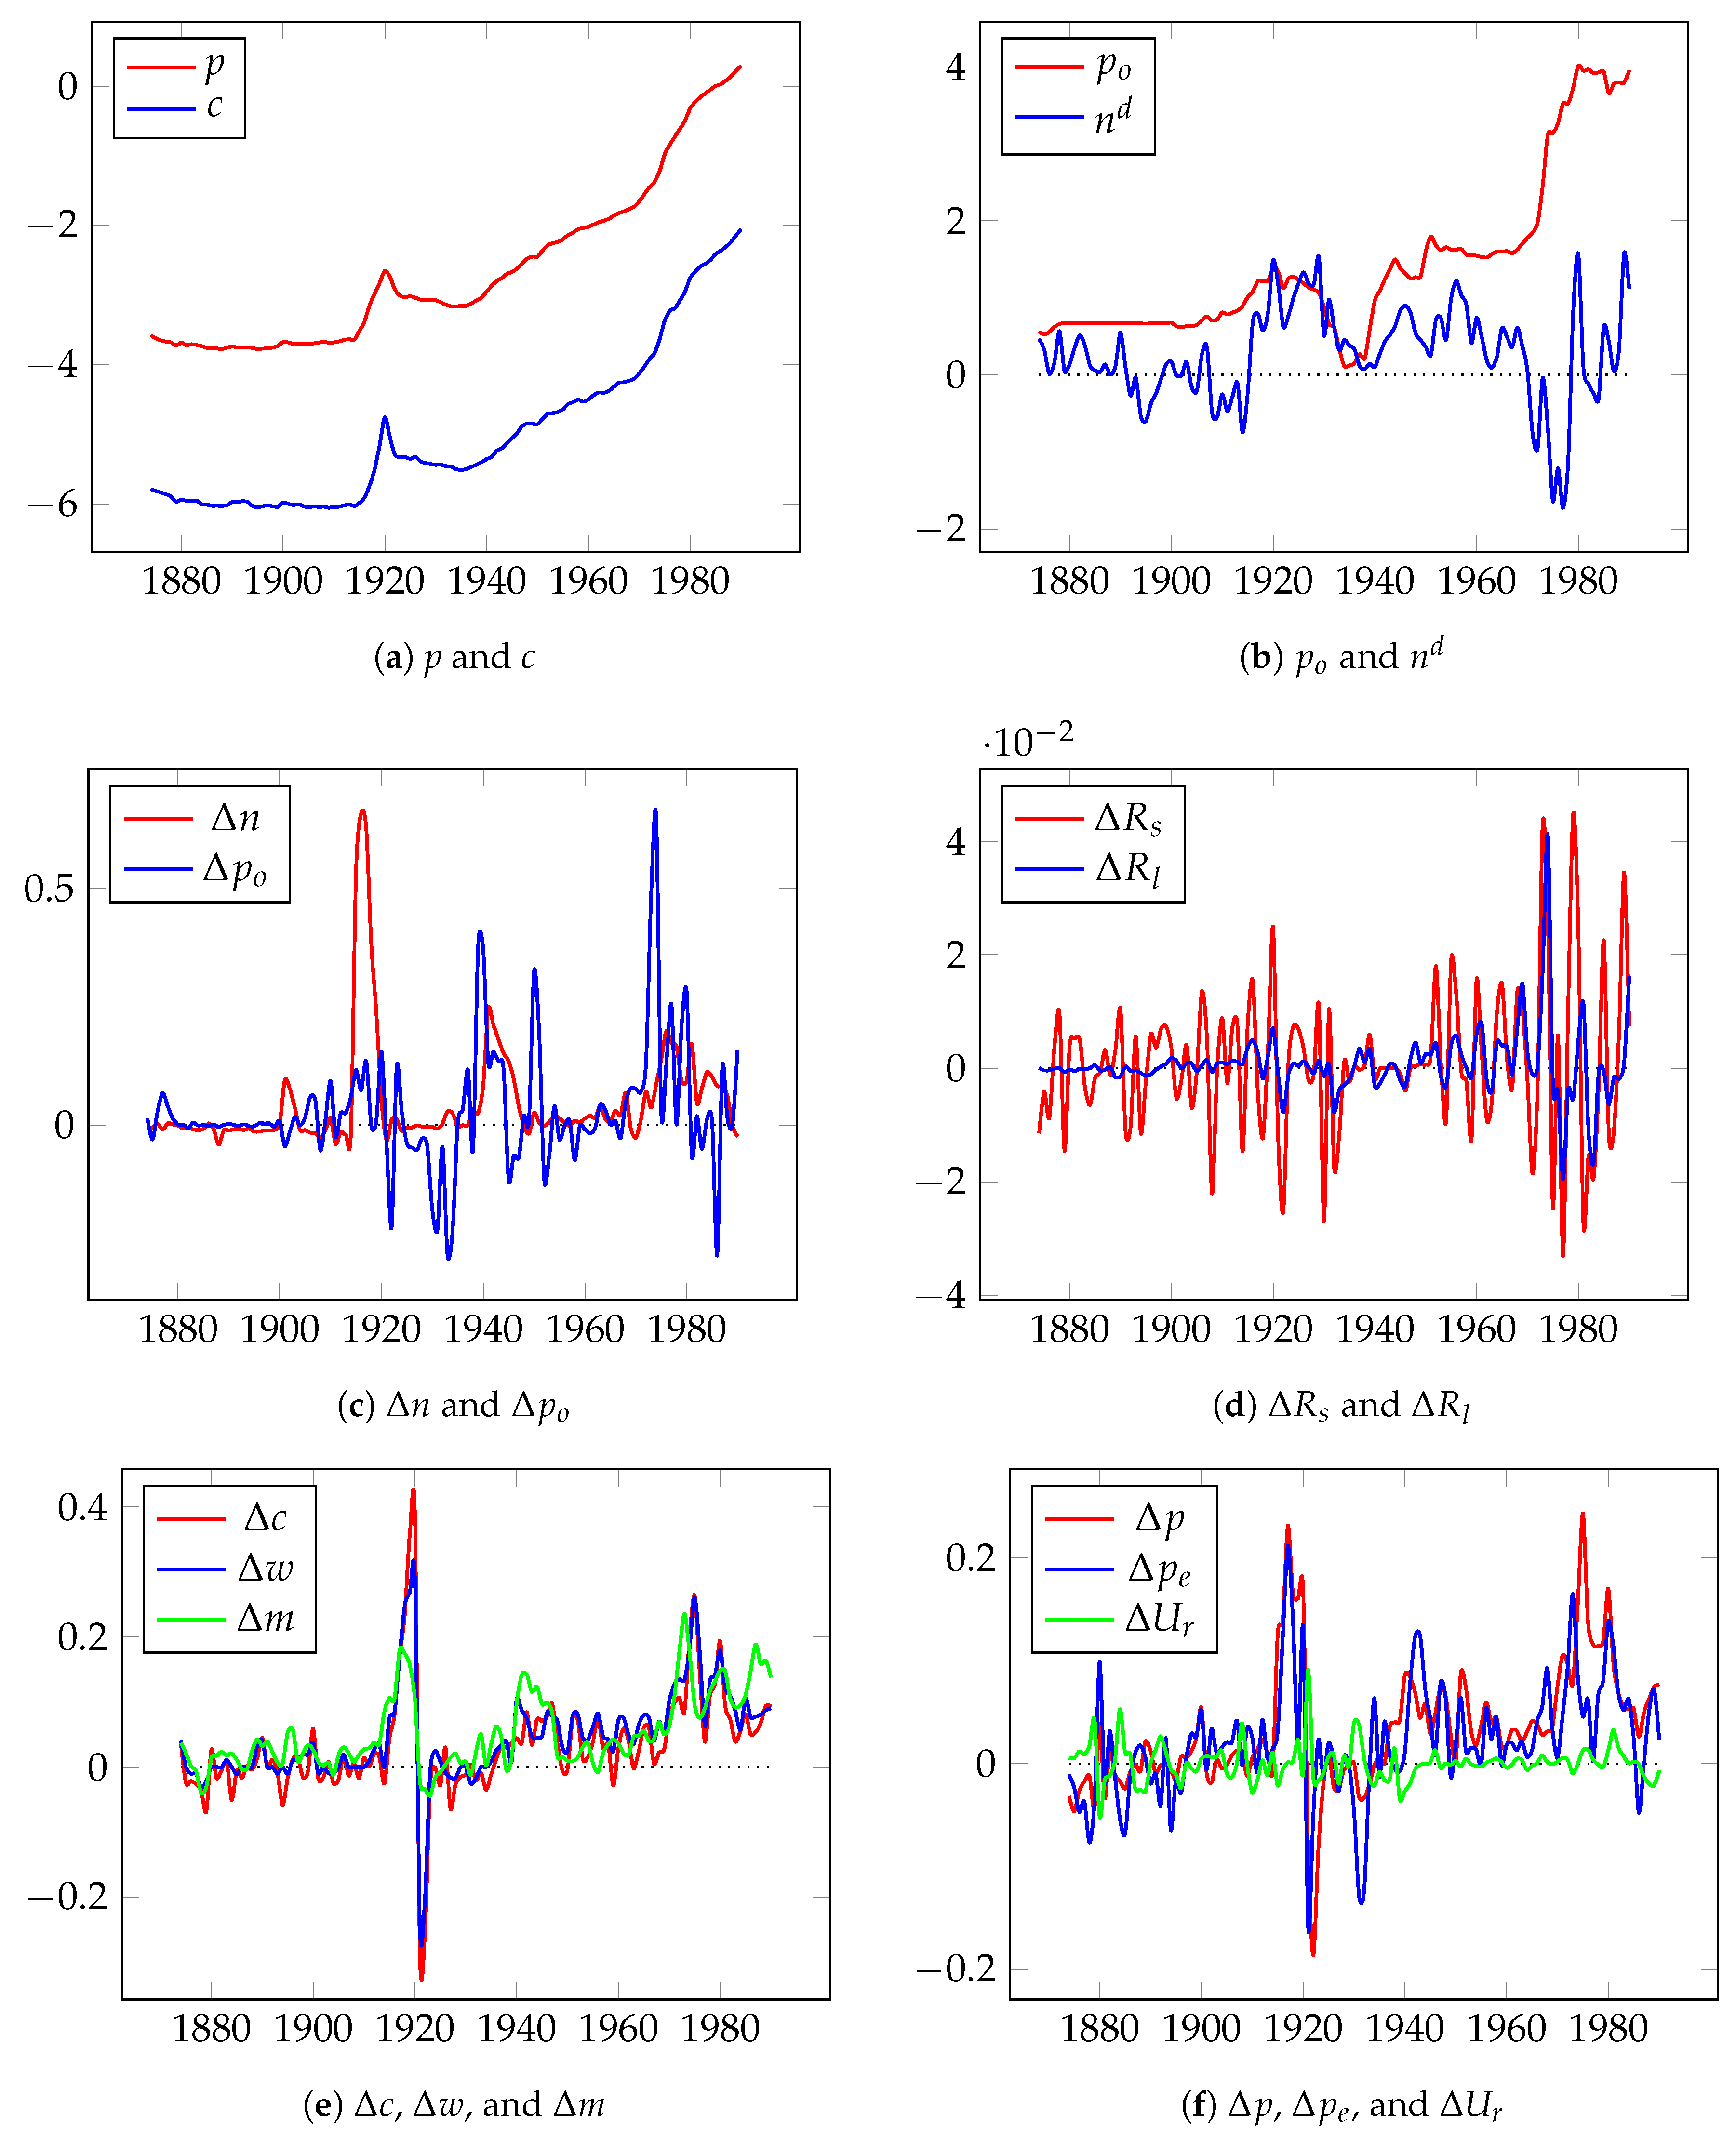
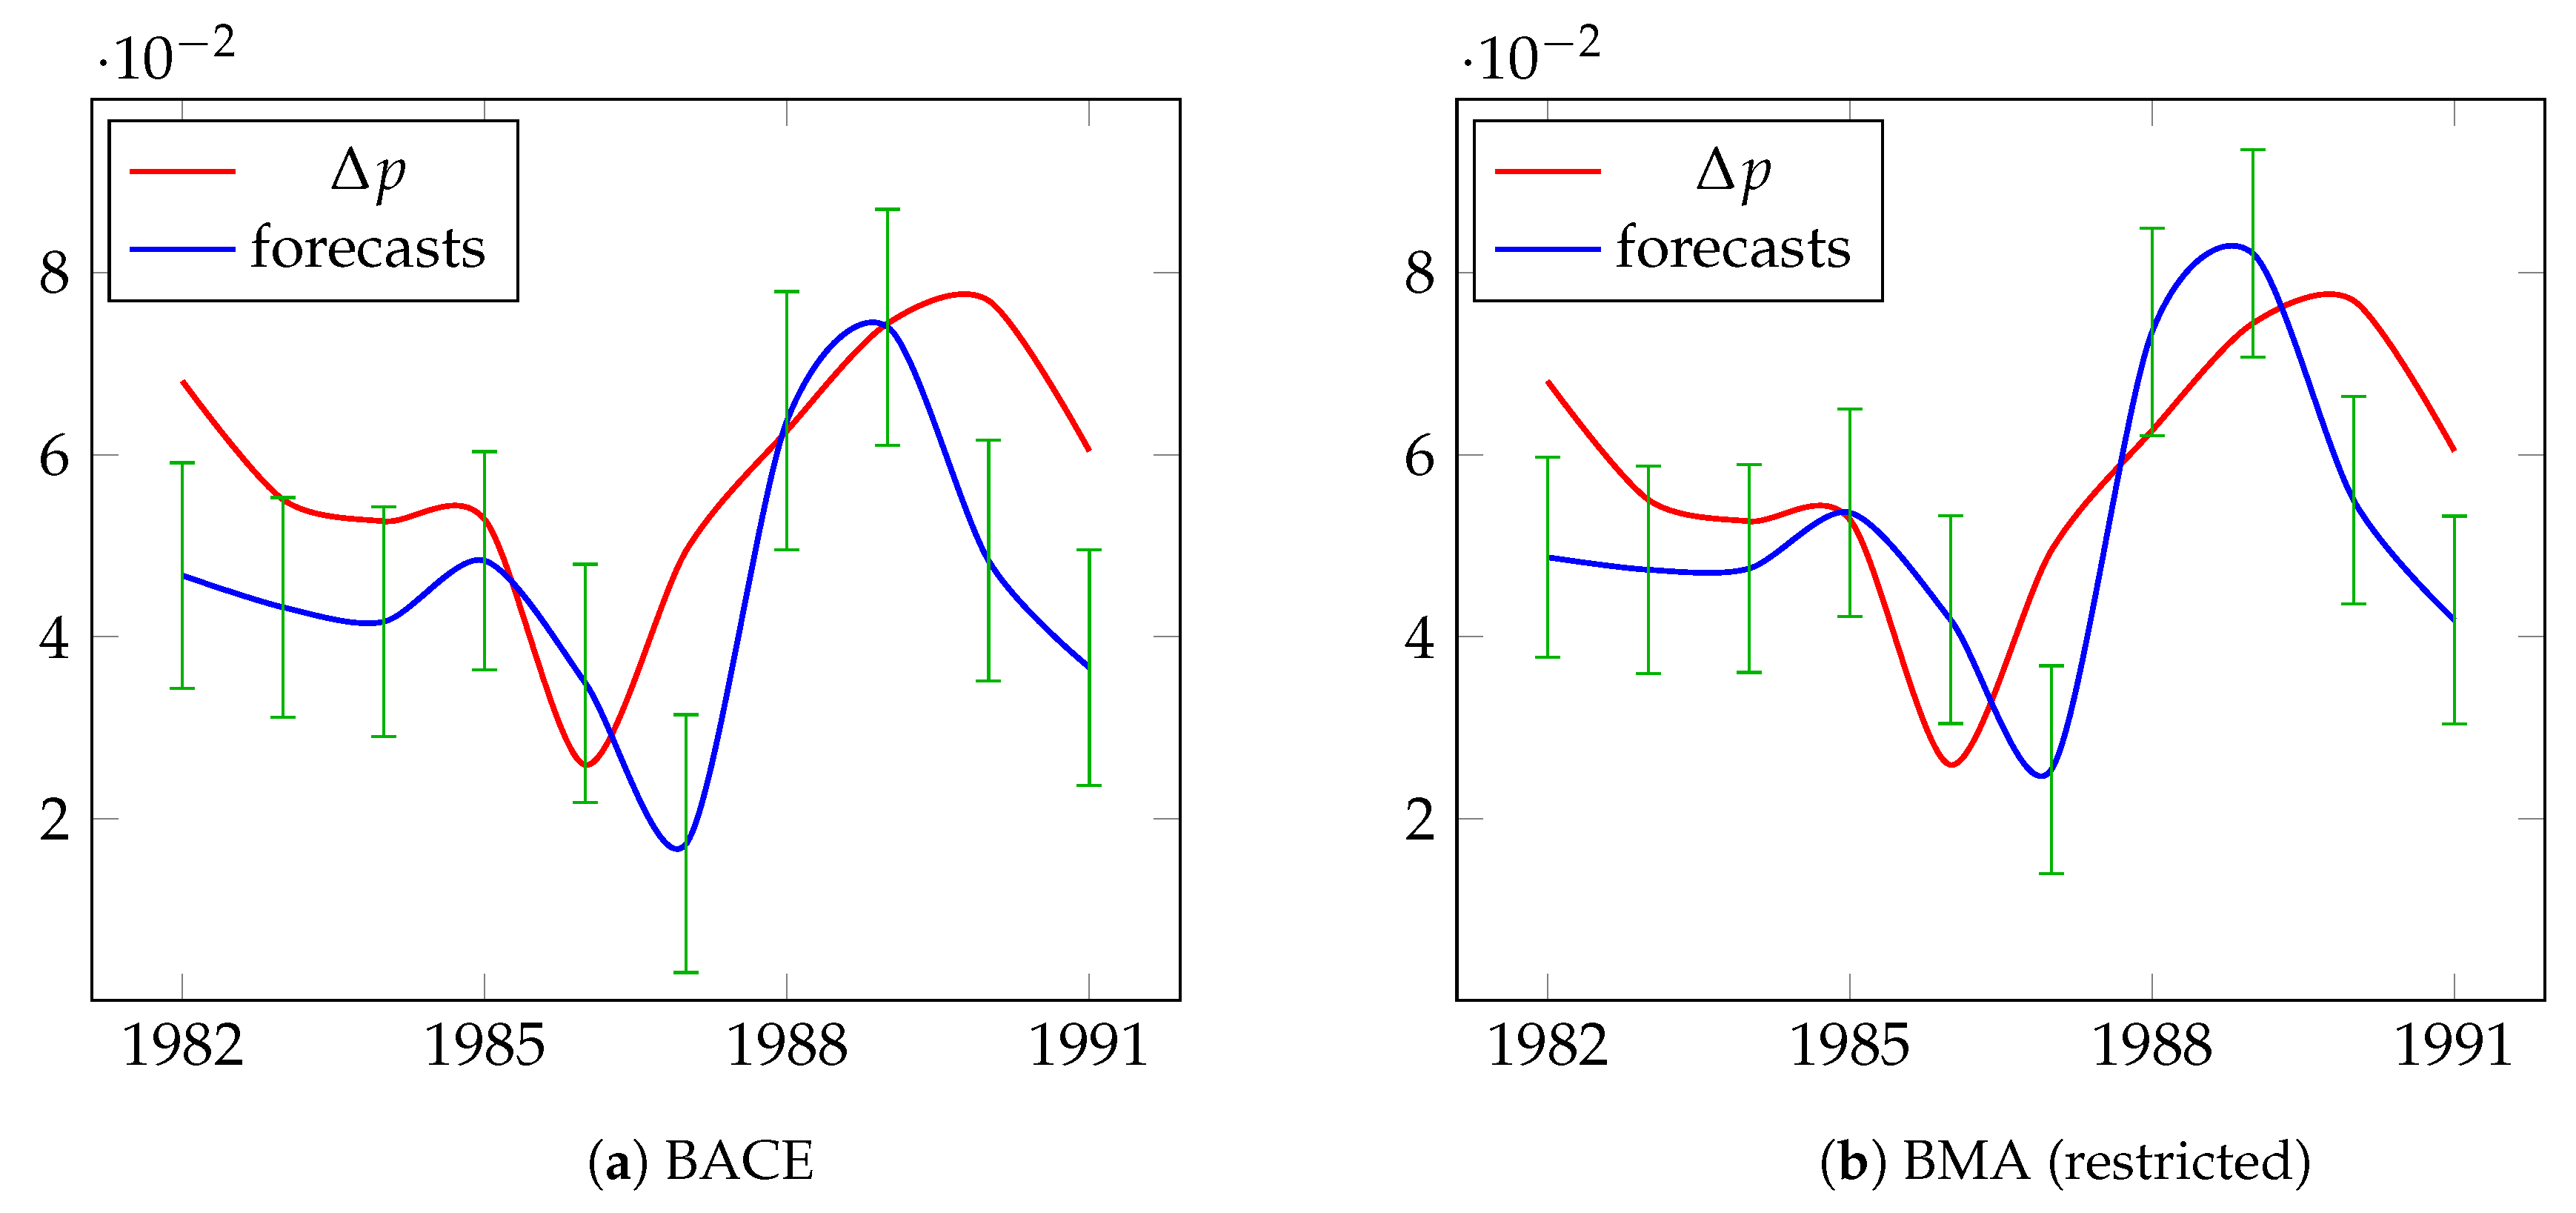
5.2. Modeling and Forecasting Long-Term UK Inflation
6. Robustness and Run Time Analysis
6.1. Robustness
6.2. BACE and BMA Run Times
7. Conclusions
Supplementary Materials
Author Contributions
Funding
Acknowledgments
Conflicts of Interest
Abbreviations
| ADL | Autoregressive Distributed Lag |
| BACE | Bayesian Averaging of Classical Estimates |
| BMA | Bayesian Model Averaging |
| DGP | Data Generating Process |
| GDP | Gross Domestic Product |
| GUI | Graphical User Interface |
| GUM | General Unrestricted Model |
| LDGP | Local Data Generating Process |
| MAPE | Mean Absolute Percentage Error |
| MPI | Message Passing Interface |
| MC3 | Markov Chain Monte Carlo Model Composition |
| RMSE | Root-Mean-Square Error |
| TFE | Total Final Expenditure |
| UKM1 | Model for M1 Money Demand in UK |
References
- Ackah, Ishmael, and McCmari Asomani. 2015. Empirical Analysis of Renewable Energy Demand in Ghana with Autometrics. International Journal of Energy Economics and Policy 5: 754–58. [Google Scholar]
- Albis, Manuel Leonard F., and Dennis S. Mapa. 2014. Bayesian Averaging of Classical Estimates in Asymmetric Vector Autoregressive (AVAR) Models. MPRA Paper 55902. Munich: University Library of Munich. [Google Scholar]
- Barbieri, Maria Maddalena, and James O. Berger. 2004. Optimal predictive model selection. The Annals of Statistics 32: 870–97. [Google Scholar] [CrossRef]
- Bergh, Andreas, and Martin Karlsson. 2010. Government size and growth: Accounting for economic freedom and globalization. Public Choice 142: 195–213. [Google Scholar] [CrossRef]
- Białowolski, Piotr, Tomasz Kuszewski, and Bartosz Witkowski. 2014. Bayesian averaging of classical estimates in forecasting macroeconomic indicators with application of business survey data. Empirica 41: 53–68. [Google Scholar] [CrossRef]
- Błażejowski, Marcin, Jacek Kwiatkowski, and Jakub Gazda. 2019. Sources of Economic Growth: A Global Perspective. Sustainability 11: 275. [Google Scholar] [CrossRef]
- Błażejowski, Marcin, Paweł Kufel, and Jacek Kwiatkowski. 2020. Model simplification and variable selection: A Replication of the UK inflation model by Hendry (2001). In Journal of Applied Econometrics. forthcoming. [Google Scholar] [CrossRef]
- Błażejowski, Marcin, and Jacek Kwiatkowski. 2018. Bayesian Averaging of Classical Estimates (BACE) for gretl. Gretl Working Papers 6. Ancona, Italy: Dipartimento di Scienze Economiche e Sociali, Universita’ Politecnica delle Marche (I). [Google Scholar]
- Błażejowski, Marcin, and Jacek Kwiatkowski. 2020. Bayesian Model Averaging for Autoregressive Distributed Lag (BMA_ADL) in gretl. MPRA Paper 98387. Munich: University Library of Munich. [Google Scholar]
- Castle, Jennifer L., Jurgen A. Doornik, and David F. Hendry. 2012. Model selection when there are multiple breaks. Journal of Econometrics 169: 239–46. [Google Scholar] [CrossRef]
- Clements, Michael P., and David F. Hendry. 2008. Forecasting Annual UK Inflation Using an Econometric Model over 1875–1991. In Frontiers of Economics and Globalization. Bingley: Emerald Publishing, vol. 3, pp. 3–39. [Google Scholar] [CrossRef]
- Cottrell, Allin, and Riccardo Lucchetti. 2019a. Gretl + MPI. October. Available online: http://ricardo.ecn.wfu.edu/~cottrell/gretl/gretl-mpi.pdf (accessed on 27 April 2020).
- Cottrell, Allin, and Riccardo Lucchetti. 2019b. A Hansl Primer. December. Available online: http://ricardo.ecn.wfu.edu/pub/gretl/manual/PDF/hansl-primer-a4.pdf (accessed on 27 April 2020).
- Cottrell, Allin, and Riccardo Lucchetti. 2020. Gretl User’s Guide. January. Available online: http://ricardo.ecn.wfu.edu/pub/gretl/gretl-guide.pdf (accessed on 27 April 2020).
- Cuaresma, Jesus Crespo, and Gernot Doppelhofer. 2007. Nonlinearities in cross-country growth regressions: A Bayesian Averaging of Thresholds (BAT) approach. Journal of Macroeconomics 29: 541–54. [Google Scholar] [CrossRef][Green Version]
- Desboulets, Loann David Denis. 2018. A Review on Variable Selection in Regression Analysis. Econometrics 6: 45. [Google Scholar] [CrossRef]
- Doan, Thomas, Robert Litterman, and Christopher Sims. 1984. Forecasting and conditional projection using realistic prior distributions. Econometric Reviews 3: 1–100. [Google Scholar] [CrossRef]
- Doornik, Jurgen A. 2009. Autometrics. In The Methodology and Practice of Econometrics: A Festschrift in Honour of David F. Hendry. Number 9780199237197 in OUP Catalogue. Edited by Jennifer Castle and Neil Shephard. Oxford: Oxford University Press. [Google Scholar] [CrossRef]
- Doornik, Jurgen A., and David F. Hendry. 2013. Empirical Econometric Modelling using PcGive: Volume I. London: Timberlake Consultants Press. [Google Scholar]
- Drachal, Krzysztof. 2018. Dynamic Model Averaging in Economics and Finance with fDMA: A Package for R. Warsaw: Faculty of Economic Sciences, University of Warsaw. [Google Scholar]
- Ericsson, Neil R., and Steven B. Kamin. 2009. Constructive Data Mining: Modelling Argentine Broad Money Demand. In The Methodology and Practice of Econometrics. Oxford: Oxford University Press, pp. 412–40. [Google Scholar] [CrossRef]
- Feldkircher, Martin. 2012. Forecast combination and Bayesian model averaging: A prior sensitivity analysis. Journal of Forecasting 31: 361–76. [Google Scholar] [CrossRef]
- Fernández, Carmen, Eduardo Ley, and Mark F. J. Steel. 2001a. Benchmark Priors for Bayesian Model Averaging. Journal of Econometrics 100: 381–427. [Google Scholar] [CrossRef]
- Fernández, Carmen, Eduardo Ley, and Mark F. J. Steel. 2001b. Model uncertainty in cross-country growth regressions. Journal of Applied Econometrics 16: 563–76. [Google Scholar] [CrossRef]
- Fragoso, Tiago M., Wesley Bertoli, and Francisco Louzada. 2018. Bayesian Model Averaging: A Systematic Review and Conceptual Classification. International Statistical Review 86: 1–28. [Google Scholar] [CrossRef]
- Hendry, David F. 1995. Dynamic Econometrics. Oxford: Oxford University Press. [Google Scholar] [CrossRef]
- Hendry, David F. 2001. Modelling UK Inflation, 1875–1991. Journal of Applied Econometrics 16: 255–75. [Google Scholar] [CrossRef]
- Hendry, David F. 2011. Revisiting UK consumers’ expenditure: Cointegration, breaks and robust forecasts. Applied Financial Economics 21: 19–32. [Google Scholar] [CrossRef]
- Hendry, David F. 2015. Introductory Macro-Econometrics: A New Approach. London: Timberlake Consultants. [Google Scholar]
- Hendry, David F., and Jurgen A. Doornik. 2014. Empirical Model Discovery and Theory Evaluation: Automatic Selection Methods in Econometrics. Cambridge: Mit Press. [Google Scholar]
- Hendry, David F., and Neil R. Ericsson. 1991. Modeling the demand for narrow money in the United Kingdom and the United States. European Economic Review 35: 833–81. [Google Scholar] [CrossRef]
- Hendry, David F., Massimiliano Marcellino, and Grayham E. Mizon. 2008. Special issue on encompassing. Oxford Bulletin of Economics and Statistics 70: 711–938. [Google Scholar] [CrossRef]
- Hendry, David F., and Bent Nielsen. 2012. Econometric Modeling: A Likelihood Approach. Princeton: Princeton University Press. [Google Scholar]
- Hoeting, Jennifer A., David Madigan, Adrian E. Raftery, and Chris T. Volinsky. 1999. Bayesian model averaging: A tutorial. Statistical Science 14: 382–401. [Google Scholar] [CrossRef]
- Jones, Garett, and W. Joel Schneider. 2006. Intelligence, human capital, and economic growth: A Bayesian Averaging of Classical Estimates (BACE) approach. Journal of Economic Growth 11: 71–93. [Google Scholar] [CrossRef]
- Kamarudin, Nur Azulia, and Suzilah Ismail. 2016. Model selection approaches of water quality index data. Global Journal of Pure and Applied Mathematics 12: 1821–29. [Google Scholar]
- Koop, Gary. 2003. Bayesian Econometrics. Chichester: John Wiley & Sons Ltd. [Google Scholar]
- Koop, Gary, Dale J. Poirier, and Justin L. Tobias. 2007. Bayesian Econometric Methods. New York: Cambridge University Press. [Google Scholar]
- Krolzig, Hans-Martin, and David F. Hendry. 2001. Computer automation of general-to-specific model selection procedures. Journal of Economic Dynamics and Control 25: 831–66. [Google Scholar] [CrossRef]
- Leamer, Edward. 1978. Specification Searches. Hoboken: John Wiley & Sons. [Google Scholar]
- Ley, Eduardo, and Mark F. J. Steel. 2009. On the effect of prior assumptions in Bayesian model averaging with applications to growth regression. Journal of Applied Econometrics 24: 651–74. [Google Scholar] [CrossRef]
- Mapa, Dennis S., and Kristine Joy S. Briones. 2007. Robustness procedures in economic growth regression models. Philippine Review of Economics 44: 71–84. [Google Scholar]
- Marczak, Martyna, and Tommaso Proietti. 2016. Outlier detection in structural time series models: The indicator saturation approach. International Journal of Forecasting 32: 180–202. [Google Scholar] [CrossRef]
- Mitchell, Toby J., and John. J. Beauchamp. 1988. Bayesian variable selection in linear regression. Journal of the American Statistical Association 83: 1023–32. [Google Scholar] [CrossRef]
- Osiewalski, Jacek, and Mark F. J. Steel. 1993. Una perspectiva bayesiana en selección de modelos. Cuadernos Económicos de ICE 55: 327–51. [Google Scholar]
- Raftery, Adrian E., Miroslav Kárný, and Pavel Ettler. 2010. Online Prediction Under Model Uncertainty via Dynamic Model Averaging: Application to a Cold Rolling Mill. Technometrics 52: 52–66. [Google Scholar] [CrossRef]
- Raftery, Adrian E., David Madigan, and Jennifer A. Hoeting. 1997. Bayesian model averaging for linear regression models. Journal of the American Statistical Association 92: 179–91. [Google Scholar] [CrossRef]
- Sala-i-Martin, Xavier, Gernot Doppelhofer, and Ronald I. Miller. 2004. Determinants of Long-Term Growth: A Bayesian Averaging of Classical Estimates (BACE) Approach. American Economic Review 94: 813–35. [Google Scholar] [CrossRef]
- Simo-Kengne, Beatrice D. 2016. What Explains the Recent Growth Performance in Sub-Saharan Africa? Results from a Bayesian Averaging of Classical Estimates (BACE) Approach. Ersa Working Paper. Cape Town, South Africa: Economic Research Southern Africa. [Google Scholar]
- Steel, Mark F. J. 2019. Model Averaging and Its Use in Economics. Journal of Economic Literature. forthcoming. [Google Scholar]
- Theil, Henri. 1966. Applied Economic Forecasting. Amsterdam: North-Holland. [Google Scholar]
- van Dijk, Dick. 2004. Forecasting US Inflation Using Model Averaging. In Econometric Society 2004 Australasian Meetings. Cleveland: Econometric Society. [Google Scholar]
- Wasserman, Larry. 2000. Bayesian model selection and model averaging. Journal of Mathematical Psychology 44: 92–107. [Google Scholar] [CrossRef] [PubMed]
- Zellner, Arnold. 1971. An Introduction to Bayesian Inference in Econometrics. New York: John Wiley & Sons. [Google Scholar]
- Zellner, Arnold. 1986. On Assessing Prior Distributions and Bayesian Regression Analysis with g-Prior Distributions. In Bayesian Inference and Decision Techniques: Essays in Honor of Bruno de Finetti. Edited by Prem K. Goel and Arnold Zellner. Amsterdam and Holland: Elsevier. [Google Scholar]
| 1. | BACE is implicitly based on fixed Zellner’s g-prior, whereas, in the BMA framework, g-prior can be set explicitly. |
| 2. | The BACE 2.0 package is available at http://ricardo.ecn.wfu.edu/gretl/cgi-bin/gretldata.cgi?opt=SHOW_FUNCS and was developed by co-authors (see Błażejowski and Kwiatkowski 2018). |
| 3. | Gretl is an open-source software for econometric analysis and is available at http://gretl.sf.net. |
| 4. | The BMA_ADL package for gretl is available in Supplementary Materials along with scripts to replicate all analysis. |
| 5. | MPI is a standard that supports running a given program simultaneously on several CPU cores, so it supports a very flexible type of parallelism of Monte Carlo integration see (Cottrell and Lucchetti 2020, 2019a). |
| 6. | We used gretl version 2019d-git and PcGive version 14.2 with Ox Professional version 7.20 on a PC machine running under Debian GNU/Linux 64 bits. |
| 7. | Exogeneity of variables used in UKM1 model is discussed in (Hendry and Nielsen 2012, pp. 266–67; Hendry 1995, pp. 605–6; Hendry 2015, pp. 127–33) and the results show that modeling demand for narrow money in UK as a single equation is valid in general. |
| 8. | All data were retrieved from https://www.nuffield.ox.ac.uk/media/2502/dynects.zip. |
| 9. | Authors understand ‘reduction’ as a structured path of elimination insignificant variables based on t-statistics together with pre-search analysis and encompassing tests. |
| 10. | All series are freely available in the Journal of Applied Econometrics Data Archive at http://qed.econ.queensu.ca/jae/2001-v16.3/hendry. Exogeneity of variables used in this model is mentioned in (Hendry 2001, p. 261; Hendry 2015, p. 150). |
| 11. | The full replication of this model using the BACE approach, together with a detailed discussion on variable selection strategy and discovering the reduction path, is presented in Błażejowski et al. (2020). |
| 12. | All computations were performed on so-called haavelmo machine (located at Dipartimento di Scienze Economiche e Sociali (DiSES), Ancona, Italy) which consists on 20 Hyper-Threaded Intel® Xeon® CPU E5-2640 v4 @ 2.40GHz with 256 GB operational memory running under Debian GNU/Linux 64 bits. |


| Variable | BACE | BMA (Restricted) | BMA (Unrestricted) | Autometrics | |||||||
|---|---|---|---|---|---|---|---|---|---|---|---|
| PIP | Avg. | Avg. | PIP | Avg. | Avg. | PIP | Avg. | Avg. | Coeff. | Std. | |
| Mean | Std. Dev. | Mean | Std. Dev. | Mean | Std. Dev. | Error | |||||
| 1.0000 | 0.7656 | 0.1233 | 1.0000 | 0.8334 | 0.0963 | 1.0000 | 0.8286 | 0.1003 | 0.8710 | 0.0221 | |
| 0.3590 | 0.0712 | 0.1186 | 0.1991 | 0.0357 | 0.0858 | 0.2138 | 0.0389 | 0.0894 | |||
| 0.1511 | −0.0101 | 0.0594 | 0.0565 | −0.0013 | 0.0284 | 0.0663 | −0.0020 | 0.0309 | |||
| 0.4107 | 0.0659 | 0.1003 | 0.1463 | 0.0170 | 0.0539 | 0.1759 | 0.0212 | 0.0601 | |||
| 0.6676 | 0.1590 | 0.1624 | 0.6164 | 0.1026 | 0.1164 | 0.6485 | 0.1129 | 0.1217 | 0.1140 | 0.0163 | |
| 0.3773 | 0.0804 | 0.2056 | 0.3521 | 0.0593 | 0.1490 | 0.3225 | 0.0545 | 0.1487 | |||
| 0.2991 | −0.0623 | 0.1754 | 0.1928 | −0.0266 | 0.1236 | 0.2009 | −0.0296 | 0.1285 | |||
| 0.2995 | −0.0559 | 0.1274 | 0.1643 | −0.0231 | 0.0823 | 0.1718 | −0.0249 | 0.0869 | |||
| 0.2138 | −0.0200 | 0.0757 | 0.1085 | −0.0081 | 0.0442 | 0.1161 | −0.0099 | 0.0488 | |||
| 0.2289 | 0.0182 | 0.0582 | 0.2021 | 0.0197 | 0.0523 | 0.2244 | 0.0212 | 0.0548 | |||
| 0.6495 | 0.1174 | 0.1198 | 0.5603 | 0.0866 | 0.0966 | 0.5449 | 0.0839 | 0.0965 | 0.1272 | 0.0203 | |
| 0.2425 | −0.0285 | 0.0896 | 0.1373 | −0.0093 | 0.0609 | 0.1447 | −0.0075 | 0.0609 | |||
| 0.1693 | −0.0048 | 0.0538 | 0.1127 | 0.0040 | 0.0382 | 0.1019 | 0.0031 | 0.0370 | |||
| 0.2150 | 0.0207 | 0.0570 | 0.2164 | 0.0229 | 0.0540 | 0.2061 | 0.0217 | 0.0530 | |||
| 0.9980 | −0.5192 | 0.1127 | 0.9975 | −0.5063 | 0.0945 | 0.9968 | −0.5099 | 0.0965 | −0.5053 | 0.0666 | |
| 0.2530 | −0.0625 | 0.1407 | 0.1018 | −0.0191 | 0.0829 | 0.1044 | −0.0208 | 0.0856 | |||
| 0.2798 | −0.0669 | 0.1416 | 0.1037 | −0.0191 | 0.0782 | 0.1107 | −0.0227 | 0.0870 | |||
| 0.1204 | 0.0045 | 0.0513 | 0.0508 | 0.0015 | 0.0281 | 0.0623 | 0.0021 | 0.0323 | |||
| 0.1149 | −0.0031 | 0.0384 | 0.0605 | −0.0034 | 0.0278 | 0.0528 | −0.0032 | 0.0274 | |||
| const | 0.2435 | −0.1639 | 0.3790 | 0.1435 | −0.1022 | 0.3150 | 0.1482 | −0.1042 | 0.3171 | ||
| Model | ||||||||||
|---|---|---|---|---|---|---|---|---|---|---|
| 1.53% | 0.64% | 0.60% | 0.59% | 0.46% | 0.44% | 0.38% | 0.37% | 0.33% | 0.32% | |
| 0.8710 | 0.8622 | 0.6691 | 0.7224 | 0.6760 | 0.8726 | 0.8689 | 0.8973 | 0.7056 | 0.7169 | |
| −0.5057 | −0.4758 | −0.5634 | −0.5531 | −0.5807 | −0.4843 | −0.4948 | −0.5489 | −0.5749 | −0.6301 | |
| 0.1140 | 0.3333 | 0.1207 | 0.3983 | 0.1126 | 0.1155 | 0.2208 | 0.0983 | 0.2786 | ||
| 0.1272 | 0.1353 | 0.1275 | 0.1333 | 0.1329 | 0.2699 | 0.1029 | 0.1765 | 0.0996 | ||
| 0.2070 | 0.1941 | |||||||||
| 0.1198 | ||||||||||
| 1.53% | 0.64% | 0.60% | 0.59% | 0.46% | 0.44% | 0.38% | 0.37% | 0.33% | 0.32% | |
| 0.1431 | 0.1761 | 0.1853 | ||||||||
| −0.2071 | ||||||||||
| −0.2685 | −0.1251 | −0.1826 | ||||||||
| −0.3563 | −0.3143 | |||||||||
| const | −0.6718 | |||||||||
| −0.1408 | ||||||||||
| 0.1255 |
| Model | ||||||||||
|---|---|---|---|---|---|---|---|---|---|---|
| 8.09% | 3.55% | 2.82% | 2.06% | 1.35% | 1.30% | 1.19% | 1.18% | 1.07% | 0.91% | |
| 0.8710 | 0.8620 | 0.8725 | 0.8916 | 0.7228 | 0.8687 | 0.8645 | 0.8842 | 0.8861 | 0.8546 | |
| −0.5059 | −0.4756 | −0.4843 | −0.4912 | −0.5527 | −0.4955 | −0.4530 | −0.5132 | −0.4635 | −0.4463 | |
| 0.1141 | 0.1355 | 0.1126 | 0.0986 | 0.1208 | 0.1157 | 0.0961 | 0.1423 | |||
| 0.1273 | 0.1334 | 0.2695 | 0.1581 | |||||||
| 0.1200 | 0.1178 | 0.1020 | ||||||||
| 0.1425 | ||||||||||
| 0.1249 | ||||||||||
| const | −0.4988 | |||||||||
| -0.1402 | ||||||||||
| 0.1256 | 0.1329 | |||||||||
| 0.1083 | 0.1132 |
| Model | ||||||||||
|---|---|---|---|---|---|---|---|---|---|---|
| 7.06% | 3.28% | 3.14% | 2.18% | 1.42% | 1.16% | 0.97% | 0.95% | 0.88% | 0.87% | |
| 0.8710 | 0.8725 | 0.8621 | 0.8914 | 0.7229 | 0.8878 | 0.8862 | 0.8991 | 0.8834 | 0.8687 | |
| −0.5051 | −0.4844 | −0.4763 | −0.4925 | −0.5528 | −0.4995 | −0.4630 | −0.5396 | −0.4997 | −0.4948 | |
| 0.1140 | 0.1126 | 0.0987 | 0.1206 | 0.1018 | 0.1774 | 0.1051 | 0.1157 | |||
| 7.06% | 3.28% | 3.14% | 2.18% | 1.42% | 1.16% | 0.97% | 0.95% | 0.88% | 0.87% | |
| 0.1273 | 0.1354 | 0.1332 | 0.1012 | 0.2710 | ||||||
| 0.1199 | 0.1019 | |||||||||
| 0.1256 | ||||||||||
| 0.1427 | ||||||||||
| 0.1158 | −0.1418 | |||||||||
| 0.1118 | ||||||||||
| 0.1085 | 0.1131 | |||||||||
| −0.0831 |
| Date | Actual | BACE | BMA (Restricted) | BMA (Unrestricted) | Autometrics | Median BACE | Median BMA (Restricted) | Median BMA (Unrestricted) | |||||||
|---|---|---|---|---|---|---|---|---|---|---|---|---|---|---|---|
| Fcast. | SE | Fcast. | SE | Fcast. | SE | Fcast. | SE | Fcast. | SE | Fcast. | SE | Fcast. | SE | ||
| 1985:3 | 10.966 | 10.971 | 0.0167 | 10.969 | 0.0159 | 10.969 | 0.0160 | 10.967 | 0.0140 | 10.967 | 0.0140 | 10.967 | 0.0151 | 10.967 | 0.0151 |
| 1985:4 | 11.006 | 11.020 | 0.0185 | 11.017 | 0.0235 | 11.018 | 0.0237 | 11.013 | 0.0186 | 11.013 | 0.0186 | 11.013 | 0.0218 | 11.013 | 0.0218 |
| 1986:1 | 11.070 | 11.073 | 0.0212 | 11.066 | 0.0309 | 11.067 | 0.0312 | 11.058 | 0.0214 | 11.058 | 0.0214 | 11.058 | 0.0274 | 11.058 | 0.0274 |
| 1986:2 | 11.123 | 11.127 | 0.0247 | 11.116 | 0.0383 | 11.118 | 0.0387 | 11.103 | 0.0233 | 11.103 | 0.0233 | 11.103 | 0.0326 | 11.103 | 0.0326 |
| 1986:3 | 11.186 | 11.174 | 0.0288 | 11.160 | 0.0456 | 11.162 | 0.0464 | 11.143 | 0.0247 | 11.143 | 0.0247 | 11.143 | 0.0372 | 11.143 | 0.0372 |
| 1986:4 | 11.216 | 11.218 | 0.0340 | 11.199 | 0.0533 | 11.202 | 0.0546 | 11.178 | 0.0256 | 11.178 | 0.0256 | 11.178 | 0.0412 | 11.178 | 0.0412 |
| 1987:1 | 11.281 | 11.265 | 0.0403 | 11.241 | 0.0620 | 11.245 | 0.0638 | 11.215 | 0.0264 | 11.215 | 0.0264 | 11.216 | 0.0452 | 11.216 | 0.0452 |
| 1987:2 | 11.340 | 11.311 | 0.0468 | 11.282 | 0.0707 | 11.287 | 0.0732 | 11.250 | 0.0269 | 11.250 | 0.0269 | 11.251 | 0.0491 | 11.251 | 0.0491 |
| 1987:3 | 11.377 | 11.351 | 0.0534 | 11.318 | 0.0790 | 11.323 | 0.0823 | 11.280 | 0.0273 | 11.280 | 0.0273 | 11.282 | 0.0526 | 11.282 | 0.0526 |
| 1987:4 | 11.421 | 11.398 | 0.0600 | 11.359 | 0.0875 | 11.365 | 0.0917 | 11.316 | 0.0276 | 11.316 | 0.0276 | 11.318 | 0.0559 | 11.318 | 0.0559 |
| 1988:1 | 11.471 | 11.438 | 0.0662 | 11.395 | 0.0957 | 11.402 | 0.1009 | 11.347 | 0.0278 | 11.347 | 0.0278 | 11.350 | 0.0591 | 11.350 | 0.0591 |
| 1988:2 | 11.512 | 11.477 | 0.0730 | 11.431 | 0.1041 | 11.438 | 0.1104 | 11.377 | 0.0280 | 11.377 | 0.0280 | 11.380 | 0.0619 | 11.380 | 0.0619 |
| 1988:3 | 11.538 | 11.507 | 0.0801 | 11.457 | 0.1124 | 11.465 | 0.1198 | 11.398 | 0.0281 | 11.398 | 0.0281 | 11.401 | 0.0642 | 11.401 | 0.0642 |
| 1988:4 | 11.555 | 11.539 | 0.0872 | 11.484 | 0.1208 | 11.493 | 0.1294 | 11.419 | 0.0282 | 11.419 | 0.0282 | 11.423 | 0.0661 | 11.423 | 0.0661 |
| 1989:1 | 11.602 | 11.571 | 0.0937 | 11.512 | 0.1287 | 11.522 | 0.1387 | 11.442 | 0.0283 | 11.442 | 0.0283 | 11.446 | 0.0680 | 11.446 | 0.0680 |
| 1989:2 | 11.640 | 11.600 | 0.1003 | 11.538 | 0.1364 | 11.549 | 0.1478 | 11.463 | 0.0283 | 11.463 | 0.0283 | 11.468 | 0.0697 | 11.468 | 0.0697 |
| RMSE | 0.0224 | 0.0592 | 0.05317 | 0.1018 | 0.1018 | 0.0995 | 0.0995 | ||||||||
| MAPE | 0.17% | 0.43% | 0.39% | 0.74% | 0.74% | 0.72% | 0.72% | ||||||||
| UM (bias) | 49.5% | 64.4% | 63.6% | 67.3% | 67.3% | 67.4% | 67.4% | ||||||||
| UR (regression) | 40.0% | 34.0% | 34.4% | 31.9% | 31.8% | 31.9% | 31.8% | ||||||||
| UD (disturbance) | 10.5% | 1.6% | 2.0% | 0.8% | 0.8% | 0.8% | 0.8% | ||||||||
| Variable | Definition | Variable | Definition |
|---|---|---|---|
| real GDP, £ million, 1985 prices | world prices (1985 = 1) | ||
| implicit deflator of GDP (1985 = 1) | annual-average effective exchange rate | ||
| nominal broad money, million £ | deflator of net national income (1985 = 1) | ||
| three-month treasury bill rate, fraction p.a. | consumer price index (1985 = 1) | ||
| long-term bond interest rate, fraction p.a. | commodity price index, $ | ||
| opportunity cost of money measure | money excess demand | ||
| nominal National Debt, £ million | GDP excess demand | ||
| unemployment | short–long spread | ||
| working population | excess demand for debt | ||
| unemployment rate, fraction | real exchange rate | ||
| employment | profit markup | ||
| gross capital stock | excess demand for labor | ||
| wages | commodity prices in Sterling | ||
| normal hours (from 1920) | nominal unit labor costs |
| Variable | BACE | BMA (Restricted) | BMA (Unrestricted) | Autometrics | |||||||||
|---|---|---|---|---|---|---|---|---|---|---|---|---|---|
| PIP | Avg. | Avg. | PIP | Avg. | Avg. | PIP | Avg. | Avg. | Coeff. | Std. | |||
| Mean | Std. Dev. | Mean | Std. Dev. | Mean | Std. Dev. | Error | |||||||
| Hendry’s model (31) |  | 1.00 | 0.0380 | 0.0015 | 1.00 | 0.0379 | 0.0014 | 1.00 | 0.0379 | 0.0014 | 0.0377 | 0.0015 | |
| 1.00 | 0.2612 | 0.0248 | 1.00 | 0.2617 | 0.0236 | 1.00 | 0.2617 | 0.0236 | 0.2608 | 0.0247 | |||
| 1.00 | −0.9786 | 0.1060 | 1.00 | −0.9696 | 0.1024 | 1.00 | −0.9696 | 0.1024 | −0.9234 | 0.0997 | |||
| 1.00 | 0.1898 | 0.0381 | 1.00 | 0.1875 | 0.0352 | 1.00 | 0.1875 | 0.0352 | 0.1872 | 0.0330 | |||
| 1.00 | 0.2818 | 0.0353 | 1.00 | 0.2800 | 0.0322 | 1.00 | 0.2800 | 0.0322 | 0.2638 | 0.0264 | |||
| 0.99 | −0.1674 | 0.0295 | 1.00 | −0.1684 | 0.0281 | 1.00 | −0.1684 | 0.0281 | −0.1778 | 0.0273 | |||
| 0.99 | 0.6896 | 0.1273 | 0.99 | 0.6903 | 0.1199 | 0.99 | 0.6903 | 0.1199 | 0.6723 | 0.1182 | |||
| 0.99 | 0.0492 | 0.0111 | 0.99 | 0.0489 | 0.0106 | 0.99 | 0.0490 | 0.0106 | 0.0487 | 0.0110 | |||
| 0.99 | 0.1531 | 0.0325 | 0.99 | 0.1575 | 0.0309 | 0.99 | 0.1575 | 0.0309 | 0.1732 | 0.0293 | |||
| 0.71 | −0.0548 | 0.0443 | 0.60 | −0.0472 | 0.0449 | 0.60 | −0.0472 | 0.0449 | |||||
| 0.20 | 0.0006 | 0.0016 | 0.12 | 0.0004 | 0.0013 | 0.12 | 0.0004 | 0.0013 | |||||
| 0.15 | 0.0060 | 0.0217 | 0.09 | 0.0038 | 0.0170 | 0.09 | 0.0039 | 0.0170 | |||||
| 0.12 | 0.0030 | 0.0134 | 0.07 | 0.0017 | 0.0099 | 0.07 | 0.0018 | 0.0100 | |||||
| 0.12 | 0.0014 | 0.0063 | 0.06 | 0.0007 | 0.0044 | 0.06 | 0.0007 | 0.0044 | |||||
| const | 0.11 | 0.0001 | 0.0007 | 0.07 | 0.0001 | 0.0005 | 0.07 | 0.0001 | 0.0005 | ||||
| 0.10 | −0.0001 | 0.0132 | 0.05 | 0.0001 | 0.0083 | 0.05 | 0.0001 | 0.0083 | |||||
| 0.10 | −0.0009 | 0.0230 | 0.05 | −0.0001 | 0.0164 | 0.05 | −0.0001 | 0.0164 | |||||
| 0.10 | −0.0001 | 0.0043 | 0.05 | −0.0001 | 0.0028 | 0.05 | 0.0000 | 0.0029 | |||||
| 0.09 | 0.0003 | 0.0104 | 0.05 | 0.0001 | 0.0066 | 0.05 | 0.0001 | 0.0066 | |||||
| 0.09 | 0.0012 | 0.0839 | 0.05 | 0.0017 | 0.0591 | 0.05 | 0.0017 | 0.0590 | |||||
| Model | ||||||||||
|---|---|---|---|---|---|---|---|---|---|---|
| 21.93% | 6.42% | 4.63% | 3.28% | 3.06% | 3.01% | 2.80% | 2.57% | 2.41% | 2.41% | |
| 0.0382 | 0.0377 | 0.0381 | 0.0383 | 0.0379 | 0.0378 | 0.0379 | 0.0380 | 0.0382 | 0.0382 | |
| 0.2639 | 0.2608 | 0.2619 | 0.2610 | 0.2581 | 0.2583 | 0.2623 | 0.2635 | 0.2634 | 0.2635 | |
| −0.9935 | −0.9234 | −1.0122 | −1.0002 | −0.9979 | −0.9607 | −0.9866 | −0.9896 | −0.9873 | −0.9946 | |
| 0.1788 | 0.1872 | 0.2069 | 0.1768 | 0.1858 | 0.2267 | 0.1829 | 0.1856 | 0.1785 | 0.1790 | |
| 0.2924 | 0.2638 | 0.2922 | 0.2837 | 0.2835 | 0.2676 | 0.2885 | 0.2930 | 0.2947 | 0.2952 | |
| 21.93% | 6.42% | 4.63% | 3.28% | 3.06% | 3.01% | 2.80% | 2.57% | 2.41% | 2.41% | |
| −0.1618 | −0.1778 | −0.1701 | −0.1642 | −0.1690 | −0.1875 | −0.1545 | −0.1619 | −0.1627 | −0.1620 | |
| 0.7149 | 0.6723 | 0.6605 | 0.6937 | 0.7248 | 0.5996 | 0.7165 | 0.7146 | 0.6998 | 0.7171 | |
| 0.0482 | 0.0487 | 0.0513 | 0.0479 | 0.0485 | 0.0532 | 0.0487 | 0.0488 | 0.0478 | 0.0480 | |
| 0.1555 | 0.1732 | 0.1468 | 0.1485 | 0.1482 | 0.1579 | 0.1470 | 0.1465 | 0.1547 | 0.1562 | |
| −0.0790 | −0.0710 | −0.0806 | −0.0814 | −0.0716 | −0.0744 | −0.0833 | −0.0794 | |||
| 0.0026 | 0.0038 | |||||||||
| 0.0254 | ||||||||||
| 0.0123 | ||||||||||
| 0.0253 | ||||||||||
| const | 0.0009 | |||||||||
| −0.0262 | ||||||||||
| −0.0028 |
| Model | ||||||||||
|---|---|---|---|---|---|---|---|---|---|---|
| 32.66% | 17.63% | 3.74% | 3.24% | 2.95% | 2.80% | 2.39% | 1.94% | 1.92% | 1.90% | |
| 0.0381 | 0.0377 | 0.0378 | 0.0381 | 0.0373 | 0.0383 | 0.0379 | 0.0379 | 0.0375 | 0.0380 | |
| 0.2638 | 0.2609 | 0.2585 | 0.2616 | 0.2583 | 0.2610 | 0.2580 | −0.9864 | 0.2604 | 0.2636 | |
| −0.9948 | −0.9224 | −0.9602 | −1.0122 | −0.9228 | −1.0017 | −0.9973 | 0.2621 | −0.9241 | −0.9898 | |
| 0.1787 | 0.1874 | 0.2264 | 0.2067 | 0.1942 | 0.1767 | 0.1860 | 0.1825 | 0.2002 | 0.1855 | |
| 0.2927 | 0.2638 | 0.2676 | 0.2925 | 0.2614 | 0.2838 | 0.2831 | 0.2888 | 0.2687 | 0.2930 | |
| −0.1615 | −0.1782 | −0.1875 | −0.1699 | −0.1595 | −0.1639 | −0.1690 | −0.1544 | −0.1758 | −0.1619 | |
| 0.7163 | 0.6718 | 0.5991 | 0.6610 | 0.6844 | 0.6944 | 0.7237 | 0.7165 | 0.6779 | 0.7140 | |
| 0.0482 | 0.0488 | 0.0534 | 0.0514 | 0.0496 | 0.0478 | 0.0486 | 0.0487 | 0.0499 | 0.0488 | |
| 0.1554 | 0.1730 | 0.1576 | 0.1466 | 0.1517 | 0.1484 | 0.1484 | 0.1471 | 0.1515 | 0.1466 | |
| −0.0793 | −0.0711 | −0.0807 | −0.0812 | −0.0718 | −0.0746 | |||||
| 0.0038 | 0.0026 | |||||||||
| 0.0254 | ||||||||||
| 0.0124 | ||||||||||
| 0.0527 | 0.0251 | |||||||||
| const | 0.0018 | 0.0008 |
| Date | Actual | BACE | BMA (Restricted) | BMA Median BMA (Unrestricted) | Autometrics | Median BACE (Restricted) | Median BMA (Unrestricted) | ||||||||
|---|---|---|---|---|---|---|---|---|---|---|---|---|---|---|---|
| Fcast. | SE | Fcast. | SE | Fcast. | SE | Fcast. | SE | Fcast. | SE | Fcast. | SE | Fcast. | SE | ||
| 1982 | 0.0681 | 0.0467 | 0.0124 | 0.0469 | 0.0118 | 0.0469 | 0.0118 | 0.0487 | 0.0110 | 0.0457 | 0.0107 | 0.0457 | 0.0116 | 0.0457 | 0.0116 |
| 1983 | 0.0551 | 0.0432 | 0.0120 | 0.0438 | 0.0125 | 0.0438 | 0.0125 | 0.0474 | 0.0114 | 0.0412 | 0.0111 | 0.0413 | 0.0121 | 0.0413 | 0.0121 |
| 1984 | 0.0527 | 0.0417 | 0.0126 | 0.0423 | 0.0132 | 0.0423 | 0.0132 | 0.0475 | 0.0114 | 0.0386 | 0.0112 | 0.0385 | 0.0125 | 0.0385 | 0.0125 |
| 1985 | 0.0529 | 0.0484 | 0.0120 | 0.0489 | 0.0126 | 0.0489 | 0.0126 | 0.0536 | 0.0114 | 0.0456 | 0.0112 | 0.0455 | 0.0120 | 0.0455 | 0.0120 |
| 1986 | 0.0259 | 0.0349 | 0.0131 | 0.0357 | 0.0136 | 0.0357 | 0.0136 | 0.0419 | 0.0114 | 0.0314 | 0.0112 | 0.0313 | 0.0127 | 0.0313 | 0.0127 |
| 1987 | 0.0495 | 0.0173 | 0.0142 | 0.0183 | 0.0151 | 0.0183 | 0.0151 | 0.0254 | 0.0114 | 0.0140 | −0.0112 | 0.0139 | 0.0142 | 0.0139 | 0.0142 |
| 1988 | 0.0626 | 0.0637 | 0.0142 | 0.0650 | 0.0154 | 0.0650 | 0.0154 | 0.0735 | 0.0114 | 0.0599 | 0.0112 | 0.0596 | 0.0143 | 0.0596 | 0.0143 |
| 1989 | 0.0744 | 0.0740 | 0.0129 | 0.0749 | 0.0141 | 0.0749 | 0.0141 | 0.0821 | 0.0114 | 0.0710 | 0.0112 | 0.0707 | 0.0133 | 0.0707 | 0.0133 |
| 1990 | 0.0769 | 0.0484 | 0.0132 | 0.0492 | 0.0141 | 0.0492 | 0.0141 | 0.0550 | 0.0114 | 0.0461 | 0.0112 | 0.0461 | 0.0136 | 0.0461 | 0.0136 |
| 1991 | 0.0604 | 0.0366 | 0.0129 | 0.0373 | 0.0139 | 0.0373 | 0.0139 | 0.0418 | 0.0114 | 0.0347 | 0.0112 | 0.0346 | 0.0134 | 0.0346 | 0.0134 |
| RMSE | 0.0179 | 0.0175 | 0.0175 | 0.0151 | 0.0196 | 0.0197 | 0.0197 | ||||||||
| MAPE | 26.06% | 25.85% | 25.85% | 25.06% | 28.31% | 28.41% | 28.41% | ||||||||
| UM (bias) | 54.5% | 51.3% | 51.3% | 21.9% | 65.0% | 65.3% | 65.3% | ||||||||
| UR (regression) | 0.3% | 0.3% | 0.3% | 1.2% | 0.2% | 0.2% | 0.2% | ||||||||
| UD (disturbance) | 45.2% | 48.3% | 48.3% | 76.9% | 34.8% | 34.5% | 34.5% | ||||||||
| Variable | |||||||||
|---|---|---|---|---|---|---|---|---|---|
| PIP | Avg. | Avg. | PIP | Avg. | Avg. | PIP | Avg. | Avg. | |
| Mean | Std. Dev. | Mean | Std. Dev. | Mean | Std. Dev. | ||||
| 1.00 | 0.7695 | 0.1224 | 1.00 | 0.7676 | 0.1224 | 1.00 | 0.7734 | 0.1220 | |
| 0.35 | 0.0687 | 0.1161 | 0.35 | 0.0681 | 0.1157 | 0.34 | 0.0664 | 0.1144 | |
| 0.12 | −0.0074 | 0.0506 | 0.13 | −0.0073 | 0.0512 | 0.13 | −0.0068 | 0.0510 | |
| 0.39 | 0.0607 | 0.0962 | 0.40 | 0.0632 | 0.0976 | 0.38 | 0.0584 | 0.0950 | |
| 0.67 | 0.1562 | 0.1581 | 0.67 | 0.1582 | 0.1607 | 0.66 | 0.1541 | 0.1593 | |
| 0.37 | 0.0783 | 0.2002 | 0.37 | 0.0793 | 0.2028 | 0.37 | 0.0801 | 0.2049 | |
| 0.28 | −0.0598 | 0.1657 | 0.29 | −0.0628 | 0.1711 | 0.31 | −0.0657 | 0.1752 | |
| 0.29 | −0.0548 | 0.1207 | 0.29 | −0.0547 | 0.1219 | 0.27 | −0.0491 | 0.1172 | |
| 0.19 | −0.0178 | 0.0682 | 0.19 | −0.0179 | 0.0693 | 0.19 | −0.0174 | 0.0680 | |
| 0.22 | 0.0180 | 0.0555 | 0.22 | 0.0183 | 0.0561 | 0.23 | 0.0188 | 0.0570 | |
| 0.65 | 0.1155 | 0.1173 | 0.64 | 0.1143 | 0.1171 | 0.64 | 0.1148 | 0.1178 | |
| 0.22 | −0.0269 | 0.0860 | 0.22 | −0.0259 | 0.0856 | 0.23 | −0.0269 | 0.0878 | |
| 0.15 | −0.0031 | 0.0488 | 0.15 | −0.0030 | 0.0498 | 0.15 | −0.0024 | 0.0493 | |
| 0.20 | 0.0195 | 0.0544 | 0.20 | 0.0192 | 0.0540 | 0.20 | 0.0185 | 0.0534 | |
| 0.99 | −0.5208 | 0.1111 | 0.99 | −0.5187 | 0.1143 | 0.99 | −0.5195 | 0.1115 | |
| 0.23 | −0.0553 | 0.1334 | 0.24 | −0.0601 | 0.1395 | 0.23 | −0.0554 | 0.1334 | |
| 0.27 | −0.0650 | 0.1400 | 0.27 | −0.0658 | 0.1406 | 0.26 | −0.0610 | 0.1354 | |
| 0.10 | 0.0034 | 0.0435 | 0.10 | 0.0032 | 0.0436 | 0.10 | 0.0040 | 0.0453 | |
| 0.10 | −0.0030 | 0.0341 | 0.10 | −0.0026 | 0.0346 | 0.09 | −0.0028 | 0.0340 | |
| const | 0.23 | −0.1519 | 0.3652 | 0.22 | −0.1503 | 0.3661 | 0.22 | −0.1487 | 0.3626 |
| Variable | |||||||||
|---|---|---|---|---|---|---|---|---|---|
| PIP | Avg. | Avg. | PIP | Avg. | Avg. | PIP | Avg. | Avg. | |
| Mean | Std. Dev. | Mean | Std. Dev. | Mean | Std. Dev. | ||||
| 1.00 | 0.0380 | 0.0015 | 1.00 | 0.0380 | 0.0015 | 1.00 | 0.0380 | 0.0015 | |
| 1.00 | 0.2612 | 0.0248 | 1.00 | 0.2612 | 0.0248 | 1.00 | 0.2612 | 0.0248 | |
| 1.00 | −0.9786 | 0.1060 | 1.00 | −0.9786 | 0.1060 | 1.00 | −0.9786 | 0.1060 | |
| 1.00 | 0.1898 | 0.0381 | 1.00 | 0.1898 | 0.0381 | 1.00 | 0.1898 | 0.0381 | |
| 1.00 | 0.2818 | 0.0352 | 1.00 | 0.2818 | 0.0352 | 1.00 | 0.2818 | 0.0352 | |
| 0.99 | −0.1674 | 0.0295 | 0.99 | −0.1673 | 0.0295 | 1.00 | −0.1674 | 0.0295 | |
| 0.99 | 0.6896 | 0.1272 | 0.99 | 0.6897 | 0.1272 | 0.99 | 0.6896 | 0.1273 | |
| 0.99 | 0.0492 | 0.0111 | 0.99 | 0.0492 | 0.0111 | 0.99 | 0.0492 | 0.0111 | |
| 0.99 | 0.1532 | 0.0325 | 0.99 | 0.1532 | 0.0325 | 0.99 | 0.1532 | 0.0325 | |
| 0.71 | −0.0549 | 0.0443 | 0.71 | −0.0549 | 0.0443 | 0.71 | −0.0549 | 0.0443 | |
| 0.20 | 0.0006 | 0.0016 | 0.20 | 0.0006 | 0.0016 | 0.20 | 0.0006 | 0.0016 | |
| 0.15 | 0.0059 | 0.0216 | 0.15 | 0.0059 | 0.0216 | 0.15 | 0.0059 | 0.0217 | |
| 0.12 | 0.0030 | 0.0133 | 0.12 | 0.0030 | 0.0133 | 0.12 | 0.0030 | 0.0133 | |
| 0.12 | 0.0014 | 0.0063 | 0.12 | 0.0014 | 0.0063 | 0.12 | 0.0014 | 0.0063 | |
| const | 0.11 | 0.0001 | 0.0007 | 0.11 | 0.0001 | 0.0007 | 0.11 | 0.0001 | 0.0007 |
| 0.10 | −0.0001 | 0.0130 | 0.10 | −0.0001 | 0.0130 | 0.10 | −0.0001 | 0.0130 | |
| 0.09 | −0.0009 | 0.0229 | 0.09 | −0.0009 | 0.0229 | 0.10 | −0.0009 | 0.0229 | |
| 0.09 | −0.0001 | 0.0042 | 0.10 | −0.0001 | 0.0042 | 0.09 | −0.0001 | 0.0042 | |
| 0.09 | 0.0003 | 0.0102 | 0.09 | 0.0003 | 0.0102 | 0.09 | 0.0003 | 0.0103 | |
| 0.09 | 0.0011 | 0.0831 | 0.09 | 0.0011 | 0.0832 | 0.09 | 0.0011 | 0.0833 | |
| Variable | |||||||||
|---|---|---|---|---|---|---|---|---|---|
| PIP | Avg. | Avg. | PIP | Avg. | Avg. | PIP | Avg. | Avg. | |
| Mean | Std. Dev. | Mean | Std. Dev. | Mean | Std. Dev. | ||||
| 1.00 | 0.8318 | 0.0966 | 1.00 | 0.8292 | 0.0978 | 1.00 | 0.8298 | 0.0980 | |
| 0.20 | 0.0356 | 0.0857 | 0.20 | 0.0362 | 0.0865 | 0.20 | 0.0364 | 0.0863 | |
| 0.06 | −0.0011 | 0.0287 | 0.07 | −0.0014 | 0.0291 | 0.06 | −0.0013 | 0.0287 | |
| 0.15 | 0.0178 | 0.0550 | 0.16 | 0.0196 | 0.0572 | 0.16 | 0.0190 | 0.0570 | |
| 0.64 | 0.1069 | 0.1170 | 0.65 | 0.1090 | 0.1178 | 0.65 | 0.1091 | 0.1184 | |
| 0.33 | 0.0556 | 0.1450 | 0.33 | 0.0553 | 0.1483 | 0.33 | 0.0529 | 0.1455 | |
| 0.20 | −0.0279 | 0.1233 | 0.20 | −0.0286 | 0.1254 | 0.20 | −0.0275 | 0.1245 | |
| 0.15 | −0.0216 | 0.0789 | 0.15 | −0.0223 | 0.0797 | 0.15 | −0.0211 | 0.0783 | |
| 0.11 | −0.0083 | 0.0447 | 0.10 | −0.0082 | 0.0449 | 0.10 | −0.0085 | 0.0442 | |
| 0.18 | 0.0173 | 0.0498 | 0.21 | 0.0199 | 0.0526 | 0.19 | 0.0178 | 0.0505 | |
| 0.60 | 0.0911 | 0.0951 | 0.59 | 0.0906 | 0.0953 | 0.59 | 0.0907 | 0.0952 | |
| 0.13 | −0.0074 | 0.0585 | 0.13 | −0.0072 | 0.0592 | 0.14 | −0.0069 | 0.0594 | |
| 0.12 | 0.0041 | 0.0396 | 0.11 | 0.0034 | 0.0377 | 0.10 | 0.0030 | 0.0363 | |
| 0.19 | 0.0191 | 0.0497 | 0.17 | 0.0176 | 0.0478 | 0.19 | 0.0200 | 0.0505 | |
| 1.00 | −0.5090 | 0.0925 | 1.00 | −0.5081 | 0.0944 | 1.00 | −0.5080 | 0.0945 | |
| 0.09 | −0.0173 | 0.0758 | 0.10 | −0.0199 | 0.0829 | 0.10 | −0.0192 | 0.0822 | |
| 0.11 | −0.0212 | 0.0823 | 0.12 | −0.0220 | 0.0837 | 0.12 | −0.0224 | 0.0846 | |
| 0.05 | 0.0012 | 0.0274 | 0.05 | 0.0014 | 0.0276 | 0.05 | 0.0016 | 0.0287 | |
| 0.06 | −0.0030 | 0.0267 | 0.06 | −0.0026 | 0.0256 | 0.07 | −0.0033 | 0.0278 | |
| const | 0.14 | −0.0985 | 0.3076 | 0.14 | −0.0934 | 0.2985 | 0.14 | −0.0998 | 0.3097 |
| Variable | |||||||||
|---|---|---|---|---|---|---|---|---|---|
| PIP | Avg. | Avg. | PIP | Avg. | Avg. | PIP | Avg. | Avg. | |
| Mean | Std. Dev. | Mean | Std. Dev. | Mean | Std. Dev. | ||||
| 1.00 | 0.0379 | 0.0014 | 1.00 | 0.0379 | 0.0014 | 1.00 | 0.0379 | 0.0014 | |
| 1.00 | 0.2617 | 0.0238 | 1.00 | 0.1879 | 0.0354 | 1.00 | 0.1879 | 0.0354 | |
| 1.00 | −0.9687 | 0.1024 | 1.00 | −0.9686 | 0.1024 | 1.00 | −0.9685 | 0.1024 | |
| 1.00 | 0.1877 | 0.0353 | 1.00 | 0.2617 | 0.0238 | 1.00 | 0.2617 | 0.0238 | |
| 1.00 | 0.2797 | 0.0324 | 1.00 | 0.2796 | 0.0324 | 1.00 | 0.2794 | 0.0324 | |
| 1.00 | −0.1685 | 0.0280 | 1.00 | −0.1687 | 0.0281 | 1.00 | −0.1687 | 0.0281 | |
| 0.99 | 0.6893 | 0.1196 | 0.99 | 0.6889 | 0.1201 | 0.99 | 0.6889 | 0.1198 | |
| 0.99 | 0.0490 | 0.0106 | 0.99 | 0.1577 | 0.0308 | 0.99 | 0.1577 | 0.0308 | |
| 0.99 | 0.1575 | 0.0310 | 0.99 | 0.0489 | 0.0107 | 0.99 | 0.0489 | 0.0106 | |
| 0.59 | −0.0465 | 0.0449 | 0.59 | −0.0463 | 0.0449 | 0.59 | −0.0460 | 0.0449 | |
| 0.12 | 0.0004 | 0.0013 | 0.12 | 0.0004 | 0.0013 | 0.12 | 0.0004 | 0.0013 | |
| 0.10 | 0.0042 | 0.0176 | 0.09 | 0.0039 | 0.0171 | 0.09 | 0.0040 | 0.0172 | |
| 0.07 | 0.0016 | 0.0096 | 0.07 | 0.0017 | 0.0097 | 0.07 | 0.0017 | 0.0097 | |
| 0.06 | 0.0008 | 0.0045 | 0.07 | 0.0008 | 0.0047 | 0.07 | 0.0008 | 0.0047 | |
| const | 0.07 | 0.0001 | 0.0005 | 0.07 | 0.0001 | 0.0006 | 0.07 | 0.0001 | 0.0006 |
| 0.05 | 0.0001 | 0.0086 | 0.05 | −0.0003 | 0.0165 | 0.05 | −0.0001 | 0.0163 | |
| 0.06 | −0.0003 | 0.0167 | 0.05 | 0.0002 | 0.0070 | 0.06 | 0.0001 | 0.0092 | |
| 0.05 | <0.0000 | 0.0028 | 0.05 | 0.0001 | 0.0085 | 0.05 | <0.0000 | 0.0028 | |
| 0.05 | 0.0002 | 0.0068 | 0.05 | 0.0022 | 0.0619 | 0.05 | 0.0023 | 0.0611 | |
| 0.05 | 0.0016 | 0.0591 | 0.05 | <0.0001 | 0.0029 | 0.05 | 0.0002 | 0.0069 | |
| Variable | |||||||||
|---|---|---|---|---|---|---|---|---|---|
| PIP | Avg. | Avg. | PIP | Avg. | Avg. | PIP | Avg. | Avg. | |
| Mean | Std. Dev. | Mean | Std. Dev. | Mean | Std. Dev. | ||||
| 1.00 | 0.8320 | 0.0982 | 1.00 | 0.8332 | 0.0973 | 1.00 | 0.8315 | 0.0982 | |
| 0.20 | 0.0360 | 0.0861 | 0.20 | 0.0363 | 0.0865 | 0.21 | 0.0374 | 0.0875 | |
| 0.06 | −0.0013 | 0.0281 | 0.07 | −0.0014 | 0.0292 | 0.06 | −0.0013 | 0.0277 | |
| 0.16 | 0.0193 | 0.0573 | 0.15 | 0.0175 | 0.0545 | 0.15 | 0.0181 | 0.0554 | |
| 0.64 | 0.1102 | 0.1203 | 0.65 | 0.1089 | 0.1180 | 0.65 | 0.1112 | 0.1202 | |
| 0.33 | 0.0547 | 0.1486 | 0.33 | 0.0521 | 0.1451 | 0.33 | 0.0523 | 0.1472 | |
| 0.20 | −0.0286 | 0.1258 | 0.18 | −0.0247 | 0.1176 | 0.20 | −0.0264 | 0.1243 | |
| 0.16 | −0.0231 | 0.0809 | 0.16 | −0.0229 | 0.0806 | 0.17 | −0.0240 | 0.0849 | |
| 0.11 | −0.0098 | 0.0477 | 0.11 | −0.0097 | 0.0473 | 0.11 | −0.0093 | 0.0482 | |
| 0.20 | 0.0191 | 0.0517 | 0.20 | 0.0195 | 0.0522 | 0.20 | 0.0189 | 0.0514 | |
| 0.56 | 0.0857 | 0.0945 | 0.57 | 0.0880 | 0.0956 | 0.57 | 0.0873 | 0.0952 | |
| 0.13 | −0.0066 | 0.0575 | 0.14 | −0.0070 | 0.0591 | 0.13 | −0.0071 | 0.0591 | |
| 0.11 | 0.0039 | 0.0376 | 0.11 | 0.0030 | 0.0377 | 0.11 | 0.0030 | 0.0371 | |
| 0.20 | 0.0205 | 0.0511 | 0.19 | 0.0191 | 0.0493 | 0.20 | 0.0199 | 0.0500 | |
| 1.00 | −0.5099 | 0.0926 | 1.00 | −0.5087 | 0.0936 | 1.00 | −0.5089 | 0.0960 | |
| 0.09 | −0.0177 | 0.0773 | 0.09 | −0.0181 | 0.0792 | 0.09 | −0.0186 | 0.0814 | |
| 0.11 | −0.0221 | 0.0848 | 0.10 | −0.0192 | 0.0790 | 0.11 | −0.0210 | 0.0821 | |
| 0.05 | 0.0013 | 0.0265 | 0.06 | 0.0015 | 0.0287 | 0.06 | 0.0016 | 0.0299 | |
| 0.06 | −0.0029 | 0.0267 | 0.06 | −0.0028 | 0.0258 | 0.06 | −0.0031 | 0.0268 | |
| const | 0.14 | −0.0996 | 0.3097 | 0.14 | −0.0956 | 0.3035 | 0.13 | −0.0898 | 0.2958 |
| Variable | |||||||||
|---|---|---|---|---|---|---|---|---|---|
| PIP | Avg. | Avg. | PIP | Avg. | Avg. | PIP | Avg. | Avg. | |
| Mean | Std. Dev. | Mean | Std. Dev. | Mean | Std. Dev. | ||||
| 1.00 | 0.0379 | 0.0014 | 1.00 | 0.0379 | 0.0014 | 1.00 | 0.0379 | 0.0014 | |
| 1.00 | 0.2617 | 0.0238 | 1.00 | 0.1879 | 0.0354 | 1.00 | 0.1879 | 0.0354 | |
| 1.00 | −0.9687 | 0.1024 | 1.00 | −0.9686 | 0.1024 | 1.00 | −0.9685 | 0.1024 | |
| 1.00 | 0.1877 | 0.0353 | 1.00 | 0.2617 | 0.0238 | 1.00 | 0.2617 | 0.0238 | |
| 1.00 | 0.2797 | 0.0324 | 1.00 | 0.2796 | 0.0324 | 1.00 | 0.2794 | 0.0324 | |
| 1.00 | −0.1685 | 0.0280 | 1.00 | −0.1687 | 0.0281 | 1.00 | −0.1687 | 0.0281 | |
| 0.99 | 0.6893 | 0.1196 | 0.99 | 0.6889 | 0.1201 | 0.99 | 0.6889 | 0.1198 | |
| 0.99 | 0.0490 | 0.0106 | 0.99 | 0.1577 | 0.0308 | 0.99 | 0.1577 | 0.0308 | |
| 0.99 | 0.1575 | 0.0310 | 0.99 | 0.0489 | 0.0107 | 0.99 | 0.0489 | 0.0106 | |
| 0.59 | −0.0465 | 0.0449 | 0.59 | −0.0463 | 0.0449 | 0.59 | −0.0460 | 0.0449 | |
| 0.12 | 0.0004 | 0.0013 | 0.12 | 0.0004 | 0.0013 | 0.12 | 0.0004 | 0.0013 | |
| 0.10 | 0.0042 | 0.0176 | 0.09 | 0.0039 | 0.0171 | 0.09 | 0.0040 | 0.0172 | |
| 0.07 | 0.0016 | 0.0096 | 0.07 | 0.0017 | 0.0097 | 0.07 | 0.0017 | 0.0097 | |
| 0.06 | 0.0008 | 0.0045 | 0.07 | 0.0008 | 0.0047 | 0.07 | 0.0008 | 0.0047 | |
| const | 0.07 | 0.0001 | 0.0005 | 0.07 | 0.0001 | 0.0006 | 0.07 | 0.0001 | 0.0006 |
| 0.05 | 0.0001 | 0.0086 | 0.05 | −0.0003 | 0.0165 | 0.05 | −0.0001 | 0.0163 | |
| 0.06 | −0.0003 | 0.0167 | 0.05 | 0.0002 | 0.0070 | 0.06 | 0.0001 | 0.0092 | |
| 0.05 | <0.0000 | 0.0028 | 0.05 | 0.0001 | 0.0085 | 0.05 | <0.0000 | 0.0028 | |
| 0.05 | 0.0002 | 0.0068 | 0.05 | 0.0022 | 0.0619 | 0.05 | 0.0023 | 0.0611 | |
| 0.05 | 0.0016 | 0.0591 | 0.05 | <0.0001 | 0.0029 | 0.05 | 0.0002 | 0.0069 | |
| CPUs | UKM1 | UK Inflation | ||||||
|---|---|---|---|---|---|---|---|---|
| without Forecasts | with Forecasts | without Forecasts | with Forecasts | |||||
| Nrep | Run Time | Nrep | Run Time | Nrep | Run Time | Nrep | Run Time | |
| 1 | 147 | 169 | 112 | 128 | ||||
| 4 | 128 | 143 | 49 | 54 | ||||
| 20 | 23 | 28 | 15 | 17 | ||||
| CPUs | UKM1 | UK Inflation | ||||||
|---|---|---|---|---|---|---|---|---|
| without Forecasts | with Forecasts | without Forecasts | with Forecasts | |||||
| Nrep | Run Time | Nrep | Run Time | Nrep | Run Time | Nrep | Run Time | |
| 1 | 10,554 | 275,165 | 1457 | 35,996 | ||||
| 4 | 2470 | 56,294 | 380 | 6829 | ||||
| 20 | 1169 | 14,771 | 136 | 3044 | ||||
| CPUs | UKM1 | UK Inflation | ||||||
|---|---|---|---|---|---|---|---|---|
| without Forecasts | with forecasts | without Forecasts | with Forecasts | |||||
| Nrep | Run Time | Nrep | Run Time | Nrep | Run Time | Nrep | Run Time | |
| 1 | 353 | 291,328 | 81 | 32,095 | ||||
| 4 | 167 | 65,862 | 54 | 6556 | ||||
| 20 | 103 | 16,630 | 55 | 1778 | ||||
© 2020 by the authors. Licensee MDPI, Basel, Switzerland. This article is an open access article distributed under the terms and conditions of the Creative Commons Attribution (CC BY) license (http://creativecommons.org/licenses/by/4.0/).
Share and Cite
Błażejowski, M.; Kwiatkowski, J.; Kufel, P. BACE and BMA Variable Selection and Forecasting for UK Money Demand and Inflation with Gretl. Econometrics 2020, 8, 21. https://doi.org/10.3390/econometrics8020021
Błażejowski M, Kwiatkowski J, Kufel P. BACE and BMA Variable Selection and Forecasting for UK Money Demand and Inflation with Gretl. Econometrics. 2020; 8(2):21. https://doi.org/10.3390/econometrics8020021
Chicago/Turabian StyleBłażejowski, Marcin, Jacek Kwiatkowski, and Paweł Kufel. 2020. "BACE and BMA Variable Selection and Forecasting for UK Money Demand and Inflation with Gretl" Econometrics 8, no. 2: 21. https://doi.org/10.3390/econometrics8020021
APA StyleBłażejowski, M., Kwiatkowski, J., & Kufel, P. (2020). BACE and BMA Variable Selection and Forecasting for UK Money Demand and Inflation with Gretl. Econometrics, 8(2), 21. https://doi.org/10.3390/econometrics8020021