


The Definitive Guide to Actual Sensor Network Deployments in Research Studies from 2013–2017: A Systematic Review

 , , , and
Abstract
1. Introduction
2. Materials and Methods
- First, the scope of the systematic review was defined as follows: original publications (no review articles) in English language, indexed by either SCOPUS or Web of Science, describing a physical deployment of a sensor network (at least two devices), published between the years 2013 and 2017 inclusive;
- Queries for both selected databases were built as follows:
- SCOPUS: KEY (sensor network OR sensor networks) AND TITLE-ABS-KEY (test* OR experiment* OR deploy*) AND NOT TITLE-ABS-KEY (review) AND NOT TITLE-ABS-KEY (simulat*) AND (LIMIT-TO (PUBYEAR, 2017) OR LIMIT-TO (PUBYEAR, 2016) OR LIMIT-TO (PUBYEAR, 2015) OR LIMIT-TO (PUBYEAR, 2014) OR LIMIT-TO (PUBYEAR, 2013));
- Web of Science: TS = (“sensor network” OR “sensor networks”) AND TS = (test* OR experiment* OR deploy*) NOT TI =“review” NOT TS = simulat* with additional parameters: Indexes = SCI-EXPANDED, SSCI, A&HCI, CPCI-S, CPCI-SSH, BKCI-S, BKCI-SSH, ESCI, CCR-EXPANDED, IC Timespan = 2013–2017;
- These queries were executed on 18 June 2018, and a total of 21,740 articles were found, of which 6730 duplicates were removed, leaving 15,010 identified candidate articles;
- These articles were screened for exclusion based on titles and abstracts allowing 10,095 articles to be excluded and leaving 4915 articles;
- Then, full text analysis for eligibility was done on these articles, leading to exclusion of additional 1898 articles;
- This resulted in 3017 articles included in the review, which matched the defined scope;
- Following a thorough validation of identified articles, 15 more articles were identified as mistakenly included, leaving the final included number to 3002 articles;
- From these articles, the team codified all unique sensor network deployments with their related metadata, resulting in the final number of 3059 identified sensor network deployments for which metadata were extracted.
- Details on the actual sensor network deployment described in the article; and,
- If it exists—the goal deployment towards which this research is aimed in the future (1825 deployments of 3059 identified).
3. Results and Discussion
3.1. Originally Extracted Metrics
3.1.1. Years
3.1.2. Technology Readiness Levels
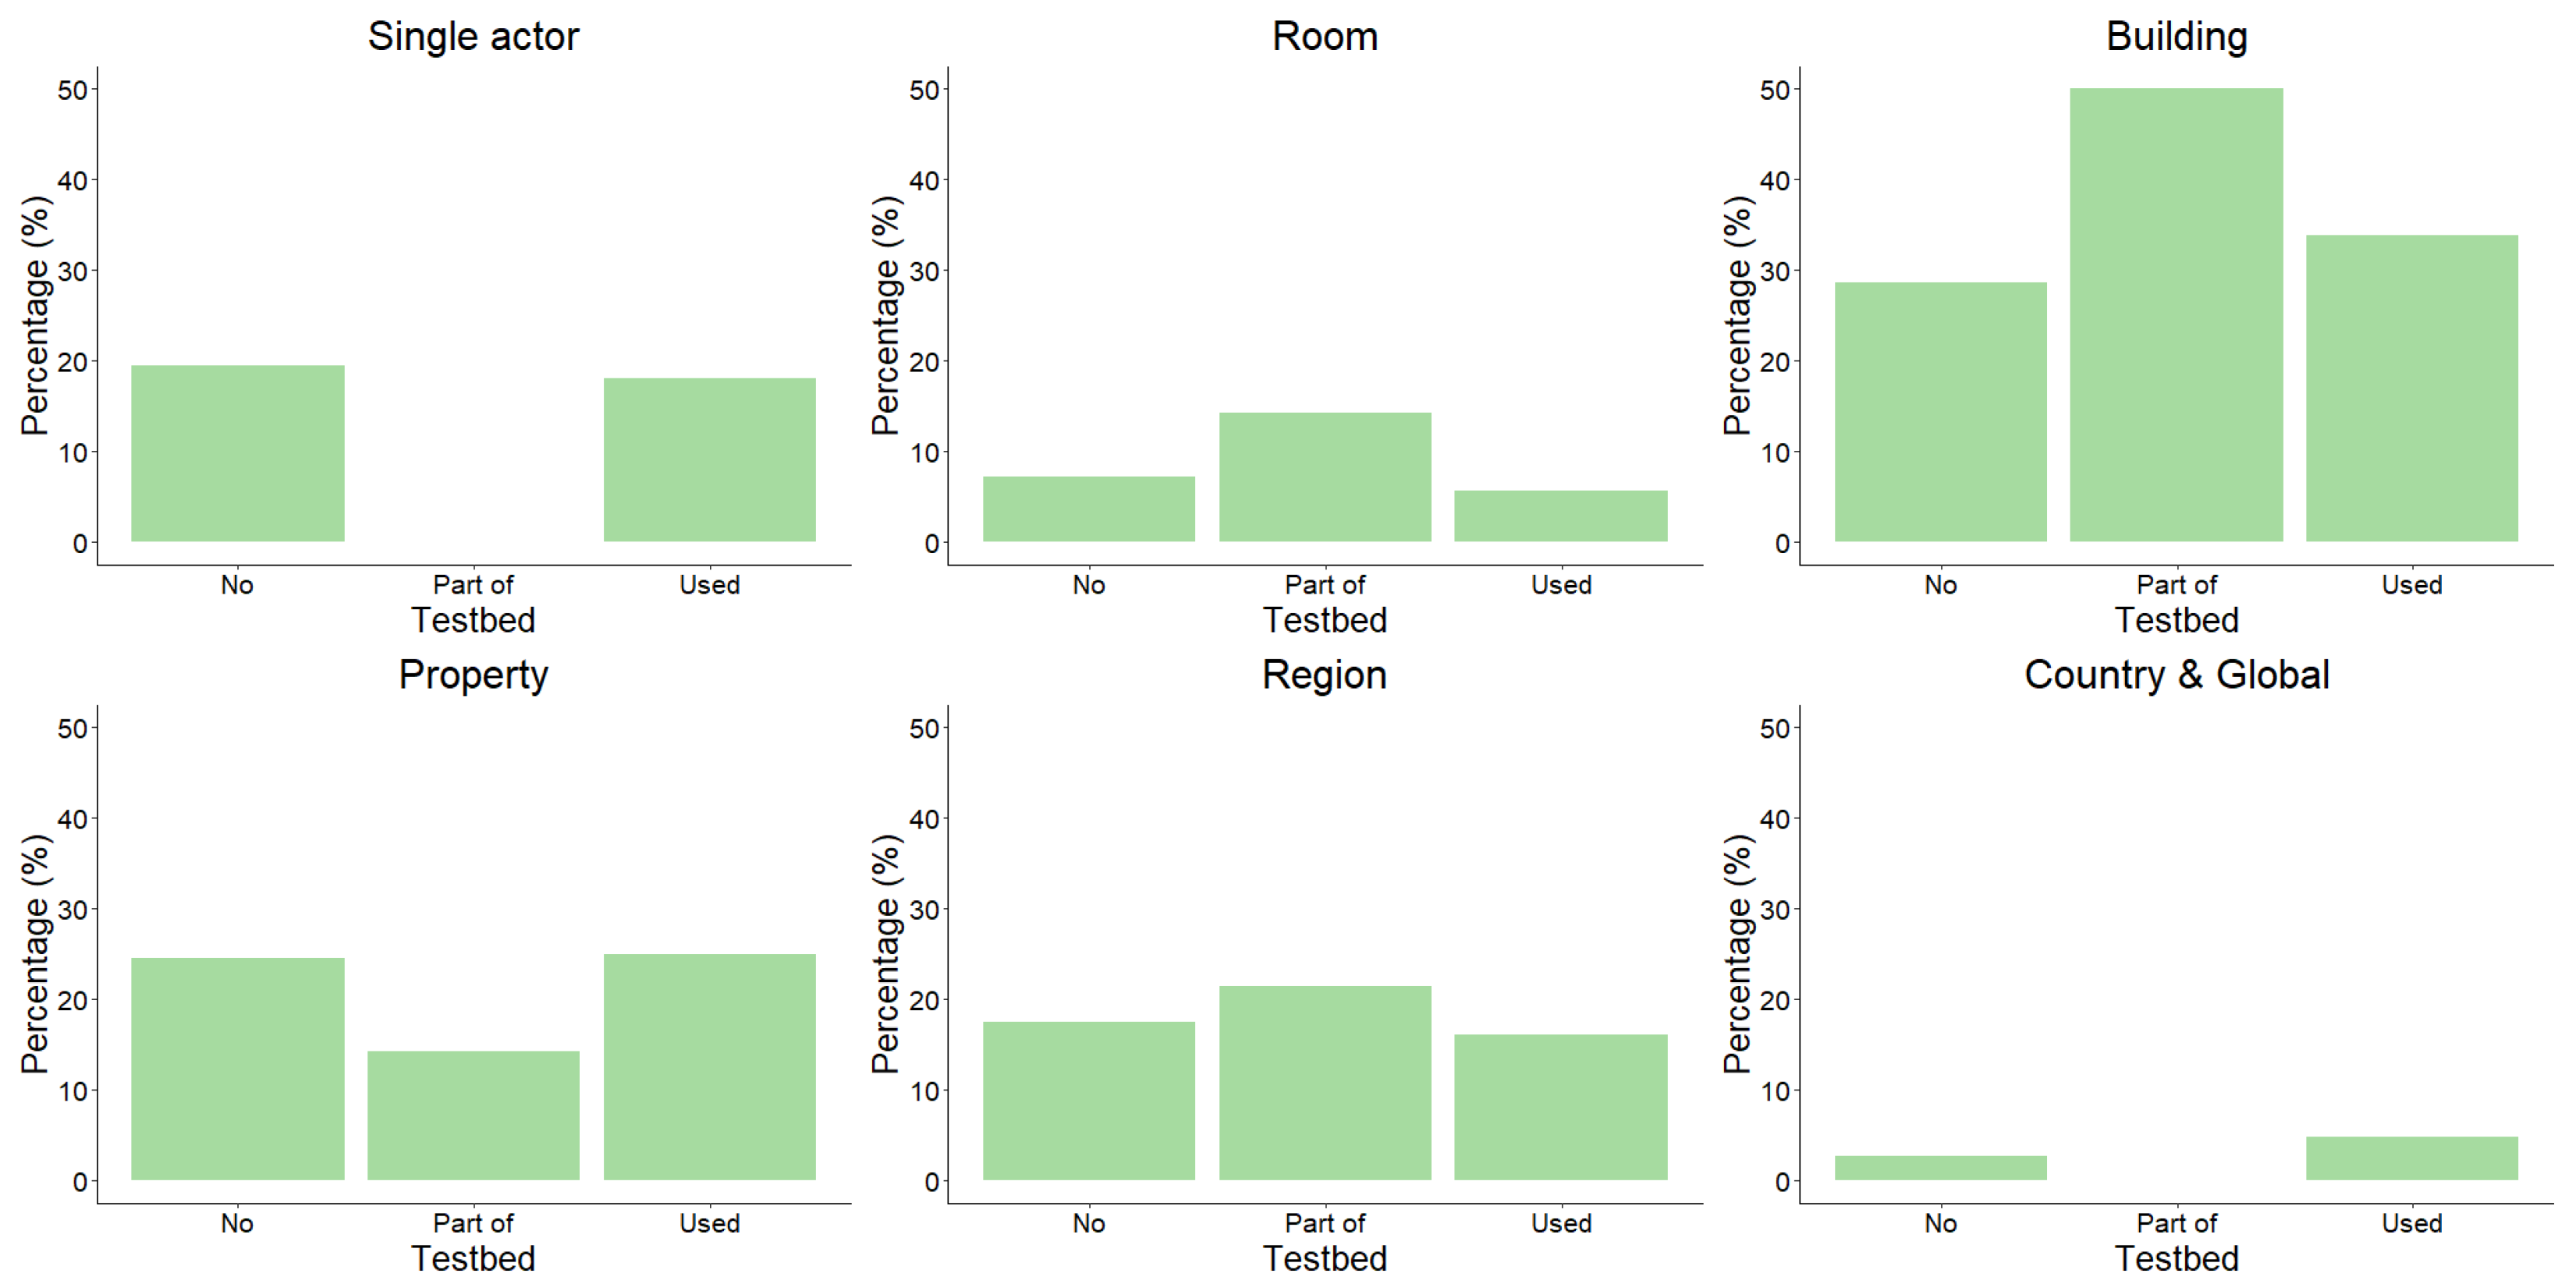
3.1.3. Testbed Facility Usage
3.1.4. Deployment Type
- “Tool”—deployments trying to solve a specific problem in a specific domain (e.g., agriculture, smart city infrastructure, education or any other field where sensor network solution could prove useful);
- “Self”—where the deployment is meant for research in sensor networks themselves and not using sensor networks as tools for research in other domains.
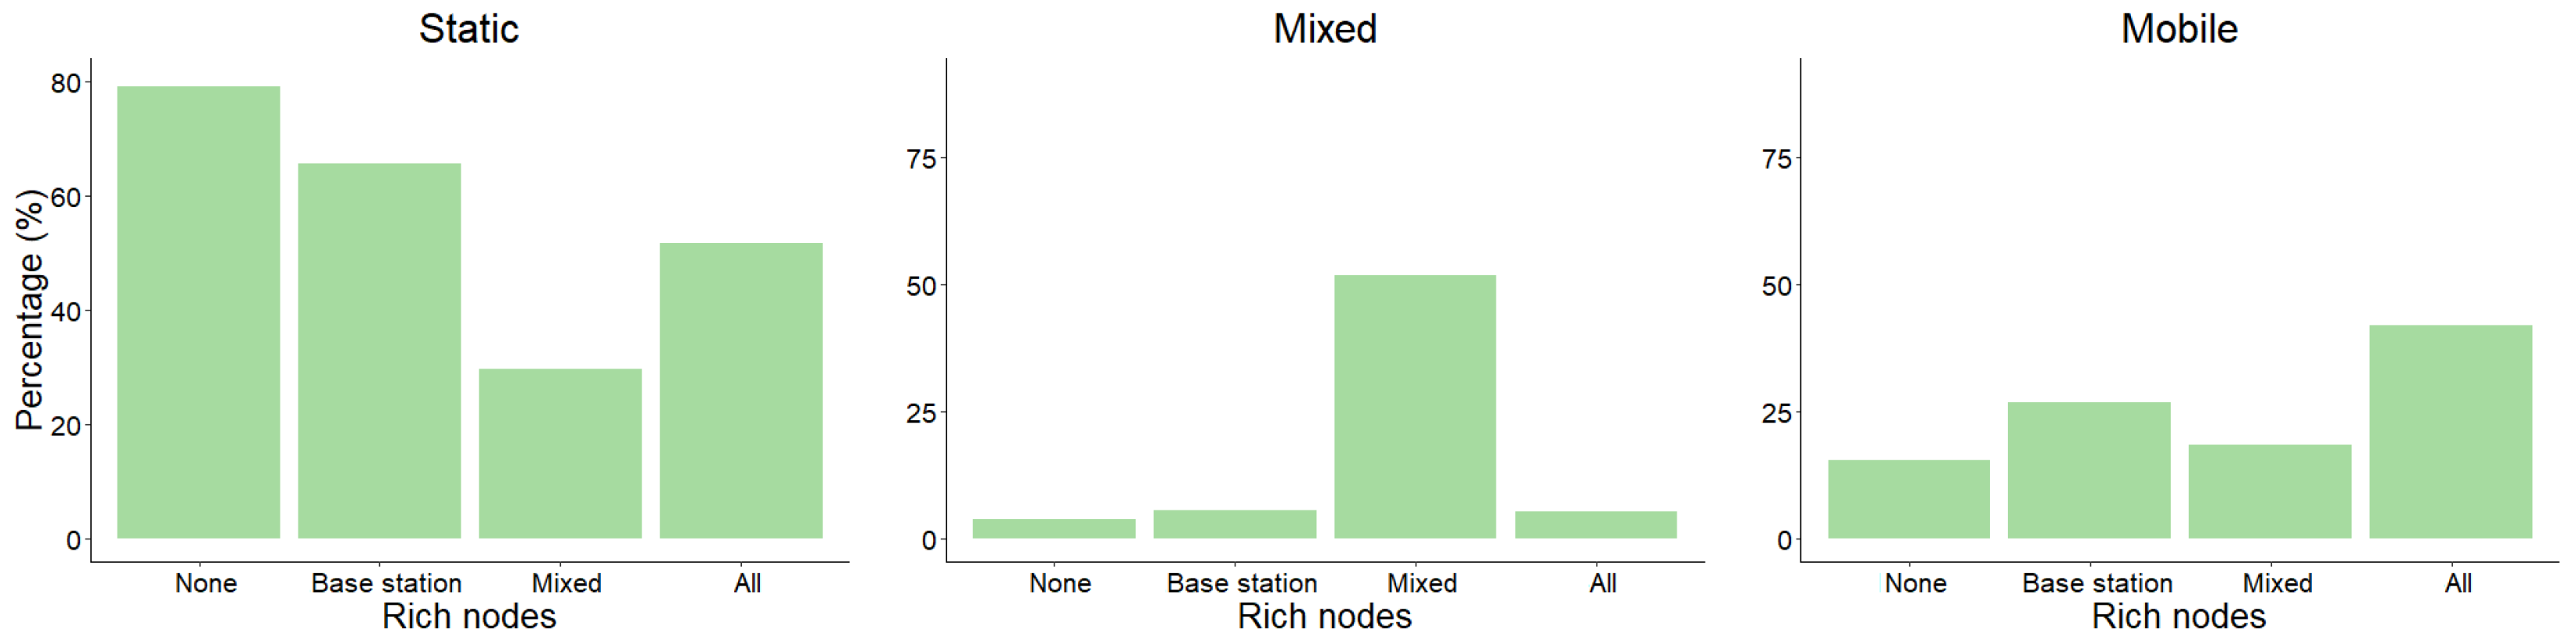
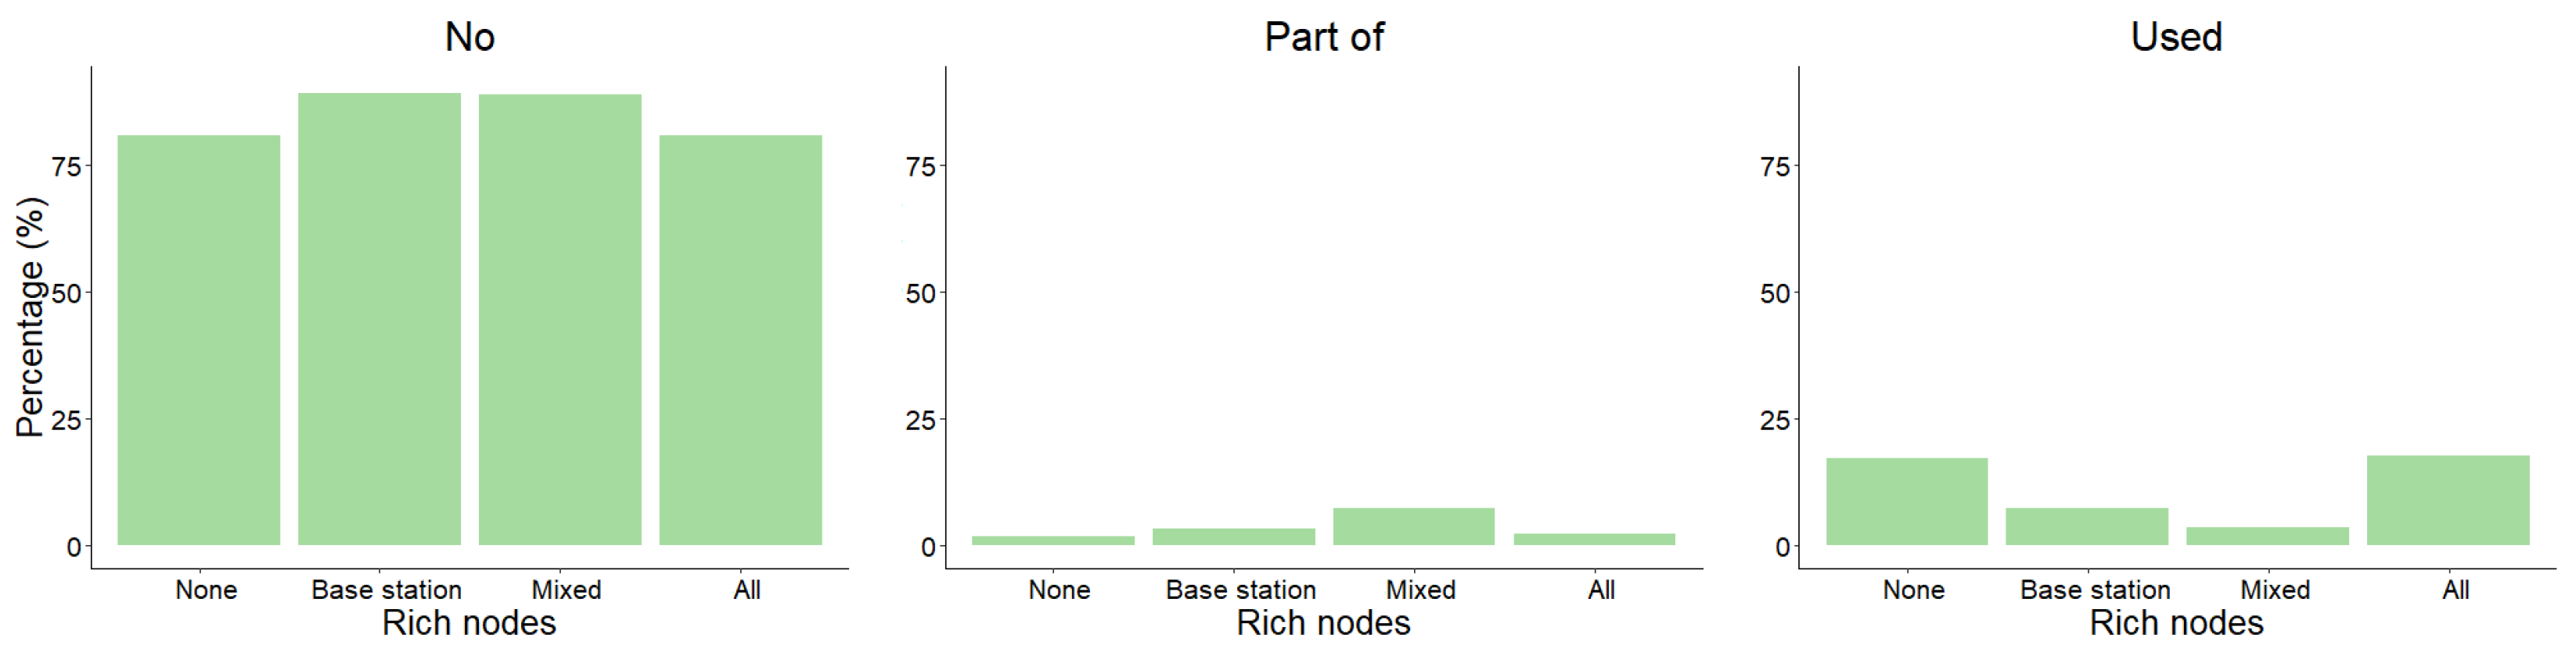
3.1.5. Rich Nodes
- Simple—these are simple nodes that usually consist only of an embedded micro controller (MCU), Radio and a couple of sensors (e.g., Telos B, Arduino based systems, devices based on MSP, Atmega and similar MCUs);
- Rich—these nodes are rich devices with a dedicated central processing unit (e.g., ARM or x86), capable of running a fully fledged operating system (e.g., Linux) and can potentially have additional rich periphery such as high resolution displays, quality audio speakers etc. (e.g., Raspberry Pi, mobile phone, embedded computer).
- For 16 (0.52%) of all deployments we were not able to determine the node makeup of the deployed sensor network (“Null” in the graph);
- The majority of deployments—2374 (77.61%)—-consisted only of Simple devices (“None” in graph) meaning, that the historical trend of building sensor networks from simple low energy embedded devices still holds;
- The remaining 669 ( 21.87%) contain at least some Rich nodes:
- -
- Of these deployments, 416 (13.6%) contained a Rich base station node while the rest of nodes were Simple (“Base stations” in graph);
- -
- Additionally, 226 (7.39%) deployments contained only Rich nodes (“All” in graph);
- -
- Only 27 (0.88%) deployments contained a mix of Rich and Simple nodes, where some of the Rich nodes were not base stations.
3.1.6. Node Mobility
3.1.7. Node Connectivity
3.1.8. Deployment Goal Network
Field of the Goal Network
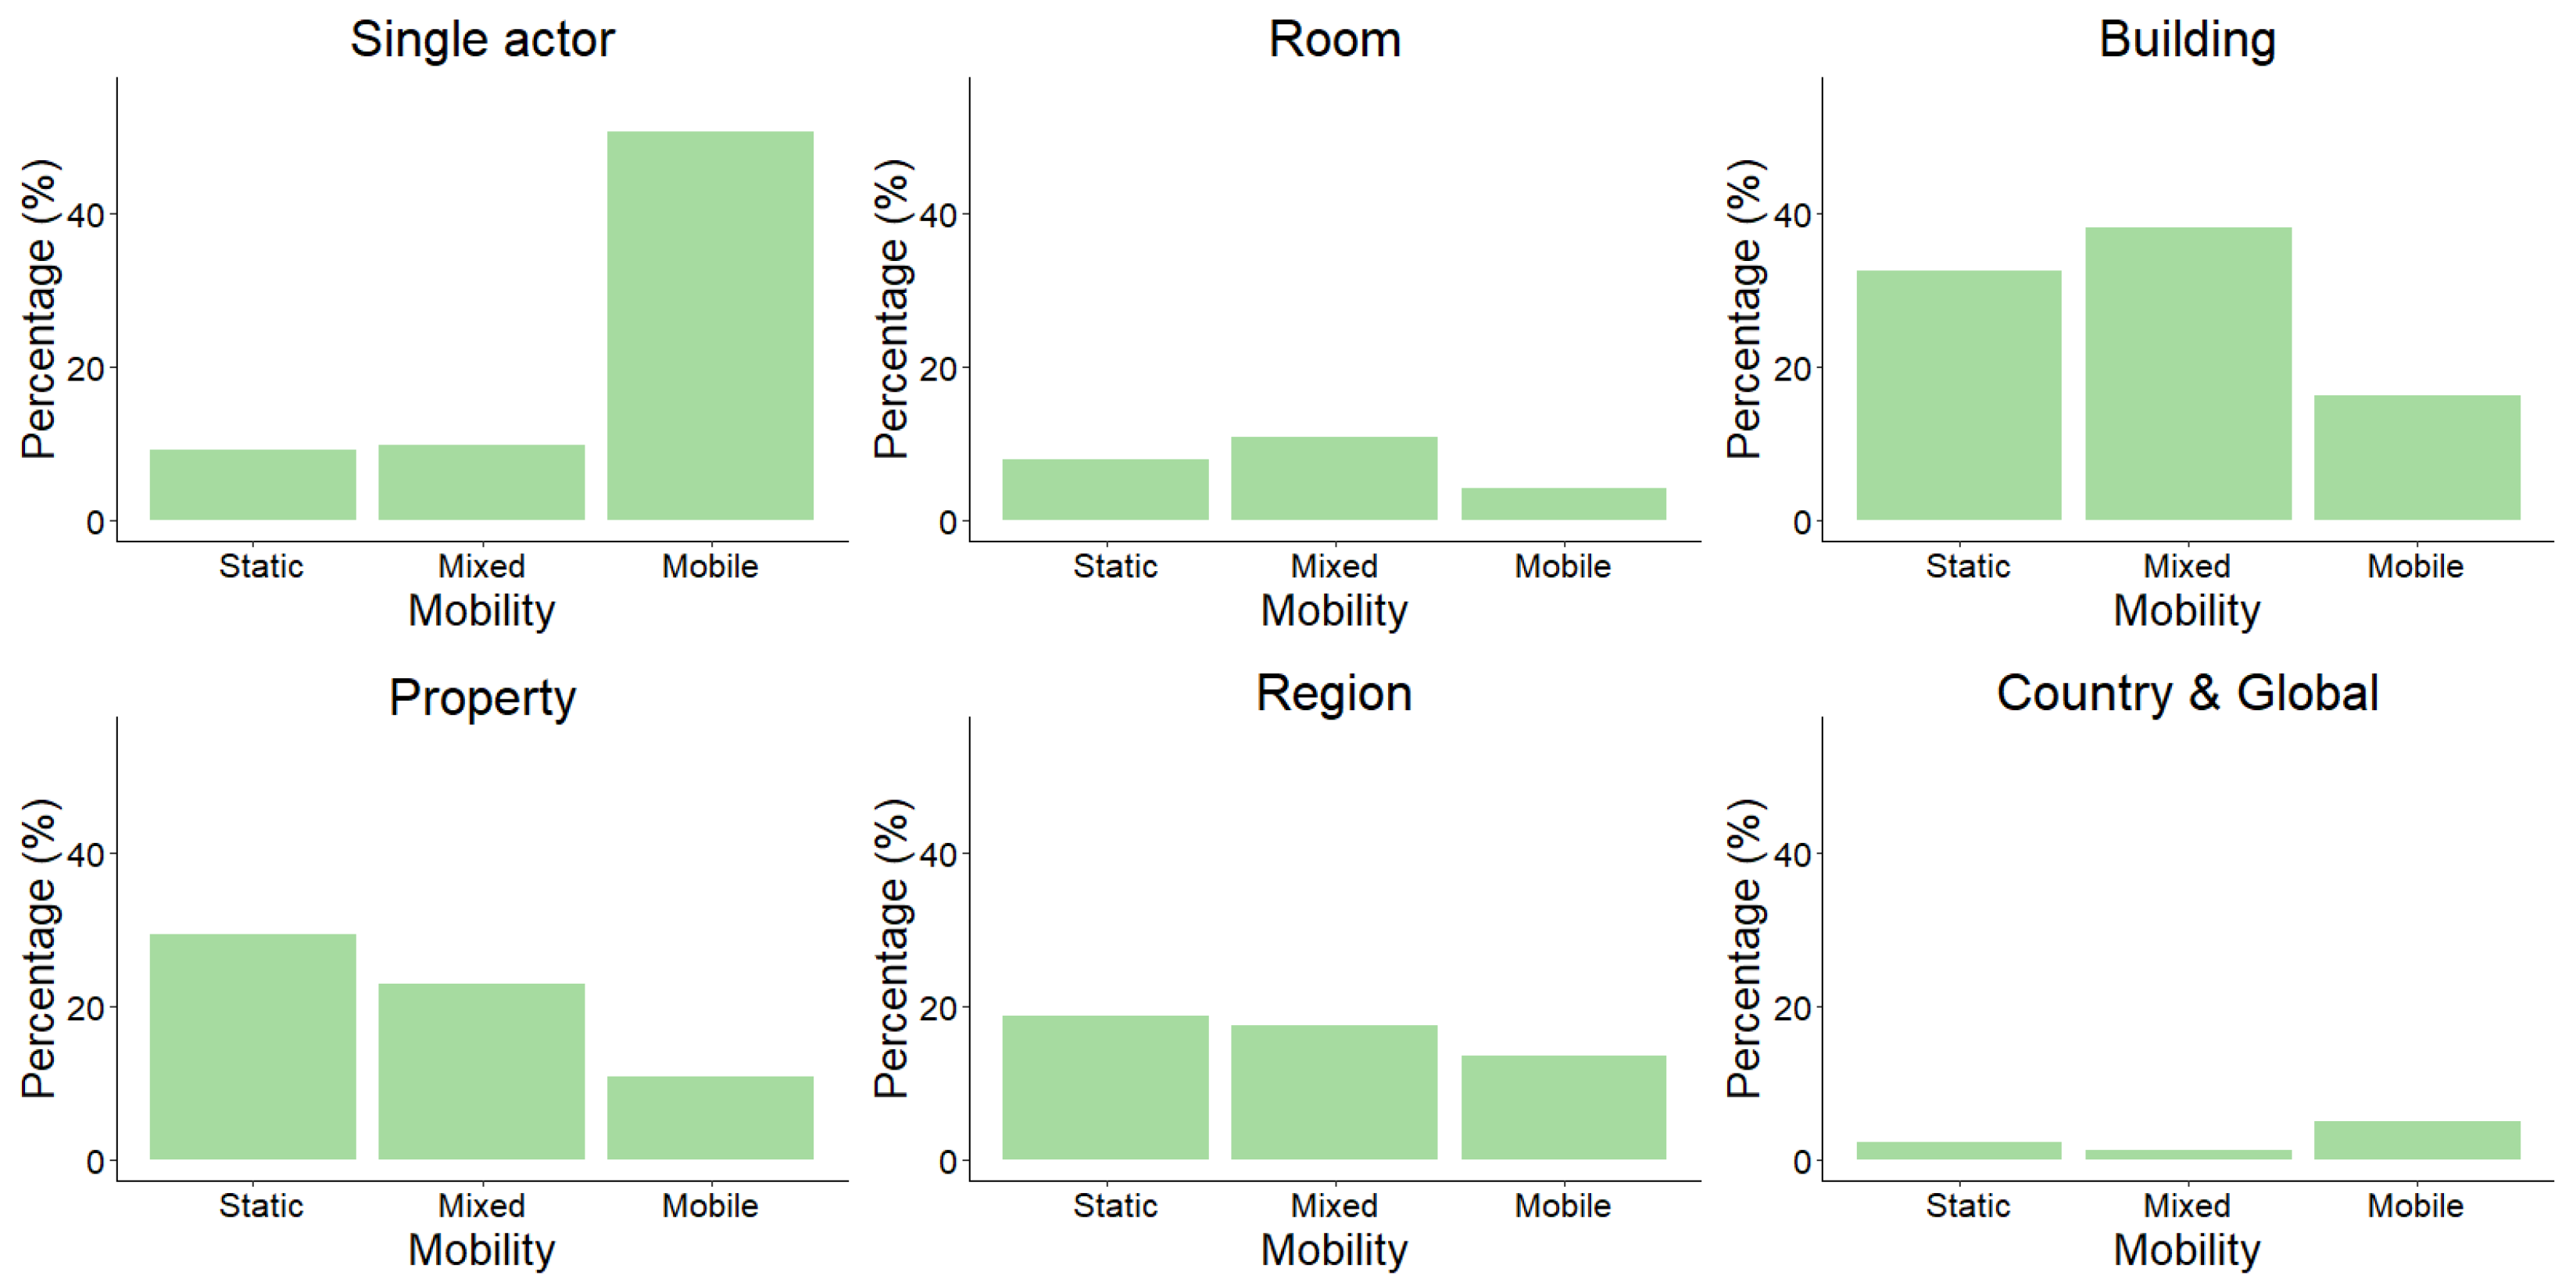
Scale of the Goal Network
Subject of the Goal Network
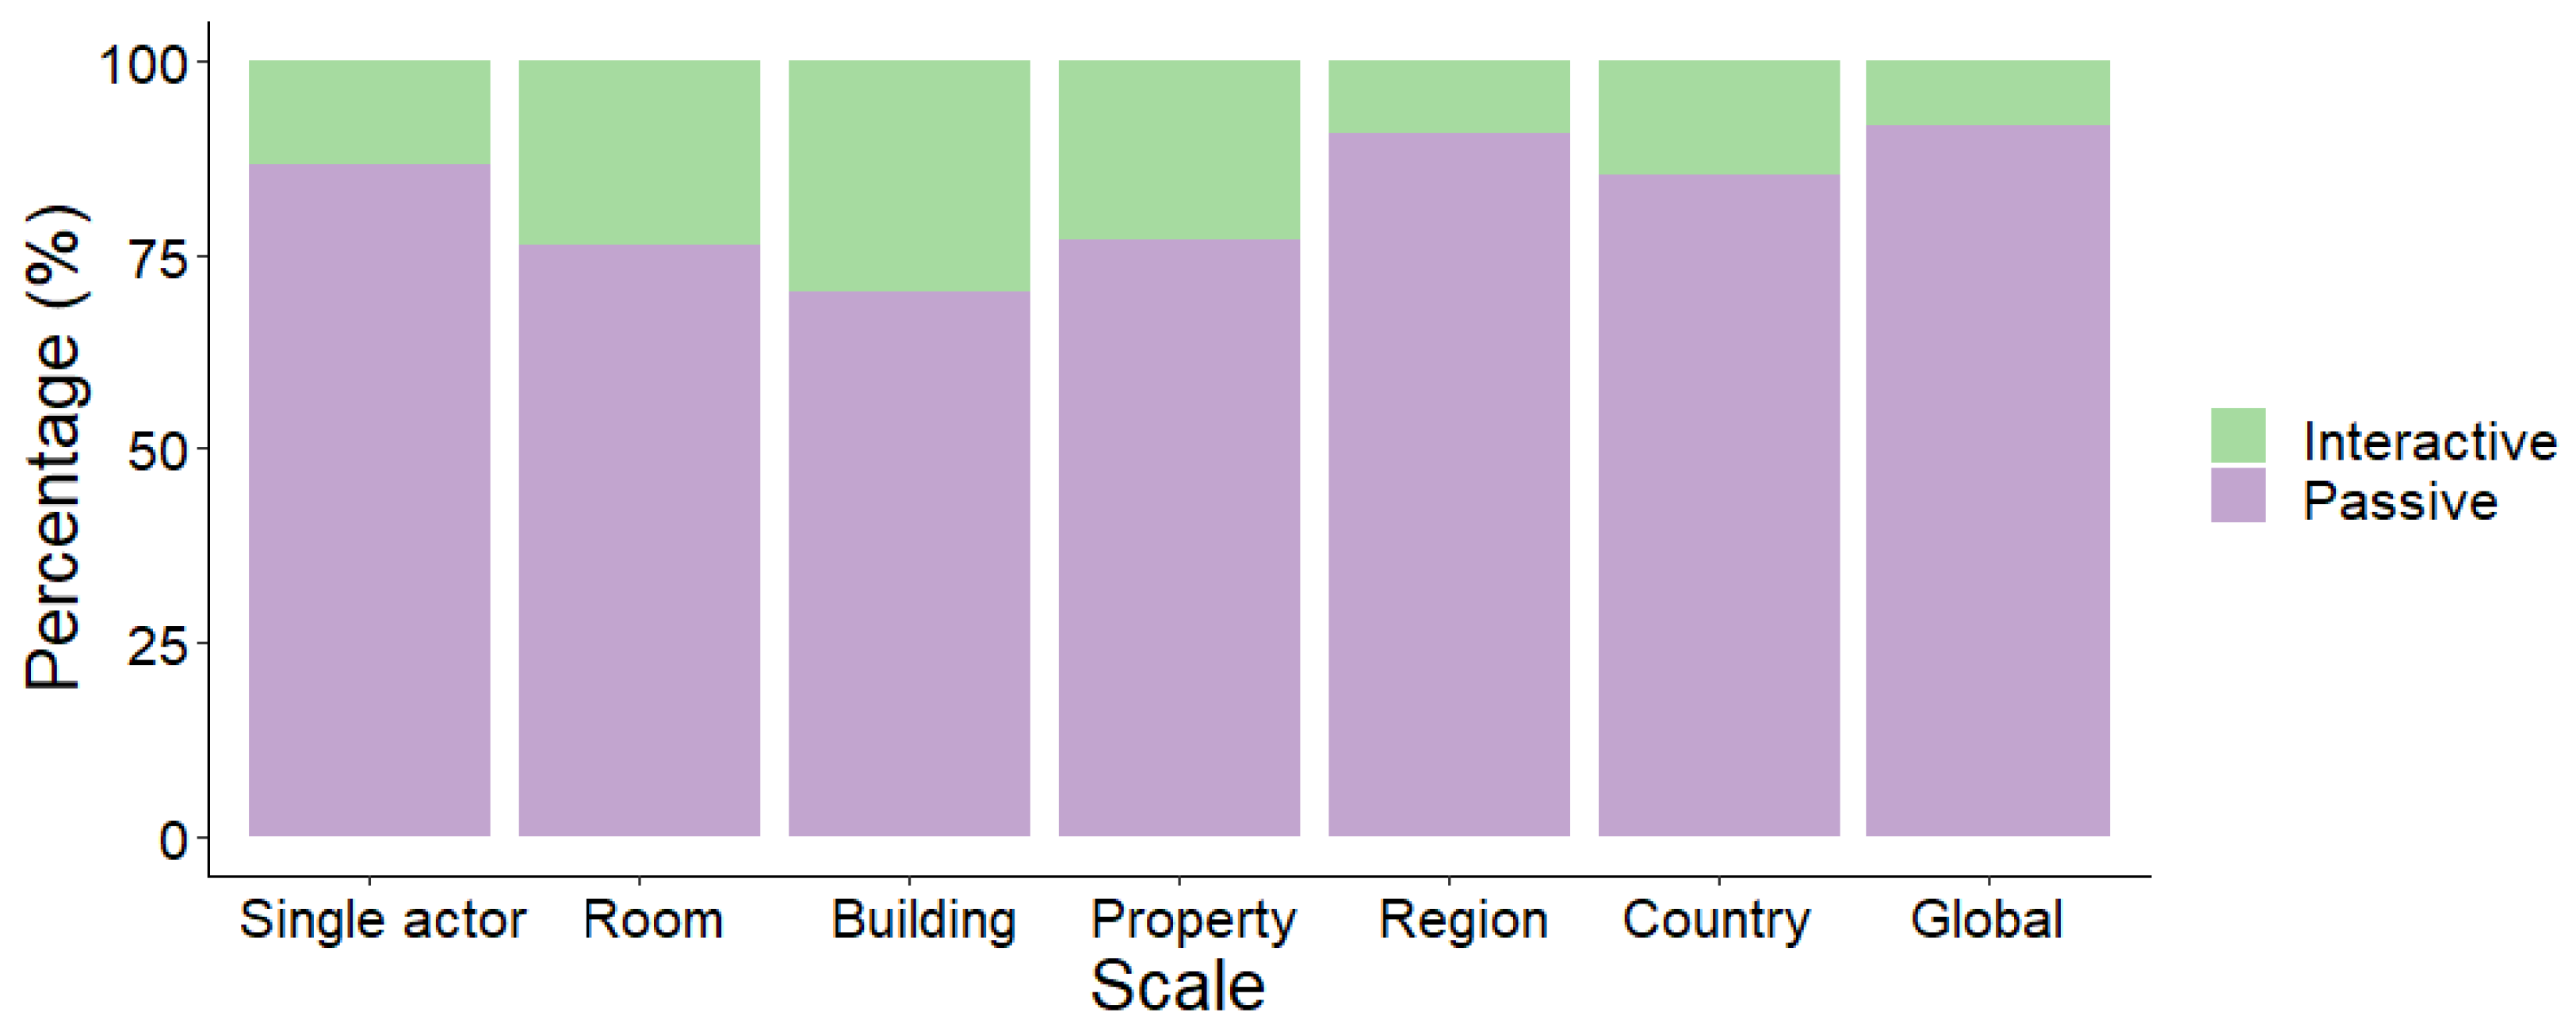
Interactivity of the Goal Network
3.2. Double Metric Data
- Technology Readiness Level;
- Usage of rich nodes;
- Sensor node mobility;
- Sensor network deployment interactivity;
- Testbeds;
- Wireless sensor networks;
- Sensor network deployment usage.
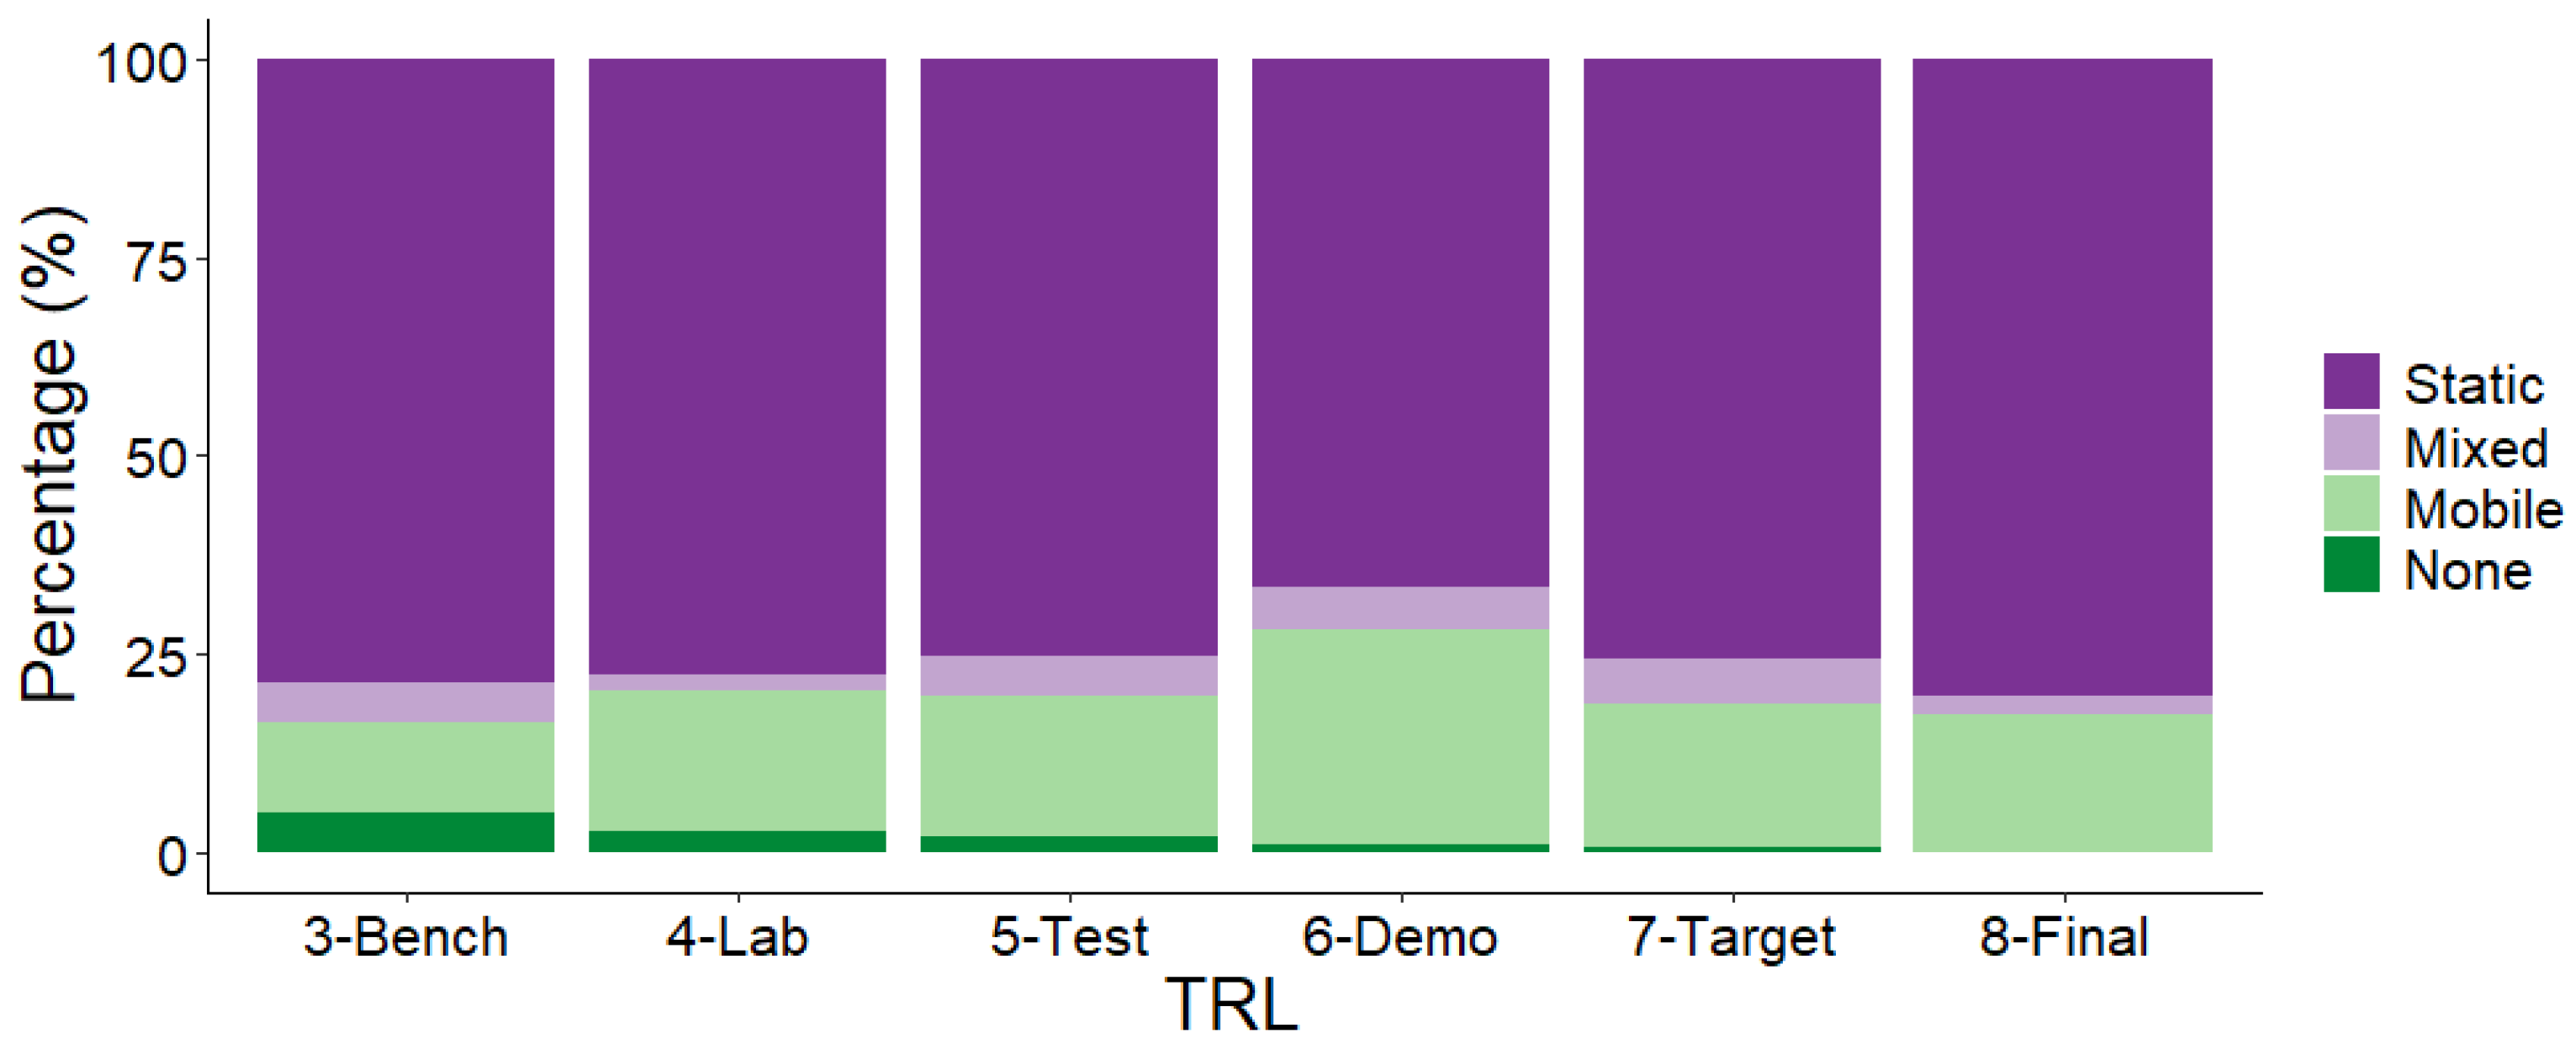
3.2.1. Technology Readiness Levels
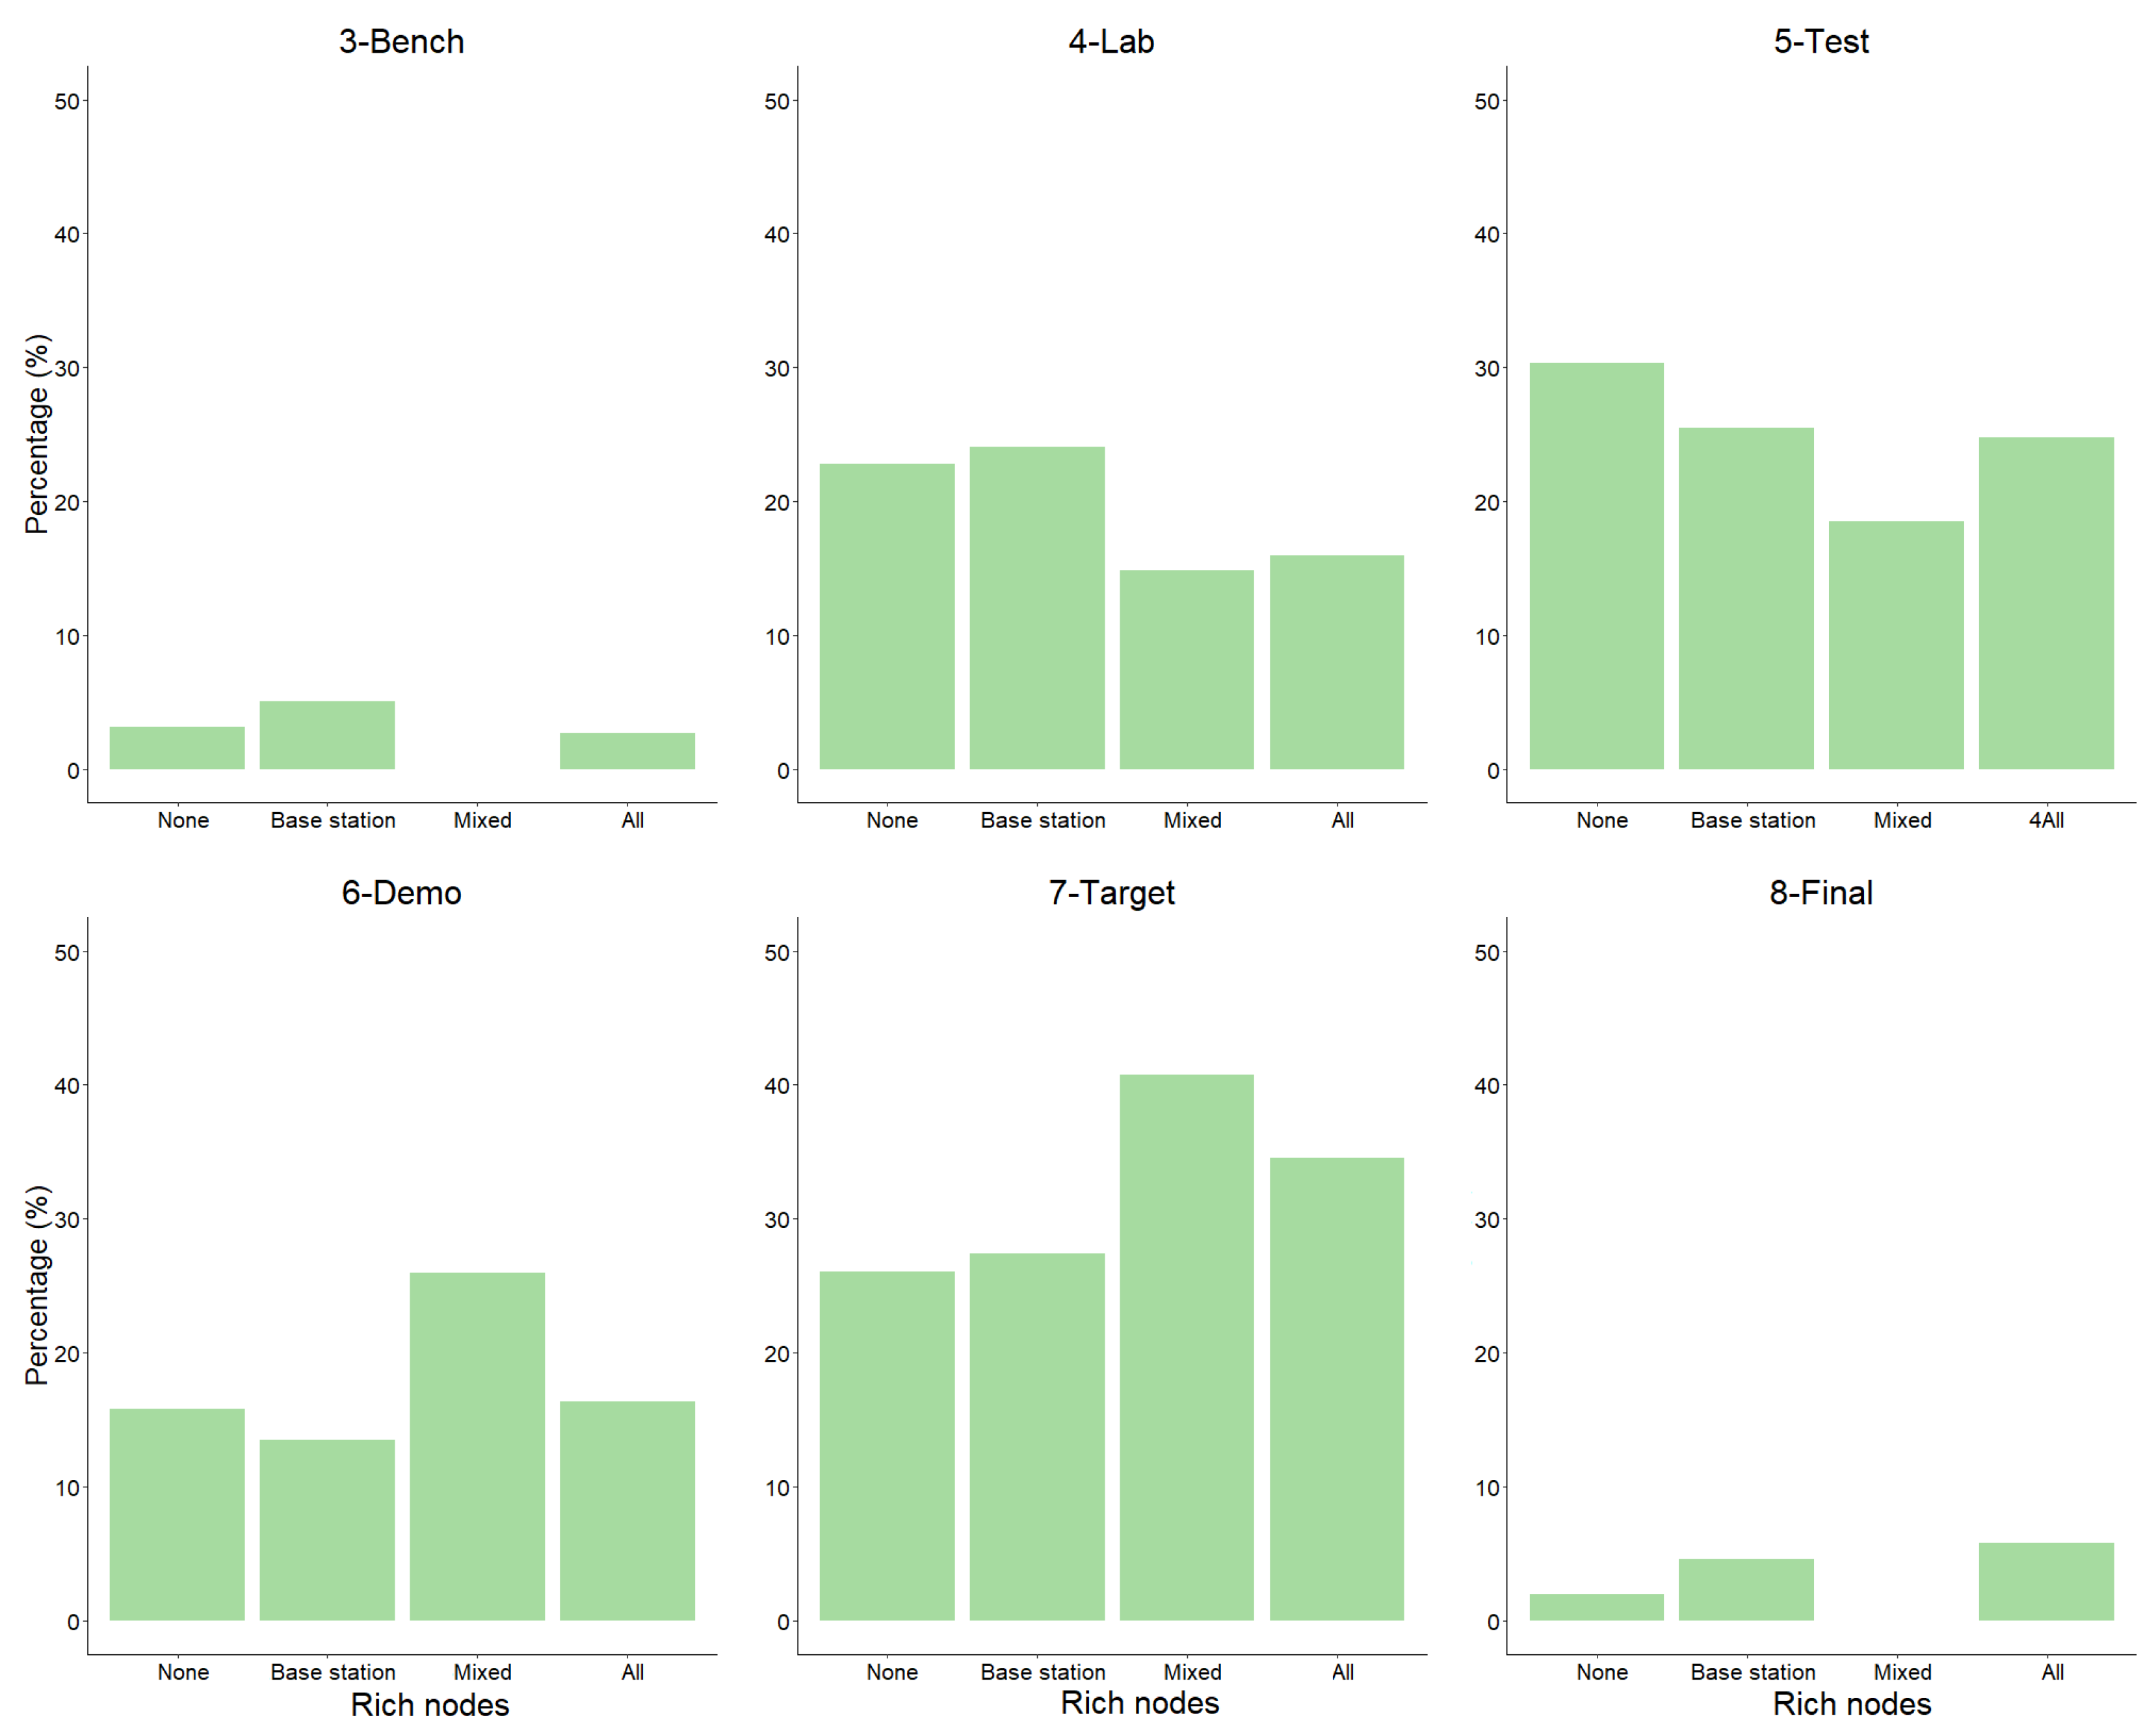
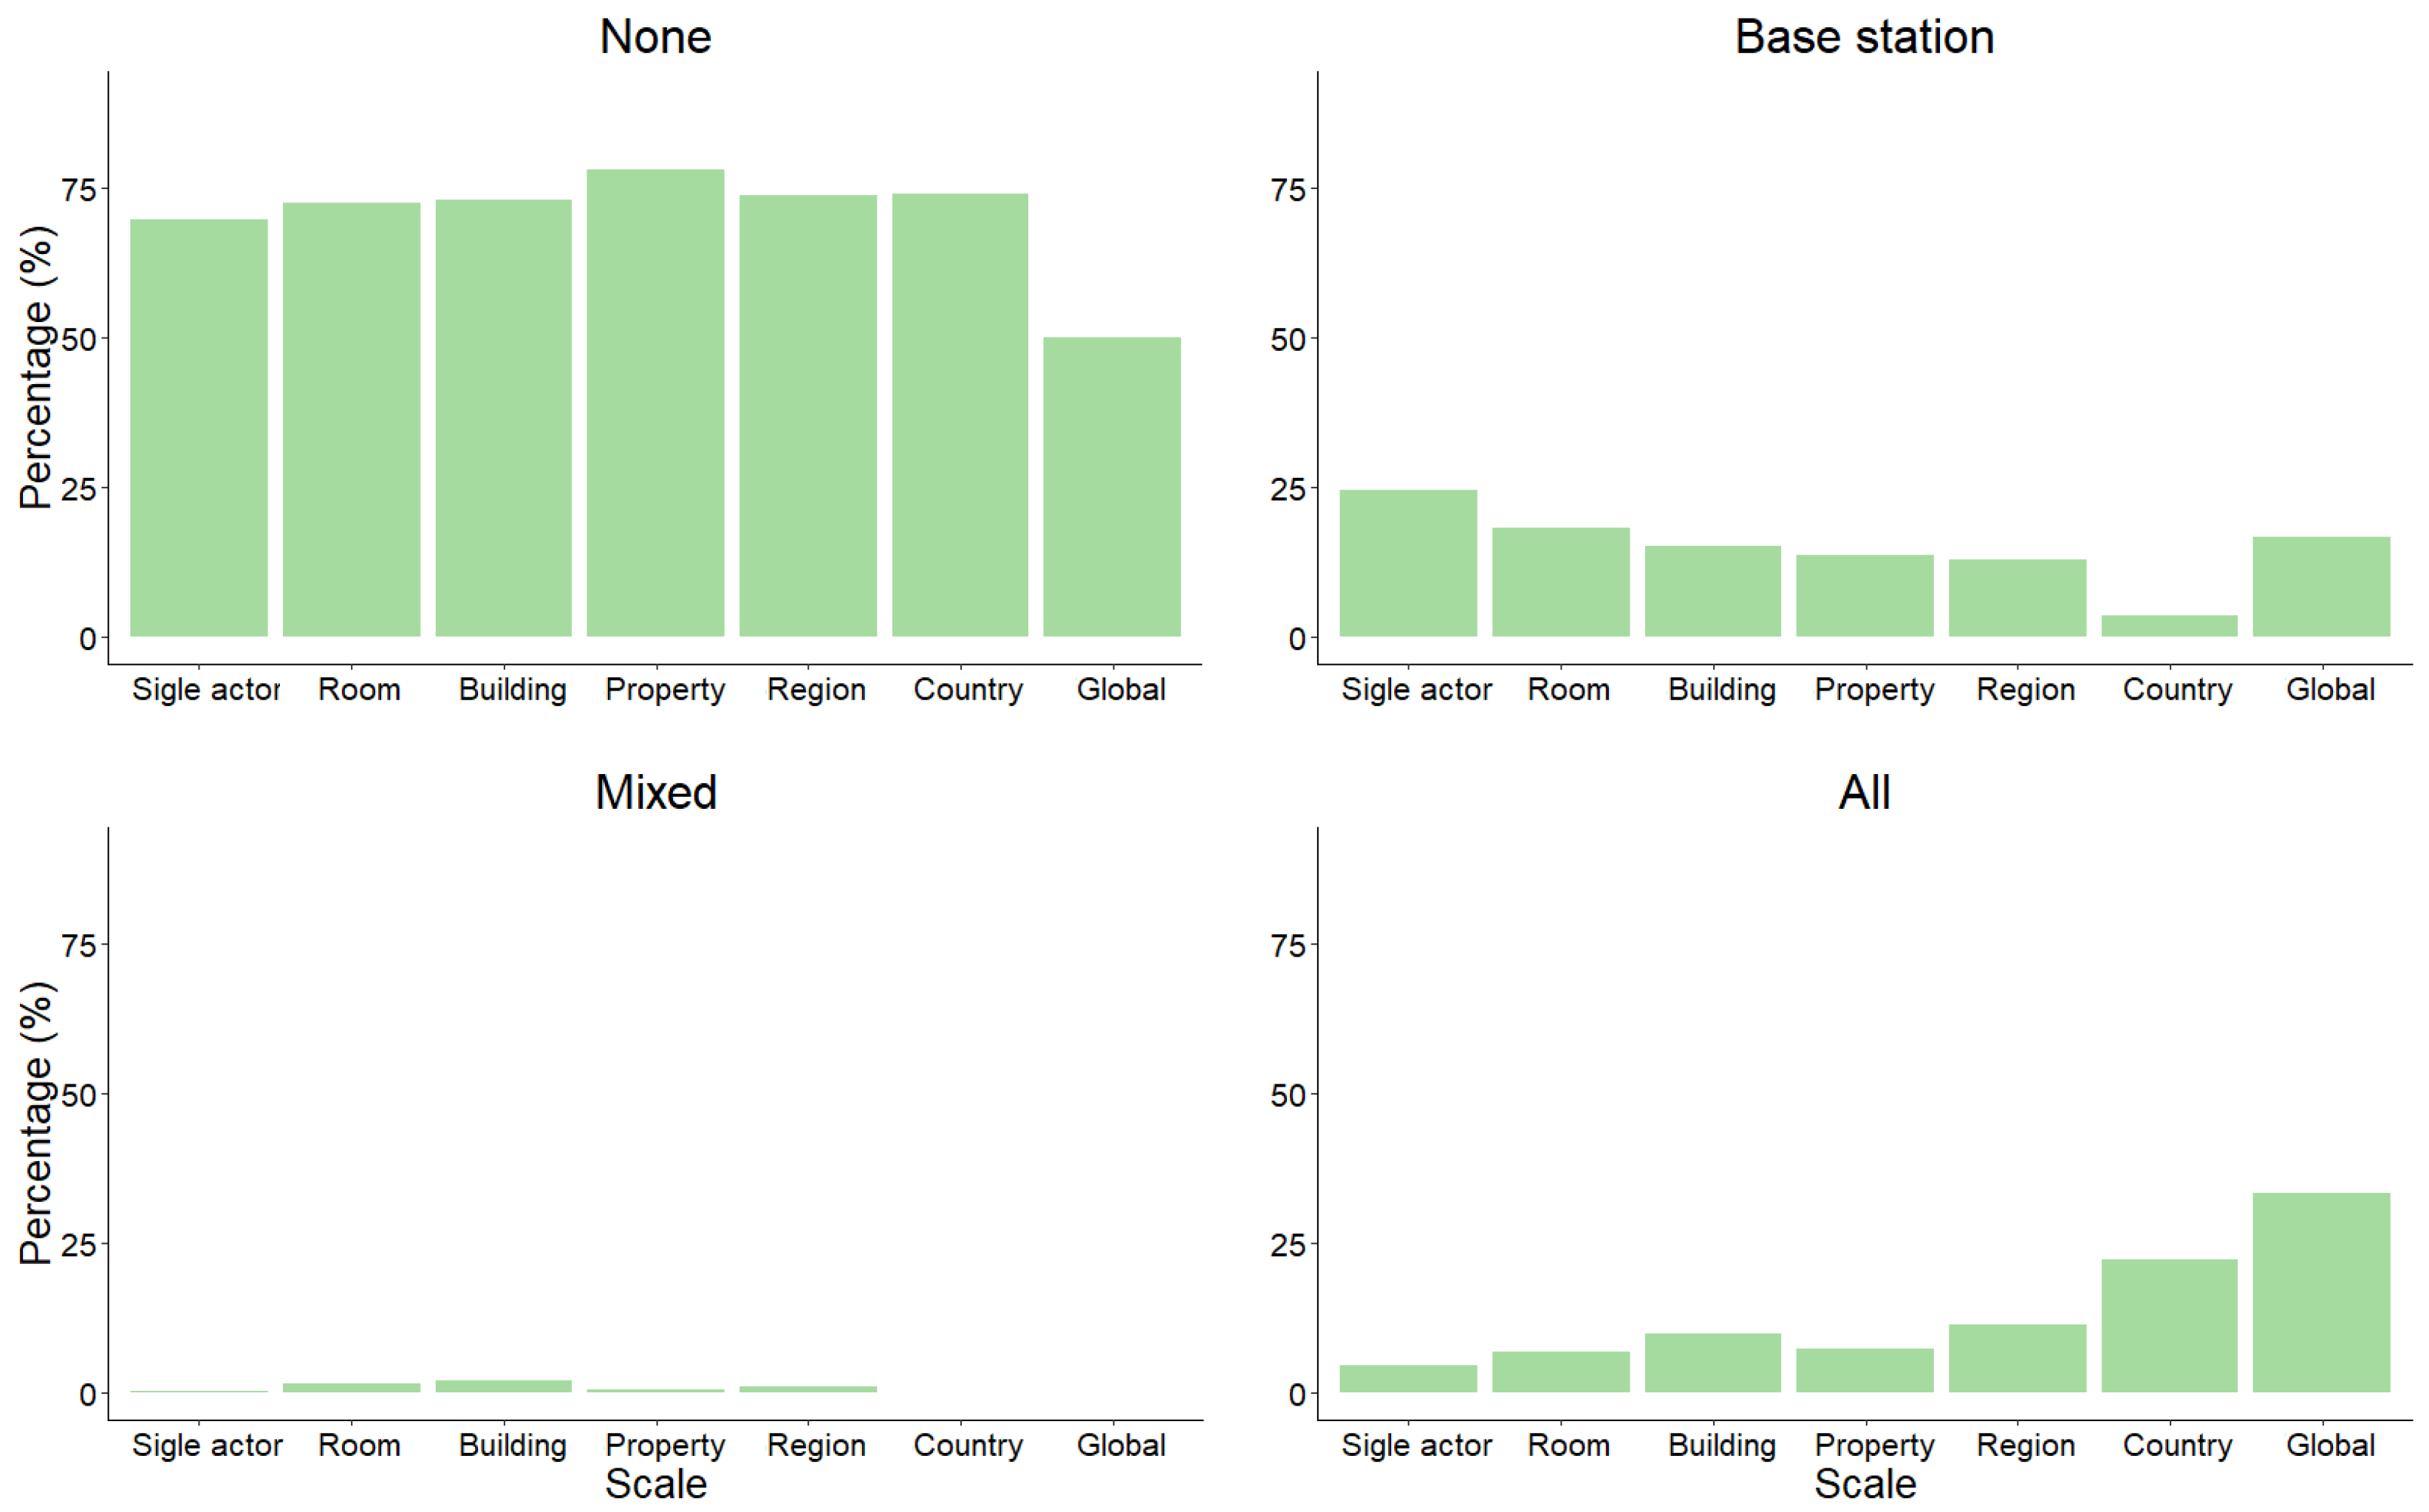
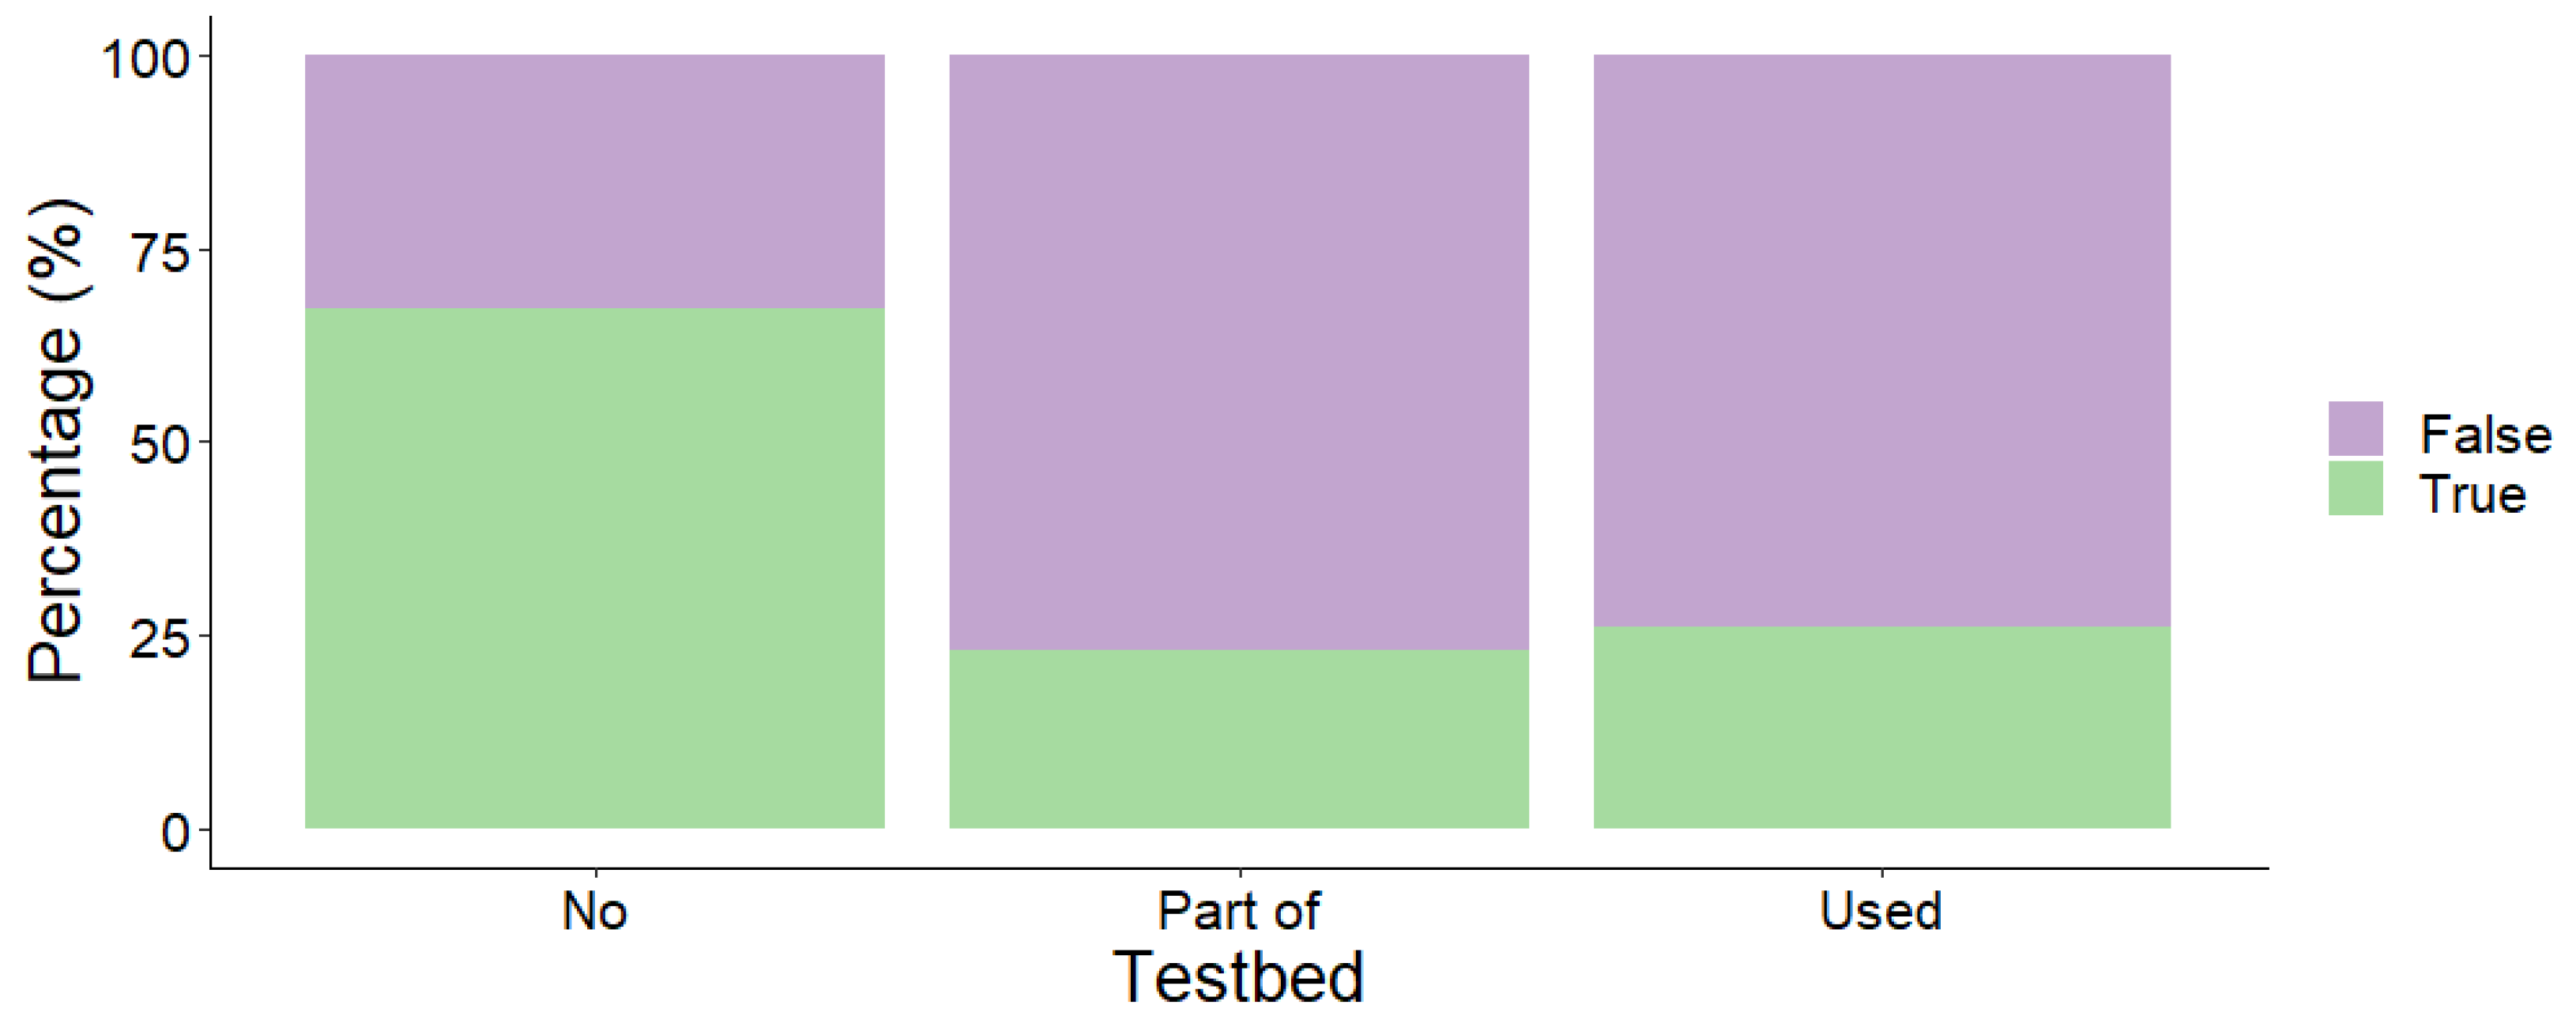
3.2.2. Rich Nodes
3.2.3. Node Mobility
3.2.4. Interactivity
3.2.5. Testbeds
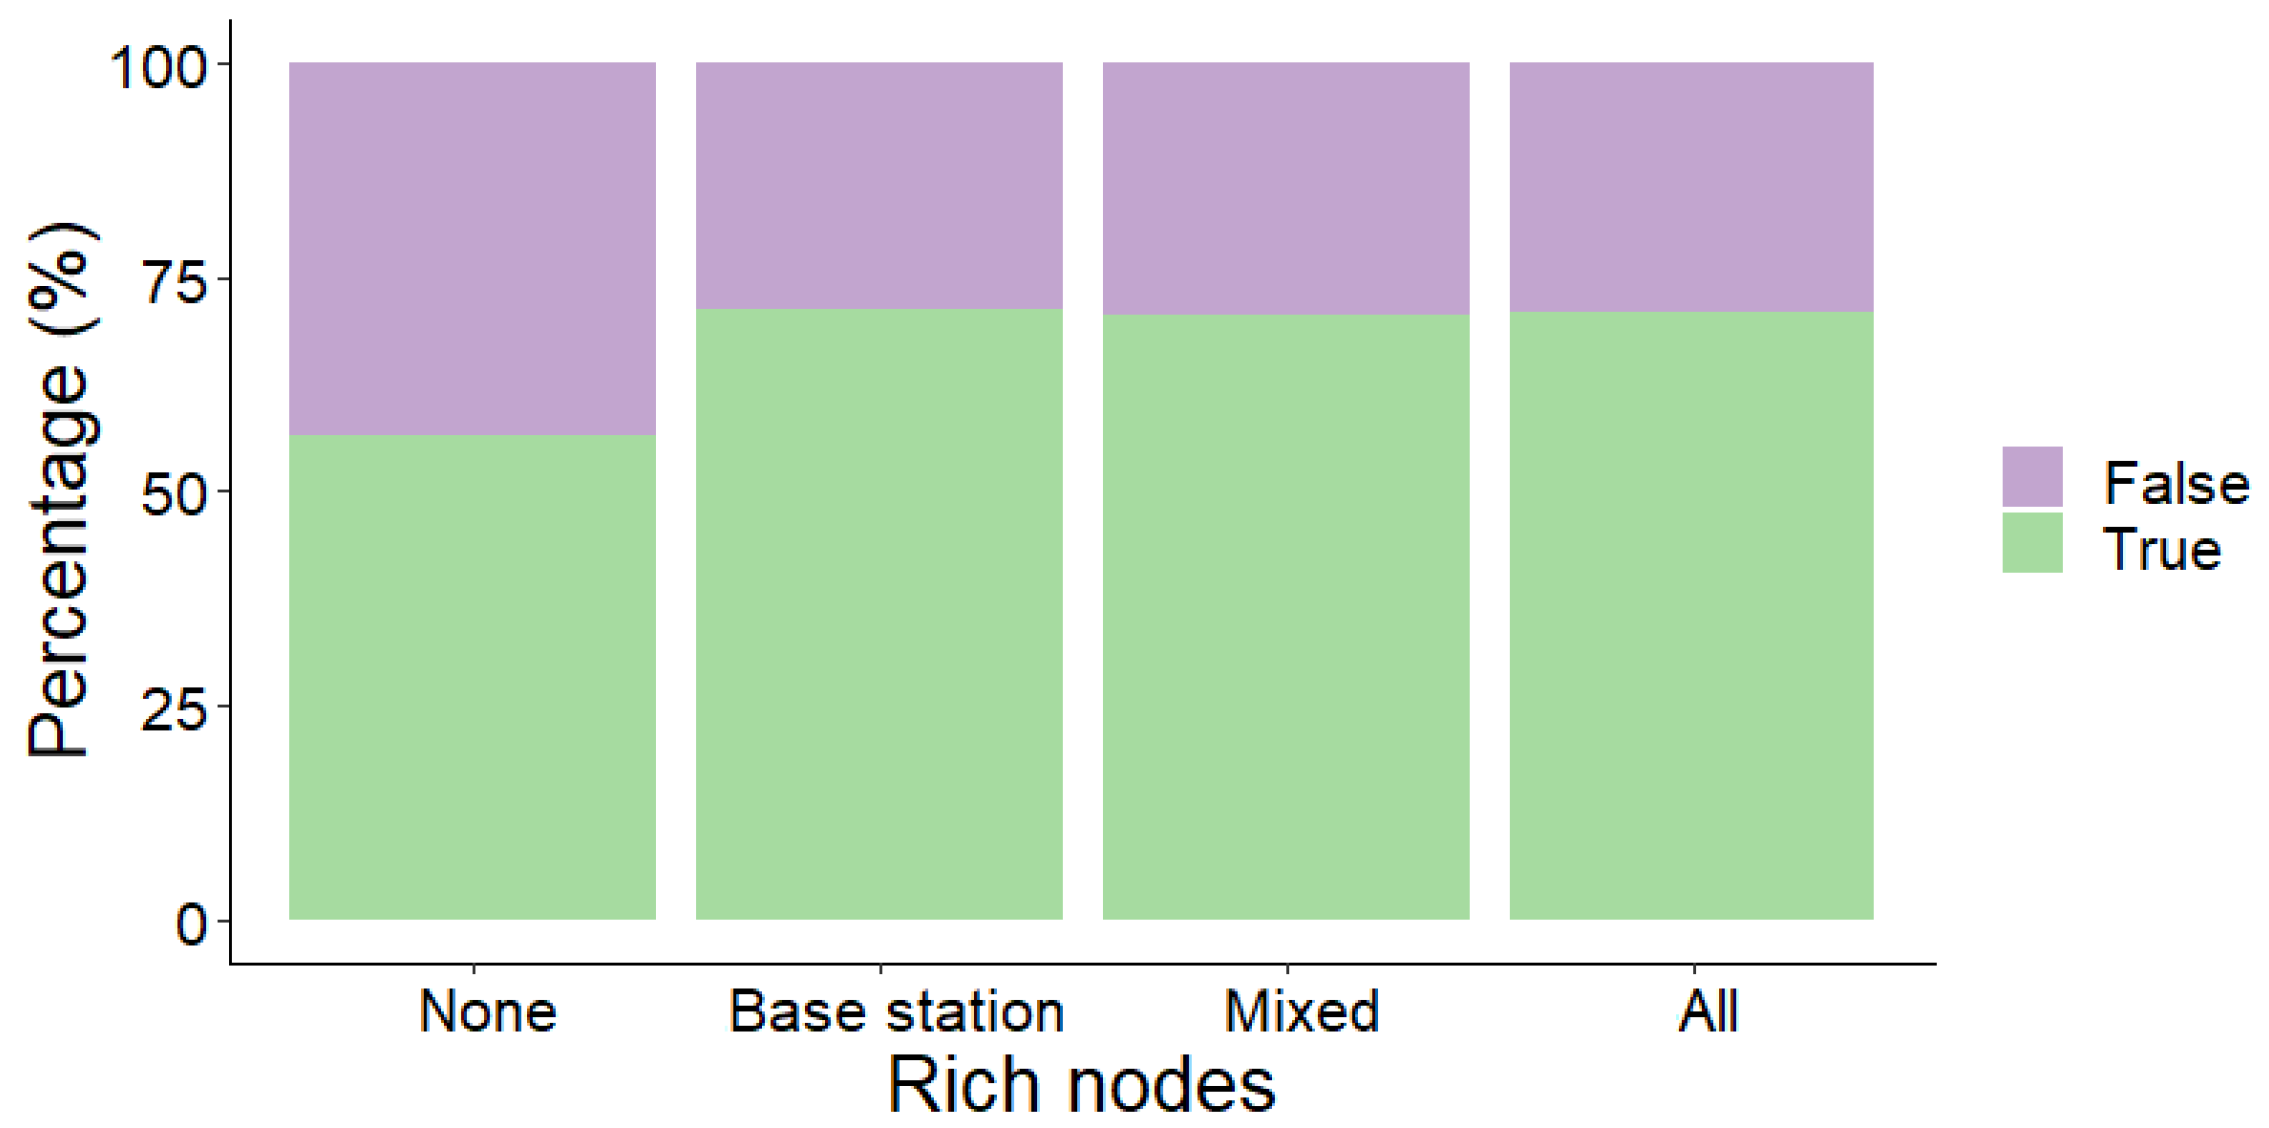
3.2.6. Is the Future Really Wireless?
3.2.7. How Are Sensor Networks Used?
4. Conclusions
- Sensor networks still are in their further developmental phases and not only a technical tool for other domains. It could be observed that there is a possibility to increase the amount of interactive deployments and therefore possibly gain more benefits and expand the usage of sensor networks in various domains;
- Almost all sensor network deployments are wireless, and only a small amount are hybrid or entirely reliant on wired connections;
- In more than one-third of cases, the goal field is not defined, so we can assume that the sensor network deployment is created for internal research purposes only;
- Only a small number of deployments are equipped with actuators and can thus react. It could be observed that there is a possibility and it might be beneficial to increase such deployments;
- Monitoring of opposing actors is less widespread or it is less commonly used for publication purposes;
- Although the number of more capable sensor nodes increases steadily, the interactivity of the sensor networks does not increase; this means that the domain of edge computing is expanding, but the driving force is not the need to react.
Author Contributions
Funding
Data Availability Statement
Acknowledgments
Conflicts of Interest
References
- Zedalis, R.J. Military Uses of Ocean Space and the Developing International Law of the Sea: An Analysis in the Context of Peactime ASW. San Diego L. Rev. 1978, 16, 575. [Google Scholar]
- Morf, M.; Kailath, T.; Friedlander, B.; Newkirk, J.; Lee, D. Investigation of New Algorithms for Locating and Identifying Spatially Distributed Sources and Receivers; Technical report; Stanford Electronics Labs: Stanford, CA, USA, 1979. [Google Scholar]
- Albaladejo, C.; Sánchez, P.; Iborra, A.; Soto, F.; López, J.A.; Torres, R. Wireless sensor networks for oceanographic monitoring: A systematic review. Sensors 2010, 10, 6948–6968. [Google Scholar] [CrossRef]
- Taivalsaari, A.; Mikkonen, T. A roadmap to the programmable world: Software challenges in the IoT era. IEEE Softw. 2017, 34, 72–80. [Google Scholar] [CrossRef]
- Aksu, H.; Babun, L.; Conti, M.; Tolomei, G.; Uluagac, A.S. Advertising in the IoT era: Vision and challenges. IEEE Commun. Mag. 2018, 56, 138–144. [Google Scholar] [CrossRef]
- Judvaitis, J.; Mednis, A.; Abolins, V.; Skadins, A.; Lapsa, D.; Rava, R.; Ivanovs, M.; Nesenbergs, K. Classification of Actual Sensor Network Deployments in Research Studies from 2013 to 2017. Data 2020, 5, 93. [Google Scholar] [CrossRef]
- Héder, M. From NASA to EU: The evolution of the TRL scale in Public Sector Innovation. Innov. J. 2017, 22, 1–23. [Google Scholar]


| Year | Records | Percentage |
|---|---|---|
| 2013 | 619 | 20.24% |
| 2014 | 616 | 20.14% |
| 2015 | 606 | 19.81% |
| 2016 | 596 | 19.48% |
| 2017 | 622 | 20.33% |
| Goal Network | Records | Percentage |
|---|---|---|
| True | 1825 | 59.66% |
| False | 1234 | 40.34% |
| Scale | Records | Percentage |
|---|---|---|
| Building | 530 | 29.04% |
| Property | 447 | 24.49% |
| Single actor | 345 | 18.90% |
| Region | 317 | 17.37% |
| Room | 131 | 7.18% |
| Country | 27 | 1.48% |
| Global | 24 | 1.32% |
| None | 4 | 0.22% |
| Total | 1825 |
| Interactivity | Records | Percentage |
|---|---|---|
| Passive | 1448 | 79.34% |
| Interactive | 375 | 20.55% |
| None | 2 | 0.11% |
| Total | 1285 |
| TRL | Deployments Using Testbed Facility | Deployments Total |
|---|---|---|
| TRL3 | 3 (2.9%) | 103 |
| TRL4 | 26 (3.8%) | 682 |
| TRL5 | 346 (38.9%) | 888 |
| TRL6 | 54 (11.3%) | 479 |
| TRL7 | 44 (5.3%) | 826 |
| TRL8 | 5 (6.2%) | 81 |
| Total | 478 (15.63%) | 3059 |
| Testbed Facilities | Static | Mixed | Mobile | Total |
|---|---|---|---|---|
| No | 1836 (74.3%) | 117 (4.7%) | 518 (21.0%) | 2471 (100%) |
| Part of | 51 (79.7%) | 3 (4.7%) | 10 (15.6%) | 64 (100%) |
| Used | 399 (84.7%) | 20 (4.2%) | 52 (11.1%) | 471 (100%) |
Publisher’s Note: MDPI stays neutral with regard to jurisdictional claims in published maps and institutional affiliations. |
© 2022 by the authors. Licensee MDPI, Basel, Switzerland. This article is an open access article distributed under the terms and conditions of the Creative Commons Attribution (CC BY) license (https://creativecommons.org/licenses/by/4.0/).
Share and Cite
Judvaitis, J.; Abolins, V.; Mednis, A.; Balass, R.; Nesenbergs, K. The Definitive Guide to Actual Sensor Network Deployments in Research Studies from 2013–2017: A Systematic Review. J. Sens. Actuator Netw. 2022, 11, 68. https://doi.org/10.3390/jsan11040068
Judvaitis J, Abolins V, Mednis A, Balass R, Nesenbergs K. The Definitive Guide to Actual Sensor Network Deployments in Research Studies from 2013–2017: A Systematic Review. Journal of Sensor and Actuator Networks. 2022; 11(4):68. https://doi.org/10.3390/jsan11040068
Chicago/Turabian StyleJudvaitis, Janis, Valters Abolins, Artis Mednis, Rihards Balass, and Krisjanis Nesenbergs. 2022. "The Definitive Guide to Actual Sensor Network Deployments in Research Studies from 2013–2017: A Systematic Review" Journal of Sensor and Actuator Networks 11, no. 4: 68. https://doi.org/10.3390/jsan11040068
APA StyleJudvaitis, J., Abolins, V., Mednis, A., Balass, R., & Nesenbergs, K. (2022). The Definitive Guide to Actual Sensor Network Deployments in Research Studies from 2013–2017: A Systematic Review. Journal of Sensor and Actuator Networks, 11(4), 68. https://doi.org/10.3390/jsan11040068