Abstract
Upon exposure to environmental stress, the primary electron donor in photosystem I (PSI), P700, is oxidized to suppress the production of reactive oxygen species that could oxidatively inactivate the function of PSI. The illumination of rice leaves with actinic light induces intrinsic fluctuations in the opening and closing of stomata, causing the net CO2 assimilation rate to fluctuate. We examined the effects of these intrinsic fluctuations on electron transport reactions. Under atmospheric O2 conditions (21 kPa), the effective quantum yield of photosystem II (PSII) (Y(II)) remained relatively high while the net CO2 assimilation rate fluctuated, which indicates the function of alternative electron flow. By contrast, under low O2 conditions (2 kPa), Y(II) fluctuated. These results suggest that photorespiration primarily drove the alternative electron flow. Photorespiration maintained the oxidation level of ferredoxin (Fd) throughout the fluctuation of the net CO2 assimilation rate. Moreover, the relative activity of photorespiration was correlated with both the oxidation level of P700 and the magnitude of the proton gradient across the thylakoid membrane in 21 kPa O2 conditions. These results show that photorespiration oxidized P700 by stimulating the proton gradient formation when CO2 assimilation was suppressed by stomatal closure.
1. Introduction
As photosynthetic organisms have evolved, the close coupling between the light reaction and the Calvin–Benson–Bassham (CBB) cycle has strengthened [1]. In the light reaction of C3 plants, both photosystem I (PSI) and photosystem II (PSII) absorb light energy from the sun and drive the photosynthetic linear electron flow from H2O to NADPH. PSII oxidizes 2H2O to O2 and 4H+ to extract electrons and protons. The electrons flow to PSI through plastoquinone (PQ), the cytochrome (Cyt) b6f complex, and plastocyanin (PC). PSI catalyzes the electrons transferred from the reduced PC to ferredoxin (Fd). In this process, electrons flow from the lumen to the stroma across the thylakoid membranes. Finally, the reduced Fd donates electrons to NADP+, producing NADPH. With this linear electron flow, H+ accumulates in the thylakoid lumen as a result of both H2O oxidation by PSII and the movement of protons from the stroma to the lumen during the oxidation of PQ by the Cyt b6f complex. The accumulated H+ drives the production of ATP by ATP synthase, which is embedded into the thylakoid membrane. Therefore, the light reaction produces two chemical energy compounds, NADPH and ATP. The CBB cycle of C3 plants is driven by both CO2 assimilation and photorespiration simultaneously, using both the NADPH and the ATP produced in the light reaction. Both compounds are used for the regeneration of ribulose 1,5-bisphophate (RuBP), which is one of the substrates of RuBP carboxylase/oxygenase (Rubisco). The electron flux in the linear electron flow of the light reaction is almost equal to the flux of electrons consumed in the CBB cycle [2,3,4].
Photorespiration, which drives the CBB cycle with CO2 assimilation, starts with the oxygenation of RuBP to 3-phosphoglycerate (PGA) and 2-phosphoglycolate (PG) catalyzed by Rubisco. To regenerate PGA from PG, a series of reactions is carried out via the peroxisomes and mitochondria, releasing CO2 and NH3. During this process, additional ATP and reduced products from the light reaction (Fd) are used for the regeneration of PGA and the re-assimilation of NH3 [5]. These reactions seem to be wasteful and the physiological role of photorespiration is still under debate. However, it has been suggested that photorespiration acts as a strong electron sink and plays an important role in the dissipation of excess light energy in the photosynthetic electron transport system [1,6,7,8,9,10,11].
The coupling between the light reaction and the CBB cycle requires an interaction between their systems to suppress the production of reactive oxygen species (ROS) in PSI [2]. For example, saturated pulse illumination (5,000–20,000 µmol photons m−2 s−1 of light intensity, 300–800 ms duration) in the dark causes the rapid accumulation of electrons at the acceptor side of PSI [12,13]. Unless these electrons are consumed in the CBB cycle, they will accumulate in the photosynthesis electron transport system and flow to O2 via the univalent reduction of O2 to the superoxide anion radical (O2−). The O2− then spontaneously and rapidly disproportionates to hydrogen peroxide (H2O2) and O2 [14,15]. These ROS oxidatively inactivate PSI function [12]. Therefore, suppression of the CBB cycle can result in an accumulation of electrons and the production of ROS in the photosynthesis electron transport system.
The selective photoinhibition of PSI caused by ROS has been observed in specific situations [16,17,18], which shows that all oxygenic photosynthetic organisms have a molecular mechanism to suppress the production of ROS in PSI. It is well established that ROS can be produced in PSI [19]. However, it is not yet fully understood how ROS production in PSI is suppressed [20,21,22]. Miyake et al. described a P700 oxidation system to suppress the production of ROS in PSI [12,23]. The photo-oxidation/reduction cycle of P700—the primary electron donor of PSI—drives the electron flow from PC to Fd. Illumination with actinic light excites P700 to P700* (excited P700). The P700* donates an electron to electron carriers localized at the acceptor side of PSI for the reduction of Fd and then NADP+. Simultaneously, P700* is oxidized to P700+, then the P700+ is reduced by the reduced PC to the ground state of P700. Thus, the production of ROS is regulated by the redox state of P700: if P700* oxidation is rate-limited, electrons accumulate at the acceptor-side of PSI and flow toward ROS production. Conversely, if P700+ reduction is rate limited, O2 reduction is suppressed and electron accumulation at the acceptor-side of PSI is relieved [2,24]. When the efficiency of CO2 assimilation is reduced, such as under high light intensity, low CO2 concentrations, drought, or extreme temperatures, all oxygenic photosynthetic organisms can oxidize P700 and suppress ROS production [13,25,26,27]. That is, the P700+ reduction reaction becomes rate-determining, and the accumulation of P700+ suppresses the accumulation of P700*, which decreases the likelihood of ROS production in PSI.
All oxygenic photosynthetic organisms have evolved P700 oxidation systems [2,13]. As mentioned above, the transition of the rate-determining steps in the P700 photo-oxidation/reduction cycle is key to maintaining P700 in the oxidized state. Under environmental conditions that reduce the efficiency of CO2 assimilation, the P700+ reduction reaction becomes rate-determining to keep P700 oxidized. Electron flux in the photosynthetic electron transport system can also be controlled via the down-regulation of the functions of both PSII and the Cyt b6f complex [2,28]. H2O oxidation in PSII is down-regulated by lumen acidification, which also triggers the non-photochemical quenching (NPQ) of chlorophyll (Chl) fluorescence [29]. The oxidation of reduced PQ, which is catalyzed by the Cyt b6f complex, is down-regulated by both lumen acidification [30,31] and the reduction-induced suppression of electron flow [32,33]. Suppression of the CO2 assimilation efficiency also induces lumen acidification, increasing both the proton motive force (pmf), which consists of the proton gradients across the thylakoid membranes (ΔpH) and other ion gradients (ΔΨ), and levels of the reduced form of PQ [11,13]. The pmf is determined by the ratio of the H+ consumption rate (JgH+) to the H+ conductance (gH+) [34,35]. The reduction/oxidation ratio of PQ is determined by the ratio of electron flux in the photosynthetic linear electron flow (Jf) to the apparent rate constant (kqL) for the oxidation of reduced PQ by the Cyt b6f complex [2,24]. The gH+ reflects the efficiency of both ADP and Pi regeneration and ATP synthase activity; lower photosynthetic activity leads to increased pmf [2,26]. The accumulation of reduced PQ suppresses the Q-cycle activity of the Cyt b6f complex [2,24,32,33]. All of these regulatory mechanisms contribute to keeping P700 in the oxidized form upon exposure to CO2 assimilation-limited photosynthesis conditions [2].
In the present study, we examined the effects of intrinsic fluctuations in the net CO2 assimilation rate on the regulation of P700 oxidation in PSI of rice plants. Fluctuations in the rate of net CO2 assimilation occur when the stomata open and close. Rice plants exhibit fluctuations in their transpiration rate with random frequency, which we cannot control. Therefore, we can expect fluctuations in the electron sink activity of CO2 assimilation. We analyzed how P700 is oxidized in response to these fluctuations in CO2 assimilation efficiency. We found that the intrinsic fluctuations in transpiration caused by the stomata opening and closing suppressed the net CO2 assimilation rate when the stomata were closed, and induced photorespiration. This led to oxidization of P700 by the formation of a proton gradient across the thylakoid membranes and suppression of ROS production in PSI. We discuss the molecular mechanism of P700 oxidation during the fluctuations in the net CO2 assimilation rate.
2. Results
2.1. Effects of Fluctuations in the Net CO2 Assimilation Rate on the Effective Quantum Yield of PSII (Y(II)) and Photorespiration Rate
We first measured the net CO2 assimilation and transpiration rates over time after application of actinic light to rice leaves under normal atmospheric conditions. In Figure 1, we show the four examples of the net CO2 assimilation rate and transpiration rate under the steady light conditions (Figure 1A–D). Upon illumination with actinic light (700 µmol photons m−2 s−1), the net CO2 assimilation rate gradually increased, with several minutes of lag time (Figure 1A–D). This was due to the stomata opening, as indicated by the increase in transpiration rate (Figure 1A–D). The net CO2 assimilation rate fluctuated in a somewhat random manner, as indicated by the various patterns shown in Figure 1. The fluctuations in the net CO2 assimilation rate were harmonized with those of the transpiration rate (Supplementary Figure S1). We could not regulate the fluctuation frequency of the net CO2 assimilation rate. Therefore, in the following experiments all analyses were performed under conditions where the net CO2 assimilation rate fluctuated along with the transpiration rate. In the following sections, we show representative data for one individual plant and data from all parameters for another two individuals are shown in the Supplementary Materials. We mainly discuss results according to the representative data, confirming that the same tendencies described here were observed in each measurement.
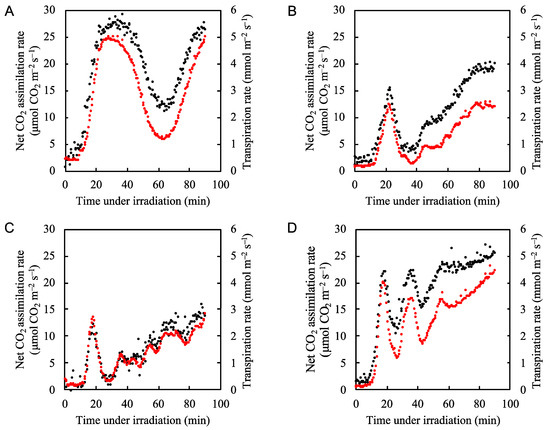
Figure 1.
Fluctuation patterns of both the net CO2 assimilation rate and transpiration rate under the steady-state actinic light illumination (700 µmol photons m–2 s–1) in rice leaves. Four examples are shown (A–D). The net CO2 assimilation rate (black circles) and transpiration rate (red circles) were measured under 21 kPa O2/40 Pa CO2 conditions. Actinic light was turned on at 0 min.
Upon illumination with actinic light under conditions of 21 kPa O2/40 Pa CO2, which closely resemble normal atmospheric conditions at sea level, the net CO2 assimilation rate gradually increased, while the effective quantum yield of PSII (Y(II)) rapidly increased and reached a peak value before the net CO2 assimilation rate peaked (Figure 2A, Supplementary Figure S4). This indicates that we observed an increased electron flux in PSII, which was not driven by the CO2 assimilation; thus, an alternative electron flow was functioning. Sejima et al. and Hanawa et al. [1,10] showed that photorespiration begins as soon as actinic light is applied to the leaves of C3 plants. Therefore, the extra electron flux in PSII, which did not follow the increase in the net CO2 assimilation rate, was most likely driven by photorespiration. Furthermore, while the net CO2 assimilation rate fluctuated, the extra electron flux in PSII remained near its maximum (Figure 2A). This suggests that photorespiration maintained the electron flux in PSII despite the changes in net CO2 assimilation rate.
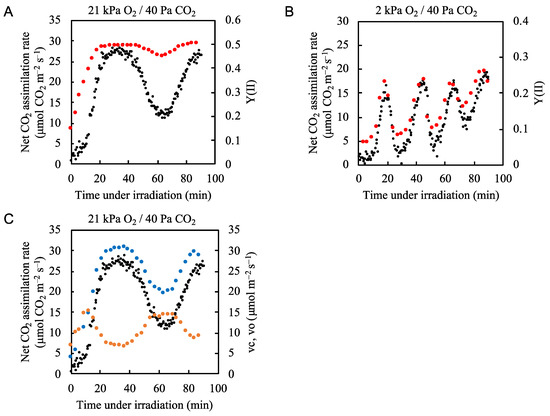
Figure 2.
Effects of partial pressure of O2 on both the net CO2 assimilation rate and quantum yield of PSII (Y(II)) in rice leaves. The net CO2 assimilation rate (black circles) and Y(II) (red circles) were simultaneously measured under (A) 21 kPa O2/40 Pa CO2 conditions and (B) 2 kPa O2/40 Pa CO2 conditions. Actinic light (700 µmol photons m–2 s–1) was turned on at 0 min. The data for the net CO2 assimilation rate at 21 kPa O2/40 Pa CO2 conditions are the same as those used for Figure 1A. (C) Both ribulose 1,5-bisphophate (RuBP) carboxylation rate (vc) (blue circles) and RuBP oxygenation rate (vo) (orange circles) were estimated by the method, described in Materials and Methods. Both vc and vo as well as the net CO2 assimilation rate (black circles) are plotted against the time after illumination of actinic light.
We next tested the hypothesis that photorespiration functions as the alternative electron flow mechanism when CO2 assimilation does not occupy the main electron flux in PSII. We decreased the partial pressure of O2 from 21 to 2 kPa to suppress the oxygenase activity of RuBP carboxylase/oxygenase [11,36]. The electron flux in PSII, as shown by Y(II), followed the fluctuation in the net CO2 assimilation rate (Figure 2B, Supplementary Figure S4). This indicates that under atmospheric conditions (21 kPa O2/40 Pa CO2) photorespiration was the main alternative electron flow.
We estimated both the RuBP carboxylation rate (vc) and the RuBP oxygenation rate (vo) based on the net CO2 assimilation rate and the effective quantum yield of PSII [1,10,11,37,38] (Figure 2C). Upon illumination with actinic light, the vo rapidly increased to approximately 15 µmol O2 m−2 s−1, then decreased to about 7 µmol O2 m−2 s−1 about 35 min after the start of illumination. At the same time, the vc increased and reached a maximal value of approximately 30 µmol CO2 m−2 s−1 at 35 min. After 40 min of illumination, both the net CO2 assimilation rate and the vc began to decrease, reaching minimal values after 60 min. The pattern of change in vo contrasted with the vc and the photosynthetic rate, reaching its minimal value at 35 min and its maximal value at 60 min. These results suggest that photorespiration compensated for the decrease in the electron sink when CO2 assimilation was suppressed.
As shown in Figure 2B, under 2 kPa O2 conditions the fluctuations in Y(II) closely resembled the fluctuations in net CO2 assimilation rate. However, at each minimum value, the Y(II) values were from 0.02 to 0.05 higher than would be expected if the Y(II) followed the photosynthetic rate more closely (Figure 2B). We plotted the electron transport rate (ETR) at PSII against four-times the net CO2 assimilation rate under 2 kPa O2 conditions because 4 mol electrons are needed to assimilate 1 mol CO2, and we found an excessive electron flux of about 10 µmol e– m−2 s−1 (Supplementary Figure S2). These higher values most likely reflect the electron fluxes of N, S-assimilation, mitochondrial respiration [39,40], and/or the water-to-water cycle [41].
2.2. Effects of Fluctuations in Net CO2 Assimilation Rate on the Redox States of PC, P700, Fd, and the PQ Pool
We showed that despite the intrinsic fluctuations in the net CO2 assimilation rate, the electron flux in PSII is maintained because photorespiration is activated when CO2 assimilation is suppressed (Figure 1 and Figure 2). Generally, decreases in the net CO2 assimilation rate induce the oxidation of P700 to suppress the production of ROS in PSI [2,12]. We next examined the effects of fluctuations in the net CO2 assimilation rate on the redox states of PC, P700, Fd, and the PQ pool under normal and low O2 conditions (Figure 3, Supplementary Figures S5–S8). Under conditions of 21 kPa O2/40 Pa CO2, illumination with actinic light caused the oxidation ratios of PC and P700 to rapidly increase and then decrease as the net CO2 assimilation rate increased (Figure 3A,B). The oxidation ratios of PC and P700 then remained constant while the photosynthetic rate increased, reached its maximal level, and began to decrease, and they showed relatively small peaks of increased oxidation that coincided with the minimal net CO2 assimilation rate. Thus, the oxidized states of both PC and P700 showed lower values when the net CO2 assimilation rate was high. Conversely, the redox state of Fd did not respond to fluctuations in the net CO2 assimilation rate, except for a rapid switch to the reduced state at the onset of illumination, before rapidly returning to a mainly oxidized state (Figure 3C). These results correspond with those of Kadota et al. [42]. The Chl fluorescence parameter 1–qL, which reflects the reduction level of the primary electron acceptor of PSII, QA, also shows the reduction ratio of the PQ pool. Here, we assumed a rapid equivalization between the QA site in PSII and the PQ-pool [43,44,45]. Illumination with actinic light caused a rapid reduction of the PQ pool, followed by a rapid return to a more oxidized state (Figure 3D). Thereafter, the reduction ratio of the PQ pool showed slight increases and decreases that followed the pattern of the net CO2 assimilation rate (Figure 3D).
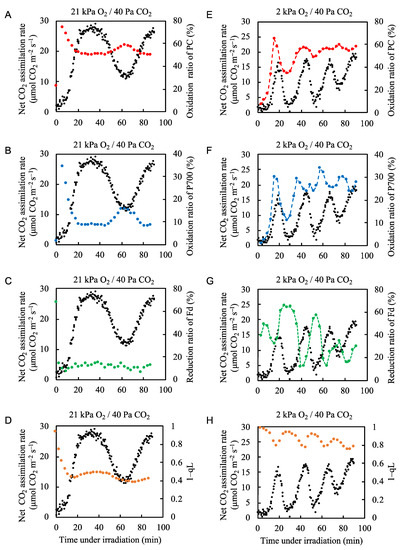
Figure 3.
Effects of the partial pressure of O2 on the net CO2 assimilation rate and the redox states of plastocyanin (PC), P700, ferredoxin (Fd), and plastoquinone in rice leaves. The oxidation ratios of PC (red circles) and P700 (blue circles), and the reduction ratios of Fd (green circles) and plastoquinone (1-qL) (orange circles) were measured simultaneously with the net CO2 assimilation rate (black circles) under 21 kPa O2/40 Pa CO2 conditions (A–D) and 2 kPa O2/40 Pa CO2 conditions (E-H). Actinic light (700 µmol photons m–2 s–1) was turned on at 0 min. The data for the net CO2 assimilation rate at 21 kPa O2 are the same as used for Fig. 1A and the data for the net CO2 assimilation rate at 2 kPa O2 are the same as those used for Figure 2B. Dashed lines in the graph (E–G) was arbitrarily drawn to indicate the trend of the data.
Under normal atmospheric conditions (21 kPa O2/40 Pa CO2), we identified photorespiration as the main alternative electron flow mechanism when the net CO2 assimilation rate fluctuated (Figure 2). To elucidate the effects of photorespiration on the redox states of PC, P700, Fd, and the PQ pool, we decreased the partial pressure of O2 from 21 to 2 kPa to suppress photorespiration in the rice plants [46].
When photorespiration was suppressed at 2 kPa O2, the application of actinic light did not induce the rapid oxidation of PC and P700 (Figure 3E,F). Both PC and P700 became more oxidized with increases in the net CO2 assimilation rate and their levels of oxidation followed the fluctuations in the net CO2 assimilation rate (Figure 2B). The redox states of Fd and the PQ pool followed the same pattern, with their reduction ratios mirroring the fluctuations in the net CO2 assimilation rate (Figure 3G,H). In particular, the reduction state of Fd appeared to be almost exclusively driven by the photosynthetic linear electron flow, as was the electron flux in PSII (Figure 2B). These results correspond to those of Kadota et al. [42].
Under normal atmospheric conditions, photorespiration functions as an alternative electron sink and drives the photosynthetic linear electron flow [11]. Therefore, photorespiration contributes to the oxidized states of PC, P700, Fd, and PQ. To further examine the relationship between P700 oxidation and photorespiration, we plotted the oxidation level of P700 against the vo/vc ratio (Figure 4, Supplementary Figure S9). As the vo/vc ratio increased, the oxidation of P700 increased; this occurred when the net CO2 assimilation rate was low (Figure 2B). Thus, photorespiration induced the oxidation of P700 by driving the linear electron flow when the CO2 assimilation was suppressed, keeping the electron flux nearly constant.
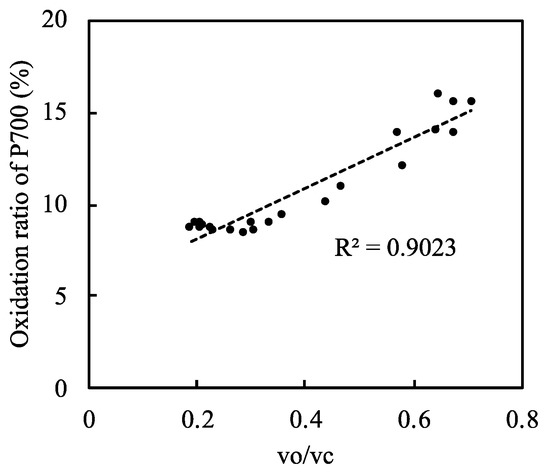
Figure 4.
Relationship between the relative photorespiration activity (vo/vc) and the oxidation ratio of P700 in rice leaves. Both ribulose 1,5-bisphophate (RuBP) carboxylase reaction rate (vc) and RuBP oxygenase reaction rate (vo) were estimated by the method described in Materials and Methods. Data from Figure 2C and Figure 3B were used. Dashed line in the graph was the regression line and the coefficient of determination was 0.9023 (p < 0.001).
2.3. Effects of Fluctuations in the Net CO2 Assimilation Rate on the Non-Photochemical Quenching of Chl Fluorescence and the Formation of the Proton Gradient (∆pH) across the Thylakoid Membrane
To understand the molecular mechanism by which photorespiration induces P700 oxidation in PSI, we analyzed the effects of fluctuations in the net CO2 assimilation rate on the NPQ of both Chl fluorescence and ∆pH (with lumen acidification) across the thylakoid membrane. Under atmospheric conditions, the rate of NPQ followed the same pattern as P700 oxidation (Figure 3B and Figure 5A, Supplementary Figures S7 and S10). Upon illumination with actinic light, NPQ was rapidly induced and started to decrease to a steady state as the net CO2 assimilation rate increased. Like the P700 oxidation ratio, the NPQ showed a relatively small peak when the net CO2 assimilation rate was at its minimum. Under low oxygen conditions (2 kPa O2/40 Pa CO2), NPQ increased to a relatively high value of 2.3 upon actinic light illumination and then showed minor fluctuations, with the highest level of quenching occurring when the net CO2 assimilation rate was lowest (Figure 5B, Supplementary Figure S10). These results suggest that photorespiration was not responsible for the enhancement of the ΔpH formation to oxidize P700. However, it is difficult to understand what the NPQ value really reflected under 2 kPa O2 conditions because Y(II) fluctuated strongly (Figure 2B). The induction of NPQ of Chl fluorescence depends on the level of acidification of the thylakoid lumen [29] and the redox state of the PQ pool [11,45], calculated by
NPQ = qL × [1 − Y(II)]/Y(II) × (Fv/Fm)/(1 − Fv/Fm) − 1
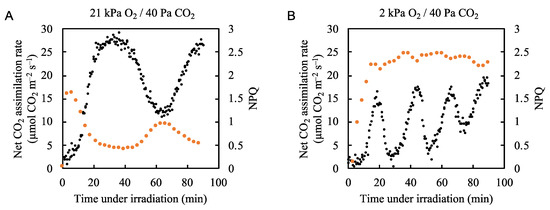
Figure 5.
Effects of partial pressure of O2 on the relationship between the net CO2 assimilation rate and non-photochemical quenching (NPQ) of chlorophyll fluorescence in rice leaves. NPQ of chlorophyll fluorescence (orange circle) was measured simultaneously with the net CO2 assimilation rate (black circles) under (A) 21 kPa O2/40 Pa CO2 and (B) 2 kPa O2/40 Pa CO2 conditions. Actinic light (700 µmol photons m–2 s–1) was turned on at 0 min. The data for the net CO2 assimilation rate under 21 kPa O2/40 Pa CO2 and 2 kPa O2/ 40 Pa CO2 are the same as those used for Figure 2A and 2B, respectively.
However, because of the second coefficient [1-Y(II)]/Y(II), the NPQ value increases as Y(II) decreases, as illustrated by the fact that the values of NPQ under 2 kPa O2 conditions were much higher than under 21 kPa O2 conditions during the illumination. Therefore, we needed to evaluate the acidification of the thylakoid lumen and the fluctuation of the net CO2 assimilation rate by different methods. Consequently, we measured the electrochromic shift (ECS) during the fluctuation.
We plotted ∆pH against the net CO2 assimilation rate under both normal and low-oxygen conditions (Figure 6, Supplementary Figure S11). Under normal atmospheric conditions ∆pH rapidly formed upon illumination with actinic light (Figure 6A). ∆pH decreased as the net CO2 assimilation rate increased and formed a small trough as the net CO2 assimilation rate peaked. The ∆pH level generally trended downward as the net CO2 assimilation rate trended upward. Under low oxygen conditions, the ∆pH level rapidly increased upon illumination but began to fluctuate along with the net CO2 assimilation rate, showing similar peaks and troughs (Figure 6B). These results indicate that photosynthetic linear electron transport, driven by both the CO2 assimilation and photorespiration, induces ∆pH formation across the thylakoid membranes. At the start of illumination with actinic light, we detected large increases in ∆pH even under low oxygen conditions, where the small Y(II) value that was not accounted for by photorespiration was detected (Figure 2B). These data suggest that an alternative electron flow to photorespiration contributed to the formation of ∆pH.
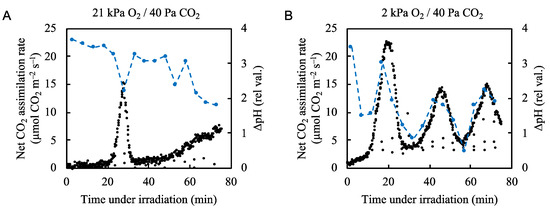
Figure 6.
Effects of partial pressure of O2 on the relationship between the net CO2 assimilation rate and ΔpH across thylakoid membranes in rice leaves. The ΔpH across thylakoid membranes (blue circles) was measured simultaneously with the net CO2 assimilation rate (black circles) under (A) 21 kPa O2/40 Pa CO2 and (B) 2 kPa O2/40 Pa CO2 conditions. Actinic light (700 µmol photons m–2 s–1) was turned on at 0 min. Dashed blue lines in the graph were arbitrarily drawn to indicate the trend of the data.
We plotted ∆pH against the relative photorespiration rate (the vo/vc ratio) and found that ∆pH increased as the vo/vc ratio increased (Figure 7, Supplementary Figure S12). As the net CO2 assimilation rate decreased, photorespiration increased and induced the proton gradient across the thylakoid membranes. This suggests that photorespiration contributes to the oxidation of P700 via the induction of the proton gradient across thylakoid membranes.
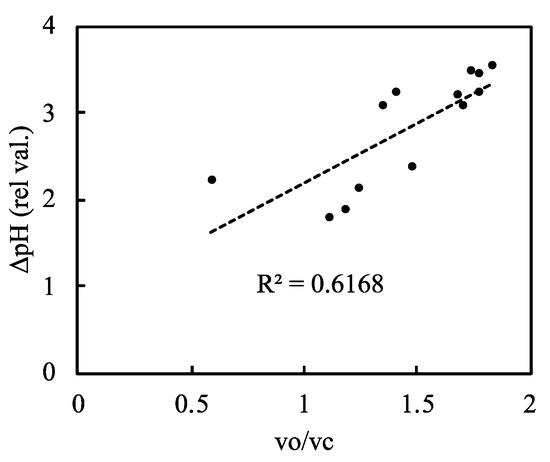
Figure 7.
Relationship between the relative photorespiration activity (vo/vc) and ΔpH across the thylakoid membranes in rice leaves. The RuBP carboxylase reaction rate (vc) and the RuBP oxygenase reaction rate (vo) were estimated as described in the Materials and Methods. Data of vc and vo were simultaneously measured with ΔpH in Figure 6A. The dashed line in the graph is the regression line and the coefficient of determination was 0.6168 (p < 0.001).
3. Discussion
In this study, we attempted to elucidate the molecular mechanism of P700 oxidation in PSI during the intrinsic fluctuations of the net CO2 assimilation rate in rice plants. These fluctuations are driven by the periodic opening and closing of stomata that occurs in a somewhat random fashion (Figure 1A–D). We found that when CO2 assimilation is suppressed, photorespiration maintains the oxidation of P700 in PSI by inducing ∆pH across the thylakoid membranes. Lumen acidification suppresses the oxidation of the reduced PQ by the Cyt b6f complex, causing the reduction reaction of P700+ to become the rate-determining step in the P700 photo-oxidation/reduction cycle, and contributing to P700 oxidation.
In general, upon exposure to environmental stresses such as drought, low or high temperatures, or high light levels, CO2 assimilation activity decreases and the amount of photon energy available exceeds that required to drive the CBB cycle [41]. Under these conditions, the photosynthetic electron transport system can begin to reduce O2 and produce ROS, especially at PSI of the thylakoid membranes, unless the accumulation of electrons is alleviated. This is known as the Mehler reaction, which is the primary reaction of the water–water cycle [41]. The electron carriers localized at the acceptor side of PSI (A0, A1, FX, FA/FB, and Fd) can easily reduce O2 to superoxide radicals [47,48,49]. However, the oxidation of P700 decreases the apparent quantum yield of PSI [50] and inhibits the accumulation of electrons on the acceptor side of PSI [12]. Furthermore, the oxidation of P700 maintains Fd in an oxidized state [42]. This is an important physiological function of the P700 oxidation system in photosynthetic organisms. Without it, PSI suffers from photoinhibition and loses its electron transport activity; photosynthetic organisms cannot survive under these circumstances [23]. In short, P700 oxidation is essential to suppress the production of ROS in PSI [2,42].
The reduction-induced suppression of electron flow also contributes to the oxidation of P700 in PSI and lumen acidification [2,32,33,51]. The suppression of the CBB cycle activity lowers the oxidation of P700 temporarily, with increases in the reduction ratios of Fd and PQ. The accumulation of reduced PQ inhibits the Q-cycle in the Cyt b6f complex, which down-regulates the electron flow from PQ to PC. Then, the reduction of P700+ by the reduced PC is suppressed and oxidized P700 accumulates. We can see the function of reduction-induced suppression of electron flow in the rice fluctuation situation under 2 kPa O2 conditions (Figure 3F, H and 6B). Under non-photorespiratory conditions (2 kPa O2/40 Pa CO2), both PC and P700 were rapidly oxidized as the net CO2 assimilation rate decreased after reaching its first peak (Figure 3). The acceleration of the CBB cycle simultaneously drives the photosynthetic linear electron flow with the formation of ∆pH across the thylakoid membranes (Figure 6B), contributing to the oxidation of P700 [2]. The rapid increases in the oxidation of both PC and P700 deviated from the increase in ∆pH. We found that the oxidation of both the reduced Fd and the reduced PQ was slower and they were maintained in a reduced state even after an increase in the net CO2 assimilation rate after reaching the first peak (Figure 6B). These findings indicate that the oxidation of both PC and P700 was induced by the reduction-induced suppression of electron flow [2,11,32,33].
Under 2 kPa O2 conditions, when photorespiration was suppressed the pattern of fluctuations in Y(II) deviated from the pattern formed by the net CO2 assimilation rate when the net CO2 assimilation rate was at its minimum (Figure 2B, Supplementary Figure S2). This suggests that an alternative electron flow to photorespiration functioned under these conditions, although it does not seem to be involved in mechanisms of photoprotection (Figure 3E–H). We also detected a rapid increase in ∆pH at the start of illumination with actinic light (Figure 6B). This suggests that the alternative electron flows that contributed to the formation of ΔpH would function in induction phases. There are many potential candidates for these alternative electron flows including S,N-assimilation, chloroplast respiration, and other pathways that consume reduced Fd [39,40,41,52]. There is a possibility that all of these candidates are involved in the excessive electron flux at PSII. The most plausible candidate for this system is the Mehler-ascorbate peroxidase (MAP) pathway (the water–water cycle) [41,53,54,55]. The MAP pathway drives the O2-dependent electron flow, which can function even at 2 kPa O2. This is similar to the flavodiiron (FLV)-dependent electron flow observed in cyanobacteria, green algae, mosses, ferns, and gymnosperms [13,23,56,57]. However, unlike the FLV-dependent electron flow, the magnitude of the electron flux of the MAP pathway is small. It remains to be determined whether the MAP pathway can function under 21 kPa O2/40 Pa CO2 conditions.
Fluctuations in the opening and closing of stomata have been observed as stomatal oscillations in many plant species [58,59,60]. Oscillatory transpiration is regulated by stomatal conductance, which senses the intercellular CO2 concentration and the leaf water status in order to maximize CO2 assimilation while minimizing water loss [60]. Under natural daylight conditions, the stomata oscillate with random frequency (Figure 1) [59]. These stomatal oscillations can continue for up to 10 h. Our results indicate that under natural field conditions, P700 oxidation is driven by photorespiration to suppress ROS production when CO2 assimilation is suppressed by stomatal closure in C3 plants.
In other land species, such as mosses, ferns and gymnosperms, another large alternative electron flow as well as photorespiration—FLV—is suggested to contribute to P700 oxidation [1,13,23,56,57]. It is not clear whether photorespiration also plays an important role in these plant species, or whether they show such large fluctuations in the opening and closing of stomata. It is probably the case that photorespiration can respond to the down-regulation of the CO2 assimilation efficiency faster and with reduced electron wastage than FLV because the primary reactions of both CO2 assimilation and photorespiration are mediated by the same enzyme, Rubisco.
C4 plants have no significant activity of photorespiration and no FLV protein [1,10,61,62,63]. Moreover, it has been shown that the alternative electron flows in C4 plants are negligible [1,10]. It was reported that maize also shows fluctuations in transpiration rate and stomatal conductance [58]. It remains to be elucidated how C4 plants cope with fluctuations in the opening and closing of stomata without photorespiration. However, it is possible that C4 plants benefit from the CO2 concentrating mechanism (CCM) [61] and can minimize the influence of the fluctuations of the stomatal aperture on the CO2 assimilation efficiency by maintaining a high partial pressure of CO2 around Rubisco.
4. Materials and Methods
4.1. Plant Materials
Wild-type rice (Oryza Sativa L. cv. Nipponbare) plants were grown hydroponically in a controlled chamber (14 h light at 27 °C/10 h dark at 22 °C; light intensity 300–400 µmol photons m−2 s−1; relative humidity 50–60%). Two-week-old seedlings were planted in pots filled with the hydroponic solution described by Makino et al. [64]. The solution was renewed once a week and its concentration increased with plant age as described by Makino et al. [64]. For all experiments, we measured the second leaves from the tops of 6–8 week-old plants.
4.2. Conditions during Measurements
We made measurements under two conditions: 21 kPa O2/40 Pa CO2 and 2 kPa O2/40 Pa CO2. While making measurements under these conditions, we adjusted the photosynthetic photon flux density to 700 µmol photons m−2 s−1, the relative humidity to 60%, the leaf temperature to 25 ± 1 °C, and the partial pressure of CO2 to 40 Pa.
4.3. Measurement of Changes in the Partial Pressure of CO2 and H2O to Measure Net CO2 Assimilation and Transpiration Rate
Changes in the partial pressure of CO2 and H2O were measured in a 3010-Dual gas exchange chamber (Heinz Walz, Effeltrich, Germany) using either a GFS-3000 (Heinz Walz, Effeltrich, Germany) or an LI-7000 (LI-COR, Lincoln, Nebraska, USA) gas analyzer. The former was used simultaneously with the Dual-KLAS/NIR system (Heinz Walz, Effeltrich, Germany) and the latter was used with the KLAS-100 system (Heinz Walz, Effeltrich, Germany), which are described below. In the measuring chamber, the ambient air was saturated with water vapor at 14.0 ± 0.1 °C and the cuvette temperature was maintained at 25 ± 0.5 °C, making the relative humidity 55–60%. We measured the transpiration rate, net CO2 exchange rate (A), and dark-adapted respiration rate (Rd), which was assumed to be equal to that under illumination. The gas exchange parameters were calculated according to the method of von Caemmerer [65].
4.4. Simultaneous Measurement of Oxidized P700 (P700+), Oxidized PC (PC+), Reduced Fd (Fd−) and Chlorophyll Fluorescence Using the Dual-KLAS/NIR
The redox states of the P700, PC, and Fd were measured using a Dual-KLAS/NIR instrument under two conditions (21 kPa O2/40 Pa CO2 and 2 kPa O2/40 Pa CO2). The Dual-KLAS/NIR measured the absorbance changes at four dual wavelengths (785–840 nm, 810–870 nm, 870–970 nm, and 795–970 nm). These signals were deconvoluted into the three signals that depend on PC+, P700+, and Fd+ by referring to a differential model plot as described by Klughammer et al., Kodota et al., and Shimakawa et al. [42,66,67] (Supplementary Figure S13, Supplementary Table S1). Before the measurements, we obtained the maximal oxidation/reduction levels of P700+, PC+, and Fd− and we converted all signals into relative values. The redox levels under actinic light (640 nm, 700 µmol photons m−2 s−1) were determined using dirk interval relaxation kinetics (DIRK) analysis as described by Sacksteder and Kramer [68].
Chlorophyll fluorescence was also measured with the Dual-KLAS/NIR instrument. Weak measuring light (540 nm) was applied to leaves to obtain the basal level of chlorophyll fluorescence (Fo in the dark-adapted state, Fo’ under actinic light) and actinic light was applied to obtain the stationary level of fluorescence under actinic light (Fs). A short pulse of saturated light (300 ms, 20,000 µmol photons m−2 s−1) was applied to leaves to get the maximal fluorescence in the dark-adapted state (Fm) and under actinic light (Fm’). Using these values, we calculated the following parameters as described by Baker et al. [29]:
| terms | abbreviations | equations |
| The maximal quantum yield of PSII | Fv/Fm | (Fm − Fo)/Fm |
| The effective quantum yield of PSII | Y(II) | (Fm’ − Fs)/Fm’ |
| The non-photochemical quenching | NPQ | (Fm/Fm’) − 1 |
| The parameter reflecting the oxidation level of QA, which is the primary quinone acceptor of PSII | qL | (Fm’–Fs)/(Fm’ − Fo’)×(Fo − /Fs) or [Y(II)/(1 − Y(II))]×[(1 − (Fv/Fm))/(Fv/Fm)] ×(NPQ + 1) [45] |
We evaluated CO2 assimilation and photorespiration activities using a previously-reported method [10,11,37,38]. The RuBP carboxylase reaction rate (vc) and RuBP oxygenation rate (vo) were calculated as follows:
vc = (1/6) × [ETR/2 + 4 × (A + Rd)]
vo = (1/6) × [ETR − 4 × (A + Rd)]
ETR (the electron transport rate in PSII) = Y(II) × the photosynthetic photon flux density × α, where α is the distribution ratio of photon energy to PSII. We used a value of 0.42 for α, as described by Wada et al. 2018 [69]. A is the net CO2 exchange rate and Rd is the respiration rate under actinic light, which was assumed to be equal to the dark-adapted respiration rate.
4.5. Simultaneous Measurement of the Proton Motive Force (pmf), the Proton Gradient (ΔpH) between the Lumen and Stroma, and the Chlorophyll Fluorescence Using the KLAS-100
The KLAS-100 instrument measured transmittances at 8 dual wavelengths: 505–520 nm, 520–534 nm, 540–545 nm, 545–549 nm, 549–553 nm, 553–559 nm, 559–563 nm, and 564–568 nm. These were deconvoluted into 7 signals representing c550, Cyt b559, Cyt b563, Cyt f, P515, the scattering signal, and zeaxanthin, based on a differential model plot obtained using the chloroplasts of spinach leaves [70,71]. The P515 is the electrochromic pigment absorbance shift at 505–520 nm. We used the same equipment to simultaneously measure chlorophyll fluorescence using a measuring light wavelength of 620 nm.
To obtain information about ∆pH, we applied 30 s of dark to the leaves according to the method of Klughammer et al. [72]. Each P515 signal was normalized by the change in width of P515 signals depending on the single charge separation when a single turnover (50 µs) was applied. We estimated the chlorophyll fluorescence parameters as described above. We applied a short pulse of saturated light 5 s before the 30 s of dark and repeated this treatment every 5 min.
4.6. Statistical Treatments
For the data in Figure 4 and Figure 7 and Supplementary Figures S1, S2, S9 and S12, the coefficient of determination, which was equal to the square of the Pearson correlation coefficient of measured parameters, and the regression line were calculated or drawn using Microsoft Excel and JMP 14 (SAS Institute Japan, Tokyo, Japan).
Supplementary Materials
The following are available online at https://www.mdpi.com/2223-7747/9/12/1761/s1. Figure S1, The correlation between the net CO2 assimilation rate and transpiration rate. Figure S2, The correlation between the electron transport rate and the net CO2 assimilation rate. Figure S3, The correlations between Y(II) and NPQ, and Y(II) and ΔpH. Figure S4, Data of Y(II) with the fluctuation of CO2 assimilation rate in each condition from two more individuals of plants. Figure S5, Data of the oxidation ratio of plastocyanin with the fluctuation of CO2 assimilation rate in each condition from two more individuals of plants. Figure S6, Data of the reduction ratio of ferredoxin with the fluctuation of CO2 assimilation rate in each condition from two more individuals of plants. Figure S7, Data of the oxidation ratio of P700 with the fluctuation of CO2 assimilation rate in each condition from two more individuals of plants. Figure S8, Data of the reduction level of QA (1-qL) with the fluctuation of CO2 assimilation rate in each condition from two more individuals of plants. Figure S9, Data of the correlation between the relative photorespiration activity (vo/vc) and the oxidation ratio of P700 during the fluctuation of CO2 assimilation rate in atmospheric condition from two more individuals of plants. Figure S10, Data of the non-photochemical quenching (NPQ) with the fluctuation of CO2 assimilation rate in each condition from two more individuals of plants. Figure S11, Data of ΔpH across the thylakoid membranes while the fluctuation of CO2 assimilation rate in each condition from two more individuals of plants. Figure S12, Data of the correlation between the relative photorespiration activity (vo/vc) and ΔpH across the thylakoid membranes during the fluctuation of CO2 assimilation rate in atmospheric condition from two more individuals of plants. Figure S13, Deferential Model Plots for P700, plastocyanin, and ferredoxin. Table S1, Examples of DMP values in rice leaves.
Author Contributions
C.M. conceived and designed the experiments; R.F. performed most of the experiments; R.F., A.M., Y.S., S.W., G.S., and C.M. analyzed the data; R.F. and C.M. mainly wrote the manuscript. All authors have read and agreed to the published version of the manuscript.
Funding
This work was supported by JST CREST Grant Number JPMJCR15O3, Japan (C.M.).
Acknowledgments
The authors thank MDPI for English language editing.
Conflicts of Interest
The authors declare no conflict of interest.
References
- Hanawa, H.; Ishizaki, K.; Nohira, K.; Takagi, D.; Shimakawa, G.; Sejima, T.; Shaku, K.; Makino, A.; Miyake, C. Land plants drive photorespiration as higher electron-sink: Comparative study of post-illumination transient O2-uptake rates from liverworts to angiosperms through ferns and gymnosperms. Physiol. Plant. 2017, 161, 138–149. [Google Scholar] [CrossRef] [PubMed]
- Miyake, C. Molecular mechanism of oxidation of P700 and suppression of ROS production in photosystem I in response to electron-sink limitations in C3 plants. Antioxidants 2020, 9, 230. [Google Scholar] [CrossRef] [PubMed]
- Harbinson, J.; Genty, B.; Baker, N.R. The relationship between CO2 assimilation and electron transport in leaves. Photosynth. Res. 1990, 25, 213–224. [Google Scholar] [CrossRef] [PubMed]
- Ruuska, S.A.; Badger, M.R.; Andrews, T.J.; Von Caemmerer, S. Photosynthetic electron sinks in transgenic tobacco with reduced amounts of Rubisco: Little evidence for significant Mehler reaction. J. Exp. Bot. 2000, 51, 357–368. [Google Scholar] [CrossRef]
- Peterhansel, C.; Maurino, V.G. Photorespiration redesigned. Plant Physiol. 2011, 155, 49–55. [Google Scholar] [CrossRef]
- Heber, U.; Krause, G.H. What is the physiological role of photorespiration? Trends Biochem. Sci. 1980, 5, 32–34. [Google Scholar] [CrossRef]
- Osmond, C.B. Photorespiration and photoinhibition. Biochim. Et Biophys. Acta (Bba) - Rev. On Bioenerg. 1981, 639, 77–98. [Google Scholar] [CrossRef]
- Kozaki, A.; Takeba, G. Photorespiration protects C3 plants from photooxidation. Nature 1996, 384, 557–560. [Google Scholar] [CrossRef]
- Takahashi, S.; Bauwe, H.; Badger, M. Impairment of the photorespiratory pathway accelerates photoinhibition of photosystem II by suppression of repair but not acceleration of damage processes in Arabidopsis. Plant Physiol. 2007, 144, 487–494. [Google Scholar] [CrossRef]
- Sejima, T.; Hanawa, H.; Shimakawa, G.; Takagi, D.; Suzuki, Y.; Fukayama, H.; Makino, A.; Miyake, C. Post-illumination transient O2-uptake is driven by photorespiration in tobacco leaves. Physiol. Plant. 2016, 156, 227–238. [Google Scholar] [CrossRef]
- Wada, S.; Suzuki, Y.; Miyake, C. Photorespiration enhances acidification of the thylakoid lumen, reduces the plastoquinone pool, and contributes to the oxidation of P700 at a lower partial pressure of CO2 in wheat leaves. Plants 2020, 9, 319. [Google Scholar] [CrossRef] [PubMed]
- Sejima, T.; Takagi, D.; Fukayama, H.; Makino, A.; Miyake, C. Repetitive short-pulse light mainly inactivates photosystem I in sunflower leaves. Plant Cell Physiol. 2014, 55, 1184–1193. [Google Scholar] [CrossRef] [PubMed]
- Shimakawa, G.; Miyake, C. Oxidation of P700 ensures robust photosynthesis. Front. Plant Sci. 2018, 9, 1617. [Google Scholar] [CrossRef] [PubMed]
- Mehler, A.H. Studies on reactions of illuminated chloroplasts. I. Mechanism of the reduction of oxygen and other Hill reagents. Arch. Biochem. Biophys. 1951, 33, 65–77. [Google Scholar] [CrossRef]
- Asada, K. The water-water cycle in chloroplasts: Scavenging of active oxygens and dissipation of excess photons. Annu. Rev. Plant Physiol. Plant Mol. Biol. 1999, 50, 601–639. [Google Scholar] [CrossRef]
- Terashima, I.; Funayama, S.; Sonoike, K. The site of photoinhibition in leaves of Cucumis sativus L. at low temperatures is photosystem I, not photosystem II. Planta 1994, 193. [Google Scholar] [CrossRef]
- Havaux, M.; Davaud, A. Photoinhibition of photosynthesis in chilled potato leaves is not correlated with a loss of Photosystem-II activity: Preferential inactivation of Photosystem I. Photosynth Res 1994, 40, 75–92. [Google Scholar] [CrossRef]
- Sonoike, K.; Terashima, I.; Iwaki, M.; Itoh, S. Destruction of photosystem I iron-sulfur centers in leaves of Cucumis sativus L. by weak illumination at chilling temperatures. Febs Lett. 1995, 362, 235–238. [Google Scholar] [CrossRef]
- Sonoike, K. Photoinhibition of photosystem I. Physiol. Plant. 2011, 142, 56–64. [Google Scholar] [CrossRef]
- Suorsa, M.; Järvi, S.; Grieco, M.; Nurmi, M.; Pietrzykowska, M.; Rantala, M.; Kangasjärvi, S.; Paakkarinen, V.; Tikkanen, M.; Jansson, S.; et al. PROTON GRADIENT REGULATION5 is essential for proper acclimation of Arabidopsis photosystem I to naturally and artificially fluctuating light conditions. Plant Cell 2012, 24, 2934–2948. [Google Scholar] [CrossRef]
- Tiwari, A.; Mamedov, F.; Grieco, M.; Suorsa, M.; Jajoo, A.; Styring, S.; Tikkanen, M.; Aro, E.M. Photodamage of iron-sulphur clusters in photosystem I induces non-photochemical energy dissipation. Nat. Plants 2016, 2, 16035. [Google Scholar] [CrossRef] [PubMed]
- Gollan, P.J.; Lima-Melo, Y.; Tiwari, A.; Tikkanen, M.; Aro, E.M. Interaction between photosynthetic electron transport and chloroplast sinks triggers protection and signalling important for plant productivity. Philos. Trans. R. Soc. Lond. B Biol. Sci. 2017, 372. [Google Scholar] [CrossRef] [PubMed]
- Shimakawa, G.; Shaku, K.; Miyake, C. Oxidation of P700 in photosystem I is essential for the growth of cyanobacteria. Plant Physi 2016, 172, 1443–1450. [Google Scholar] [CrossRef] [PubMed]
- Furutani, R.; Ifuku, K.; Suzuki, Y.; Noguchi, K.; Shimakawa, G.; Wada, S.; Makino, A.; Sohtome, T.; Miyake, C. P700 oxidation suppresses the production of reactive oxygen species in photosystem I. In Advances in Botanical Research; Academic Press: New York, NY, USA, 2020. [Google Scholar]
- Golding, A.J.; Johnson, G.N. Down-regulation of linear and activation of cyclic electron transport during drought. Planta 2003, 218, 107–114. [Google Scholar] [CrossRef]
- Miyake, C.; Miyata, M.; Shinzaki, Y.; Tomizawa, K.-I. CO2 response of cyclic electron flow around PSI (CEF-PSI) in tobacco leaves—relative electron fluxes through PSI and PSII determine the magnitude of non-photochemical quenching (NPQ) of Chl fluorescence. Plant Cell Physiol. 2005, 46, 629–637. [Google Scholar] [CrossRef]
- Wada, S.; Takagi, D.; Miyake, C.; Makino, A.; Suzuki, Y. Responses of the photosynthetic electron transport reactions stimulate the oxidation of the reaction center chlorophyll of photosystem I, P700, under drought and high temperatures in rice. Int. J. Mol. Sci. 2019, 20, 2068. [Google Scholar] [CrossRef]
- Tikhonov, A.N. The cytochrome b6f complex: Biophysical aspects of its functioning in chloroplasts. Subcell. Biochem. 2018, 87, 287–328. [Google Scholar] [CrossRef]
- Baker, N.R.; Harbinson, J.; Kramer, D.M. Determining the limitations and regulation of photosynthetic energy transduction in leaves. Plant Cell Environ. 2007, 30, 1107–1125. [Google Scholar] [CrossRef]
- Nishio, J.N.; Whitmarsh, J. Dissipation of the proton electrochemical potential in intact chloroplasts (II. the pH gradient monitored by cytochrome f reduction kinetics). Plant Physiol. 1993, 101, 89–96. [Google Scholar] [CrossRef]
- Tikkanen, M.; Rantala, S.; Aro, E.-M. Electron flow from PSII to PSI under high light is controlled by PGR5 but not by PSBS. Front. Plant Sci. 2015, 6, 521. [Google Scholar] [CrossRef]
- Shaku, K.; Shimakawa, G.; Hashiguchi, M.; Miyake, C. Reduction-induced suppression of electron flow (RISE) in the photosynthetic electron transport system of Synechococcus elongatus PCC 7942. Plant Cell Physiol. 2015, 57, 1443–1453. [Google Scholar] [CrossRef] [PubMed]
- Shimakawa, G.; Shaku, K.; Miyake, C. Reduction-induced suppression of electron flow (RISE) is relieved by non-ATP-consuming electron flow in Synechococcus elongatus PCC 7942. Front. Microbiol. 2018, 9. [Google Scholar] [CrossRef] [PubMed]
- Kanazawa, A.; Kramer, D.M. In vivo modulation of nonphotochemical exciton quenching (NPQ) by regulation of the chloroplast ATP synthase. Proc. Natl. Acad. Sci USA 2002, 99, 12789–12794. [Google Scholar] [CrossRef] [PubMed]
- Avenson, T.J.; Cruz, J.A.; Kanazawa, A.; Kramer, D.M. Regulating the proton budget of higher plant photosynthesis. Proc. Natl. Acad. Sci. USA 2005, 102, 9709–9713. [Google Scholar] [CrossRef] [PubMed]
- Miyake, C.; Yokota, A. Determination of the rate of photoreduction of O2 in the water-water cycle in watermelon leaves and enhancement of the rate by limitation of photosynthesis. Plant Cell Physiol. 2000, 41, 335–343. [Google Scholar] [CrossRef]
- Cornic, G.; Briantais, J.-M. Partitioning of photosynthetic electron flow between CO2 and O2 reduction in a C3 leaf (Phaseolus vulgaris L.) at different CO2 concentrations and during drought stress. Planta 1991, 183, 178–184. [Google Scholar] [CrossRef]
- Cornic, G.; Ghashghaie, J. Effect of temperature on net CO2 assimilation and photosystem II quantum yield of electron transfer of French bean (Phaseolus vulgaris L.) leaves during drought stress. Planta 1991, 185, 255–260. [Google Scholar] [CrossRef]
- Yoshida, K.; Terashima, I.; Noguchi, K. Up-regulation of mitochondrial alternative oxidase concomitant with chloroplast over-reduction by excess light. Plant Cell Physiol. 2007, 48, 606–614. [Google Scholar] [CrossRef]
- Walker, B.J.; Strand, D.D.; Kramer, D.M.; Cousins, A.B. The response of cyclic electron flow around photosystem I to changes in photorespiration and nitrate assimilation. Plant Physiol. 2014, 165, 453–462. [Google Scholar] [CrossRef]
- Asada, K. The water–water cycle as alternative photon and electron sinks. Philos. Trans. R. Soc. Lond. B Biol. Sci. 2000, 355, 1419–1431. [Google Scholar] [CrossRef]
- Kadota, K.; Furutani, R.; Makino, A.; Suzuki, Y.; Wada, S.; Miyake, C. Oxidation of P700 induces alternative electron flow in photosystem I in wheat leaves. Plants 2019, 8, 152. [Google Scholar] [CrossRef] [PubMed]
- Kramer, D.M.; Johnson, G.; Kiirats, O.; Edwards, G.E. New Fluorescence Parameters for the Determination of QA Redox State and Excitation Energy Fluxes. Photosynth. Res. 2004, 79, 209–218. [Google Scholar] [CrossRef] [PubMed]
- Baker, N.R. Chlorophyll Fluorescence: A Probe of Photosynthesis In Vivo. Annu. Rev. Plant Biol. 2008, 59, 89–113. [Google Scholar] [CrossRef] [PubMed]
- Miyake, C.; Amako, K.; Shiraishi, N.; Sugimoto, T. Acclimation of tobacco leaves to high light intensity drives the plastoquinone oxidation system--relationship among the fraction of open PSII centers, non-photochemical quenching of Chl fluorescence and the maximum quantum yield of PSII in the dark. Plant Cell Physiol. 2009, 50, 730–743. [Google Scholar] [CrossRef] [PubMed]
- Makino, A.; Miyake, C.; Yokota, A. Physiological functions of the water–water cycle (Mehler reaction) and the cyclic electron flow around PSI in rice leaves. Plant Cell Physiol. 2002, 43, 1017–1026. [Google Scholar] [CrossRef]
- Cherepanov, D.A.; Milanovsky, G.E.; Petrova, A.A.; Tikhonov, A.N.; Semenov, A.Y. Electron transfer through the acceptor side of photosystem I: Interaction with exogenous acceptors and molecular oxygen. Biochem. (Mosc. ) 2017, 82, 1249–1268. [Google Scholar] [CrossRef]
- Khorobrykh, S.; Havurinne, V.; Mattila, H.; Tyystjärvi, E. Oxygen and ROS in photosynthesis. Plants 2020, 9, 91. [Google Scholar] [CrossRef]
- Kozuleva, M.A.; Ivanov, B.N.; Vetoshkina, D.V.; Borisova-Mubarakshina, M.M. Minimizing an electron flow to molecular oxygen in photosynthetic electron transfer chain: An evolutionary view. Front. Plant Sci. 2020, 11, 211. [Google Scholar] [CrossRef]
- Klughammer, C.; Schreiber, U. An improved method, using saturating light pulses, for the determination of photosystem I quantum yield via P700+-absorbance changes at 830 nm. Planta 1994, 192, 261–268. [Google Scholar] [CrossRef]
- Rantala, S.; Lempiäinen, T.; Gerotto, C.; Tiwari, A.; Aro, E.M.; Tikkanen, M. PGR5 and NDH-1 systems do not function as protective electron acceptors but mitigate the consequences of PSI inhibition. Biochim. Biophys. Acta Bioenerg. 2020, 1861, 148154. [Google Scholar] [CrossRef]
- Guinea Diaz, M.; Nikkanen, L.; Himanen, K.; Toivola, J.; Rintamäki, E. Two chloroplast thioredoxin systems differentially modulate photosynthesis in Arabidopsis depending on light intensity and leaf age. Plant J. 2020, 104, 718–734. [Google Scholar] [CrossRef] [PubMed]
- Schreiber, U.; Neubauer, C. O2-dependent electron flow, membrane energization and the mechanism of non-photochemical quenching of chlorophyll fluorescence. Photosynth. Res. 1990, 25, 279–293. [Google Scholar] [CrossRef] [PubMed]
- Hormann, H.; Neubauer, C.; Asada, K.; Schreiber, U. Intact chloroplasts display pH 5 optimum of O2-reduction in the absence of methyl viologen: Indirect evidence for a regulatory role of superoxide protonation. Photosynth. Res. 1993, 37, 69–80. [Google Scholar] [CrossRef] [PubMed]
- Hideg, E.; Kos, P.B.; Schreiber, U. Imaging of NPQ and ROS formation in tobacco leaves: Heat inactivation of the water-water cycle prevents down-regulation of PSII. Plant Cell Physiol. 2008, 49, 1879–1886. [Google Scholar] [CrossRef]
- Hayashi, R.; Shimakawa, G.; Shaku, K.; Shimizu, S.; Akimoto, S.; Yamamoto, H.; Amako, K.; Sugimoto, T.; Tamoi, M.; Makino, A.; et al. O2-dependent large electron flow functioned as an electron sink, replacing the steady-state electron flux in photosynthesis in the cyanobacterium Synechocystis sp. PCC 6803, but not in the cyanobacterium Synechococcus sp. PCC 7942. Biosci. Biotech. Biochem. 2014, 78, 384–393. [Google Scholar] [CrossRef]
- Shimakawa, G.; Shaku, K.; Nishi, A.; Hayashi, R.; Yamamoto, H.; Sakamoto, K.; Makino, A.; Miyake, C. FLAVODIIRON2 and FLAVODIIRON4 proteins mediate an oxygen-dependent alternative electron flow in Synechocystis sp. PCC 6803 under CO2-limited conditions. Plant Physiol. 2015, 167, 472–480. [Google Scholar] [CrossRef]
- Barrs, H.D. Cyclic variations in stomatal aperture, transpiration, and leaf water potential under constant environmental conditions. Annu. Rev. Plant Physiol. 1971, 22, 223–236. [Google Scholar] [CrossRef]
- Rose, M.A.; Rose, M.A. Oscillatory transpiration may complicate stomatal conductance and gas-exchange measurements. HortScience 1994, 29, 693–694. [Google Scholar] [CrossRef]
- Marenco, R.A.; Siebke, K.; Farquhar, G.D.; Ball, M.C. Hydraulically based stomatal oscillations and stomatal patchiness in Gossypium hirsutum. Funct. Plant Biol. 2006, 33, 1103. [Google Scholar] [CrossRef]
- Dai, Z.; Ku, M.; Edwards, G.E. C4 Photosynthesis (The CO2-concentrating mechanism and photorespiration). Plant Physiol. 1993, 103, 83–90. [Google Scholar] [CrossRef]
- Peterson, R.B. Regulation of electron transport in photosystems I and II in C3, C3-C4, and C4 species of panicum in response to changing irradiance and O2 levels. Plant Physiol. 1994, 105, 349–356. [Google Scholar] [CrossRef] [PubMed]
- Carmo-Silva, A.E.; Powers, S.J.; Keys, A.J.; Arrabaça, M.C.; Parry, M.A.J. Photorespiration in C4grasses remains slow under drought conditions. Plant Cell Environ. 2008, 31, 925–940. [Google Scholar] [CrossRef]
- Makino, A.; Nakano, H.; Mae, T. Responses of ribulose-1,5-bisphosphate carboxylase, cytochrome f, and sucrose synthesis enzymes in rice leaves to leaf nitrogen and their relationships to photosynthesis. Plant Physiol. 1994, 105, 173–179. [Google Scholar] [CrossRef] [PubMed]
- von Caemmerer, S. Biochemical Models of Leaf Photosynthesis; CSIRO Publishing: Collingwood, Australia, 2000. [Google Scholar]
- Klughammer, C.; Schreiber, U. Deconvolution of ferredoxin, plastocyanin, and P700 transmittance changes in intact leaves with a new type of kinetic LED array spectrophotometer. Photosynth. Res. 2016, 128, 195–214. [Google Scholar] [CrossRef] [PubMed]
- Shimakawa, G.; Roach, T.; Krieger-Liszkay, A. Changes in photosynthetic electron transport during leaf senescence in two barley varieties grown in contrasting growth regimes. Plant Cell Physiol. 2020, pcaa114. [Google Scholar] [CrossRef] [PubMed]
- Sacksteder, C.A.; Kramer, D.M. Dark-interval relaxation kinetics (DIRK) of absorbance changes as a quantitative probe of steady-state electron transfer. Photosynth. Res. 2000, 66, 145–158. [Google Scholar] [CrossRef] [PubMed]
- Wada, S.; Suzuki, Y.; Takagi, D.; Miyake, C.; Makino, A. Effects of genetic manipulation of the activity of photorespiration on the redox state of photosystem I and its robustness against excess light stress under CO2-limited conditions in rice. Photosynth. Res. 2018, 137, 431–441. [Google Scholar] [CrossRef]
- Klughammer, C.; Kolbowski, J.R.; Schreiber, U. LED array spectrophotometer for measurement of time resolved difference spectra in the 530-600 nm wavelength region. Photosynth. Res. 1990, 25, 317–327. [Google Scholar] [CrossRef]
- Heimann, S.; Schreiber, U. Characterisation of a H2O2-oxidisable cytochrome b-559 in intact chloroplasts with a new type of LED array spectrophotometer. Photosynth. Res. 1996, 47, 187–197. [Google Scholar] [CrossRef]
- Klughammer, C.; Siebke, K.; Schreiber, U. Continuous ECS-indicated recording of the proton-motive charge flux in leaves. Photosynth. Res. 2013, 117, 471–487. [Google Scholar] [CrossRef]
Publisher’s Note: MDPI stays neutral with regard to jurisdictional claims in published maps and institutional affiliations. |
© 2020 by the authors. Licensee MDPI, Basel, Switzerland. This article is an open access article distributed under the terms and conditions of the Creative Commons Attribution (CC BY) license (http://creativecommons.org/licenses/by/4.0/).