Article

Hybrid-Transcriptome Sequencing and Associated Metabolite Analysis Reveal Putative Genes Involved in Flower Color Difference in Rose Mutants

State Key Laboratory of Tree Genetics and Breeding, Laboratory of Forest Silviculture and Tree Cultivation, Research Institute of Forestry, Chinese Academy of Forestry, Beijing 100091, China
*
Authors to whom correspondence should be addressed.
Plants 2019, 8(8), 267; https://doi.org/10.3390/plants8080267
Submission received: 16 May 2019 / Revised: 21 July 2019 / Accepted: 29 July 2019 / Published: 5 August 2019

Abstract

:
Gene mutation is a common phenomenon in nature that often leads to phenotype differences, such as the variations in flower color that frequently occur in roses. With the aim of revealing the genomic information and inner mechanisms, the differences in the levels of both transcription and secondary metabolism between a pair of natural rose mutants were investigated by using hybrid RNA-sequencing and metabolite analysis. Metabolite analysis showed that glycosylated derivatives of pelargonidin, e.g., pelargonidin 3,5 diglucoside and pelargonidin 3-glucoside, which were not detected in white flowers (Rosa ‘Whilte Mrago Koster’), constituted the major pigments in pink flowers. Conversely, the flavonol contents of petal, such as kaempferol-3-glucoside, quercetin 3-glucoside, and rutin, were higher in white flowers. Hybrid RNA-sequencing obtained a total of 107,280 full-length transcripts in rose petal which were annotated in major databases. Differentially expressed gene (DEG) analysis showed that the expression of genes involved in the flavonoid biosynthesis pathway was significantly different, e.g., CHS, FLS, DFR, LDOX, which was verified by qRT-PCR during flowering. Additionally, two MYB transcription factors were found and named RmMYBAN2 and RmMYBPA1, and their expression patterns during flowering were also analyzed. These findings indicate that these genes may be involved in the flower color difference in the rose mutants, and competition between anthocyanin and flavonol biosynthesis is a primary cause of flower color variation, with its regulation reflected by transcriptional and secondary metabolite levels.

1. Introduction

Rose is one of the most important ornamental woody plants belonging to the genus Rosa of the Rosaceae family, and its original species and cultivar present diverse flowers, delicate fragrances, and ornamental traits. Roses have also been widely used as garden ornaments, cut-flowers, food, and medicine over thousands of years, and the rose has accounted for more than one-third of the total cut flower industry worldwide [1,2]. Over the past 5000 years, over 30,000 cultivated varieties have been selected and bred by the hybridization of certain original species and their cultivars, which are distributed across China, Europe, and the Middle East. Frequent interspecies crossbreeding between cultivated varieties and polyploid wild species has made the classification of roses very difficult, and these kinds of extensive hybridizations have led to the diversification of floral traits [3]. Floral traits have always attracted attention from breeders and scientists, and flower phenotypes result from the complex interaction of molecular and cellular processes with environmental factors [4]. Therefore, an understanding of the inner genetic regulation and control mechanisms is not only of interest to fundamental science, but is also an opportunity to enhance the knowledge regarding how these characteristics were selected or introduced to new cultivated varieties for improving the quality of rose [5]. Polyploidy, interspecies hybridizations, and a lack of effective genetic transformation systems have continued to be impeded to characterize gene function in roses. However, a large number of molecular markers have been developed in the last twenty years, e.g., simple sequence repeats (SSRs) and single nucleotide polymorphisms (SNPs) [2,6,7,8,9]. These markers have been used to identify different rose varieties, establish a DNA profiling database, construct a genetic linkage map, and genome-wide association analysis of flower traits [10,11,12].
Floral color is one of the most prominent traits in ornamental plants. In roses, petal color exhibits a wide range of variation in nature, except blue. Anthocyanidin, which is a kind of flavonoid found in plants, has been demonstrated to produce primary floral pigments: Pink or red petals result from anthocyanin and its derivatives, and yellow or orange petals may contain some carotenoid and anthocyanin [13]. The biosynthesis pathways of flavonoids have been well characterized in Arabidopsis, Petunia, and other species [14,15]. Flavonoids are derived from the phenylalanine metabolism pathway: A specific substrate is catalyzed by phenylalanine ammonia-lyase (PAL), chalcone synthase (CHS), chalcone isomerase (CHI), and flavanone 3-hydroxylase (F3H), and flows into anthocyanin biosynthesis by dihydroflavonol 4-reductase (DFR), anthocyanidin synthase (ANS) and UDP-glucose—flavonoid 3-O-glucosyltransferase (UFGT) or the biosynthesis enter into flavonol pathway by flavonol synthase (FLS). Co-expression and regulation of these related genes have been detected in some plants [16]. The composition of anthocyanidin and flavonol results in the diverse phenotype of the flower, from light to dark, or monochrome to polychrome [17]. Additionally, the co-pigment, intracellular pH, and external environment also play significant roles in floral color phenotypes [18,19,20]. The recent publications of several high-quality genomes of Rosa species will promote the development of fundamental research on Rosa spp. [21,22,23]. Nevertheless, the molecular mechanisms that control floral color may vary among different roses, because modern roses represent a complicated cultivated population [24,25].
Flower traits vary frequently in roses, e.g., floral color and type, and that is why many of the rose varieties that have been selected are based on natural mutations. These varieties are valuable research materials for the comparison and analysis of plant trait variations because they are nearly isogenic when compared to each other. With the rapid development of biotechnology, new approaches and tools could be used to reveal the internal mechanisms of phenotypic expression in plants, especially those involved in secondary metabolite biosynthesis [26,27,28,29,30]. Transcriptome analysis has been popular for studying differences in gene expression in the context of floral development and transition, and in response to stress and exogenous hormones; therefore, vast and useful transcript information has been found in rose using next-generation sequencing (NGS) [31,32,33,34]. Moreover, long-read sequencing is one of the most important merits of the PacBio platform, which can provide 3–10 kb of information from DNA or RNA, and will contribute to gene isoform reconstruction, novel isoform, and fusion gene discovery. Additionally, the annotation will be more accurate than NGS [35,36,37]. Combining their strengths, hybrid-seq strategy (PacBio + NGS) will consider both read lengths and sequencing accuracy in transcriptome analysis, and reduce the appearance of false assembly [38].
In this study, we attempt to understand the difference in transcriptional and secondary metabolism levels between two rose varieties with different phenotypes, using both hybrid-transcriptome sequencing and metabolite analysis on two rose varieties with different flower colors: Rosa ‘Margo Koster’ (pink) and Rosa ‘White Margo Koster’ (white). For RNA-seq, we constructed and sequenced cDNA libraries of petals at the full-bloom stage using the Illumina HiSeq 2500 and PacBio RSII platforms. In addition, relative quantification of flavonoid and anthocyanin in the petals was analyzed by high-performance liquid chromatography–diode array detection–electrospray ionization with high-resolution mass spectrometry (HPLC–DAD–ESI–HR–MS). Candidate genes related to pigment biosynthesis in the petals were verified by qRT-PCR at different developmental stages.

2. Results

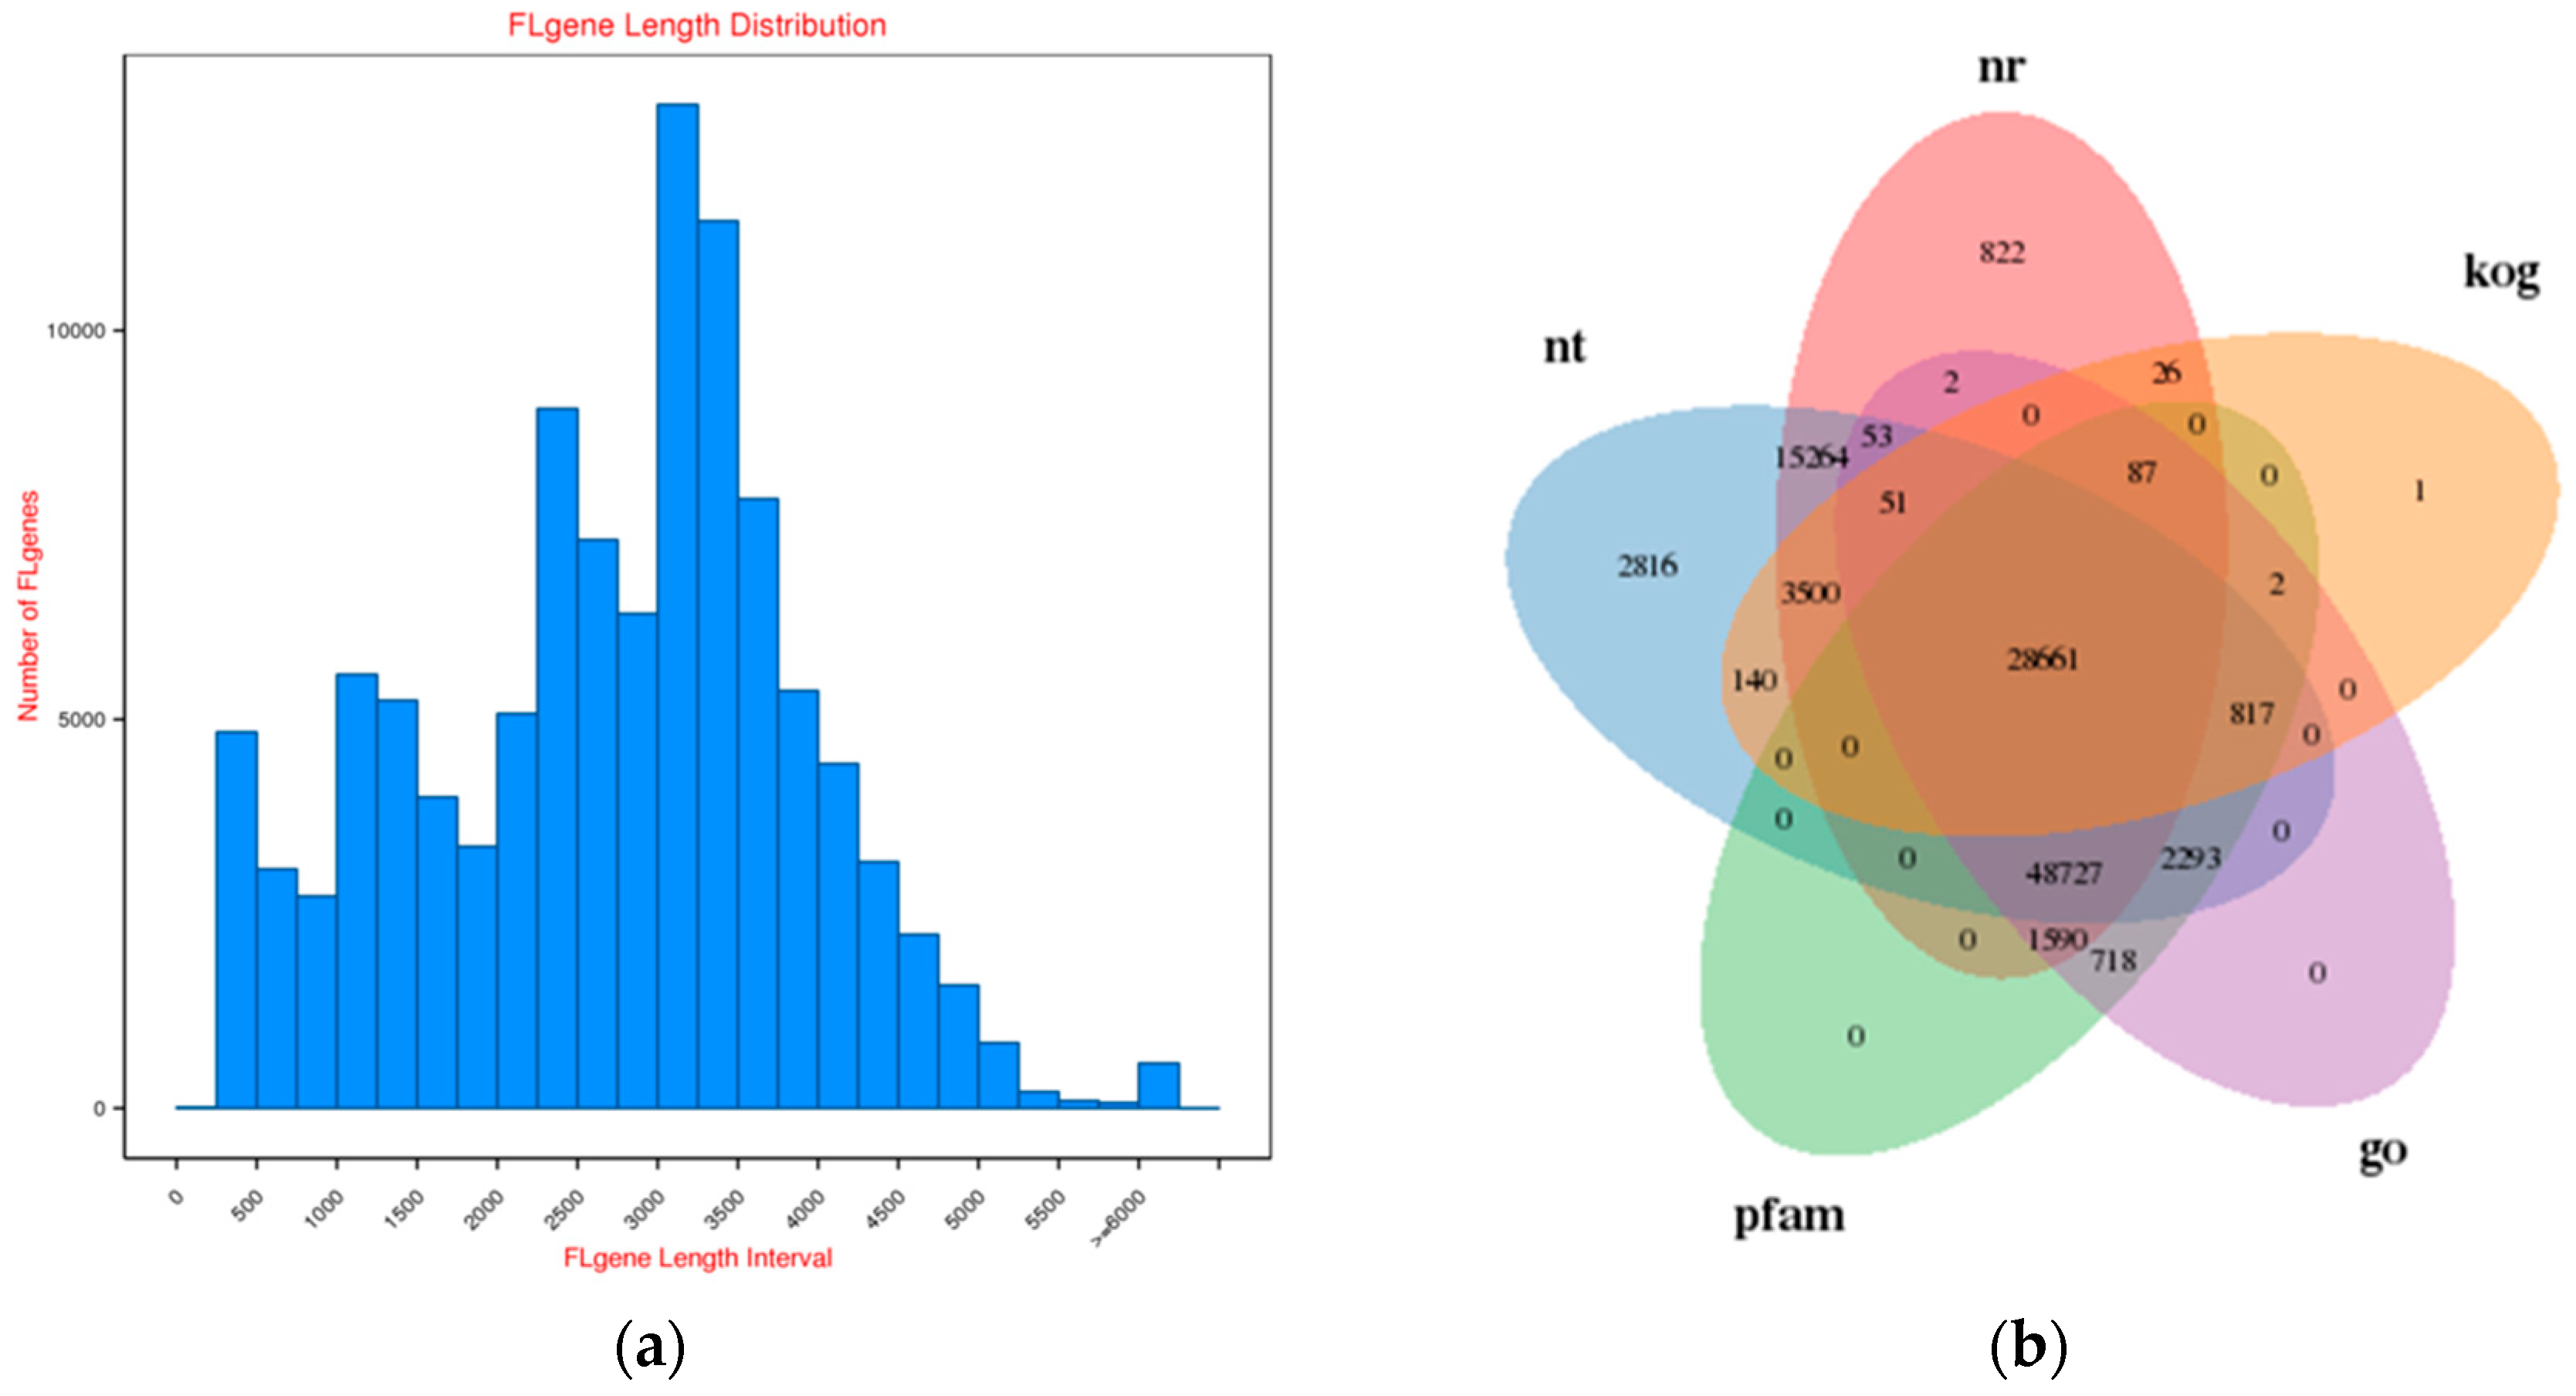
2.1. Survey on Hybrid RNA Sequencing

Samples from rose petals at the blooming stage were used for hybrid RNA sequencing (Figure 1). The results show that 538.39 million clean sub-reads were obtained using PacBio sequencing technology (Table 1), and 156.96 million clean reads and 156.99 clean reads for Rosa ‘Margo Koster’ and Rosa ‘White Margo Koster’ were obtained on the Illumina platform, respectively (Table 2). Clean data have been uploaded to the National Center for Biotechnology Information Sequence Read Archive (accession number: SRP132317).
A total of 463,753 circular consensus sequences (CCS) were generated from three single-molecule real-time sequencing (SMRT) cells in a non-normalized bin (1–2, 2–3, and 3–6 kb), including 365,407 (78%) full-length non-chimeric (Flnc) reads and 100,346 (22%) non-Flnc reads. The average length of an Flnc read was 2591 bp. To enhance the quality and accuracy of SMRT transcripts and quantify gene expression, a total of 313 million reads from two rose varieties were generated by the HiSeq 2500 platform, and over 83% of these reads were mapped to the reference transcripts generated by PacBio RSII. Raw SMRT sequencing reads were processed by SMRTLinkv4.0, and all SMRT sub-reads were corrected using over 300 million HiSeq reads as input data by Proovread. Then, all SMRT sub-reads were processed by CD-HIT-EST to remove the redundant sequences. Finally, a total of 107,280 transcripts were generated with an N50 of 3267 bp and an average length of 2710 bp. The transcripts longer than approximately 1 kb accounted for more than 90%; their length distribution is illustrated in Figure 2a.

2.2. Functional Annotation of Rose Variety

Annotation of the transcripts was carried out to generate a hybrid-transcriptome database of rose variety. The results of gene function annotation showed that a total of 105,582 (98.41%) transcripts were annotated in at least one database, and a total of 21,857 transcripts were annotated in seven databases, including Nucleotide Sequence Database, Nt; Non-Redundant Protein Sequence Database, Nr; Protein families database, Pfam, Gene Ontology, GO, and euKaryotic Orthologous Groups database, KOG (Figure 2b), and the detailed annotation information is shown in Supplemental File 1. Additionally, more than 3000 potential transcription factors (TFs) were predicted by iTAK (Supplemental Figure S1). As a result, a total of 83,001 transcripts were mapped to GO terms. Assignments were given to biological processes (29.33%), molecular functions (47.53%), and cellular components (23.14%) (Supplemental Figure S2). Among all of the GO terms, the vast majority were related to cell components (148,617), biological process (240,852), and molecular functions (117,253). In addition, all of the transcripts were mapped to records in the KOG database, and KOG annotations were retrieved with a total of 33,285 putative proteins that were functionally classified into at least 25 protein families (Supplemental Figure S3). Finally, KEGG (Kyoto Encyclopedia of Genes and Genomes) pathway analysis was performed to assign biological pathways to all of the transcripts; the results showed that 43,005 transcripts were assigned to 128 KEGG pathways and clustered into 19 groups, e.g., transport and catabolism, membrane transport, folding, sorting, and degradation (Supplemental Figure S4).

2.3. Simple Sequence Repeat (SSR) Detection

Simple sequence repeat (SSR) is a co-dominant, abundant molecular marker in the genome which has been used for fundamental plant science research, such as population genetics, QTL mapping, and DNA profiling. In total, 40,074 putative SSR motifs (di-hexanucleotides) were identified in 45,782 full-length transcripts, in addition to 56,828 mononucleotide motifs. Out of these full-length transcripts, a total of 20,252 (20.89%) included more than one SSR, whereas a total of 28,391 (29.29%) was presented in compound formation. The highest frequency of SSR was of mononucleotide (58.64%), followed by dinucleotide (26.06%) and trinucleotide (14.24%), as shown in Table 3. Compared with next-generation sequencing, the efficiency of mining putative SSR motifs and their compound formation was improved greatly using the PacBio technique, owing to its ability to obtain long reads. The primers information of candidate SSR markers is listed in Supplemental File 3. These putative SSR loci may be potential candidates for the development of genic SSR markers and be informative in constructing genetic maps or describing genetic variation in roses.

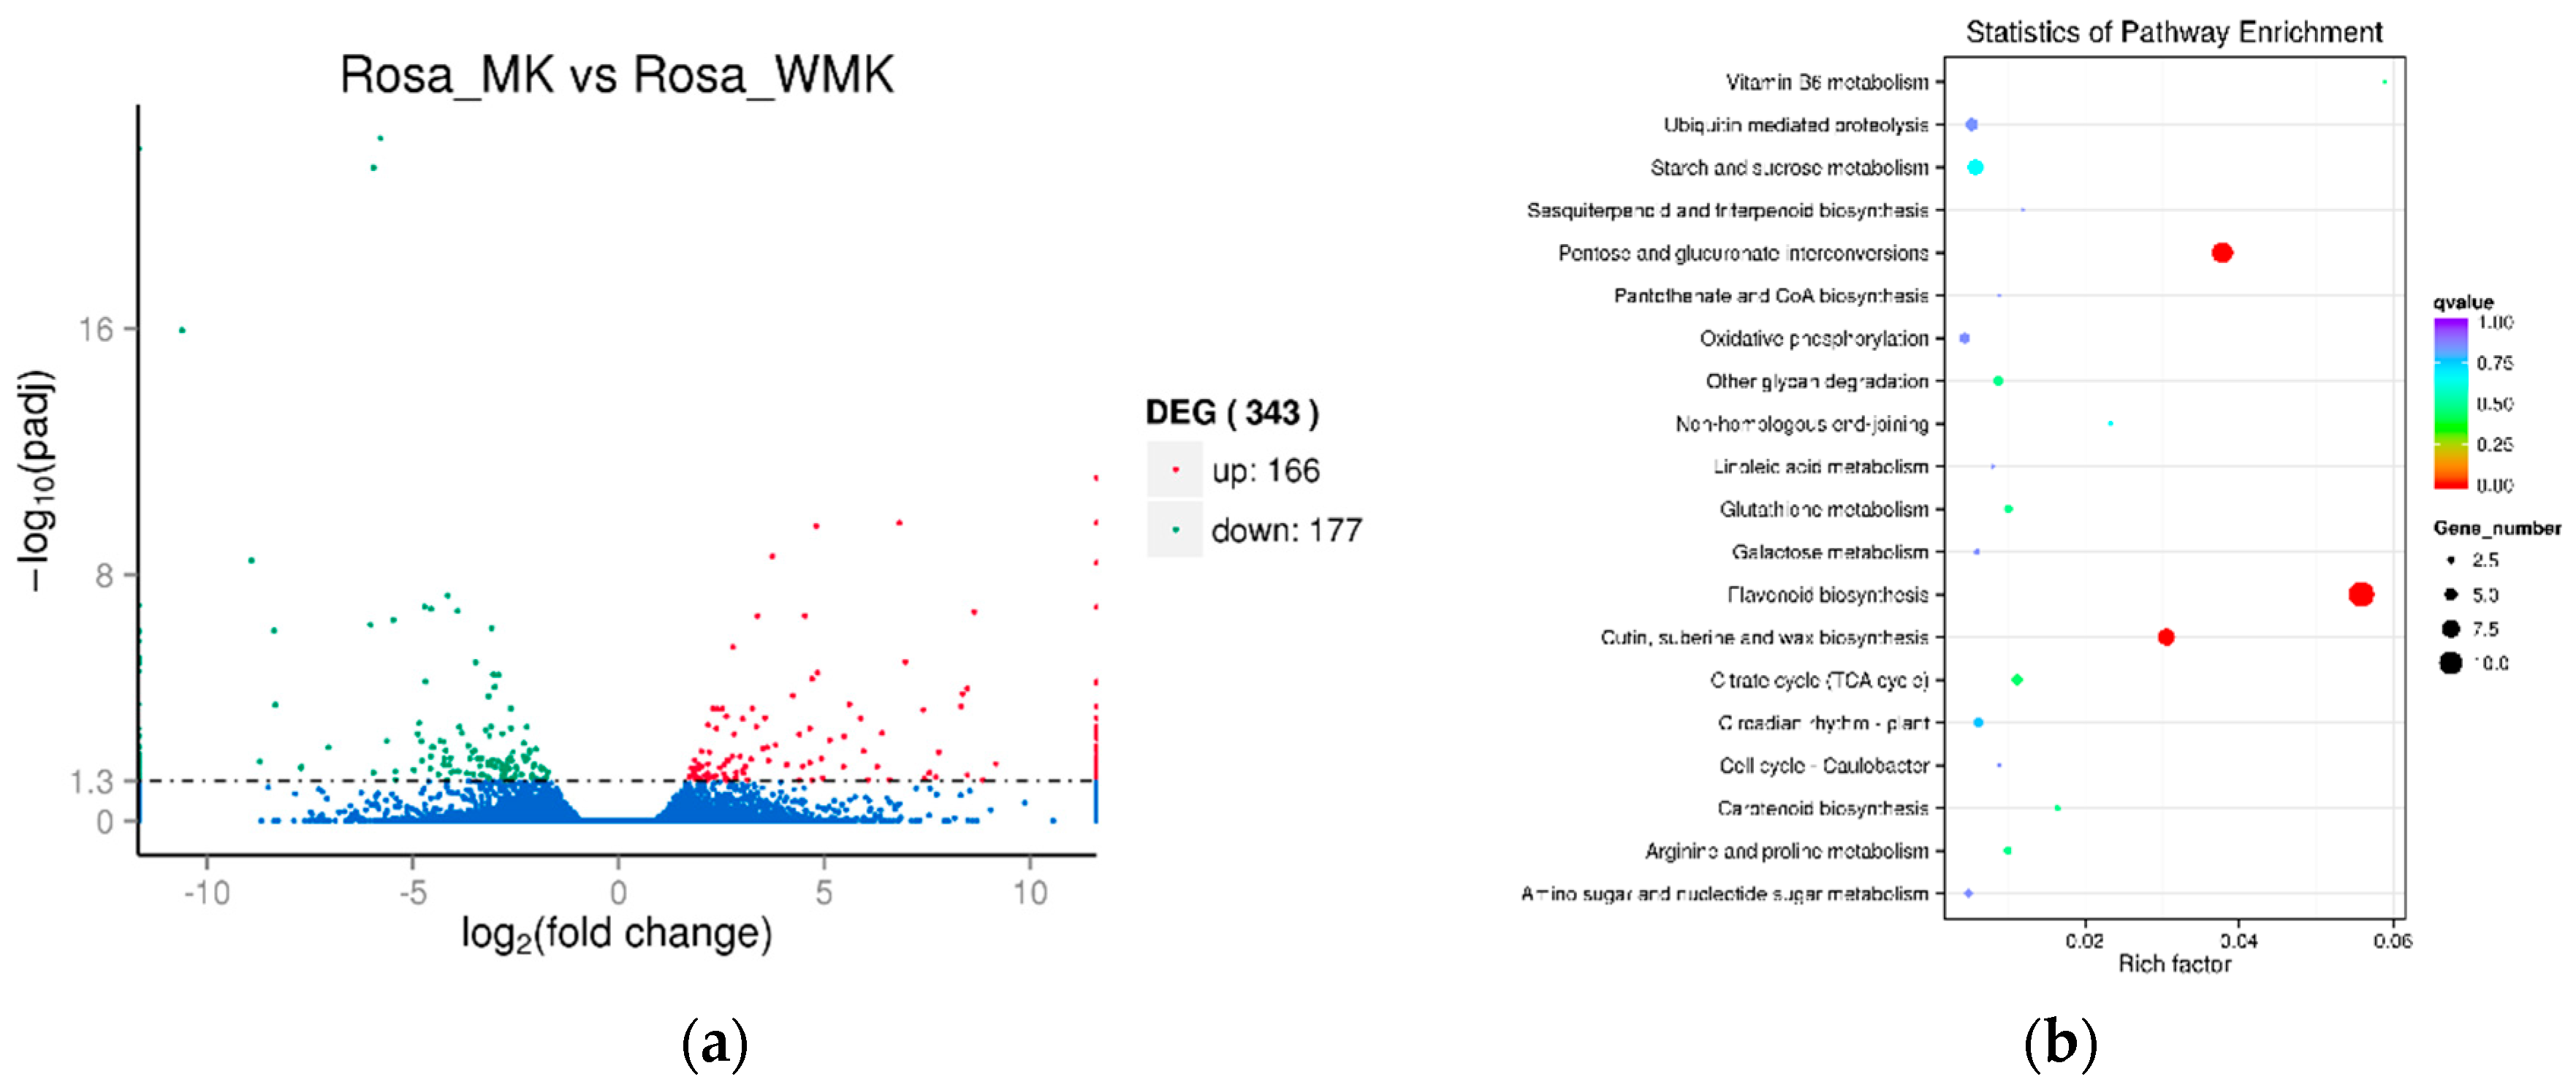
2.4. Analysis of Differentially Expressed Genes (DEGs) Identified in the Two Libraries

Analysis of differentially expressed genes (DEGs) was performed between Rosa ‘Margo Koster’ (pink) and Rosa ‘White Margo Koster’ (white) based on the FPKM (Fragments Per Kilobase Million) with the thresholds Padj < 0.05 and fold change >2. The results show that there were 343 DEGs (166-up- and 177-down-regulated) between two rose varieties (Figure 3, Supplemental Table S1, and Supplemental File S2). A total of 125 up-regulated DEGs and 138 down-regulated DEGs were enriched into GO terms. The main terms were “catalytic activity” including 178 DEGs. A total of 125 up-regulated DEGs and 138 down-regulated DEGs were enriched into KEGG pathways, the main pathways of DEGs enrichment were “Flavonoid biosynthesis” (ko00941), “Pentose and glucuronate interconversions” (ko00040) and “Cutin, suberine and wax biosynthesis” (ko00073) (Figure 3).

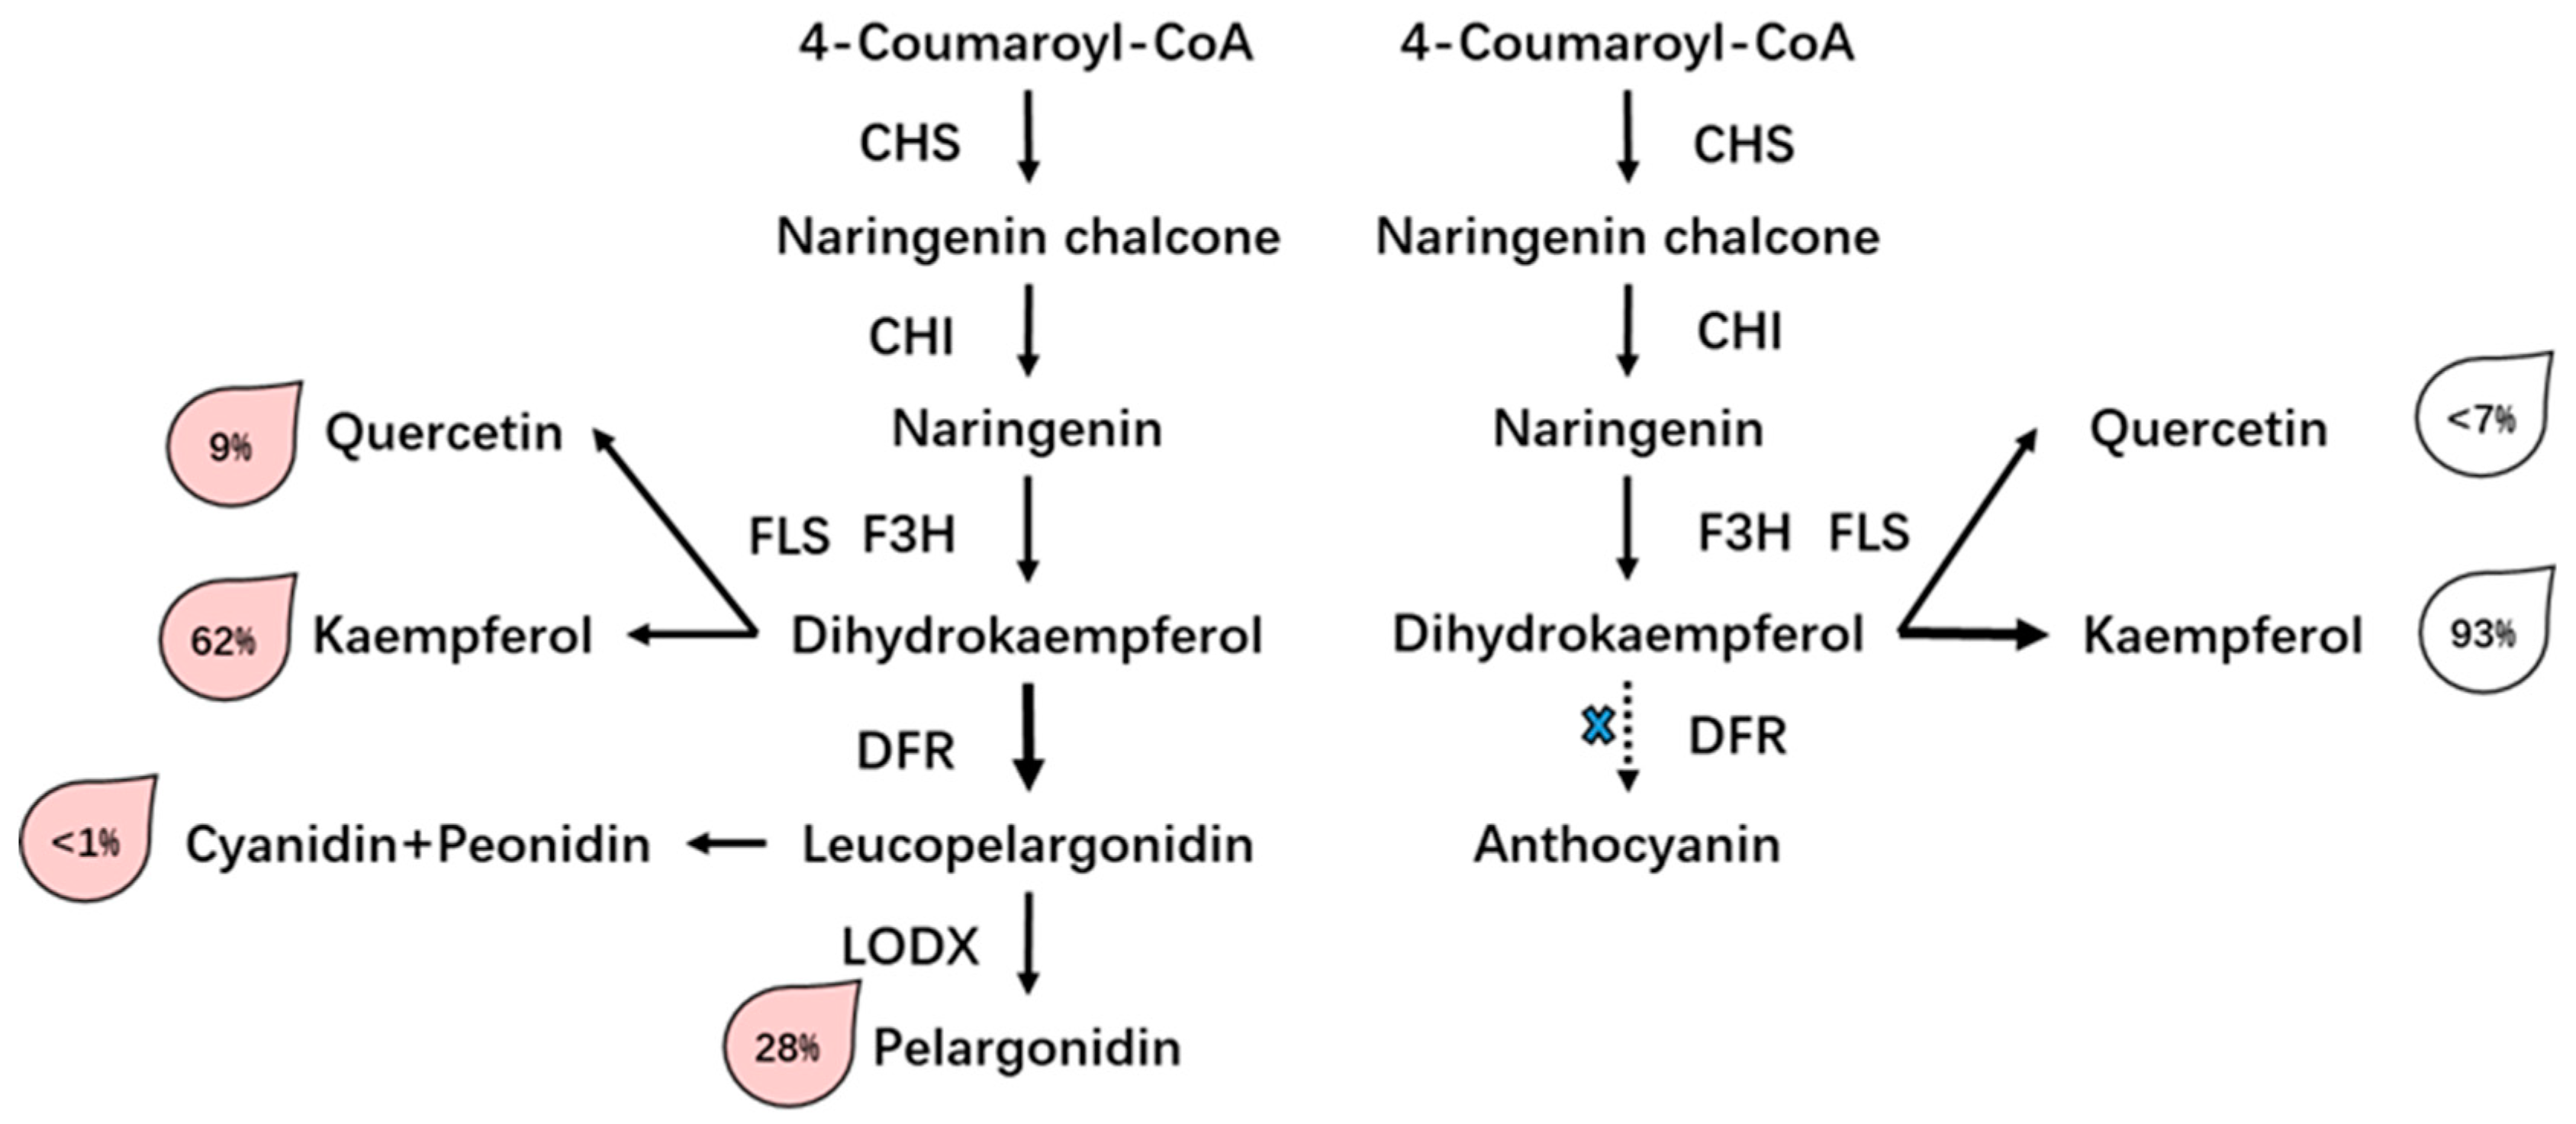
2.5. Characterization and Expression Analysis of Genes Involved in Flavonoids and Associated Biosynthesis Pathway

Pigments in rose flower are mainly flavonoids, anthocyanins, and carotenoids, and the different compositions of these secondary metabolites contribute to the diversity of flower color [39]. According to gene annotation and the classification of KEGG, about 6% of transcripts were assigned to secondary metabolite biosynthesis, e.g., a total of 350 transcripts were related to the phenylpropanoid biosynthesis, and a total of 197 transcripts coded 13 enzymes which catalyzed the synthesis of various flavonoids, including chalcone, flavone, flavonol, and their derivatives (Supplemental Table S2). Hence, genes in the flavonoid, anthocyanin, and flavonol biosynthesis pathways were the focus of this study. Based on the gene annotation and DEGs analysis, the targeted gene involved in flavonoids and the associated biosynthesis pathway were screened and compared. The results showed that the expression of genes encoding chalcone synthase (CHS), flavonol synthase (FLS), dihydroflavonol-4-reductase (DFR), leucoanthocyanidin dioxygenase (LDOX), and glucosyltransferase (GT) significantly differed between the two rose varieties (Table 4). Some genes in the flavonoid pathway had differential expression levels in Rosa ‘Margo Koster’ compared to Rosa ‘White Margo Koster’, suggesting that these changes affect the anthocyanin and flavonol biosynthesis pathways, respectively, due to regulation at the transcriptional level.

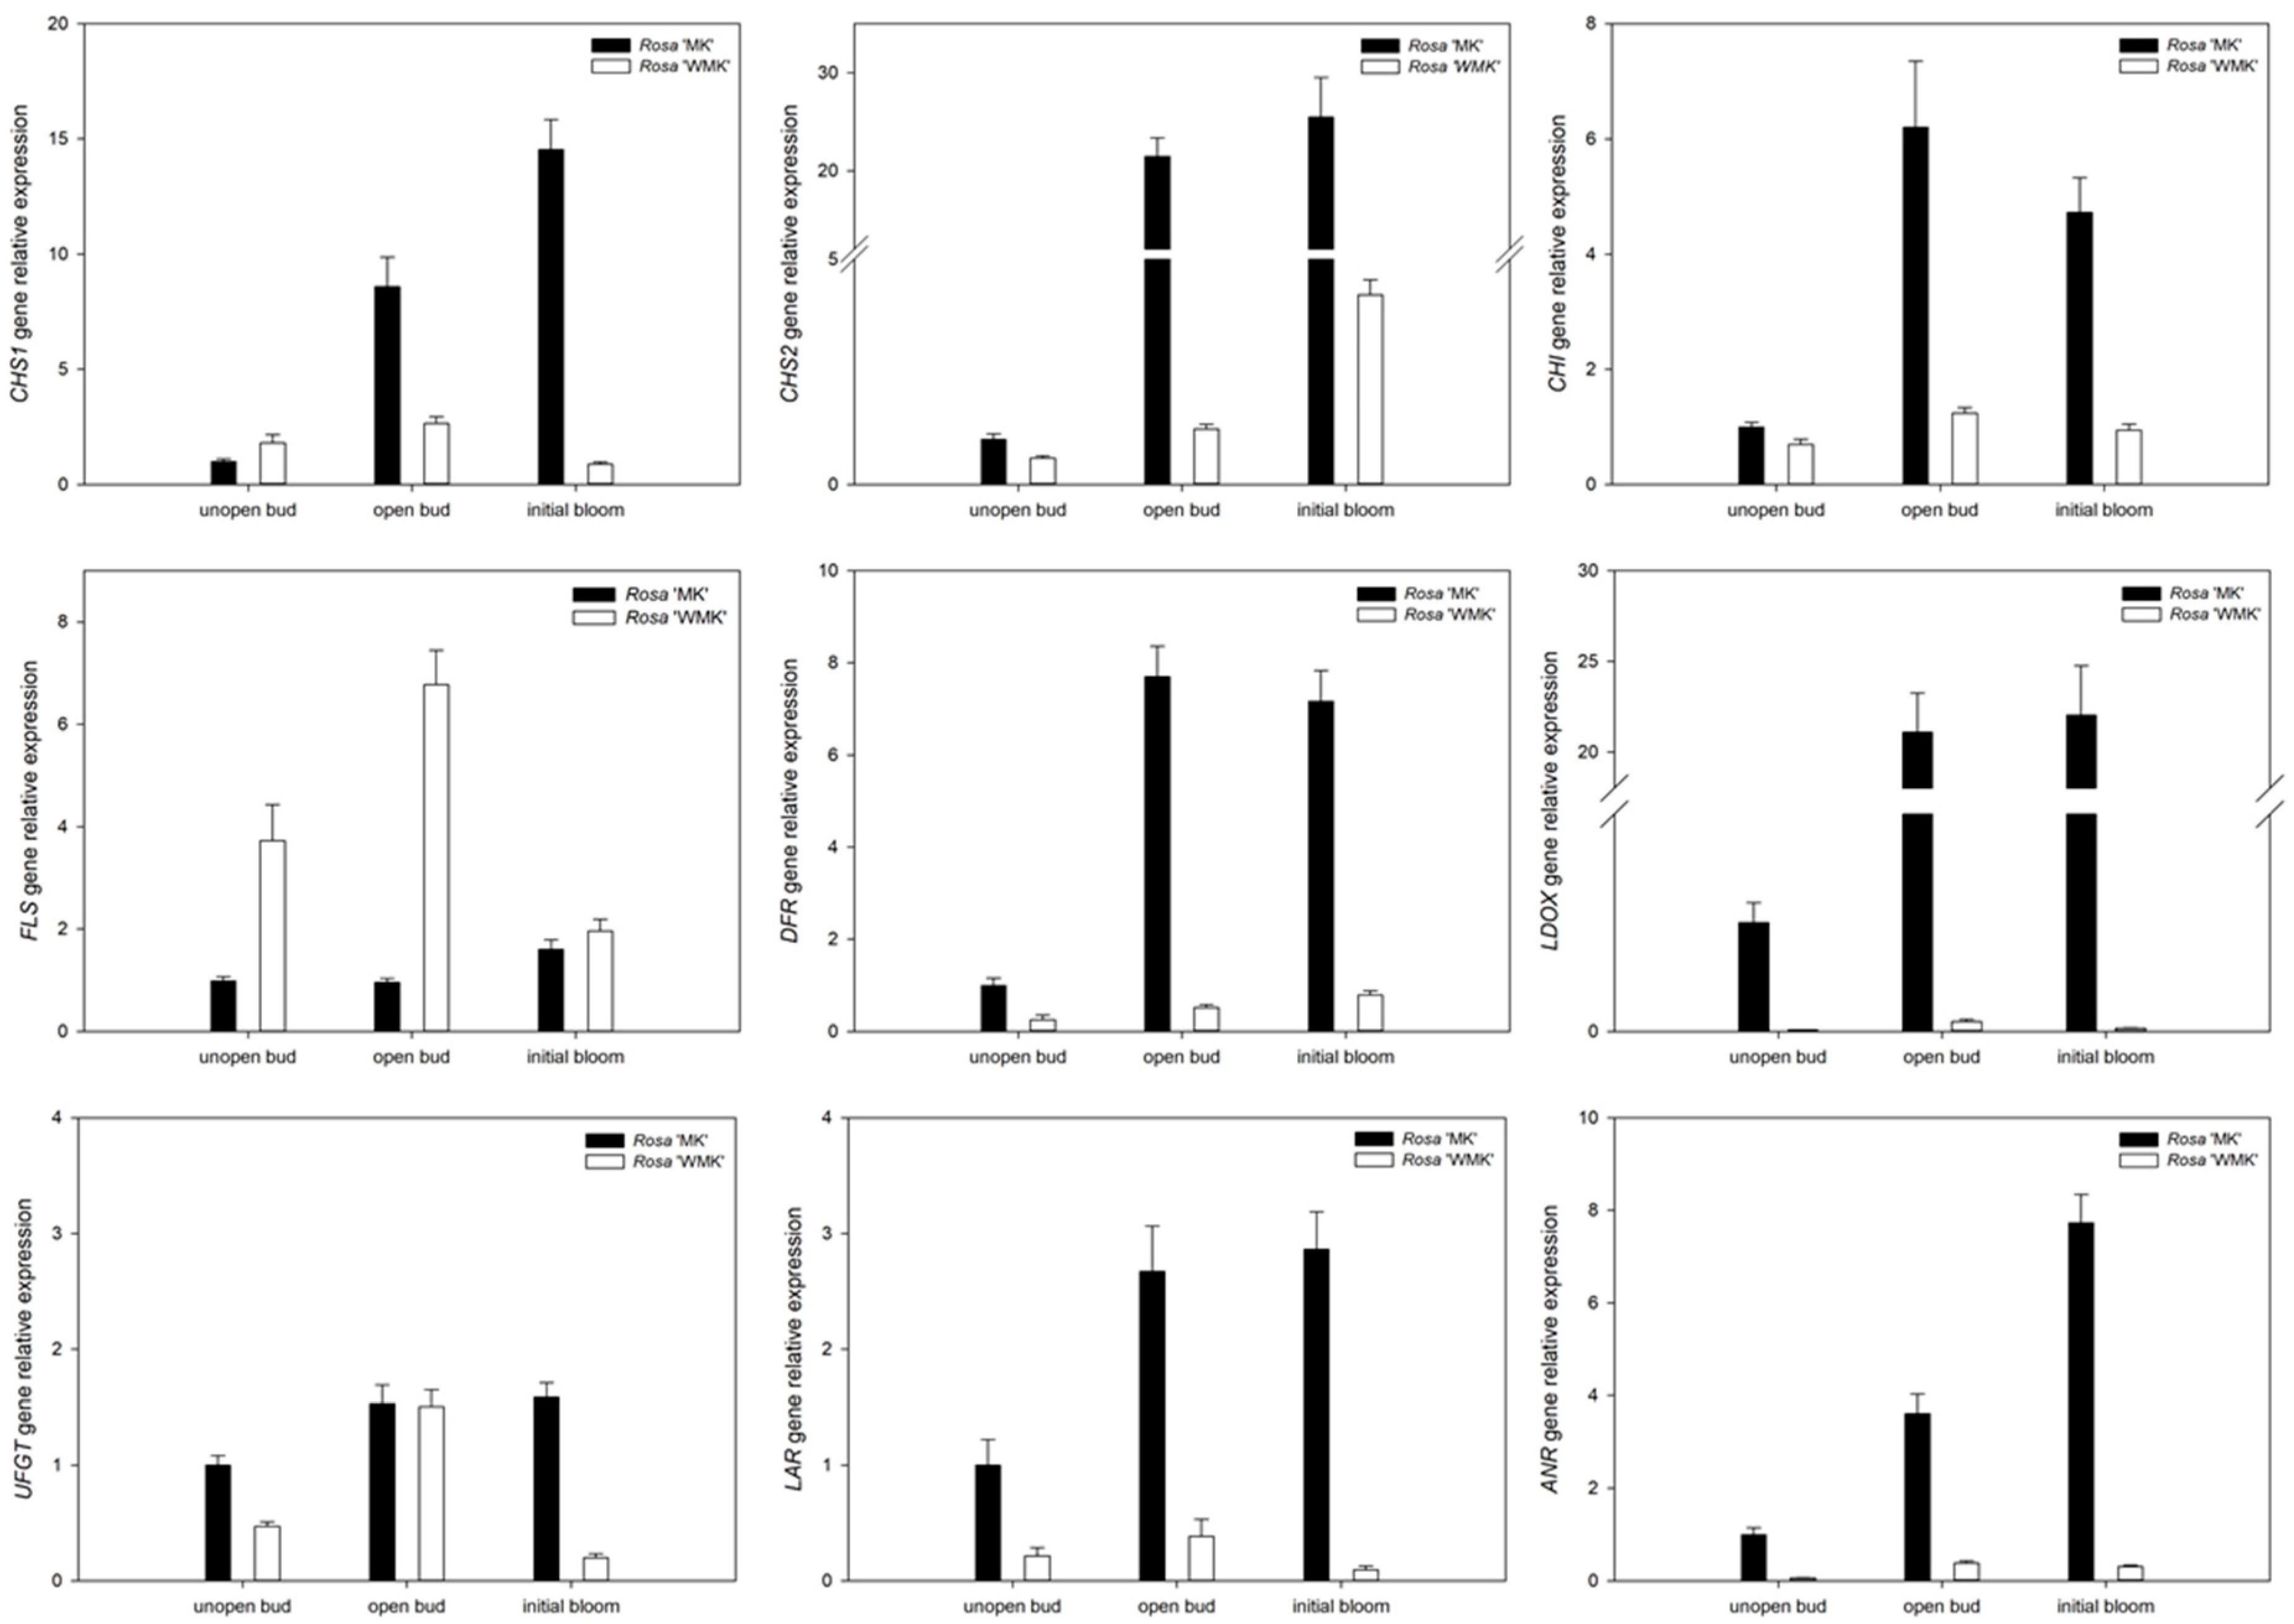
2.6. Expression Profiling of Flavonoid Biosynthesis Related Genes During Flowering

Anthocyanin is well known for its role in the coloration of flowers, and flavonol is also an important co-pigment in plants. A previous study has reported that various flower colors in plants can be attributed to differences in the biosynthesis pathways or accumulation of anthocyanin [40]. Thus, our results also support the findings of previous research. To verify the results of transcriptome sequencing and investigate the patterns of gene expression in petals during flowering, the expression of genes related to the aforementioned biosynthesis pathways were analyzed in petals by qRT-PCR during different flowering stages, including unopen bud, open bud, and initial bloom. Firstly, PCR efficiency of each mRNA and Raw Cq data of qRT-PCR was calculated and is shown in Supplemental Table S3 and Supplemental Figure S5, and the relative gene expression level is shown in Figure 4. These results show that the expressions of CHS and CHI in Rosa ‘White Margo Koster’ were lower than that in Rosa ‘Margo Koster’, and expressions of DFR and LDOX were almost undetectable in white flowers during flowering. These genes are known to contribute to pigment biosynthesis and accumulation. Further, LAR and ANR, which, respectively, code enzymes for catalyzing the transformation of leucocyanidin and anthocyanin into procyanidin, also had lower expression levels in white flowers during flowering, indicating less accumulation of anthocyanin or its precursor. By contrast, the expression of FLS in the petals of Rosa ‘White Margo Koster’ was higher than that in Rosa ‘Margo Koster’ during flowering (Figure 4).

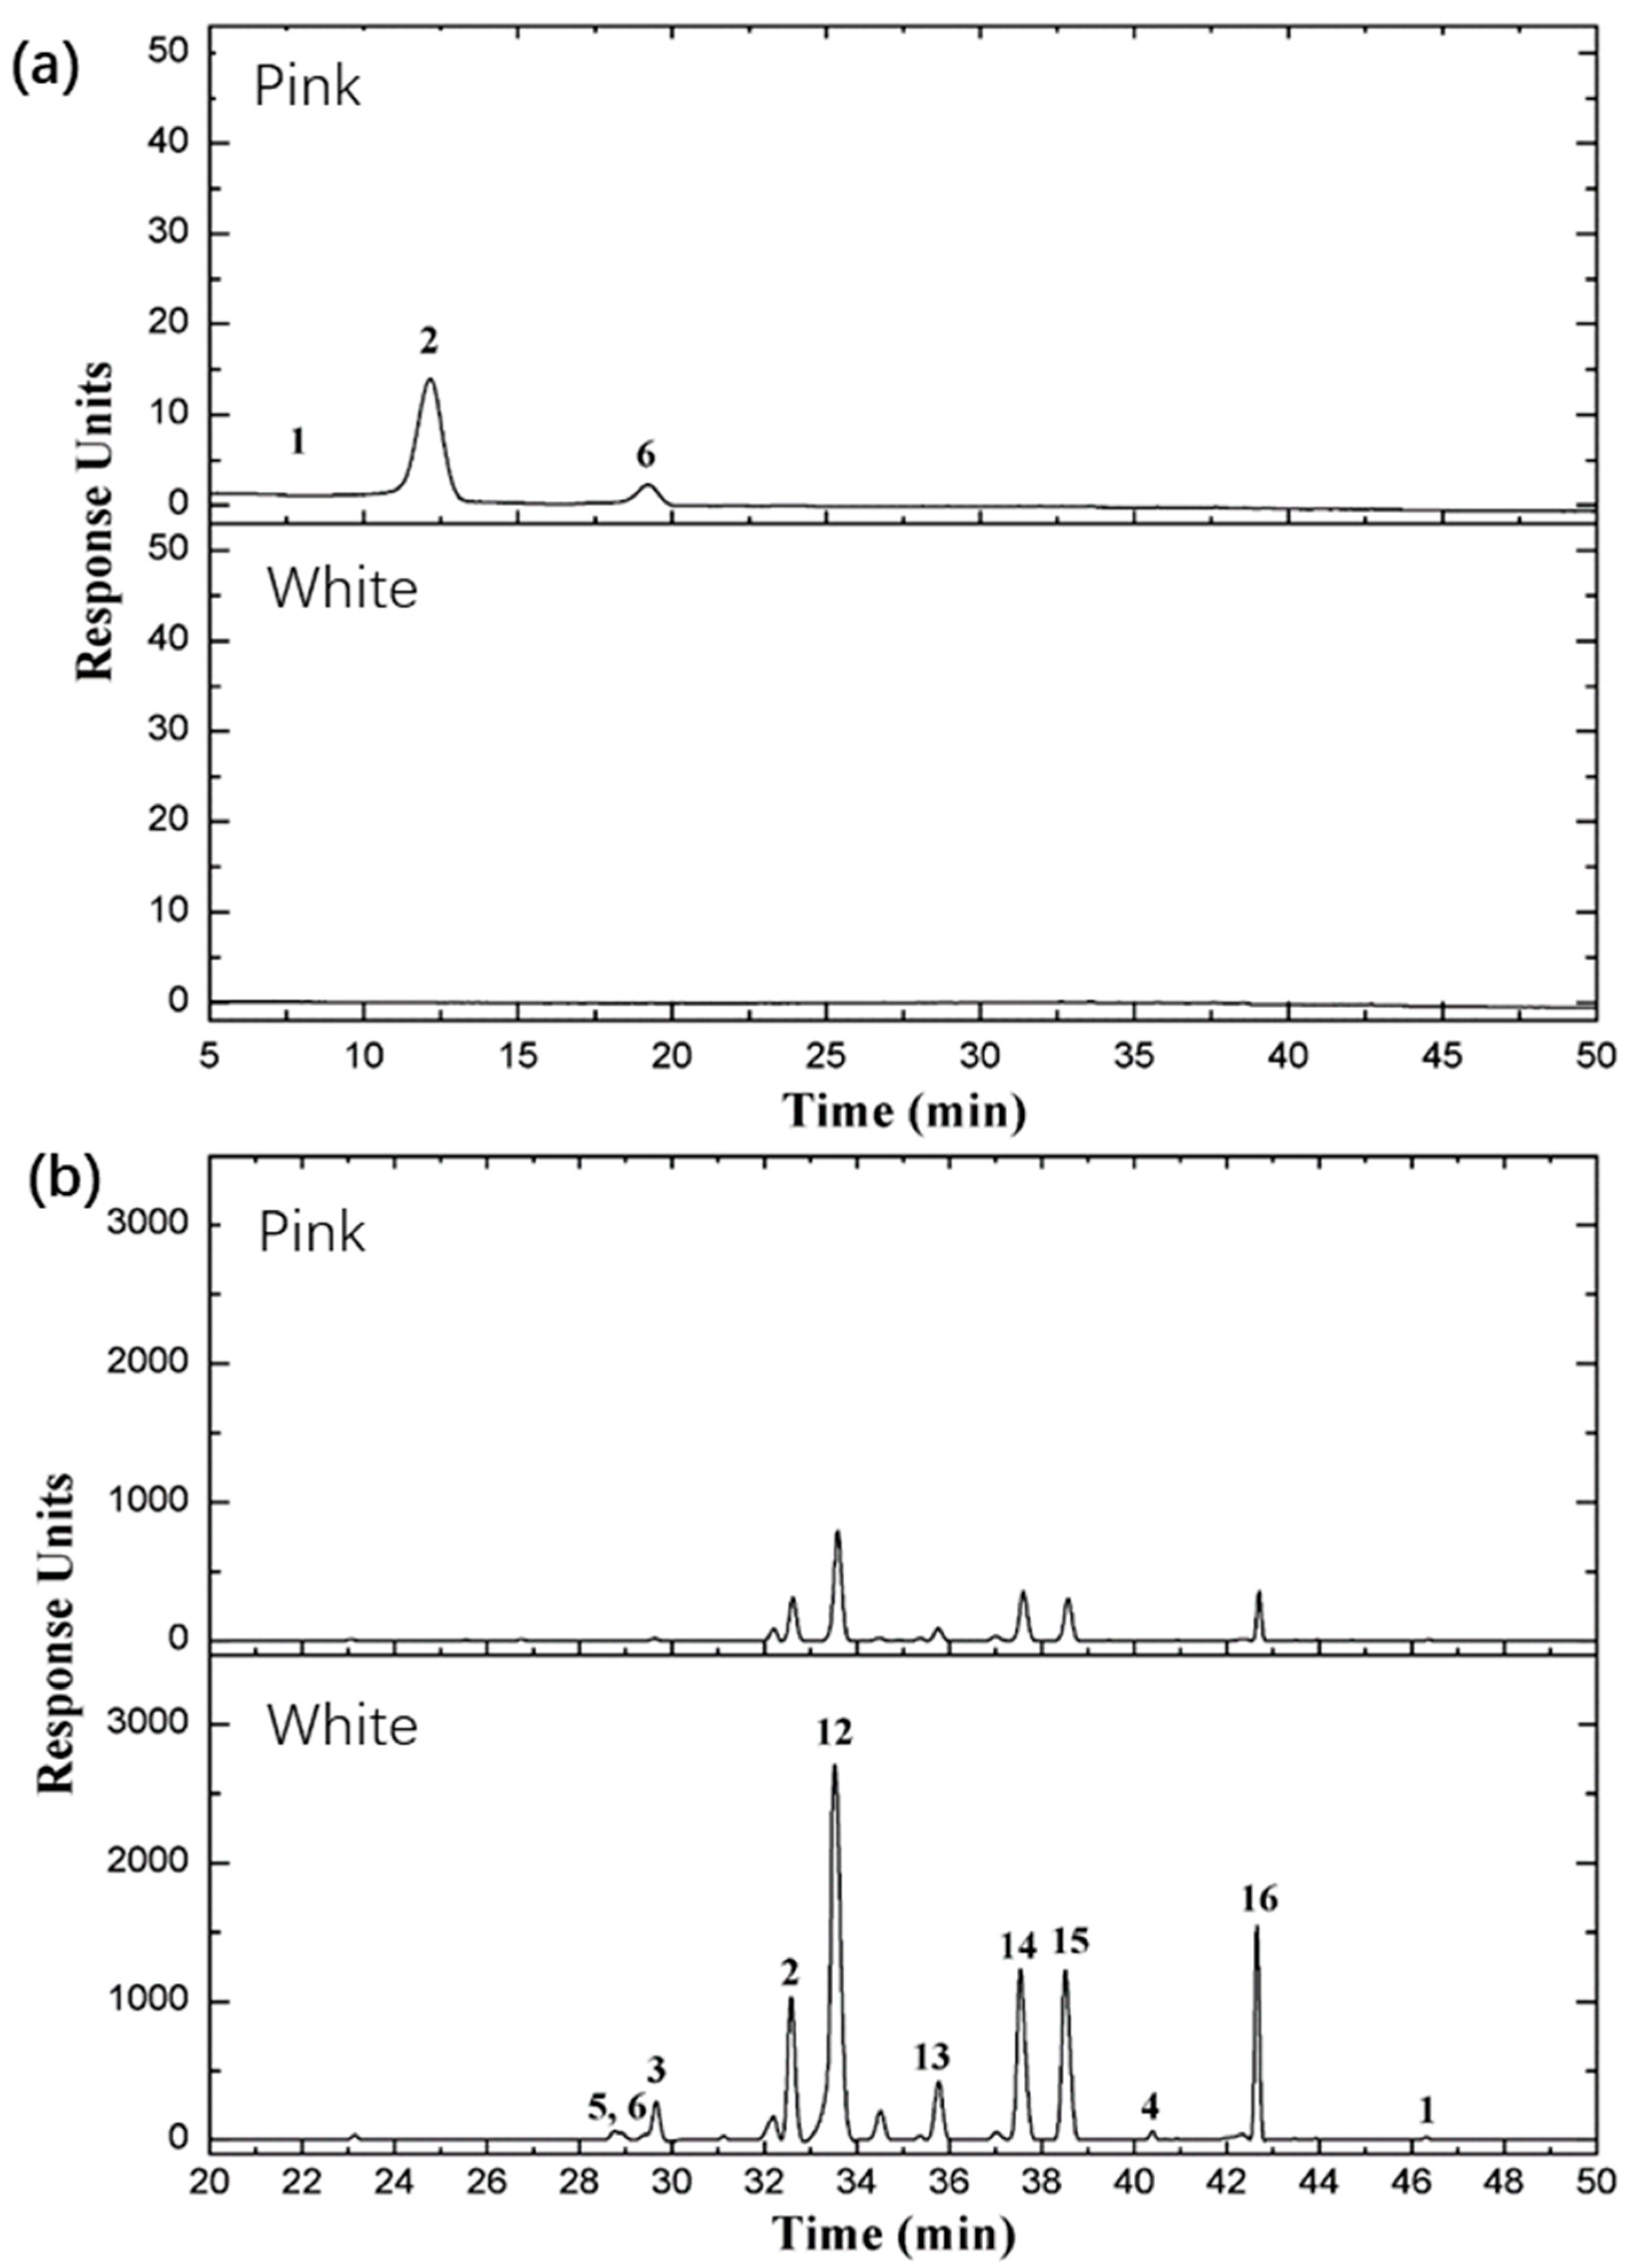
2.7. Major Classes of Flavonoids and Anthocyanins in the Two Rose Varieties

As transcription levels revealed, the biosynthesis and accumulation of flavonoids and anthocyanins are different between the two rose varieties. To discuss the correlation between transcription and metabolites, we examined the accumulation of flavonoids, anthocyanins, and procyanidin in rose petals in this study. The results showed that five anthocyanin derivatives and two procyanidins were detected and identified, including pelargonidin, cyanidin, peonidin, procyanidin B1, and proanthocyanidin, and 16 flavonoids were detected and identified, including kaempferol, quercetin, rutin, hyperoside, (−)-epicatechin, (+/−)-catechin hydrate, and multiflorin A. The differential accumulation of flavonoids and anthocyanins in the petals of two rose varieties is illustrated in Figure 5, and the relative abundance of these metabolites is shown in Table 4. These findings indicate that the rose varieties exhibited a wide variation of pigments in their petals, including cyanidin, peonidin, and pelargonidin, as well as other pigments; pelargonidin 3,5 diglucoside and pelargonidin 3-glucoside were the main pigments in the petal of Rosa ‘Margo Koster’, and a small quantity of cyanidin 3,5-diglucoside and peonidin 3,5-diglucoside were detected in Rosa ‘Margo Koster’ (Table 5, Figure 5). By contrast, neither anthocyanins nor their derivatives were detected in the petal of Rosa ‘White Margo Koster’, but the relative flavonol content was higher in white petals than in pink petals, and their glycosylated derivatives included kaempferol-3-glucoside, kaempferol-3-rhamnopyranoside, and quercetin-3-glucoside. These results suggest that the accumulation of anthocyanins is the main cause of the different phenotypes observed in the two studied rose varieties and corresponds with the observed transcriptional variation. The results also confirm that the accumulation pattern of secondary metabolites mostly correlates with the transcription level of candidate genes in the biosynthesis pathway.

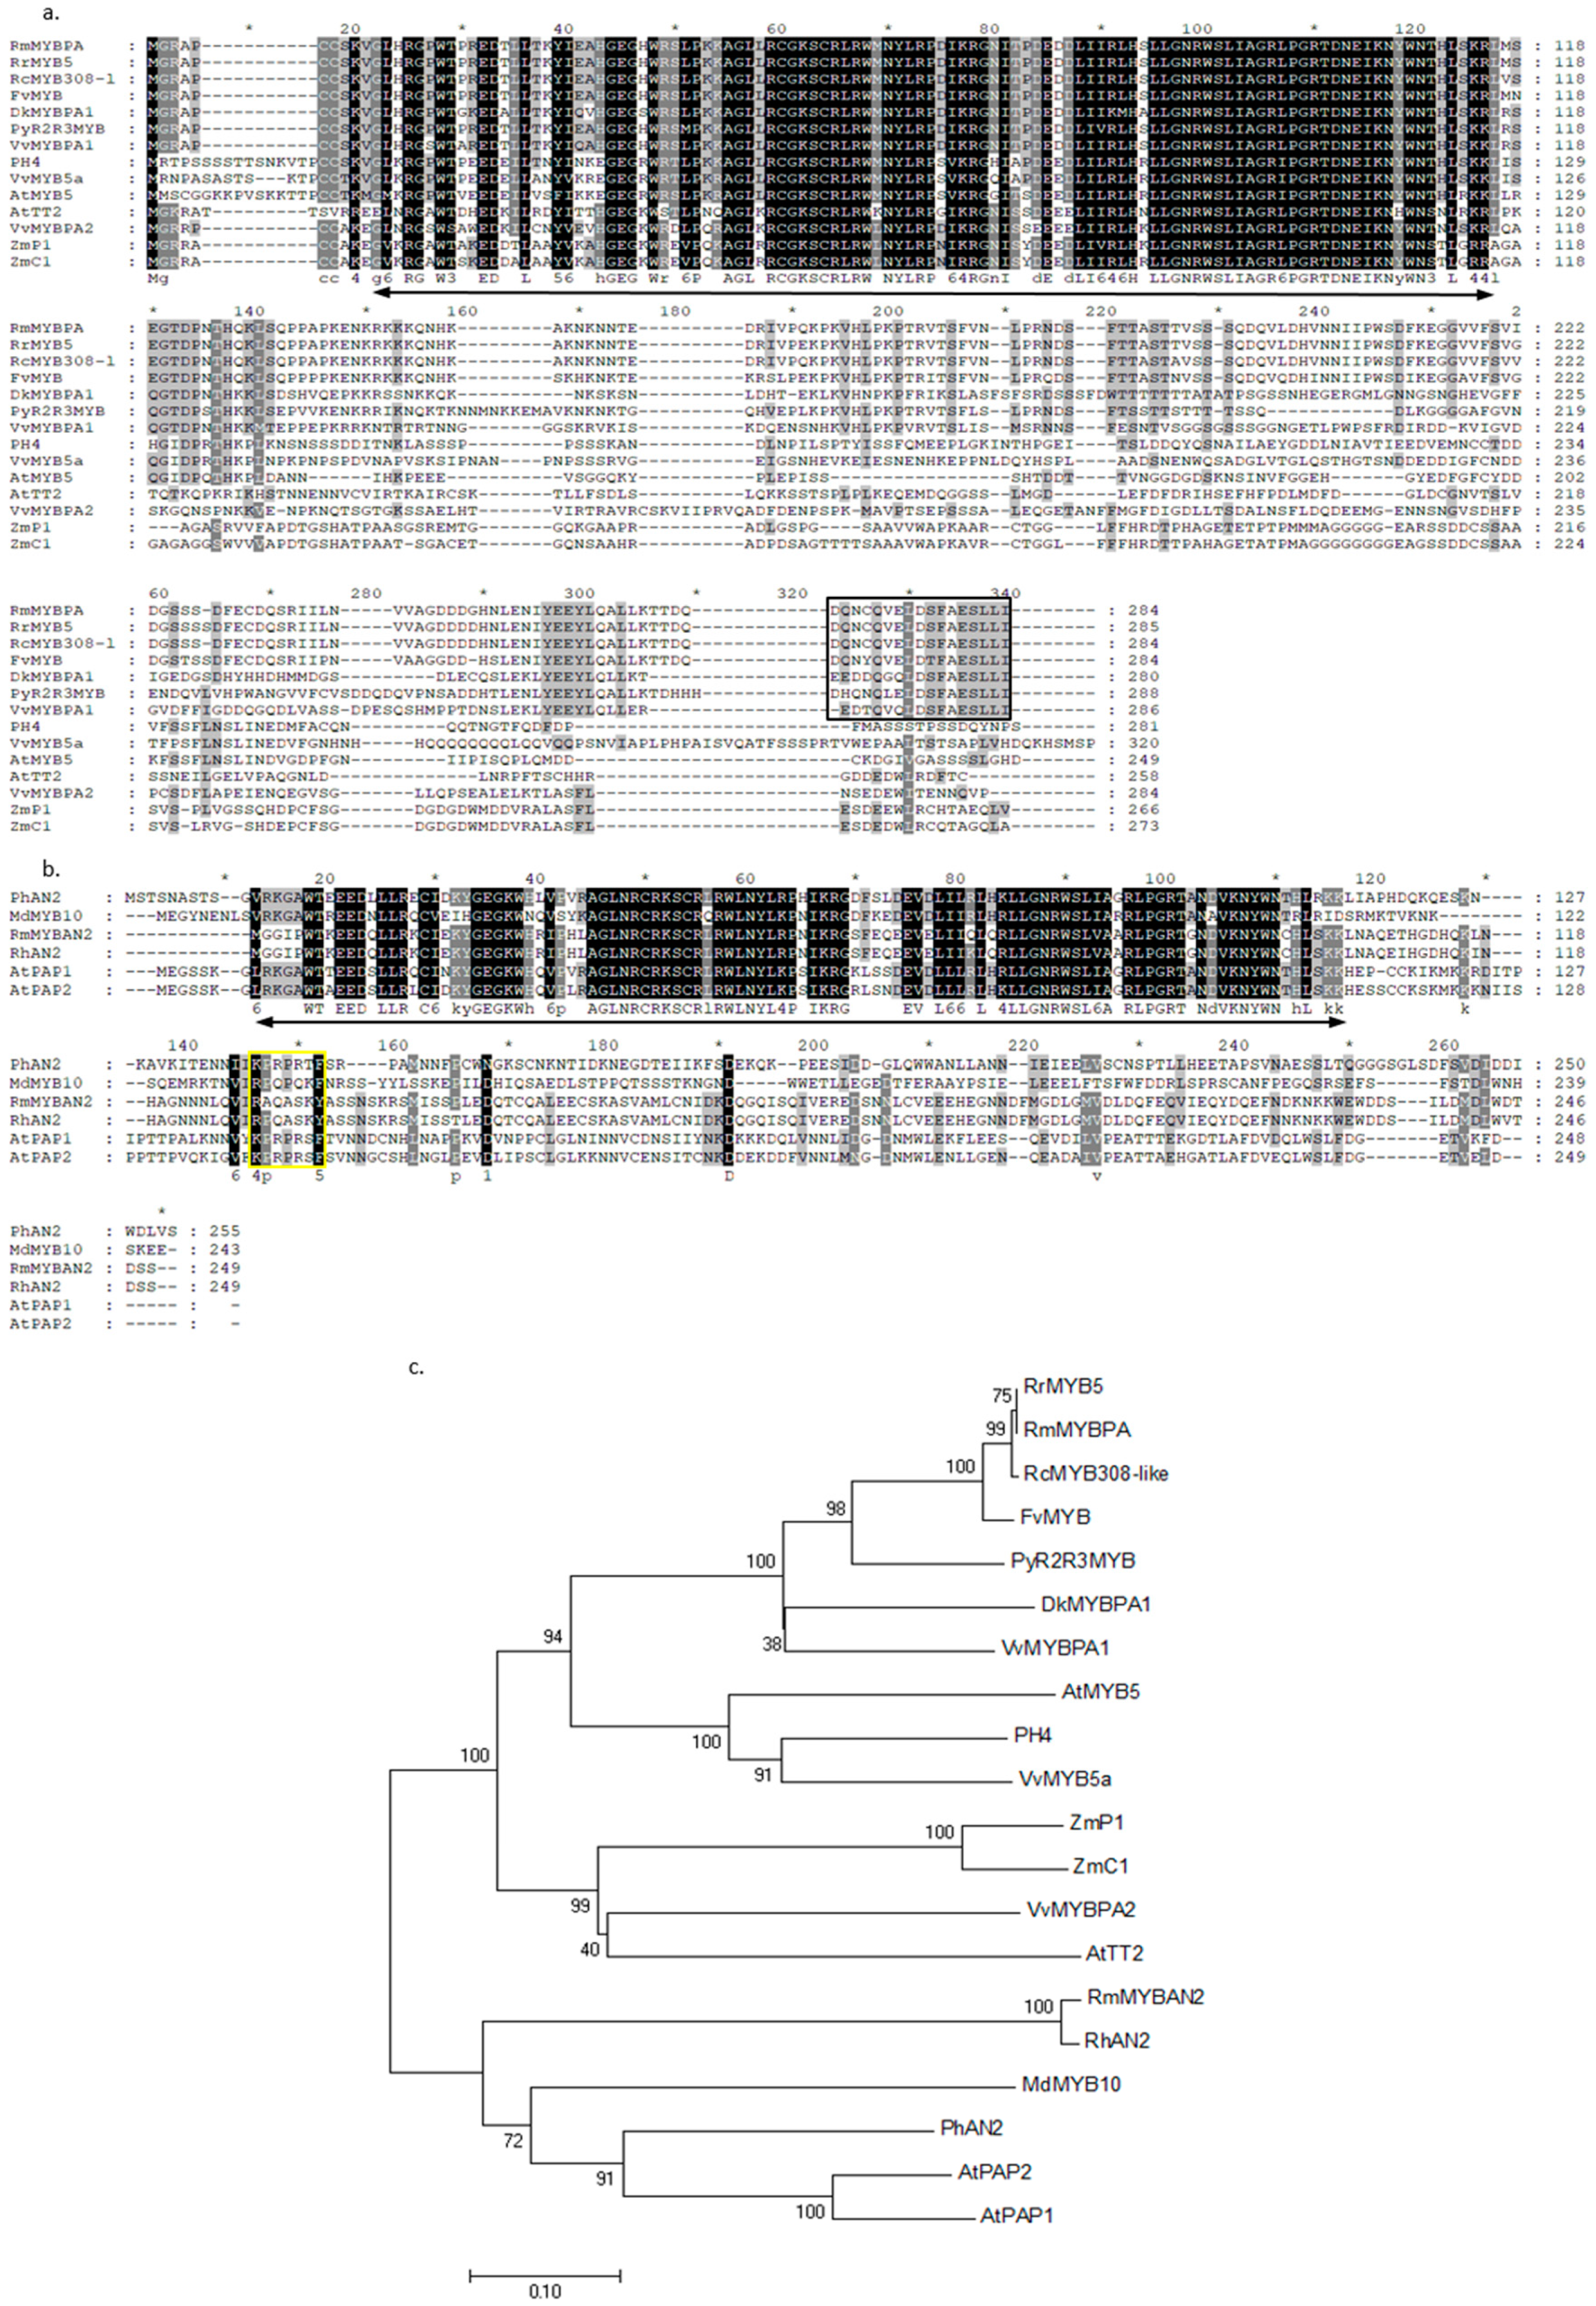
2.8. Alignment of Deduced Amino Acid Sequences of Two R2R3-MYB TFs

Members of the MYB protein superfamily contain one or several conserved MYB DNA-binding domains. In plants, the predominant family of MYB proteins is the R2R3-type, which is characterized by two repeat MYB domains, and previous reports have indicated that R2R3-MYB genes are involved in many aspects of secondary metabolism, as well as the identity and fate of cells in plants [42,43]. A total of 339 transcripts were predicted as MYB TFs by iTAK. In the DEGs, we found that two full-length transcripts named RmMYBAN2 and RmMYBPA, which encoded 249 and 284 amino acids, respectively, showed different expression levels in the flowers of two rose varieties. Alignments of amino acid sequences showed that the region of R2R3 repeats was highly conserved in plants, but that the downstream region was divergent regarding sequence and length. A part of this motif, [K/R]Px3[K/T][F/Y], which was found in the RmMYBAN2, is thought to be a conserved in the AN2 subgroup, according to a previous report [44]. Based on full-length amino acid sequences, a phylogenetic tree is illustrated in Figure 6c. These results indicate that RmMYBAN2 clustered to an AN2 subgroup, and RmMYBPA clustered to another group which is involved in regulating the biosynthesis of procyanidin, including TT2-like protein and PA-specific regulator [45]. In the RmMYBPA sequence, we cannot find the short motif KAx[K/R]C[S/T], which was conserved in the C1 subgroup [46]. These results indicate that RmMYBPA does not belong to the C1 subgroup. However, the alignment results showed that the RmMYBPA protein has the typical features of plant MYB TFs, and its C-terminal protein also had a high similarity to PA-related regulators [47].

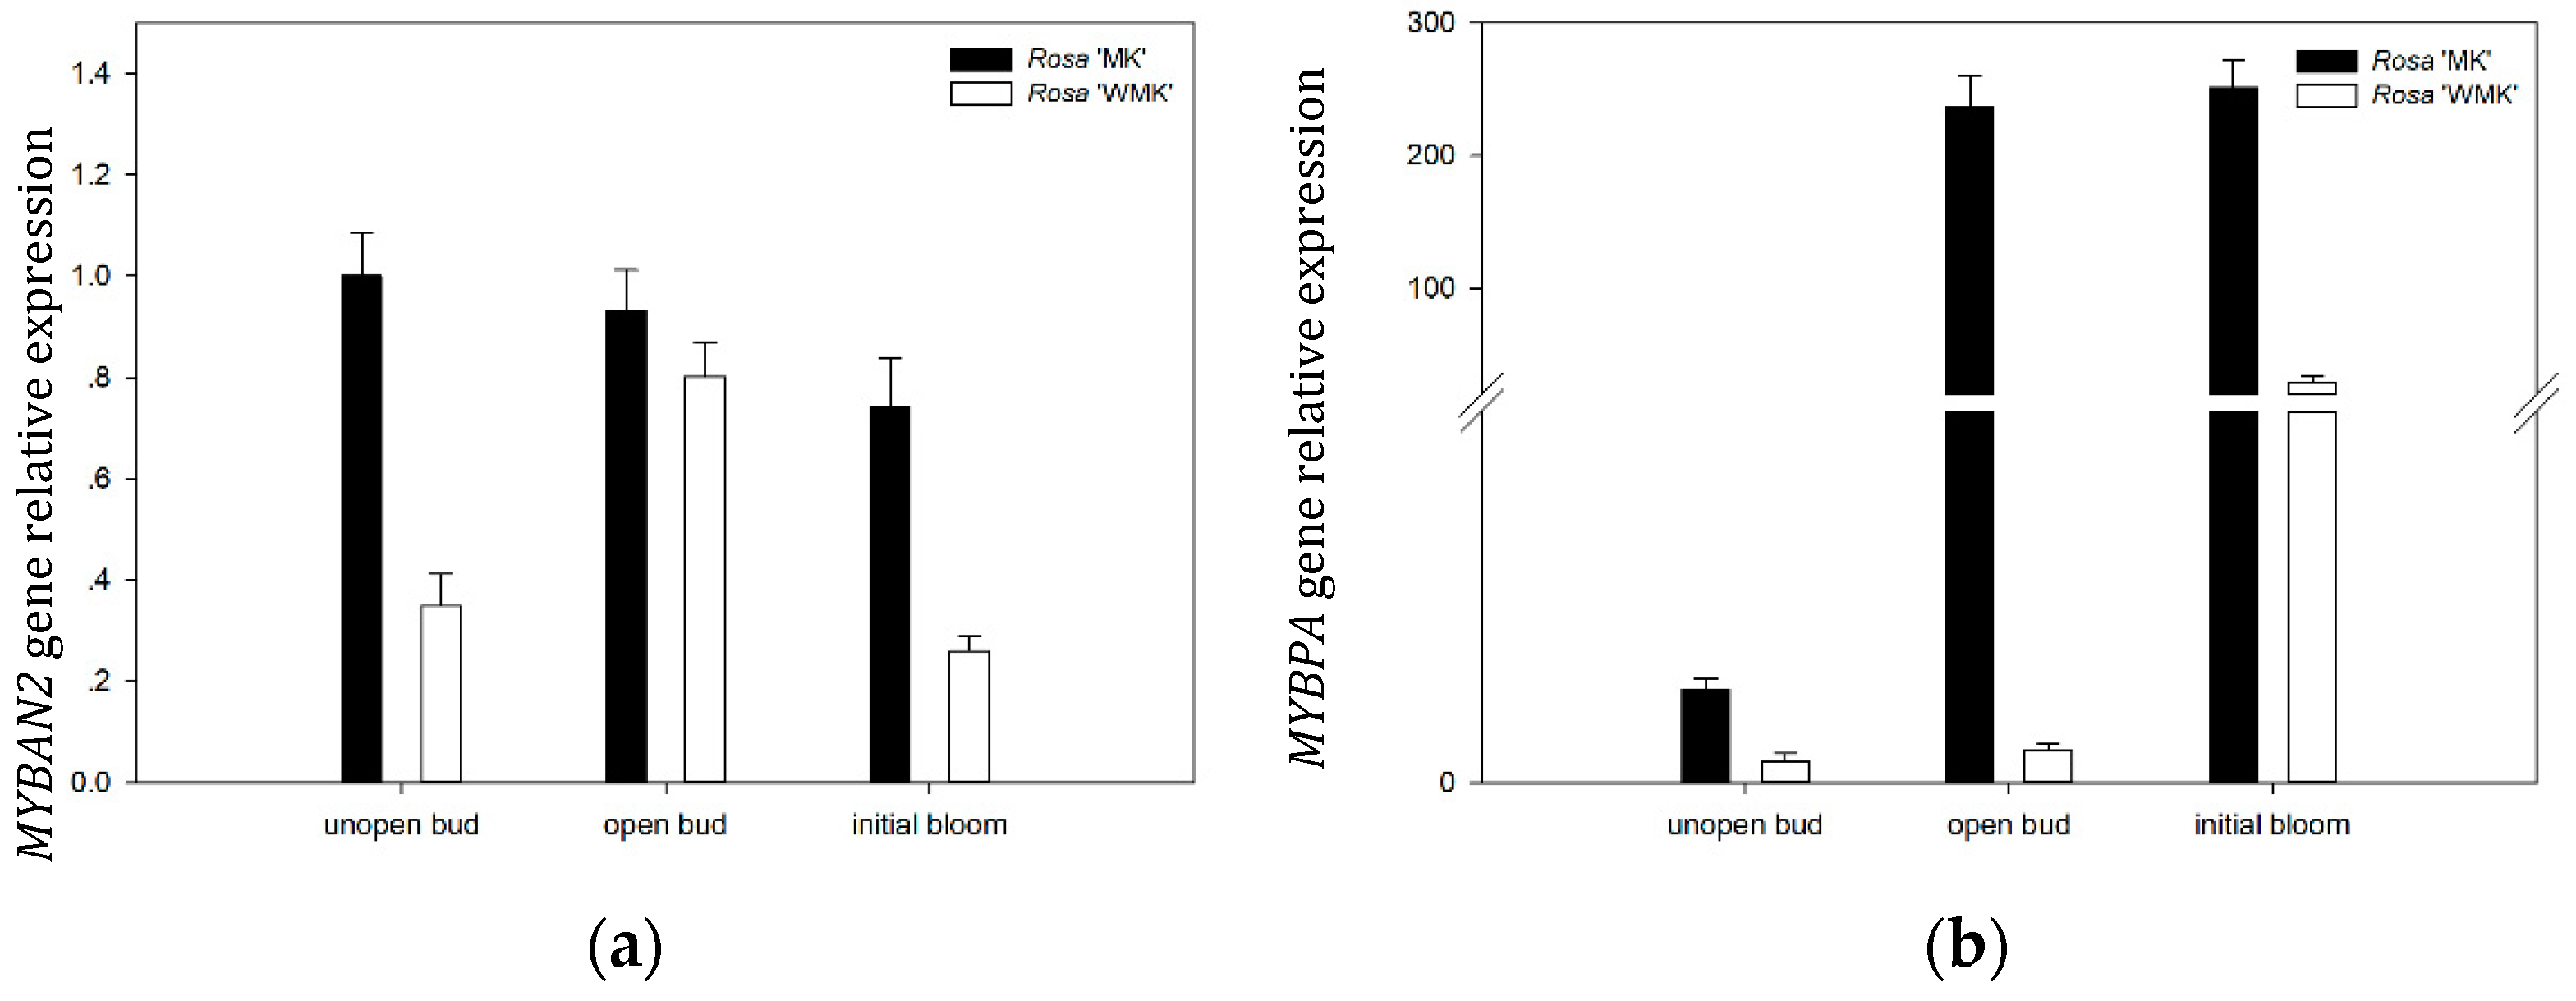
2.9. Expression Patterns of Two R2R3-MYB TFs During Flowering

To understand the gene expression pattern of RmMYBAN2 and RmMYBPA during flowering in two rose varieties, we investigated the transcription levels of RmMYBAN2 and RmMYBPA at three developmental stages by qRT-PCR, and RhACTIN was chosen for the normalization of gene expression. The results showed that the gene expression level of RmMYBAN2 in Rosa ‘Margo Koster’ was higher than that in Rosa ‘White Margo Koster’ at unopen bud and initial bloom stage (Figure 7a). For the RmMYBPA, its expression level in Rosa ‘Margo Koster’ rapidly increased and remained stable after unopen buds stage, and subsequently, its expression levels in Rosa ‘White Margo Koster’ were always low and remained stable before the initial bloom, and the expression levels of Rosa ‘Margo Koster’ during flowering were higher than Rosa ‘Margo Koster’ (Figure 7b).

3. Discussion

3.1. Hybrid Sequencing Strategy Provides More, Better-Quality Information

New sequencing techniques have emerged during the last 10 years when NGS and SMRT were commercialized in different platforms. The hybrid strategy of RNA sequencing has previously been applied to study the secondary metabolite pathway in medicinal plants [28,48,49]. As we know, RNA sequencing using NGS has been extensively applied to rose studies [1,2,31,34], and in these reports, the average length of transcripts in assembled reads is no more than approximately 1.5 kb. In this study, the average length of transcripts was over 2.5 kb, which was much higher than the average length in previous reports using NGS sequencing. Longer transcripts can provide complete coding sequences of functional genes and contribute to improving the accuracy of gene functional annotation. Over 98% of transcripts have been annotated in the main database, which benefits from long reads. Nevertheless, the combination of sequencing approaches of both sets of data—correcting the SMRT reads using NGS reads—was used to obtain high-quality full-length transcripts of flower tissue in the opened stage. Additionally, SSR markers are also important tools for population genetic analysis and the construction of linkage mapping in roses [10,11,12], but in plants, the development of SSR markers in roses is neither highly efficient nor cheap. Recently, over 12,000 genomic and 2000 EST–SSR markers have been developed and identified by NGS technology in Rosa hybrids [2]. In addition to mononucleotides, over 40,000 candidate SSR sites, which are a great supplement for rose molecular markers, were found in our transcript pool. These candidate sites are informative and will be useful for fundamental research in roses, although they still need to be identified through classical PCR experiments or further bioinformatics analysis. However, this also indicates that the discovery efficiency of molecular markers using hybrid sequencing is also high in roses.

3.2. Differential Expression of Genes in the Petal of Two Rose Varieties

The pathways controlling petal color are well characterized in angiosperm plants [16], and the flower pigment in roses is reviewed [5]. Thus, gene modification has been demonstrated to be an effective way to change the flower color in rose; however, this trait is also affected by other environmental factors, such as vacuolar pH or co-pigments [50,51]. Regulation of metabolite flux towards a specific pathway is also an interesting and challenging problem in rose because of the wide genetic variation. It should also be taken into consideration that both of the studied varieties are almost isogenic compared to each other. Most DEGs in the pigment biosynthetic pathway are the consequence of, or reason for, phenotype variations. Hence, the DEGs of the flavonoid and anthocyanin pathway were focused upon in this study, e.g., the expression levels of CHS, CHI, DFR, and LDOX in pink flowers were significantly higher than in white flowers; these genes are correlated with the accumulation of anthocyanin in model plant species. CHS is the first rate-limiting enzyme which catalyzes to synthesized tetrahydroxy-chalcone, in the flavonoid biosynthesis. Lower expression of CHS will inhabit anthocyanin biosynthesis and result in a change of plant tissues [16,17]. Dihydroflavonol 4-reductase is considered a critical enzyme that functions later during anthocyanin biosynthesis [52,53]. It reduces dihydroflavonols to leucoanthocyanidins, and promotes the flavonoid to anthocyanin pathway, and then, ANS will convert colorless leucoanthocyanidins to colored anthocyanin, resulting in pigment accumulation. The expression level of these genes in our study indicates that the flavonoid can convert to colored anthocyanin in pink flower rather than white flower, owing to the high expression level of DFR, ANS, and other genes in the downstream pathway. Flavonols are a class of flavonoids which are important in plant development and UV defense, and their biosynthetic pathway is one of the branches of the flavonoid biosynthetic pathway. Flavonol synthase is an enzyme that catalyzes the conversion of dihydroflavonol to flavonol [54], resulting in the biosynthesis of colorless flavonol. In the white flower, a greater flow of flavonoids into the flavonol biosynthesis pathway is observed and the expression level of FLS is also higher than that of the pink flower. It might be related to the accumulation substrate. The accumulation of flavonol may be affected by the transcription regulator or other associated genes in the flavonol pathway [55,56,57,58]; however, the expression levels of flavonol-related regulators showed no difference between the two rose varieties.
Additionally, an MYB regulator named RmMYBAN2 was found, which belongs to the R2R3-MYB gene superfamily involved in the regulation of anthocyanin biosynthesis [59]. Further analysis revealed that RmMYBAN2 belongs to the AN2 subgroup, which contains a conserved motif [K/R]Px3[K/T][F/Y], and this type of anthocyanin-related MYB TF is not divergent in reported dicot species [60]. It always co-infiltrated and interacted with TRANSPARENT TESTA, and activated the promoters of DFR and ANS in tobacco [61]. In this study, similar expression patterns of related genes were observed in pink rose during flowering. Then, another MYB TF named RmMYBPA, which is also a typical R2R3-MYB TF, but RmMYBPA does not belong to AN2 subgroup or C1 group. The result of homologous sequence analysis indicates that it may be orthologous, but a little divergent from the TT2-type, which participates in PA biosynthesis by activating the ANR and LAR genes in Arabidopsis, grape, and persimmon [62,63,64,65,66,67,68,69]. RmMYBPA protein is more similar to VvMYBPA1 and DkMYBPA1, these MYB TFs also control expression of the PA biosynthesis genes, including ANR and LAR, but it does not contain a conserved C-terminal motif [47,68].

3.3. Differential Accumulation of Flavonoid in Two Rose Varieties

Flowering plants show a wide range of variation in their floral, foliage, and fruit colors because of an abundance of genetic variation and diverse environments. Previous reports show that this is due to the flexible flux of the flavonoid pathway and diverse regulation mechanisms, and the accumulation and composition of anthocyanin determine the scheme and density of flower color [70]. Previous reports have shown that pelargonidin is responsible for the orange to red color [15,71]. In this study, the findings indicate that pelargonidin and its derivatives are major pigments in pink flowers. Conversely, the main flavonoid in white flowers is flavonol, which is important in the response to abiotic stresses in plants [72]. However, the type of flavonol hardly differentiates between the two rose varieties, and we also found that flavonols were present in pink rose, and the gene expression level of FLS was also kept stable during flowering; hence, its content should be stable as one of the co-pigments in flowers. Thus, the relative quantitative content of flavonols, e.g., quercetin-3-glucoside and kaempferol-3-glucoside, was higher in white flowers than in pink flowers. These results also suggest that the majority of flavonoids tended to be converted in the flavonol pathway in white flowers, this kind of imbalance distribution of the flavonoid pathway has been observed in core eudicot plants [73]. We conclude that the phenotype of white flower results in a lack of anthocyanin accumulation, which may result from the low expression of related genes, such as DFR and LDOX, and subsequently, most flavones are converted to flavonols by FLS (Figure 8).
We report profiling analysis of a hybrid RNA-seq and metabolites to investigate the different flower color of rose varieties and the associated expression patterns of flavonoid biosynthetic genes in pink and white roses. The results of these investigations showed a set of putative genes involved in the flavonoid biosynthesis pathway has been found, and the imbalance or competitive expression of DFR and FLS genes might determine the formation of flower color in the two rose varieties. In addition, two complete R2R3-MYB TFs were discovered and their sequences were analyzed and classified; however, their biological functions require more experimental proof.

4. Materials and Methods
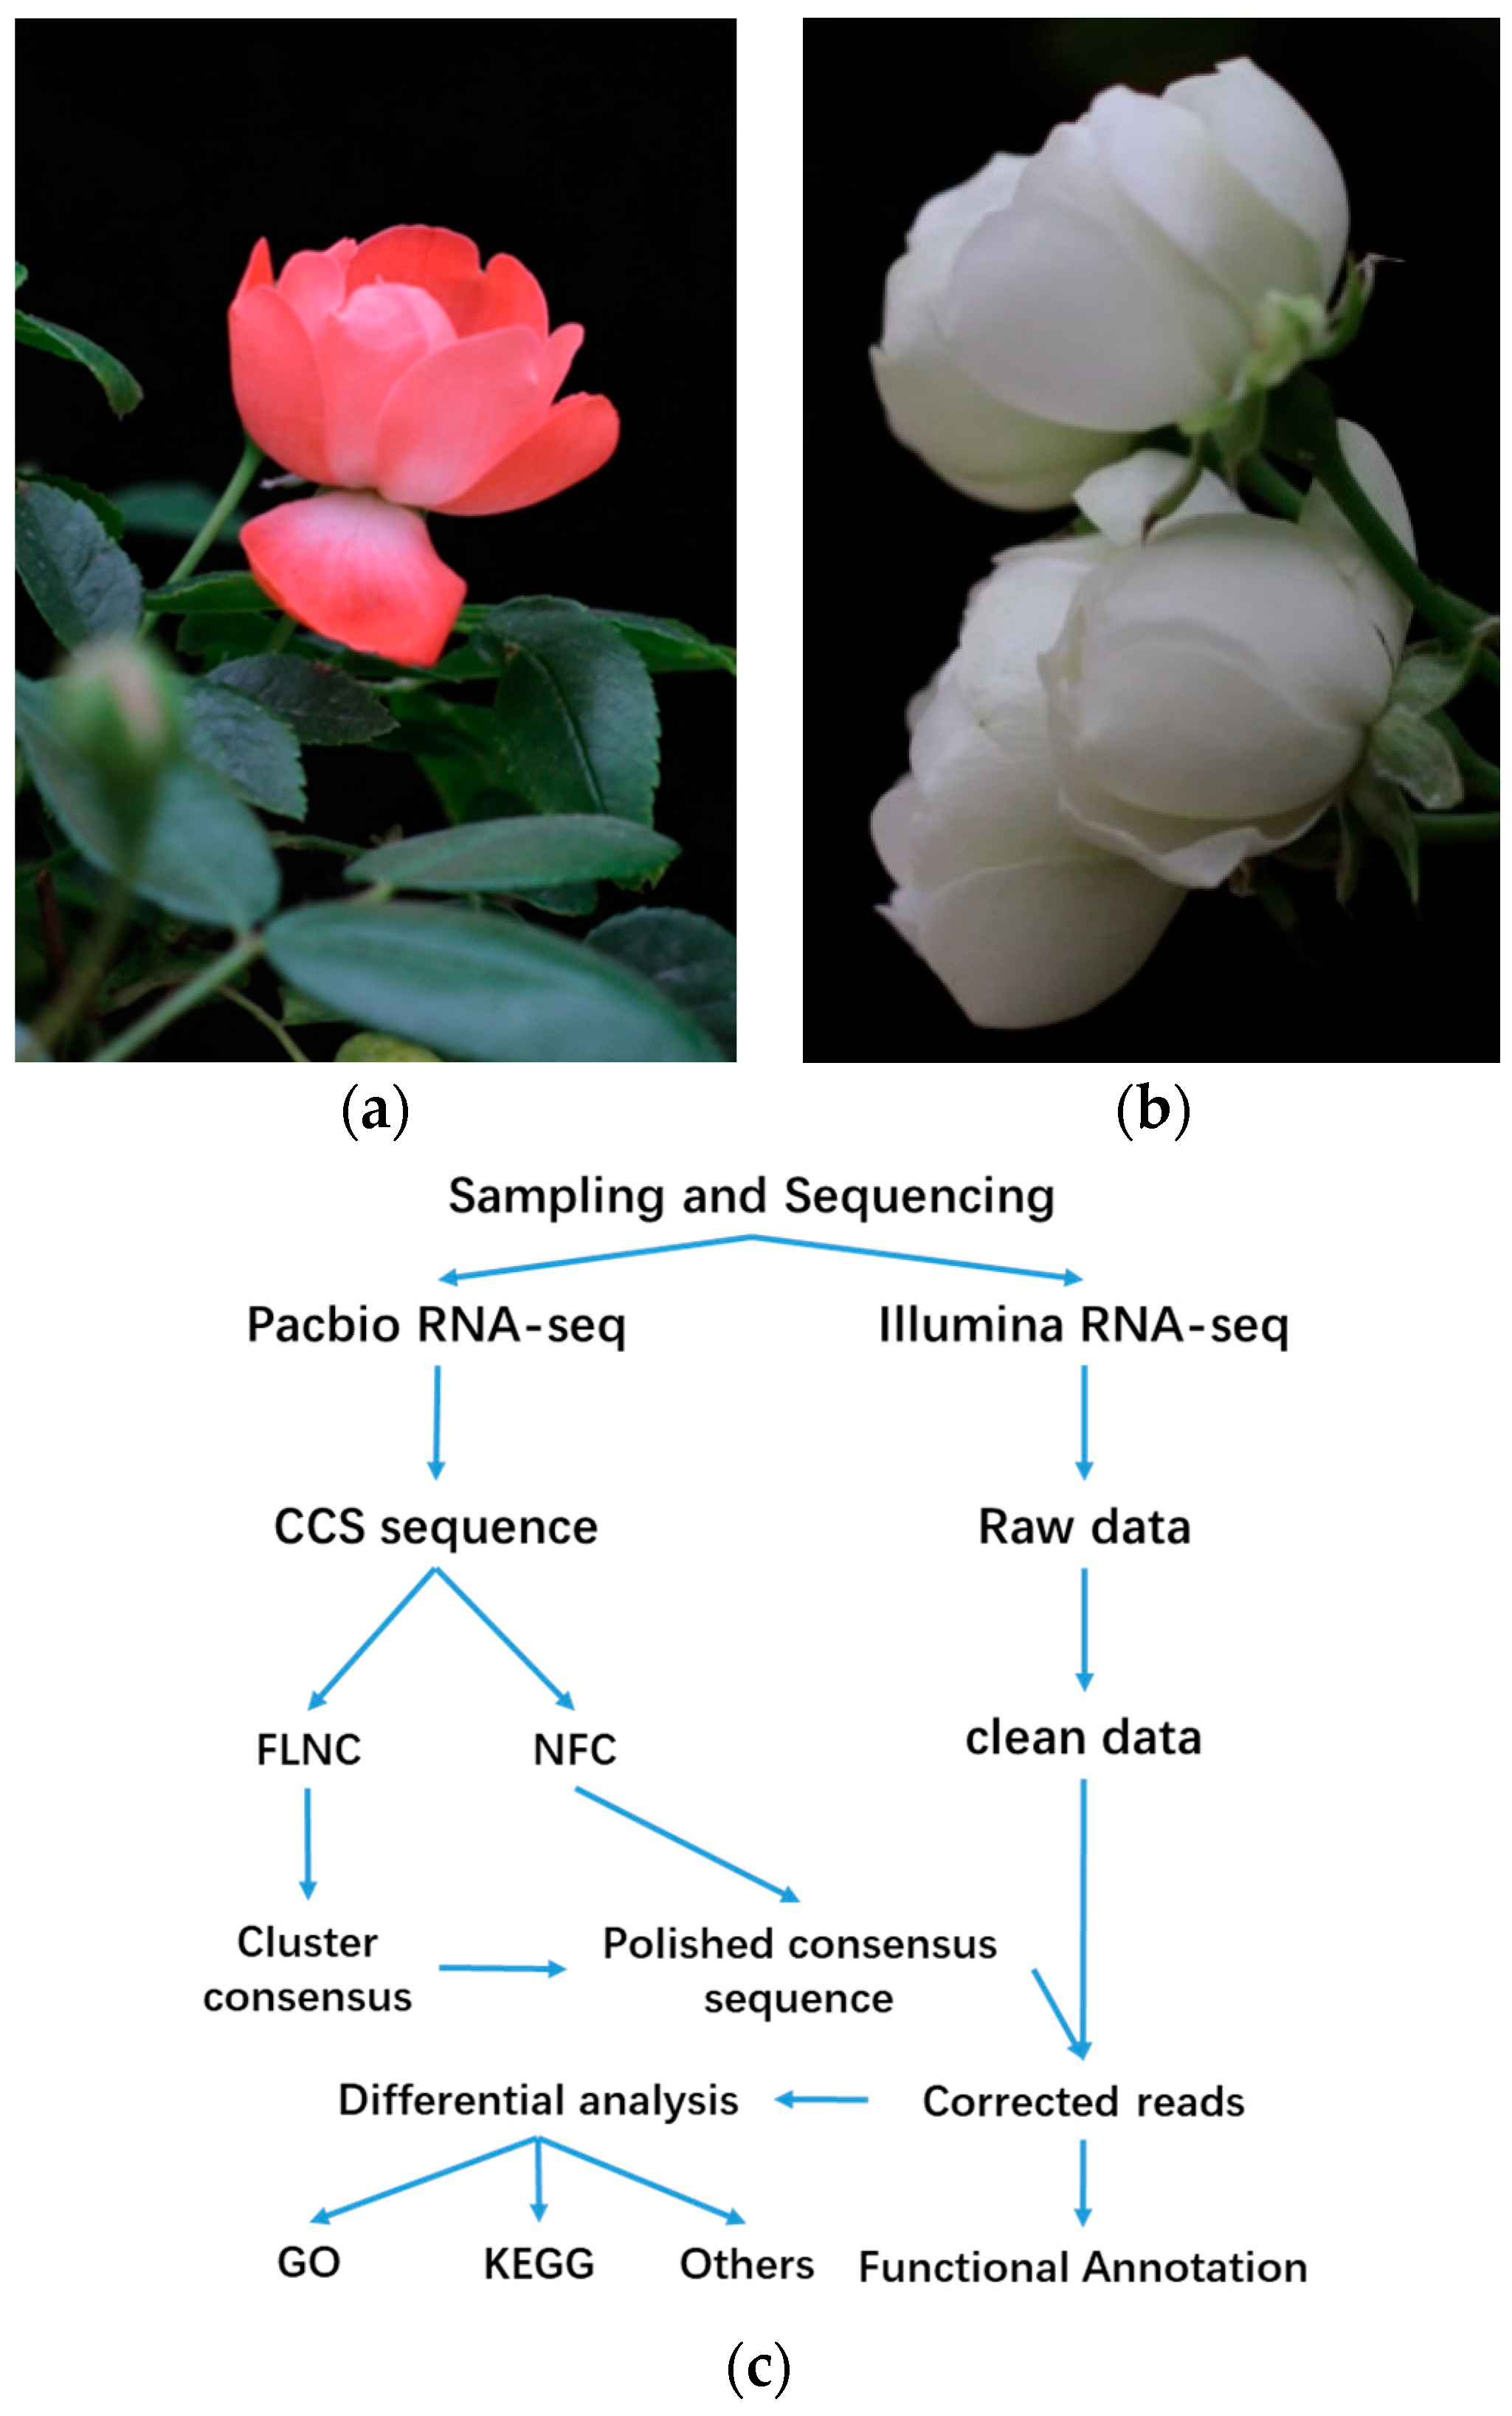
4.1. Plant Material

Rosa ‘Margo Koster’ is a kind of polyantha rose discovered by D. A. Koster (The Netherlands, 1935), and this cultivar originates from Rosa multiflora. Rosa ‘White Margo Koster’ is a somatic variant of Rosa ‘Margo Koster’, and its flower color was reversed from pink to white. Rosa ‘White Margo Koster’ was discovered by Viktor Teschendorff (Germany, 1939). Breeding records were obtained from a public website (www.helpmefind.com), and previous results of DNA profiling using SSR markers showed that these two varieties of rose have the same DNA fingerprints. Pot plants were grown in the greenhouse at the Chinese Academy of Forestry, Beijing, China. Petals of two varieties were collected at the blooming flower stage. Three biological repetitions of each variety were used for RNA sequencing on the NGS platform, and a mixture of petals from two varieties was used for RNA sequencing by the PacBio platform. Then, a mixture of six flowers from each variety was used for secondary metabolite analysis. Finally, petals of two varieties at three developmental stages—unopened bud, opened bud, and blooming flower—were used to verify gene expression differences via qRT-PCR. All the samples were immediately frozen in liquid nitrogen and then stored at −80 °C.

4.2. Identification and Quantification of Flavonoids and Anthocyanins in the Rose Petals

The procedures used to identify and quantify the anthocyanin and flavonoid compositions in the petals of both rose varieties were modified from a previously described method [74,75]. Briefly, 10 mg of lyophilized sample powder from each rose variety was extracted by 1 mL of a 0.1% acetic acid/methanol solution at 4 °C overnight. The samples were subsequently centrifuged for 10 min at 10,000 rpm, after which the supernatants were collected with a vacuum centrifuge concentrator (CV100-DNA, Aijimu, Beijing, China) for drying. The experimental materials were then stored at −20 °C. The dried extracts were redissolved in MeOH immediately prior to analysis, after which they were examined by a liquid chromatography quadrupole time-of-flight mass spectrometer (Q-TOF-MS, 6520 series classic G6520B) with a 1200 series HPLC instrument (Agilent Technologies, Palo Alto, CA, USA) as an electrospray ionization (ESI) source. The separation was carried out at 40 °C with a Thermo Scientific RP-C18 column (150 mm × 4.6 mm) that had a particle size of 55 µm. The gradient, which involved 0.1% formic acid (A) and acetonitrile (B) as the mobile phases, consisted of 0–4 min (5% B), 4–35 min (5–20% B), 35–55 min (20–50% B), 55–60 min (50–75% B), 60–62 min (100% B), 62–67 min (100% B), 67–68 min (5% B), and 68–73 min (5% B) segments. Operating conditions were as follows: A flow rate of 1.0 mL·min−1, positive ESI mode, capillary voltage of 3.0 kV, and 16 L·h−1 of nebulization nitrogen flow.
The compounds in the sample extracts were identified by comparison with the retention times of standards. Characteristics of the UV–Vis spectra of peaks and the mass spectrometric information were analyzed with MassHunter Qualitative software (Agilent, USA). The relative content of anthocyanins and flavonoids was calculated from the peak areas of the samples based on the intensity of the corresponding standard compounds, including kaempferol, quercetin, rutin, quercetin-3-glucoside, kaempferol-3-rutinoside, cyanidin, pelargonidin, cyanidin-3-rutinoside, pelargonidin-3,5-diglucoside, and proanthocyanidin B1, as well as proanthocyanidin. For compounds lacking corresponding standards, quantification was performed using similar compounds.

4.3. RNA Extraction, NGS Library Construction, and Sequencing

Total RNA was extracted using an mRNA Isolation Kit in accordance with the manufacturer’s protocol. RNA integrity was evaluated using an Agilent 2100 Bioanalyzer (Agilent Technologies, Santa Clara, CA, USA). The samples whose RNA integrity number (RIN) ≥7 were subjected to subsequent analyses. The libraries were constructed using a TruSeq Stranded mRNA LT Sample Prep Kit (Illumina, San Diego, CA, USA) in accordance with the manufacturer’s instructions. Double-stranded RNA-complementary DNA (cDNA) was synthesized using a SuperScript II Double-Stranded cDNA Synthesis Kit (part#18064014, Invitrogen, CA, USA) and random hexamer primers. The cDNA fragments were subjected to purification, end repair, and ligation to sequencing adapters. The ligation products were purified with magnetic beads and separated by agarose gel electrophoresis. A range of cDNA fragments (200  ±  25 bp) were excised from the gel and selected for PCR amplification as templates. These libraries were then sequenced on an Illumina sequencing platform (HiSeq2500), and 125 bp paired-end reads were generated.

4.4. Library Preparation and PacBio RSII Sequencing

The cDNA sample from mixed petal comprising both varieties was constructed for use in building a SMRT sequencing library. Three different libraries, each consisting of a cDNA insert size of <2 kb, 2–3 kb, and 3–6 kb, were prepared in accordance with the SMRT sequencing protocol using a Clontech SMARTer PCR cDNA Synthesis Kit and the BluePippin Size Selection System protocol as described by Pacific Biosciences (PN 100-092-800-03). These libraries were then sequenced on a PacBio RSII sequencing platform.

4.5. Data Analysis of the Sequencing Results

Single-molecule real-time sequencing data were processed using SMRTlink 4.0 software. To resolve the high error rate of sub-reads, all SMRT sub-reads were corrected using the more than 300 million HiSeq reads as input data by proovread [76]. After removing the redundant sequences, all SMRT sub-reads were processed by CD-HIT-EST [77], and the full-length transcripts served as reference unigenes for subsequent analyses. Gene functions were annotated based on a series of nucleotide and protein databases, including the NCBI non-redundant protein sequence, the NCBI nucleotide sequence, the Protein Family (Pfam), euKaryotic Orthologous Groups (KOG), Swiss-Prot, KEGG, Gene Ontology (GO) databases and Rosa chinensis genome (assembly RchiOBHm-V2). Plant transcription factors were predicted using iTAK software [78]. All full-length transcripts were searched for the detection of SSRs by MISA (MIcroSAtellite) using default parameters. A minimum of five repetitions was considered as search criteria in the MISA script for identification of mono-to hexanucleotide motifs.
Clean data were filtered from the raw NGS sequencing data, after reads with adaptors of low quality and with unknown nucleotides (>5%) were removed. The clean data were then assembled de novo into transcripts using the Trinity platform (http://trinityrnaseq.sourceforge.net/); these transcripts were then mapped to reference unigenes via RNA-seq by expectation maximization (RSEM) [79], and the read count numbers of all genes were calculated and translated to FPKM (Fragments Per Kilobase Million) gene values [80]. The DEGs were identified by DESeq, and in addition, the uni-transcripts with a padj < 0.05 were screened [81], we also selected a set of targeted transcripts by manual screening, according to the log2(fold-change) >1 or <0.5. Then, we performed a GO enrichment analysis using Goseq [82]. The KEGG enrichment analysis was performed by KOBAS (2.0) [83].

4.6. qRT-PCR Validation and Expression Analysis

RNA samples were isolated from petals of both rose varieties at three different developmental stages (unopened bud, opened bud, and fully open flower). Reverse transcription was performed with a PrimeScriptTM Reverse Transcriptase Reagent Kit with a gDNA Eraser (TaKaRa, Code NO. RR047A, Shiga, Otsu, Japan). Specific primers of target genes were designed with Primer-BLAST (https://www.ncbi.nlm.nih.gov/tools/primer-blast/), and the size of qRT-PCR products ranged from 100 to 200 bps—information for each of the primer pairs can be found in Table S2. The qRT-PCR analysis was performed in triplicate using TB GreenTM Premix Ex TaqTM II (TaKaRa, Code NO. RR820Q, Shiga, Otsu, Japan) by the StepOne Plus Real-Time PCR System (Applied Biosystems). PCR amplification was performed in a volume of 20 μL, and the program was 95 °C for 30 s, and 40 cycles of 95 °C for 5 s and 60 °C for 30 s. PCR efficiencies and Cq of each target gene were determined by LinRegPCR; Cq is the PCR cycle at which the amplification curve crosses the threshold [84]. Relative quantification of specific mRNA levels was performed using the delta–delta method (ratio = 2−ΔΔCq) for quick estimation of gene expression difference [85], and the gene expression level of Rosa ‘Margo Koster’ at the unopened bud stage was set as the control group. The relative quantifications of target genes were normalized according to two internal reference genes, ACTIN and GAPDH. Finally, the former was used for final relative quantification.

Supplementary Materials

The following are available online at https://www.mdpi.com/2223-7747/8/8/267/s1, Supplemental Figure S1: Type and number of predicted transcription factors (TFs) by iTAK. Supplemental Figure S2: Gene function classification of full-length transcripts in rose variety by GO term. Supplemental Figure S3: Gene function classification of full-length transcripts in rose variety by KOG. Supplemental Figure S4: Gene function of full-length transcripts in rose variety by KEGG database. Supplemental Figure S5: Raw Cq data of qRT-PCR. Supplemental Table S1: Full-length transcripts of isoforms involved in pigment biosynthesis in rose flowers. Supplemental Table S2: Primer sequences information used in qRT-PCR. Supplemental Table S3: PCR efficiency of each mRNA from preliminary qRT-PCR. Supplemental File S1: List of DEGs between Rosa ‘Margo Koster’ and Rosa ‘White Margo Koster’. Supplemental File S2: Qualification and annotation of all expressed genes in two libraries. Supplemental File S3: Primers information of candidates SSR markers.

Author Contributions

Conceptualization, P.H. and Y.Z.; data curation, P.H.; formal analysis, B.L.; funding acquisition, P.H. and Y.Z.; methodology, F.L.; writing-original draft, P.H.; writing-review and editing, F.L. and Y.Z.

Funding

This research was supported by Fundamental Research Funds for the Central Non-profit Research Institution of CAF, grant number CAFYBB2016QB007, and National Natural Science Foundation of China, grant number 31500538.

Acknowledgments

We thank Hui Zhang and Weihao Wang from the Institute of Botany, Chinese Academy of Science, for providing a helpful metabolite analysis and guide for performing qRT-PCR, respectively. We also thank the editors and reviewers for critically evaluating the manuscript and providing constructive comments for its improvement.

Conflicts of Interest

The authors declare no conflict of interest.

Availability of Data and Materials

The clean paired-end sequence and clean SMRT sequencing datasets were submitted to the NCBI Sequence Read Archive (SRA) under accession number SRP132317.

References

  1. Liu, X.; Cao, X.; Shi, S.; Zhao, N.; Li, D.; Fang, P.; Chen, X.; Qi, W.; Zhang, Z. Comparative RNA-Seq analysis reveals a critical role for brassinosteroids in rose (Rosa hybrida) petal defense against Botrytis cinerea infection. BMC Genet. 2018, 19, 62. [Google Scholar] [CrossRef] [PubMed]
  2. Qi, W.; Chen, X.; Fang, P.; Shi, S.; Li, J.; Liu, X.; Cao, X.; Zhao, N.; Hao, H.; Li, Y.; et al. Genomic and transcriptomic sequencing of Rosa hybrida provides microsatellite markers for breeding, flower trait improvement and taxonomy studies. BMC Plant Biol. 2018, 18, 119. [Google Scholar] [CrossRef] [PubMed]
  3. Debener, T.; Linde, M.; Debener, T. Exploring Complex Ornamental Genomes: The Rose as a Model Plant. Crit. Rev. Plant Sci. 2009, 28, 267–280. [Google Scholar] [CrossRef]
  4. Kumar, N.; Srivastava, G.C.; Dixit, K. Flower bud opening and senescence in roses (Rosa hybrida L.). Plant Growth Regul. 2008, 55, 81. [Google Scholar] [CrossRef]
  5. Woźnica, A.; Kalousis, A.; Hilario, M. Genetics and genomics of flower initiation and development in roses. J. Exp. Bot. 2013, 64, 847. [Google Scholar]
  6. Esselink, G.D.; Smulders, M.J.M.; Vosman, B. Identification of cut rose (Rosa hybrida) and rootstock varieties using robust sequence tagged microsatellite site markers. Theor. Appl. Genet. 2003, 106, 277–286. [Google Scholar] [CrossRef] [PubMed]
  7. Zhang, L.H.; Byrne, D.H.; Ballard, R.E.; Rajapakse, S. Microsatellite marker development in rose and its application in Tetraploid mapping. J. Am. Soc. Hortic. Sci. 2006, 131, 380–387. [Google Scholar] [CrossRef]
  8. Koning-Boucoiran, C.F.S.; Esselink, G.D.; Vukosavljev, M.; Westende, W.P.C.V.T.; Gitonga, V.W.; Krens, F.A.; Voorrips, R.E.; Weg, W.E.V.D.; Schulz, D.; Debener, T.; et al. Using RNA-Seq to assemble a rose transcriptome with more than 13,000 full-length expressed genes and to develop the WagRhSNP 68k Axiom SNP array for rose (Rosa L.). Front. Plant Sci. 2015, 6, 249. [Google Scholar] [CrossRef]
  9. Smulders, M.J.M.; Voorrips, R.E.; Esselink, G.D.; Leonardo, T.M.S.; Westende, W.P.C.V.; Vukosavljev, M.; Koning-Boucoiran, C.F.S.; Weg, W.E.V.D.; Arens, P.; Schulz, D.; et al. Development of the WagRhSNP AXIOM SNP array based on sequences from tetraploid cut roses and garden roses. Acta Hortic. 2015, 1064, 177–184. [Google Scholar] [CrossRef]
  10. Oyant, H.S.; Crespel, L.; Rajapakse, S.; Zhang, L.; Foucher, F. Genetic linkage maps of rose constructed with new microsatellite markers and locating QTL controlling flowering traits. Tree Genet. Genomes 2008, 4, 11. [Google Scholar] [CrossRef]
  11. Henz, A.; Debener, T.; Linde, M. Identification of major stable QTLs for flower color in roses. Mol. Breed. 2015, 35, 190. [Google Scholar] [CrossRef]
  12. Schulz, D.F.; Schott, R.T.; Voorrips, R.E.; Smulders, M.J.M.; Linde, M.; Debener, T. Genome-Wide Association Analysis of the Anthocyanin and Carotenoid Contents of Rose Petals. Front. Plant Sci. 2016, 7, 401. [Google Scholar] [CrossRef]
  13. Mikanagi, Y.; Saito, N.; Yokoi, M.; Tatsuzawa, F. Anthocyanins in flowers of genus Rosa, sections Cinnamomeae (=Rosa), Chinenses, Gallicanae and some modern garden roses. Biochem. Syst. Ecol. 2000, 28, 887–902. [Google Scholar] [CrossRef]
  14. Burbulis, I.E.; Winkelshirley, B. Interactions among enzymes of the Arabidopsis flavonoid biosynthetic pathway. Proc. Natl. Acad. Sci. USA 1999, 96, 12929–12934. [Google Scholar] [CrossRef] [PubMed]
  15. Holton, T.A.; Cornish, E.C. Genetics and Biochemistry of Anthocyanin Biosynthesis. Plant Cell 1995, 7, 1071–1083. [Google Scholar] [CrossRef] [PubMed]
  16. Koes, R.; Verweij, W.; Quattrocchio, F. Flavonoids: A colorful model for the regulation and evolution of biochemical pathways. Trends Plant Sci. 2005, 10, 236–242. [Google Scholar] [CrossRef]
  17. Mol, J.; Grotewold, E.; Koes, R. How gens paint flowers and seeds. Trends Plant Sci. 1998, 6, 212–217. [Google Scholar] [CrossRef]
  18. Thompson, W.R.; Meinwald, J.; Aneshansley, D.; Eisner, T. Flavonols: Pigments responsible for ultraviolet absorption in nectar guide of flower. Science 1972, 177, 528. [Google Scholar] [CrossRef]
  19. Maekawa, S.; Inagaki, N.; Terabun, M. Effect of Aluminum Ions on the Bluing of Petal Color in Cut Chinese Bellflower, Platycodon grandiflorum. Plant Cell Physiol. 1983, 24, 759–764. [Google Scholar] [CrossRef]
  20. Vlaming, P.D.; Schram, A.W.; Wiering, H. Genes affecting flower colour and pH of flower limb homogenates in Petunia hybrida. Theor. Appl. Genet. 1983, 66, 271–278. [Google Scholar] [CrossRef]
  21. Nakamura, N.; Hirakawa, H.; Sato, S.; Otagaki, S.; Matsumoto, S.; Tabata, S.; Tanaka, Y. Genome structure of Rosa multiflora, a wild ancestor of cultivated roses. DNA Res. 2017, 25, 113–121. [Google Scholar] [CrossRef]
  22. Raymond, O.; Gouzy, J.; Just, J.; Badouin, H.; Verdenaud, M.; Lemainque, A.; Vergne, P.; Moja, S.; Choisne, N.; Pont, C. The Rosa genome provides new insights into the domestication of modern roses. Nat. Genet. 2018, 50, 772–777. [Google Scholar] [CrossRef]
  23. Hibrand, S.O.; Ruttink, T.; Hamama, L.; Kirov, I.; Lakhwani, D.; Zhou, N.N.; Bourke, P.M.; Daccord, N.; Leus, L.; Schulz, D. A high-quality genome sequence of Rosa chinensis to elucidate ornamental traits. Nat. Plants 2018, 4, 473–484. [Google Scholar] [CrossRef]
  24. Guoliang, W. History of roses in cultivation|Ancient Chinese Roses. Encycl. Rose Sci. 2003, 387–395. [Google Scholar] [CrossRef]
  25. Jing, M.; Fougère-Danezan, M.; Zhang, L.B.; Li, D.Z.; Yi, T.S. Untangling the hybrid origin of the Chinese tea roses: Evidence from DNA sequences of single-copy nuclear and chloroplast genes. Plant Syst. Evol. 2011, 297, 157–170. [Google Scholar]
  26. Yu, Z.; Liao, Y.; Teixeira da Silva, J.; Yang, Z.; Duan, J. Differential Accumulation of Anthocyanins in Dendrobium officinale Stems with Red and Green Peels. Int. J. Mol. Sci. 2018, 19, 2857. [Google Scholar] [CrossRef]
  27. Mushtaq, M.A.; Pan, Q.; Chen, D.; Zhang, Q.; Ge, X.; Li, Z. Comparative Leaves Transcriptome Analysis Emphasizing on Accumulation of Anthocyanins in Brassica: Molecular Regulation and Potential Interaction with Photosynthesis. Front. Plant Sci. 2016, 7, 311. [Google Scholar] [CrossRef]
  28. Xu, Z.; Peters, R.J.; Weirather, J.; Luo, H.; Liao, B.; Zhang, X.; Zhu, Y.; Ji, A.; Zhang, B.; Hu, S. Full-length transcriptome sequences and splice variants obtained by a combination of sequencing platforms applied to different root tissues of Salvia miltiorrhiza and tanshinone biosynthesis. Plant J. 2015, 82, 951–961. [Google Scholar] [CrossRef]
  29. Massonnet, M.; Fasoli, M.; Tornielli, G.B.; Altieri, M.; Sandri, M.; Zuccolotto, P.; Paci, P.; Gardiman, M.; Zenoni, S.; Pezzotti, M. Ripening Transcriptomic Program in Red and White Grapevine Varieties Correlates with Berry Skin Anthocyanin Accumulation. Plant Physiol. 2017, 174, 2376–2396. [Google Scholar] [CrossRef] [Green Version]
  30. Xie, L.; Fei, L.; Zhang, S.; Hui, Z.; Wei, Q.; Li, P.; Zhang, S.; Sun, R. Mining for Candidate Genes in an Introgression Line by Using RNA Sequencing: The Anthocyanin Overaccumulation Phenotype in Brassica. Front. Plant Sci. 2016, 7, 1245. [Google Scholar] [CrossRef] [Green Version]
  31. Dubois, A.; Carrere, S.; Raymond, O.; Pouvreau, B.; Cottret, L.; Roccia, A.; Onesto, J.P.; Sakr, S.; Atanassova, R.; Baudino, S. Transcriptome database resource and gene expression atlas for the rose. BMC Genom. 2012, 13, 638. [Google Scholar] [CrossRef]
  32. Kim, J.; Park, J.H.; Chan, J.L.; Lim, J.Y.; Ryu, J.Y.; Lee, B.W.; Choi, J.P.; Kim, W.B.; Lee, H.Y.; Choi, Y. Small RNA and transcriptome deep sequencing proffers insight into floral gene regulation in Rosa cultivars. BMC Genom. 2012, 13, 657. [Google Scholar] [CrossRef]
  33. Pei, H.; Ma, N.; Chen, J.; Zheng, Y.; Tian, J.; Li, J.; Zhang, S.; Fei, Z.; Gao, J. Integrative analysis of miRNA and mRNA profiles in response to ethylene in rose petals during flower opening. PLoS ONE 2013, 8, e64290. [Google Scholar] [CrossRef]
  34. Guo, X.; Yu, C.; Luo, L.; Wan, H.; Zhen, N.; Xu, T.; Tan, J.; Pan, H.; Zhang, Q. Transcriptome of the floral transition in Rosa chinensis ‘Old Blush’. BMC Genom. 2017, 18, 199. [Google Scholar] [CrossRef]
  35. Kin Fai, A.; Vittorio, S.; Pegah Tootoonchi, A.; Jens Durruthy, D.; Lawrence, L.; Williams, B.A.; Harm, V.B.; Schadt, E.E.; Reijo-Pera, R.A.; Underwood, J.G. Characterization of the human ESC transcriptome by hybrid sequencing. Proc. Natl. Acad. Sci. USA 2013, 110, e4821–e4830. [Google Scholar]
  36. Weirather, J.L.; Pegah Tootoonchi, A.; Clark, T.A.; Elizabeth, T.; Powers, L.S.; Underwood, J.G.; Joseph, Z.; Jonas, K.; Wing Hung, W.; Kin Fai, A. Characterization of fusion genes and the significantly expressed fusion isoforms in breast cancer by hybrid sequencing. Nucleic Acids Res. 2015, 43, e116. [Google Scholar] [CrossRef]
  37. Deonovic, B.; Wang, Y.; Weirather, J.; Wang, X.J.; Au, K.F. IDP-ASE: Haplotyping and quantifying allele-specific expression at the gene and gene isoform level by hybrid sequencing. Nucleic Acids Res. 2017, 45, e32. [Google Scholar] [CrossRef]
  38. Weirather, J.L.; Cesare, M.D.; Wang, Y.; Piazza, P.; Sebastiano, V.; Wang, X.J.; Buck, D.; Au, K.F. Comprehensive comparison of Pacific Biosciences and Oxford Nanopore Technologies and their applications to transcriptome analysis. F1000Research 2017, 6, 100. [Google Scholar] [CrossRef]
  39. Tanaka, Y.; Sasaki, N.; Ohmiya, A. Biosynthesis of plant pigments: Anthocyanins, betalains and carotenoids. Plant J. 2010, 54, 733–749. [Google Scholar] [CrossRef]
  40. Tanaka, Y.; Tsuda, S.; Kusumi, T. Metabolic Engineering to Modify Flower Color. Plant Cell Physiol. 1998, 39, 1119–1126. [Google Scholar] [CrossRef]
  41. Venter, A.; Joubert, E.; de Beer, D. Characterisation of phenolic compounds in South African plum fruits (Prunus salicina Lindl.) using HPLC coupled with diode-array, fluorescence, mass spectrometry and on-line antioxidant detection. Molecules 2013, 18, 5072–5090. [Google Scholar] [CrossRef]
  42. Jin, H.; Martin, C. Multifunctionality and diversity within the plant MYB-gene family. Plant Mol. Boil. 1999, 41, 577–585. [Google Scholar] [CrossRef]
  43. Stracke, R.; Werber, M.; Weisshaar, B. The R2R3-MYB gene family in Arabidopsis thaliana. Curr. Opin. Plant Boil. 2001, 4, 447–456. [Google Scholar] [CrossRef]
  44. Takos, A.M.; Jaffé, F.W.; Jacob, S.R.; Jochen, B.; Robinson, S.P.; Walker, A.R. Light-induced expression of a MYB gene regulates anthocyanin biosynthesis in red apples. Plant Physiol. 2006, 142, 1216–1232. [Google Scholar] [CrossRef]
  45. Baudry, A.; Heim, M.A.; Dubreucq, B.; Caboche, M.; Weisshaar, B.; Lepiniec, L. TT2, TT8, and TTG1 synergistically specify the expression of BANYULS and proanthocyanidin biosynthesis in Arabidopsis thaliana. Plant J. 2010, 39, 366–380. [Google Scholar] [CrossRef]
  46. Cone, K.C.; Cocciolone, S.M.; Burr, F.A.; Burr, B. Maize anthocyanin regulatory gene Pl is a duplicate of C1 that functions in the plant. Plant Cell 1993, 5, 1795–1805. [Google Scholar]
  47. Bogs, J.; Jaffé, F.W.; Takos, A.M.; Walker, A.R.; Robinson, S.P. The Grapevine Transcription Factor VvMYBPA1 Regulates Proanthocyanidin Synthesis during Fruit Development. Plant Physiol. 2007, 143, 1347–1361. [Google Scholar] [CrossRef] [Green Version]
  48. Xu, Z.; Luo, H.; Ji, A.; Zhang, X.; Song, J.; Chen, S. Global Identification of the Full-Length Transcripts and Alternative Splicing Related to Phenolic Acid Biosynthetic Genes in Salvia miltiorrhiza. Front. Plant Sci. 2016, 7, 100. [Google Scholar] [CrossRef]
  49. Zhang, J.J.; Su, H.; Zhang, L.; Liao, B.S.; Xiao, S.M.; Dong, L.L.; Hu, Z.G.; Wang, P.; Li, X.W.; Huang, Z.H. Comprehensive Characterization for Ginsenosides Biosynthesis in Ginseng Root by Integration Analysis of Chemical and Transcriptome. Molecules 2017, 22, 889. [Google Scholar] [CrossRef]
  50. Yukihisa, K.; Masako, F.M.; Yuko, F.; Filippa, B.; Holton, T.A.; Mirko, K.; Noriko, N.; Keiko, Y.S.; Junichi, T.; Alix, P. Engineering of the rose flavonoid biosynthetic pathway successfully generated blue-hued flowers accumulating delphinidin. Plant Cell Physiol. 2007, 48, 1589. [Google Scholar]
  51. Gonzalez, A. Pigment loss in response to the environment: A new role for the WD/bHLH/MYB anthocyanin regulatory complex. New Phytol. 2009, 182, 1–3. [Google Scholar] [CrossRef]
  52. Dong, H.S.; Choi, M.G.; Kang, C.S.; Park, C.S.; Choi, S.B.; Park, Y.I. Overexpressing the wheat dihydroflavonol 4-reductase gene TaDFR increases anthocyanin accumulation in an Arabidopsis DFR mutant. Genes Genom. 2016, 38, 333–340. [Google Scholar]
  53. Watanabe, K.; Kobayashi, A.; Endo, M.; Sageono, K.; Toki, S.; Ono, M. CRISPR/Cas9-mediated mutagenesis of the dihydroflavonol-4-reductase-B (DFR-B) locus in the Japanese morning glory Ipomoea (Pharbitis) nil. Sci. Rep. 2017, 7, 10028. [Google Scholar] [CrossRef]
  54. Quattrocchio, F.M.; Wing, J.; Van Der Woude, K.; Souer, E.; De Vetten, N.; Mol, J.; Koes, R. Molecular analysis of the anthocyanin2 gene of Petunia and its role in the evolution of flower color. Plant Cell 1999, 11, 1433–1444. [Google Scholar] [CrossRef]
  55. Davies, K.M.; Albert, N.W.; Schwinn, K.E. From landing lights to mimicry: The molecular regulation of flower colouration and mechanisms for pigmentation patterning. Funct. Plant Boil. 2012, 39, 619–638. [Google Scholar] [CrossRef]
  56. Chen, K.; Liu, H.; Lou, Q.; Liu, Y. Ectopic Expression of the Grape Hyacinth (Muscari armeniacum) R2R3-MYB Transcription Factor Gene, MaAN2, Induces Anthocyanin Accumulation in Tobacco. Front. Plant Sci. 2017, 8, 965. [Google Scholar] [CrossRef]
  57. Holton, T.A.; Brugliera, F.; Tanaka, Y. Cloning and expression of flavonol synthase from Petunia hybrida. Plant J. 2010, 4, 1003–1010. [Google Scholar] [CrossRef]
  58. Ishihara, H.; Tohge, T.; Viehã¶Ver, P.; Fernie, A.R.; Weisshaar, B.; Stracke, R. Natural variation in flavonol accumulation in Arabidopsis is determined by the flavonol glucosyltransferase BGLU6. J. Exp. Bot. 2016, 67, 1505–1517. [Google Scholar] [CrossRef]
  59. Stracke, R.; Ishihara, H.G.; Barsch, A.; Mehrtens, F.; Niehaus, K.; Weisshaar, B. Differential regulation of closely related R2R3-MYB transcription factors controls flavonol accumulation in different parts of the Arabidopsis thaliana seedling. Plant J. 2010, 50, 660–677. [Google Scholar] [CrossRef]
  60. Ralf, S.; Oliver, J.; Matthias, K.; Takayuki, T.; Karsten, N.; Fernie, A.R.; Bernd, W. Analysis of PRODUCTION OF FLAVONOL GLYCOSIDES-dependent flavonol glycoside accumulation in Arabidopsis thaliana plants reveals MYB11-, MYB12- and MYB111-independent flavonol glycoside accumulation. New Phytol. 2010, 188, 985–1000. [Google Scholar]
  61. Frank, M.; Harald, K.; Pawel, B.; Bernd, W. The Arabidopsis transcription factor MYB12 is a flavonol-specific regulator of phenylpropanoid biosynthesis. Plant Physiol. 2005, 138, 1083–1096. [Google Scholar]
  62. Laurent, D.; Francois, B.; Chloé, M.; Virginie, L.; Alain, D.; Tristan, R.; Jean-Pierre, C.; Jean-Michel, M.; Said, H. Characterization of a grapevine R2R3-MYB transcription factor that regulates the phenylpropanoid pathway. Plant Physiol. 2006, 140, 499–511. [Google Scholar]
  63. Marles, M.A.S.; Ray, H.; Gruber, M.Y. New perspectives on proanthocyanidin biochemistry and molecular regulation. Phytochemistry 2003, 64, 367–383. [Google Scholar] [CrossRef]
  64. Debeaujon, I.; Nesi, N.; Perez, P.; Devic, M.; Grandjean, O.; Caboche, M.; Lepiniec, L. Proanthocyanidin-Accumulating Cells in Arabidopsis Testa: Regulation of Differentiation and Role in Seed Development. Plant Cell 2003, 15, 2514–2531. [Google Scholar] [CrossRef]
  65. Laurent, D.; Jochen, B.; Walker, A.R.; Thilia, F.; Alain, D.; Jean-Michel, M.; Robinson, S.P.; Barrieu, F. The transcription factor VvMYB5b contributes to the regulation of anthocyanin and proanthocyanidin biosynthesis in developing grape berries. Plant Physiol. 2008, 147, 2041–2053. [Google Scholar]
  66. Koyama, K.; Numata, M.; Nakajima, I.; Gotoyamamoto, N.; Matsumura, H.; Tanaka, N. Functional characterization of a new grapevine MYB transcription factor and regulation of proanthocyanidin biosynthesis in grapes. J. Exp. Bot. 2014, 65, 4433. [Google Scholar] [CrossRef]
  67. Akagi, T.; Tsujimoto, T.; Ikegami, A.; Yonemori, K. Effects of seasonal temperature changes on DkMyb4 expression involved in proanthocyanidin regulation in two genotypes of persimmon (Diospyros kaki Thunb.) fruit. Planta 2011, 233, 883–894. [Google Scholar] [CrossRef]
  68. Shamila Weerakoon, A.; Stephen, P.; Ross, C.; Tracie, W.; Simone, R.; Aidyn, M.; German, S. Biosynthesis of proanthocyanidins in white clover flowers: Cross talk within the flavonoid pathway. Plant Physiol. 2012, 158, 666–678. [Google Scholar]
  69. Su, F.; Zhang, Q.; Luo, Z. Isolation and characterisation of a Myb transcription factor DkPA1 related to proanthocyanidin biosynthesis in C-PCNA and non-PCNA persimmon (Diospyros kaki Thunb.) fruit. Acta Physiol. Plant. 2014, 36, 1831–1839. [Google Scholar] [CrossRef]
  70. Iwashina, T. Contribution to flower colors of flavonoids including anthocyanins: A review. Nat. Prod. Commun. 2015, 10, 529. [Google Scholar] [CrossRef]
  71. Jun, O.; Yoshiaki, K.; Yoshio, I.; Hidehito, T.; Masahiko, S. Plant biochemistry: Anthocyanin biosynthesis in roses. Nature 2005, 435, 757–758. [Google Scholar]
  72. Pollastri, S.; Tattini, M. Flavonols: Old compounds for old roles. Ann. Bot. 2011, 108, 1225. [Google Scholar] [CrossRef]
  73. Luo, P.; Ning, G.; Wang, Z.; Shen, Y.; Jin, H.; Li, P.; Huang, S.; Zhao, J.; Bao, M. Disequilibrium of Flavonol Synthase and Dihydroflavonol-4-Reductase Expression Associated Tightly to White vs. Red Color Flower Formation in Plants. Front. Plant Sci. 2015, 6, 1257. [Google Scholar] [CrossRef]
  74. Hanny, B.W. Gossypol, flavonoid, and condensed tannin content of cream and yellow anthers of five cotton (Gossypium hirsutum L.) cultivars. J. Agric. Food Chem. 1980, 28, 504–506. [Google Scholar] [CrossRef]
  75. Veberic, R.; Slatnar, A.; Bizjak, J.; Stampar, F.; Mikulic-Petkovsek, M. Anthocyanin composition of different wild and cultivated berry species. LWT Food Sci. Technol. 2015, 60, 509–517. [Google Scholar] [CrossRef]
  76. Hackl, T.; Hedrich, R.; Schultz, J.; Förster, F. proovread: Large-scale high-accuracy PacBio correction through iterative short read consensus. Bioinformatics 2014, 30, 3004. [Google Scholar] [CrossRef]
  77. Fu, L.; Niu, B.; Zhu, Z.; Wu, S.; Li, W. CD-HIT: Accelerated for clustering the next-generation sequencing data. Bioinformatics 2012, 28, 3150–3152. [Google Scholar] [CrossRef]
  78. Yi, Z.; Chen, J.; Sun, H.; Rosli, H.G.; Pombo, M.A.; Zhang, P.; Banf, M.; Dai, X.; Martin, G.B.; Giovannoni, J.J. iTAK: A Program for Genome-wide Prediction and Classification of Plant Transcription Factors, Transcriptional Regulators, and Protein Kinases. Mol. Plants 2016, 9, 1667–1670. [Google Scholar] [Green Version]
  79. Li, B.; Dewey, C.N. RSEM: Accurate transcript quantification from RNA-Seq data with or without a reference genome. BMC Bioinform. 2011, 12, 323. [Google Scholar] [CrossRef]
  80. Trapnell, C.; Williams, B.A.; Pertea, G.; Mortazavi, A.; Kwan, G.; van Baren, M.J.; Salzberg, S.L.; Wold, B.J.; Pachter, L. Transcript assembly and quantification by RNA-Seq reveals unannotated transcripts and isoform switching during cell differentiation. Nat. Biotechnol. 2010, 28, 511–515. [Google Scholar] [CrossRef] [Green Version]
  81. Anders, S. Analysing RNA-Seq data with the DESeq package. Mol. Biol. 2010, 43, 1–7. [Google Scholar]
  82. Young, M.D.; Wakefield, M.J.; Smyth, G.K.; Oshlack, A. Gene ontology analysis for RNA-seq: Accounting for selection bias. Genome Biol. 2010, 11, R14. [Google Scholar] [CrossRef]
  83. Xie, C.; Mao, X.; Huang, J.; Ding, Y.; Wu, J.; Dong, S.; Kong, L.; Gao, G.; Li, C.Y.; Wei, L. KOBAS 2.0: A web server for annotation and identification of enriched pathways and diseases. Nucleic Acids Res. 2011, 39, W316–W322. [Google Scholar] [CrossRef]
  84. Ramakers, C.; Ruijter, J.M.; Deprez, R.H.; Moorman, A.F. Assumption-free analysis of quantitative real-time polymerase chain reaction (PCR) data. Neurosci. Lett. 2003, 339, 62–66. [Google Scholar] [CrossRef]
  85. Wang, W.; Cai, J.; Wang, P.; Tian, S.; Qin, G. Post-transcriptional regulation of fruit ripening and disease resistance in tomato by the vacuolar protease SlVPE3. Genome Boil. 2017, 18, 47. [Google Scholar] [CrossRef] [Green Version]
Figure 1. Petal material of Rosa ‘Margo Koster’ (a) and Rosa ‘White Margo Koster’ (b) at blooming stage used for RNA-seq (c) work process of bioinformatics analysis of hybrid RNA sequencing in this study.
Plants 08 00267 g001
Figure 2. Full-length gene from SMRT sequencing and their annotation in main database. (a) The length distribution of full-length gene. Horizontal axis indicates the different length interval of full-length; vertical coordinates indicate the number of full-length transcripts. (b) Gene annotation of full-length gene against main databases, including Nucleotide Sequence Database, Nt; Non-Redundant Protein Sequence Database, Nr; Protein families and domain database, Pfam, Gene Ontology, GO, and euKaryotic Orthologous Groups database, KOG.
Plants 08 00267 g002
Figure 3. Differentially expression genes (a) and their KEGG enrichment (b) in the petal of two rose varieties. Rosa ’MK’ and Rosa ’WMK’ indicate Rosa ‘Margo Koster’ and Rosa ‘White Margo Koster’.
Plants 08 00267 g003
Figure 4. Graphs showing gene expression in the anthocyanin biosynthesis pathway. Key enzymes and their differential gene expression during flowering stages (unopened bud, opened bud, and initial bloom) were analyzed by qRT-PCR. The expression level of each gene is relative to that of ACTIN reference in Rosa ‘Margo Koster’ at unopen bud stage. Each data point is the average of three biological repeats. Error bars indicate standard deviations (SDs). CHS, chalcone synthase; CHI, chalcone isomerase; FLS, flavonol synthase; DFR, dihydroflavonol-4-reductase; LDOX, leucoanthocyanidin dioxygenase; UFGT, anthocyanidin-3-O-glucosyltransferase; ANR, anthocyanidin reductase; LAR, leucoanthocyanidin reductase.
Plants 08 00267 g004
Figure 5. Comparison of (a) anthocyanin, and (b) flavonoid composition between Rosa ‘Margo Koster’ (pink) and Rosa ‘White Margo Koster’. The horizontal axis represents retention time, the vertical axis represents response units, and numbers on the peaks represent different compositions of anthocyanin and flavonoid. (a) 1-cyanidin 3,5-diglucoside, 2-pelargonidin 3,5-diglucoside, 6-pelargonidin 3-glucoside; (b) 2-kaempfeol-3-rutinoside, 12-kaempferol-3-glucoside, 13-kaempferol-3-O-α-d-arabinoside, 14-kaempferol-3-O-β-glucopyranosyl-7-O-α-rhamnopyranoside, 15-kaempferol-3-rhamnopyranoside (afzelin), and 16-multiflorin A.
Plants 08 00267 g005
Figure 6. Analysis of deduced amino acid sequences of two R2R3-MYB TFs. (a) Alignment of deduced amino acid sequences of the AN2 subgroup of MYB TFs, and (b) alignment of deduced amino acid sequences of the TT2 and PA specific-MYB regulators. ZmC1, ZmPl (maize), AtTT2, AtMYB5 (Arabidopsis thaliana), PH4 (Pharbitis hybrid), VvMYB5a, VvMYBPA1, VvMYBPA2 (Vitis vinifera), PyR2R3MYB (Prunus yedoensis), DkMYBPA1 (Diospyros kaki), RrMYB5 (Rosa rugusa), RhMYB308-like (Rosa chinensis), and FvMYB (Fragaria vesca). The R2R3MYB domains are indicated by black arrow, yellow box indicates a C-terminal conserved motif [K/R]Px3[K/T][F/Y] in AN2 subgroup of R2R3MYB. Black box indicates a C-terminal conserved motif in the PA-specific MYB regulators. (c) A neighbor-joining phylogenetic tree of plant R2R3MYB sequences. The scale bar represents 0.1 substitutions per site and the numbers next to the nodes are bootstrap values from 1000 replicates. The deduced amino acid sequences were retrieved from the DDBJ/EMBL/GeneBank databases, and the accession numbers are as follows AtPAP1(NP_176057.1), AtPAP2(NP_176813.1), RhAN2(BAM36703.1), PhAN2(AAF66727.1), MdMYB10(AAF66727.1), and ZmC1(sp|P10290.1).
Plants 08 00267 g006
Figure 7. Gene expression level of (a) RmMYBAN2 and (b) RmMYBPA of the Rosa ‘Margo Koster’ and Rosa ‘White Margo Koster’ during flowering (unopened bud, opened bud, and initial bloom). The expression level of each gene is relative to that of ACTIN reference in Rosa ‘Margo Koster’ at unopen bud stage. Each data point is the average of three biological repeats. Error bars indicate SDs.
Plants 08 00267 g007
Figure 8. A putative model of the biosynthesis process of pigment accumulation in two rose varieties. The expression of DFR is switched off, and the substrate used for anthocyanin synthesis is shunted to flavonol synthesis; hence, FLS is up-regulated in the white flowers. The total output of flavonoids and anthocyanins was considered to be 100% and was used to evaluate the relative level of each product.
Plants 08 00267 g008
Table 1. Summary of sequencing data from PacBio platform.
RNA-SeqSampleSub-Reads Base (Gb)Sub-Reads NumberCircular Consensus SequenceFull LengthFlncAverage Flnc Length (bp)
Pacbio RSIIMixture petal of two rose varieties at blooming stage10.555,383,989463,753370,571365,4072591
Table 2. Summary of sequencing data from Illumina platform.
RNA-seqSampleRepetitionRead NumberRead Bases (G)GC (%)Q30 (%)Total Mapping (%)
IlluminaHiSeq 2500Petal of Rosa ‘Margo Koster’ at blooming stageRep152,204,8706.52
6.55
6.54
6.54
6.53
6.55
46.396.844,427,346 (85.10%)
Rep252,393,1486.55
6.54
6.54
6.53
6.55
46.4297.0845,811,502 (87.44%)
Rep352,361,7866.5446.4697.0543,569,408 (83.21%)
Petal of Rosa ‘White Margo Koster’ at blooming stageRep152,317,3166.5446.2997.0645,439,584 (86.85%)
Rep252,252,3306.5346.4197.0445,425,380 (86.93%)
Rep352,424,2946.5546.5297.143,782,470 (83.52%)
Table 3. Statistics of discovered simple sequence repeats (SSRs) and their various classes in rose transcriptome.
ParametersCountsMotifsNo. of SSR
Total number of sequences examined107,280Mononucleotide56,828
Total size of examined sequences (bp)290,704,013Dinucleotide25,261
Total number of identified SSRs96,902Trinucleotide13,799
Number of SSR containing sequences45,782Tetranucleotide550
Number of sequences containing more than one SSR20,252Pentanucleotide114
Number of SSRs present in compound formation28,391Hexanucleotide350
Table 4. FPKM (Fragments Per Kilobase Million) of key genes involved in flavonoids and associated biosynthesis in the petals of rose varieties.
Gene Name#IDExpression Profile (FPKM)Log2 (Change Fold)
Rosa ‘Margo Koster’Rosa ‘White Margo Koster’
Rm4CLc75759/f1p0/2016 *35.5972.720.97
RmCHSc73992/f1p0/124179.5537.44−0.92
RmF3Hc18601/f3p3/1313 *28.1112.28−0.84
RmDFRc10949/f1p0/119744.0711.44−0.51
RmFLSc70511/f47p0/14684.42249.110.17
RmLDOXc68764/f1p8/13701240.905.67−0.13
RmANRc64060/f1p0/1292169.8142.56−0.50
RmLARc21707/f3p7/1533 *86.8829.34−0.64
RmGTc41272/f1p0/17628.5335.750.48
RmCCDc22761/f1p25/2265 *11.205.35−0.94
* indicates the p-value of DEG was less than 0.05, but their adjusted p-value was more than 0.05.
Table 5. Tentative identification and quantification of anthocyanins, procyanidins, and flavonoids in rose flower.
No.Retention Time
(min)
λmax
(nm)
[M]+Fragment IonsTentative IdentificationRosa ‘MK’
(μg/g)
Rosa ‘WMK’
(μg/g)
ReferenceCatalogue
19.681280, 520611.161287.055Cyanidin 3,5 diglucoside138.6790.000STDAC
212.396280, 520595.167271.059Pelargonidin 3,5 diglucoside5004.7350.000STDAC
313.569280, 520625.177301.070Peonidin, 3,5-diglucoside5.7940.000STDAC
418.955280, 520433.112271.059Pelargonidin 3-glucoside618.7890.000[41]AC
526.356280, 520519.114271.059Pelargonidin 3-glucoside-carboxyacetyl0.0000.000[41]AC
611.678280579.149291.086Procyanindin B163.072168.931STDPC
732.757280595.166566.426Proanthocyanidins22,932.77127,408.189STDPC
846.510264, 365287.057153.017Kaempferol28.55374.894STDFL
942.813265, 350637.177287.057Multiflorin A12,585.92722,779.216[41]FL
1042.590254, 370303.049153.017Quercetin1.43211.934STDFL
1133.688265, 350449.108287.057Kaempferol-3-glucoside3275.0876992.866[41]FL
1238.683265, 350433.113287.057Kaempferol-3-rhamnopyranoside (Afzelin)4189.2927339.989[41]FL
1337.703265, 350419.097287.057Kaempferol-3-O-β-glucopyranosyl-7-O-α-rhamnopyranoside1905.6001880.046[41]FL
1435.872265, 350418.090287.057Kaempferol-3-O-α-d-Arabinoside1409.0552876.430[41]FL
1532.689264, 348595.166287.057Kaempfeol-3-rutinoside2701.6403043.795STDFL
1629.689255, 353465.102303.049Quercetin 3-glucoside260.7761623.913STDFL
1728.741254, 350611.160303.049Rutin34.425320.854STDFL
1828.883255, 352465.102303.049Hyperoside0.000181.090STDFL
1919.050280291.084139.038(−)-Epicatechin0.0006.821STDFL
2013.429280291.085139.038(+/−)-Catechin hydrate282.5401534.824STDFL
2114.455221, 260, 292169.049125.060Vanillic acid141.04772.536STDFL
2214.184240, 325355.102163.039Chlorogenic acid1.4650.765STDFL
2314.184243, 323355.102163.038Neochlorogenic acid14.6557.647STDFL

