Abstract
Aquaporins (AQPs) facilitate transmembrane transport of water and small solutes, critically influencing plant growth, development, and stress adaptation. However, tea plant AQPs (CsAQPs) remain incompletely characterized genome-wide. In this study, 61 CsAQPs were identified from the tea plant genome and could be classified into five subfamilies. The bioinformatics characteristics, including phylogenetic relationships, gene structures, chromosomal locations, conserved motifs, promoter cis-acting elements, and three-dimensional protein structure, were systematically investigated. Additionally, the expression patterns of CsAQPs in tea plants in response to abiotic and biotic stresses were comprehensively explored based on transcriptome data and qRT-PCR, suggesting that CsAQPs were closely associated with the tea plant responding to environmental adaptation. Notably, the functions of CsPIPs in response to drought and salt, as well as potential H2O2 transporters and their subcellular localization, were investigated in yeast. Collectively, our study delivers a complete genomic and evolutionary dissection of the CsAQPs gene family in the tea plant, providing valuable insights into their diverse functions for further investigation.
1. Introduction
Aquaporins (AQPs), a class of membrane-integrated channel proteins within the major intrinsic protein (MIP) family, mediate the transmembrane transport of water and small molecules such as glycerol, urea, CO2, and boric acid [1,2,3,4]. These proteins are ubiquitously distributed across diverse species, ranging from bacteria to higher eukaryotes [5]. In plants, AQPs are critical regulators of water homeostasis and stress adaptation, with their roles extending to the modulation of cellular responses to abiotic stressors. Based on subcellular localization and sequence homology, plant AQPs can be classified into five subfamilies: plasma membrane intrinsic proteins (PIPs), tonoplast intrinsic proteins (TIPs), nodulin26-like intrinsic proteins (NIPs), small basic intrinsic proteins (SIPs), and X intrinsic proteins (XIPs) [6]. Interestingly, XIPs are evolutionarily lost in monocots and in the Brassicaceae family of dicots [7,8,9], suggesting that the evolution of AQPs is complicated in plants. The number of AQPs varies among species, ranging from 35 members in Arabidopsis thaliana [8], 33 in Oryza sativa [10], and 86 in Glycine max [11]. Although the tea plant genome has been sequenced [12], genome-wide identification and functional characterization of CsAQPs remain insufficient; therefore, a comprehensive analysis of all members within the CsAQPs gene family is essential for fully elucidating their biological functions.
Structurally, AQPs share conserved features: cytoplasmic N- and C-termini, six transmembrane α-helices, and two asparagine-proline-alanine (NPA) motifs within loops B and E. These motifs form a three-dimensional “hourglass” structure within the lipid bilayer, essential for selective water permeation [13,14,15]. Another critical determinant of substrate specificity is the aromatic/arginine (Ar/R) filter, a narrow channel region composed of residues from transmembrane helices 2 and 5 (H2, H5) and loop E (LE1, LE2). The LE2 residue is highly conserved as arginine (R), further refining transport selectivity [16]. Statistical analysis of amino acid sequences of AQPs that can transport glycerol, known as aquaglyceroporins (GLPs), identified five highly conserved residues termed Froger’s positions: P1 in Loop C, P2 and P3 in Loop E, and P4 and P5 in TM6 [17].
Numerous studies have reported the pivotal role of the AQPs in regulating water and solute transport, which significantly influences plant growth, development, and stress responses [18]. In maize (Zea mays), overexpression of PIP2;5 enhances root hydraulic conductance, highlighting AQPs’ direct role in water transport regulation [19]. The PIP subfamily in Morus notabilis plays a crucial role in responding to biotic infection [20]. Moreover, regulatory interactions between different AQP subfamilies can influence their subcellular localization and thereby modulate water permeability. [21]. Generally, AQP genes directly or indirectly participate in the regulation of various elements in cells, playing a key role in plant stress resistance [22].
The tea plant, a globally significant economic crop, thrives in subtropical climates with high humidity and precipitation [23]. The ongoing accumulation of greenhouse gases has induced global warming and consequent frequent climatic disasters, which have significantly impacted various agricultural sectors, including tea plant cultivation [24]. This environmental challenge has established stress resistance research as a pivotal area in tea plant studies. Previous investigations have identified several CsAQPs genes in tea plants from the transcriptome level, revealing their extensive involvement in responses to stresses, bud dormancy, and flower opening [25]. Additionally, several studies have shown that CsAQPs facilitate the tea plant’s response to selenium treatments and heat stress [26,27], reflecting that CsAQPs play an important role in tea plant growth and development, as well as stress response. However, the CsAQPs family at the genome-wide level and their functions remain largely unknown.
In this study, 61 CsAQPs genes were identified and characterized from the tea plant genome. Moreover, their phylogenetic relationships, gene structures, chromosomal locations, conserved motifs, gene duplication information, and regulatory cis-acting elements were comprehensively analyzed. The expression patterns of CsAQPs genes in different tissues during different seasons, in response to abiotic stresses of drought, cold, and salt treatments, and in response to biotic stresses of anthracnose and gray blight were investigated. The function and subcellular localization of CsPIPs were determined in the yeast system. Our results will provide valuable information for further functional studies of CsAQPs genes in the tea plant.
2. Results
2.1. Identification and Classification of AQP Genes in Tea Plant
BLAST searches were conducted against the tea plant genome using the known AQP protein sequences from Arabidopsis thaliana, Vitis vinifera, and Vigna angularis as queries. This led to the identification of 61 candidate CsAQPs (Table 1). These genes were classified into five subfamilies: 14 PIPs, 26 TIPs, 15 NIPs, 3 SIPs, and 3 XIPs, consistent with the nomenclature established in other plant species. Furthermore, each subfamily was subdivided into distinct subgroups: the NIPs formed seven subgroups (NIP1–NIP7), TIPs were categorized into five (TIP1–TIP5), PIPs were divided into PIP1 and PIP2, while SIPs and XIPs were each separated into two subgroups (SIP1/SIP2 and XIP1/XIP2, respectively).

Table 1.
Characteristics of the 61 CsAQP genes identified from the tea plant genome.
The physicochemical properties of CsAQPs proteins were characterized, encompassing amino acid sequence length, molecular weight (MW), theoretical isoelectric point (pI), grand average of hydropathy (GRAVY), instability index (II), and aliphatic index (Table 1). Analysis showed CsAQPs exhibit lengths varying from 146 residues (CsNIP7;1) to 487 residues (CsNIP4;5), corresponding to MWs between 15.56 kDa and 52.71 kDa. Predicted pI values ranged from 4.78 to 10.44. Within the PIP, XIP, NIP, and SIP subfamilies, most members possess pI values exceeding seven, except for CsNIP4;5, CsNIP4;6, and CsNIP6;2. Conversely, 11 genes in the TIP subfamily have pI values greater than seven, while the remainder are below seven, indicating an acidic status for nearly half of the TIP subfamily. Instability indices were below 40 for most CsAQPs, signifying high relative stability in the tea plant; exceptions include CsNIP4;5 (42.96), CsNIP4;6 (41.18), and CsTIP2;3 (50.29). Aliphatic index values were calculated to be between 92.95 and 126.77. GRAVY values spanned +0.261 to +0.909, confirming the hydrophobic nature of these proteins. Transmembrane helix prediction revealed that most CsAQPs (39 proteins) possess six TMs, while CsNIP7;1, CsNIP7;2, CsTIP5;1 and CsTIP5;12 were predicted to contain only three TMs.
Subcellular localization predictions revealed diverse membrane associations for CsAQPs (Table 1). CsNIPs mainly occupied the plasma membrane; however, CsNIP1;1, CsNIP5;1, CsNIP5;2, and CsNIP6;2 exhibited dual localization (plasma membrane and vacuole), while CsNIP7;1 and CsNIP7;2 localized to the endoplasmic reticulum (ER). CsPIPs are primarily localized to the plasma membrane, whereas CsPIP2;5, CsPIP2;8, and CsPIP2;9 also showed vacuolar or ER localization. CsTIPs had complex distributions, occurring in the plasma membrane, vacuole, ER, and cytoplasm (cyto). CsXIPs are associated variably with the plasma membrane, ER, or vacuole. CsSIPs are localized exclusively to the plasma membrane and vacuole. This diversity highlights the broad functional roles of CsAQPs.
To gain a full insight into AQP genes in plants, the AQP gene members involved in 14 species spanning Basal Angiosperms, Monocotyledoneae, early-diverging eudicotyledons, Superasterids, and Superrosids were used to analyze (Figure 1A). Glycine max contained the largest AQP gene complement (86 total genes: 25 PIPs, 26 TIPs, 24 NIPs, 8 SIPs, and 3 XIPs), followed by tea plant (61), Actinidia chinensis (55), and Populus trichocarpa (55). Amborella trichopoda (22) and Nelumbo nucifera (28) possessed fewer than 30 AQP genes. Analysis revealed no correlation between AQP gene number and genome size (Figure 1A); for example, Vitis vinifera (genome size 494.9 Mb) contains 37 AQPs, while Amborella trichopoda (706.3 Mb) contains only 22 AQPs. Within these plants, TIP, PIP, and/or NIP subfamilies predominated, while SIP and XIP subfamilies were comparatively scarce. Notably, no XIP genes were identified in Amborella trichopoda, Oryza sativa, Sorghum bicolor, or Arabidopsis thaliana. Phylogenetic analysis of AQPs from the tea plant, Arabidopsis thaliana, Vitis vinifera, and Vigna angularis elucidated evolutionary relationships (Figure 1B). The analysis clearly showed that the AQPs could be classified into five groups, and each group was clustered into different subgroups in the tree.
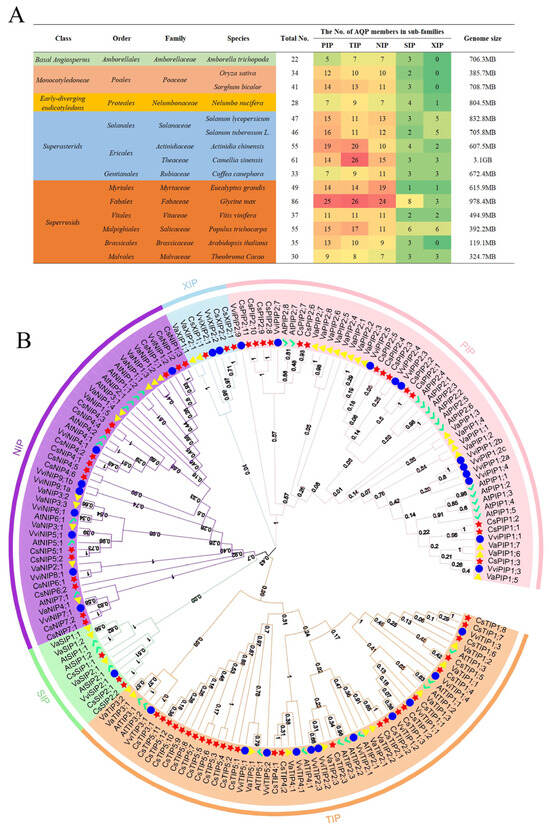
Figure 1.
AQP family in different plant genomes and phylogenetic analysis of 61 AQP proteins from four species. (A) Distribution of genes belonging to the AQP family in different plant species genomes. Green background represents the plants that belong to Basal Angiosperms; faint-red background represents the plants that belong to Monocotyledoneae; yellow background represents the plants that belong to Early-diverging eudicotyledons; blue background represents the plants that belong to superasterids; orange background represents the plants that belong to superrosids. On the right side, the green-to-red color scale corresponds to the increasing gene numbers, as shown by the specific number. (B) Phylogenetic tree of the tea plant with other plant species. Red star represents the tea plant; yellow triangle represents Vigna angularis; green tick represents Arabidopsis thaliana; blue cycle represents Vitis vinifera.
2.2. Synteny and Chromosomal Location Analysis of CsAQPs Gene Family Members
The chromosomal locations of the CsAQPs gene family members showed that these genes were unevenly distributed across the 15 chromosomes of the tea plant, with six genes located on unassembled contigs (Table 1, Figure 2A). Chr-10 contained the highest number of CsAQPs genes, whereas Chr-3, Chr-9, Chr-11, and Chr-13 each harbored only one gene. The different subfamilies of CsAQPs genes were spread across various chromosomes. To explore the evolutionary mechanisms underlying the expansion of the CsAQPs, we performed an intraspecies collinearity analysis. In total, 16 syntenic gene pairs were identified, indicating that 18 CsAQPs originated from gene duplication events (Figure 2B; Table S1). These results suggest that whole-genome segmental duplication played a major role in the expansion of the CsAQPs. The Ka/Ks ratios for all 16 duplicated gene pairs were less than 1 (Table S2), ranging from 0.0391 (CsTIP1;6/CsTIP1;4) to 0.3344 (CsPIP2;9/CsPIP2;10), showingthat they have undergone purifying selection. In addition to intraspecific collinearity, we also performed interspecific collinearity analysis among the tea plant, Arabidopsis thaliana, and Vitis vinifera (Figure 2C). A total of 17 syntenic gene pairs were detected between the tea plant and Arabidopsis thaliana, and 21 were shared with Vitis vinifera. Notably, 12 CsAQPs were conserved in syntenic blocks across species, including CsNIP4;1, CsPIP2;3, CsPIP2;6, and CsTIP1;2, suggesting that these orthologous pairs may have important functional or evolutionary roles.
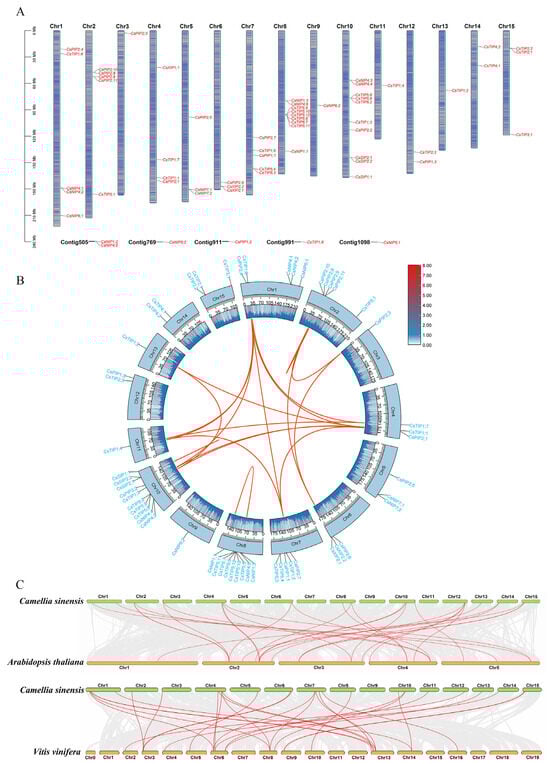
Figure 2.
Chromosomal location analysis, intraspecific and interspecific collinearity analysis of CsAQPs gene family members. (A) Chromosomal location analysis of CsAQPs. (B) Intraspecific collinearity analysis of CsAQP genes. The red curves show the gene pairs that have undergone segmental duplication; (C) Collinearity analysis of AQP genes between the tea plant genome and Arabidopsis thaliana, and Vitis vinifera genomes. The gray lines in the background indicate the collinearity blocks between species. The collinear gene pairs are linked with red lines.
2.3. Analysis of Gene Structure, Conserved Domains, and Motifs of CsAQPs Gene Family Members
To gain insights into the structural evolution and functional divergence of the CsAQPs gene family, the gene structures and conserved protein motifs were analyzed. Based on phylogenetic relationships, the 61 CsAQPs proteins were classified into five evolutionary branches, all exhibiting highly conserved motif patterns and domain architectures (Figure 3 and Figure S1). Twenty conserved motifs were identified (Figure S2). Most AQP proteins contained 10 motifs, while CsNIP7;1 and CsNIP7;2 had only two motifs each (Figure 3B). Generally, the SIPs have fewer conserved domains [28,29]; in this study, we found that CsSIPs had 3–4 motifs, with shared motifs 4 and 11, and motifs 1 and 3 were located near the C-terminus in CsSIP1s, whereas motif 15 was located at the N-terminus in CsSIP2s. Motif 1 and motif 2 correspond to the two NPA motifs located at LE and LB, which are closely related to the water transport activity of AQPs. CsTIP2;3, CsXIP1;1, CsSIP2;1 and CsSIP2;2 lack motif 1, while CsNIP6;2, CsNIP7;1, CsNIP7;2, and CsSIPs lack motif 2. Motif 6, which contains the highly conserved AEFxxT sequence in TM1 [3], was absent in CsSIPs, CsXIPs, CsTIP5;1, CsTIP5;2, CsTIP4;1, CsPIP2;5, CsNIP6;1, CsNIP6;2, CsNIP7;1, and CsNIP7;2. Exon–intron structure analysis revealed that the number of exons in CsAQPs ranged from two to nine (Figure 3D). Genes within the same clade showed similar exon–intron architectures, both in number and length. These findings suggest that the conserved gene structures and motif compositions of CsAQPs reflect their evolutionary relationships and are closely associated with functional similarities.
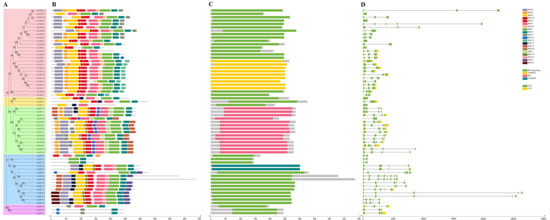
Figure 3.
Visualization of CsAQPs conserved domains in the tea plant. (A) The phylogenetic tree was constructed, TIP was covered by red, XIP was covered by yellow, PIP was covered by green, NIP was covered by blue, and SIP was covered by purple. (B) Conserved motif composition of CsAQP proteins. The motifs were colored with different colors. (C) Representation of different conserved protein domain families. (D) Gene structure analysis of CsAQPs genes.
2.4. Protein Structures and Substrate-Specific Residues of CsAQPs
In order to phylogenetically differentiate the five AQP subfamilies, the representative proteins of CsPIP1;1, CsTIP1;1, CsNIP1;1, CsSIP2;1, and CsXIP2;1 were selected for structural homology modeling prediction (Figure 4). Despite their distinct evolutionary lineages, most of the CsAQPs contained six transmembrane helices (Table 1). The tertiary structures of five representative CsAQPs were conserved, each featuring six transmembrane helices (TM1–TM6) that form an hourglass-shaped pore, a hallmark topology of the MIP superfamily. These helices are interconnected by five helical loops (HB1–HB5), together constituting a narrow aqueous channel traversing the membrane (Figure 4A). Two NPA motifs embedded in opposing half-helices converge at the pore center, generating a steric constriction point (Figure 4B). Pore radius calculations further revealed that the transmembrane helices form a constricted channel neck across the membrane (Figure 4C). The minimum diameters of these water channels ranged from 1.69 to 3.35 Å among the different isoforms (Figure 4D), which is critical for selective water permeation in AQPs.
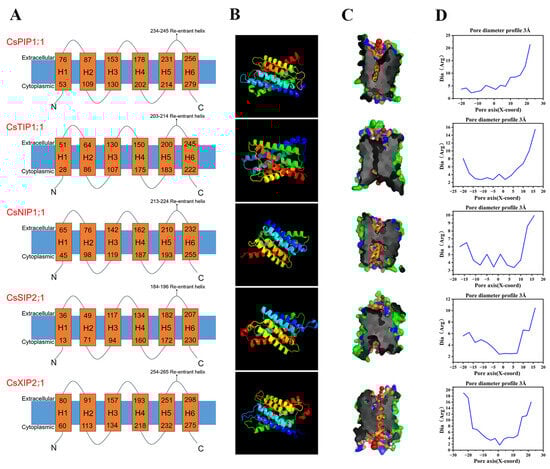
Figure 4.
Three-dimensional (3D) model prediction and pore analysis of five representative CsAQPs. (A) Transmembrane structure; (B) 3D structure of CsPIP1;1, CsTIP1;1, CsNIP1;1, CsSIP2;1 and CsXIP2;1. Models were constructed using the Phyre2 server; (C) The pore morphology; (D) Dimensions of CsAQPs proteins were analyzed by the PoreWalker software, which provides a cross-sectional view and pore size.
AQPs are primarily recognized for their role in transporting small molecules. Specific amino acid domains and residues within AQPs determine their selectivity in transporting substrates. Particularly, the two NPA motifs, the Ar/R filter, and Froger’s positions are crucial for the physiological functions of AQPs. The Ar/R filter was located on the extracellular side, where it contributes to substrate selectivity. Also, conserved R can form hydrogen bonds with H2O and repel H+ to maintain the proton potential gradient [15]. The Froger’s position consists of five amino acid residues, which can be used as a basis for screening AQPs with the ability to transport water and glycerol [17]. In this study, these key amino acid residues were investigated (Table 2). Interestingly, in CsPIP1-1, LB and LE were both NPA, the Ar/R filter was composed of FHTR, and Froger’s positions were composed of QSAFW. CsTIP1;1, LB, and LE were all NPA, and the Ar/R filter was composed of HIAV; Froger’s positions were composed of TSAYW. LB and LE in CsNIP1;1 were both NPA, and the Ar/R filter was composed of this WVAR; Froger’s positions were composed of FSAVL; in CsSIP2;1, LB and LE were NPL and NPA, LB alanine (A) was converted to leucine (L), and Ar/R filter was composed of S-GS, Froger’s positions was composed of FVAYW; in CsXIP2;1, LB and LE were NPI and NPA, LB alanine (A) was converted to isoleucine (I), and Ar/R filter was composed of IVAR, Froger’s positions was composed of VCAFW.
Table 2.
Amino acid compositions of the NPA motifs, Ar/R selectivity filters, and Froger’s positions of CsAQPs.
2.5. Protein–Protein Interaction Network of CsAQPs
Protein–protein interaction networks for CsAQPs were predicted using Arabidopsis thaliana orthologs (Figure S3). Analysis revealed orthologous relationships for 20 CsAQPs; five additional proteins interacted with multiple CsAQPs. CsPIPs displayed the strongest intra-subfamily interactions. Specific CsPIPs, including CsPIP2;3, CsPIP1;2, CsPIP1;3, CsPIP2;5, and CsPIP2;11, showed strong associations, indicating functional coordination between CsPIP1 and CsPIP2 subgroups. Strong interactions were also characterized within CsXIPs and CsTIPs. Moreover, we found that several CsAQPs were predicted to interact with the RING-type zinc finger protein NEP1-interacting protein 2 (NIP2). Members of PIP, TIP, NIP, and XIP subfamilies were connected to NAC domain-containing protein 91 (NAC091), a transcription activator essential for virus basal resistance [30]. Several AQP subfamily members were predicted to interact with PAMP-induced secreted peptide 1 (PIP1), an endogenous immune elicitor and defense regulator. This network analysis suggests that protein interactions may play a critical role in regulating AQP activity.
2.6. Analysis of Cis-Acting Elements in CsAQPs
In this study, cis-regulatory elements within 2000 bp promoter regions were analyzed to delineate transcriptional control mechanisms of CsAQPs expression in the tea plant. These cis-acting elements were categorized into seven classes: abiotic stress elements, biotic stress elements, cell cycle elements, circadian elements, core elements, light response elements, and tissue elements (Figure 5; Table S3). In total, 26 types of light-responsive elements, such as AAAC-MOTIF, I-Box, and LAMP elements, were predicted within the CsAQPs promoter regions. In addition, numerous stress-related elements, such as AREs, CGTCA motifs, and ABRE, were widely distributed among the CsAQPs members in the tea plant. Specifically, CsTIP5;4 contained nine ABRE elements, CsTIP5;3 had six ARE elements, and CsTIP1;7 had five CGTCA motifs. Moreover, certain elements involved in plant tissue-specific expression, like O2-sites, HD-Zip1, and NON-box, were identified in the promoters of CsAQPs, and more than half of the CsAQPs (32) contained at least one O2-sites on promoters, suggesting that CsAQPs genes play a significant role in tea plant growth and development. Additionally, circadian-related elements (e.g., MSA-like motifs) were also predicted in several genes.
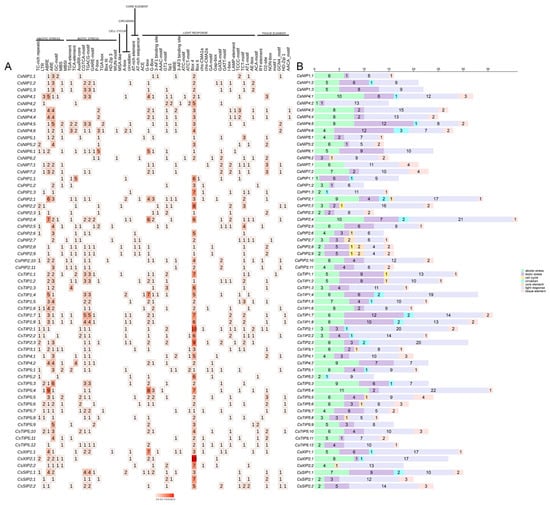
Figure 5.
Analysis of cis-acting element numbers in CsAQPs genes. (A) The different colors and numbers of the grid indicated the numbers of different promoter elements in CsAQPs genes. (B) The different colored histograms represented the sum of the cis-acting elements in each category.
2.7. Analysis of Tissue-Specific Expression of CsAQPs in Tea Plant
Expression patterns of CsAQPs across root, stem, bud, leaf, and flower tissues were analyzed using the transcriptomic dataset PRJEB39502, revealing four expression clusters (Figure 6). Group I genes showed detectable transcription in all tissues, with maximal accumulation in roots (CsTIP1;4, CsPIP1;3, and CsNIP5;1). Group II exhibited strictly root-specific expression (CsPIP2;2, CsTIP1;7, and CsTIP1;8) and minimal transcription elsewhere. Group III demonstrated the lowest overall expression, although six genes (CsNIP4;1, CsNIP4;2, CsNIP4;3, CsNIP4;4, CsTIP1;5, and CsTIP5;4) activated exclusively in autumn floral tissues, suggesting floral regulation roles. Group IV maintained moderate ubiquitous expression, with elevated accumulation in buds and stems (CsXIP2;1 and CsXIP2;2). Seasonal analysis further identified dynamic expression patterns: root, stem, and leaf tissues showed expression peaks in summer or winter (CsTIP1;3, CsTIP1;4, CsPIP2;2, CsPIP2;3). In buds, two divergent patterns were observed: elevated expression in spring/summer (CsPIP2;3, CsTIP1;2, CsPIP2;4) versus peaks in autumn/winter (CsXIP2;1, CsNIP5;1, CsTIP1;6). Floral tissues exhibited either spring/winter maxima (CsPIP2;4, CsPIP2;7) or autumn-specific upregulation (CsPIP1;3, CsPIP2;6).
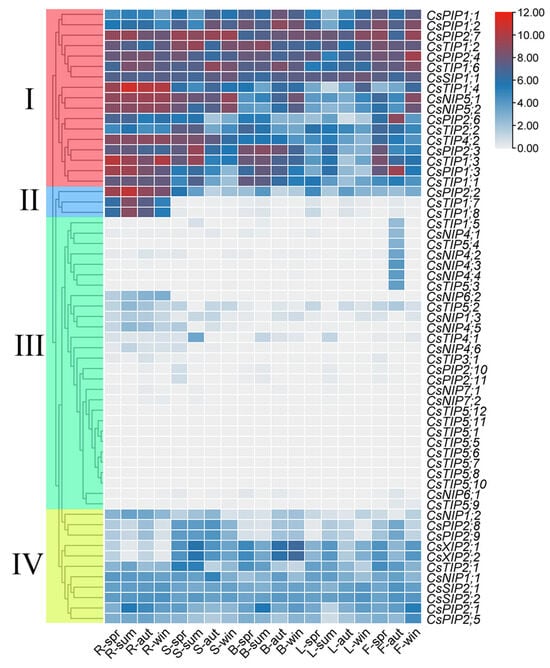
Figure 6.
Expression analysis of CsAQPs in different tissues in different seasons. The red and blue colors represent high and low expression levels, respectively. R: root; S: stem; B: bud; L: leaf; F: flower; spr: spring; sum: summer; aut: autumn; win: winter.Group I comprises the genes from CsPIP1;1 to CsTIP1;1; Group II, from CsPIP2;2 to CsTIP1;8; Group III, from CsTIP1;5 to CsTIP5;9; and Group IV, from CsNIP1;2 to CsPIP2;5.
2.8. Expression Analysis of CsAQPs in Tea Plant Response to Abiotic Stresses
Abiotic stress frequently impacts tea plant growth stages, ultimately reducing yield and quality. To elucidate CsAQPs genes’ roles in abiotic stress responses, in this study, their expression patterns under drought, salinity, cold, and aluminum treatments were investigated. Transcriptome data from drought-stressed plants, with leaves and roots sampled at 0, 3 h, 6 h, 1 d, 3 d, and 7 d for RNA-Seq, were analyzed. As shown in Figure 7A, most CsAQPs in leaves were significantly downregulated during the first 6 h of drought stress, but their expression increased as the treatment was prolonged to 3 d and 7 d. For instance, the expression of CsPIP1;2, CsPIP1;3, CsPIP2;4, and CsPIP2;7 decreased markedly at 3 h and/or 6 h but was substantially induced at 3 d and/or 7 d. In contrast, the expression of CsNIP1;1, CsPIP2;8, CsPIP2;9, CsPIP2;11, CsTIP1;1, CsTIP1;3, and CsXIP2;1 remained suppressed in leaves under drought, whereas CsTIP1;6 and CsTIP1;4 were upregulated with prolonged stress. A similar trend was observed in roots, where most genes were downregulated early but upregulated after 1 d. Specifically, genes such as CsNIP1;3, CsPIP2;6, CsTIP1;1, and CsTIP4;2 were downregulated, while CsPIP1;2, CsPIP2;1, CsPIP2;2, CsPIP2;4, CsTIP1;4, CsTIP1;6, CsTIP1;8, CsTIP2;2, CsTIP2;3, and CsSIP2;1 were induced. Furthermore, changes in CsAQPs expression were generally more pronounced in roots than in leaves (Figure 7A).
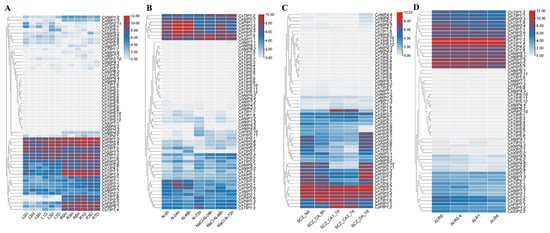
Figure 7.
Expression analysis of CsAQPs in different abiotic stresses and Al treatments. (A) Expression analysis of CsAQPs in response to drought treatments. The clustering was performed based on the log2 fold change for each gene in a comparison between the stressed and control conditions. L: leaf, R: root, H: hour, D: day. Drought stress imposed via 25% polyethylene glycol (PEG) 6000; (B) Expression analysis of CsAQPs in response to salinity treatments. The clustering was performed based on the log2 fold change for each gene in a comparison between the stressed and control conditions. N: control conditions, NaCl: salt stress imposed via 200 mM NaCl; (C) Expression analysis of CsAQPs in response to cold stress. NA (Unacclimated, growing at 25 °C), CA6 h (Fully acclimated, growing at 10 °C for 6 h), CA1–7 d (Domesticated, growing at 10/4 °C at day/night for 7 days), CA2–7 d (Domesticated, growing at 4/0 °C at day/night for 7 days) and DA-7 d (Recovering at 25 °C for 7 days); (D) Expression analysis of CsAQPs in response to different Al doses (0, 0.4, 1 and 4 mmol L−1). The clustering was performed based on the log2 fold change for each gene in a comparison between the stressed and control conditions.
Salt stress induced downregulation in most CsAQPs compared to unstressed controls (Figure 7B). Nearly all CsPIPs and CsTIPs members decreased under salt stress. Notably, CsNIP1;1, CsNIP5;1, CsNIP5;2, CsTIP1;2, CsTIP4;1, CsTIP4;2, CsXIP2;1, and CsSIP1;1 exhibited upregulated expression during salt treatment, suggesting potential involvement in tea plant salt resistance.
Transcriptome data from cold treatments in five phases—control, acute cold, CA1-7 d, CA2-7 d, and recovery—revealed CsAQPs responses in tea plants (Figure 7C). Most genes showed repression during cold exposure but increased after recovery. Conversely, CsPIP1;1, CsPIP1;2, CsTIP1;2, CsTIP1;4, CsTIP1;6, CsSIP2;1, and CsSIP2;2 exhibited significant induction, suggesting cold stress involvement. Given the known aluminum tolerance of tea plants, we also analyzed CsAQPs expression under Al treatments (Figure 7D). Increasing aluminum concentrations downregulated 19 genes and upregulated 5 genes. Specifically, CsNIP1;1, CsPIP2;2, CsTIP1;4, and CsTIP1;6 expression decreased progressively with higher Al3+ doses, while CsNIP4;1, CsTIP4;1, CsTIP4;2, CsPIP2;7, and CsSIP1;1 increased. Most genes remained unaffected by aluminum exposure. These findings identify key candidate genes potentially involved in regulating tea plant responses to abiotic stress.
2.9. Expression Analysis of CsAQPs in Tea Plant Response to Biotic Stresses
Anthracnose (infected by Colletotrichum camelliae) and gray blight (infected by Pestalotiopsis theae (Sawada) Steyaert) are major fungal diseases that severely impact tea plant growth [31,32]. It has been well recognized that AQP genes play a crucial role in plant response to disease resistance. In this study, we investigated the expression patterns of CsAQPs following infection with these pathogens. As shown in Figure 8, the expression of most genes did not change significantly compared with healthy controls. However, after anthracnose infection, CsPIP1;1, CsPIP1;2, CsPIP2;1, CsPIP2;3, CsPIP2;4, CsTIP1;1, CsTIP1;4, CsTIP1;6, and CsTIP2;2 expressions were upregulated, while CsNIP1;1 and CsPIP1;3 were downregulated (Figure 8A), suggesting their potential involvement in the response to anthracnose. Upon gray blight infection, the transcription levels of CsNIP5;1, CsNIP5;2, CsPIP1;3, CsPIP2;3, CsPIP2;4, CsPIP2;8, CsTIP2;2, and CsXIP2;1 were upregulated, whereas CsPIP1;1 and CsPIP2;10 were downregulated (Figure 8B). These results indicate that certain CsAQPs, especially specific CsPIPs members, are involved in the tea plant’s defense responses against fungal pathogens.
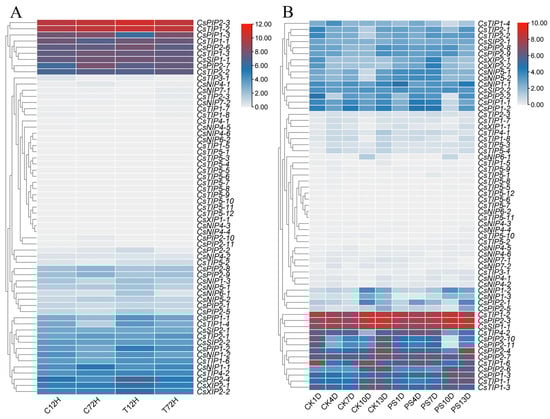
Figure 8.
Expression analysis of CsAQPs in different biotic stresses. (A) Expression analysis of CsAQPs in response to anthracnose. The clustering was performed based on the log2 fold change for each gene in a comparison between the stressed and control conditions. C represents inoculation with sterile water; T represents the tea leaves after Colletotrichum camelliae inoculation; (B) Expression analysis of CsAQPs in response to gray blight. The clustering was performed based on the log2 fold change for each gene in a comparison between the stressed and control conditions. CK represents inoculation with sterile water; PS represents inoculation with the spore suspension of Pseudopestalotiopsis sp. at a concentration of 107 conidia/mL.
2.10. Expression Analysis of CsPIPs in Tea Plant Response to Abiotic Stresses by qRT-PCR
In this study, the expression patterns of ten CsPIPs were selected and determined using qRT-PCR. As shown in Figure 9, under drought stress, the expression levels of most CsPIPs exhibited downregulation patterns, especially CsPIP1;3, CsPIP2;7, CsPIP2;8, and CsPIP2;9 were significantly repressed; whereas the expression levels of CsPIP1;1, CsPIP2;2, and CsPIP2;4 were upregulated. Moreover, the expression levels of CsPIP1;1, CsPIP2;1, CsPIP2;3, and CsPIP2;6 were dramatically induced by salt treatment; the transcription of CsPIP1;3, CsPIP2;7, CsPIP2;8, and CsPIP2;10 was totally repressed under salt stress. Interestingly, most of the genes were upregulated by cold treatment, especially CsPIP2;1, CsPIP2;2, CsPIP2;3, CsPIP2;4, CsPIP2;8, and CsPIP2;10.
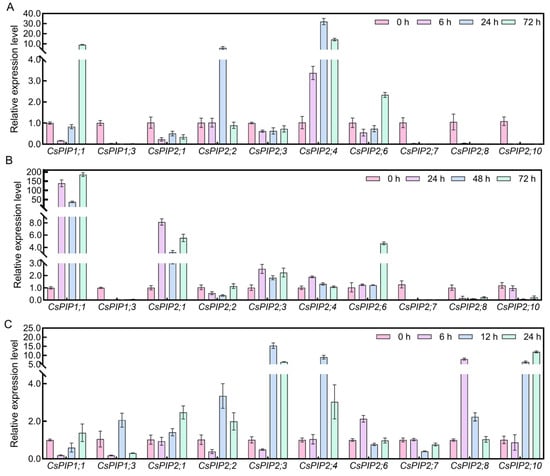
Figure 9.
Expression analysis of CsPIPs in response to abiotic stress by using qRT-PCR detection (A) Relative expression level of CsPIPs in response to drought stress. (B) Relative expression level of CsPIPs in response to salt stress. (C) Relative expression level of CsPIPs in response to cold stress.
2.11. Functional Analysis of CsPIPs in the Yeast System
The yeast expression system serves as a valuable tool for investigating protein function. Indeed, this system has proven instrumental in elucidating the biological roles of key proteins in eukaryotes [33,34]. To further investigate the functions of CsPIPs, ten CsPIPs were cloned into the pYES2-GFP vector and transformed into the yeast strain NMY51. In spot assays under NaCl stress, yeast expressing CsPIP2;8 and CsPIP2;10 showed growth sensitivity, whereas strains expressing CsPIP1;3, CsPIP2;1, CsPIP2;2, and CsPIP2;4 exhibited high tolerance (Figure 10A). Under drought stress simulated using a medium containing 800 mM mannitol, yeast expressing CsPIP2;1, CsPIP2;2, CsPIP2;6, and CsPIP2;7 formed larger colonies than the control, while the growth of yeast carrying CsPIP1;3, CsPIP2;3, and CsPIP2;8 was inhibited (Figure 10A). Given the reported role of PIPs in H2O2 transport, we also assessed the H2O2 transport capability of CsPIPs. Among the transgenic yeast strains, the growth of those expressing CsPIP2;1, CsPIP2;3, CsPIP2;6, CsPIP2;8, and CsPIP2;10 was significantly inhibited under H2O2 stress. In particular, CsPIP2;3 expressing yeast showed high sensitivity to H2O2, suggesting that these CsPIPs may facilitate H2O2 transport (Figure 10B).
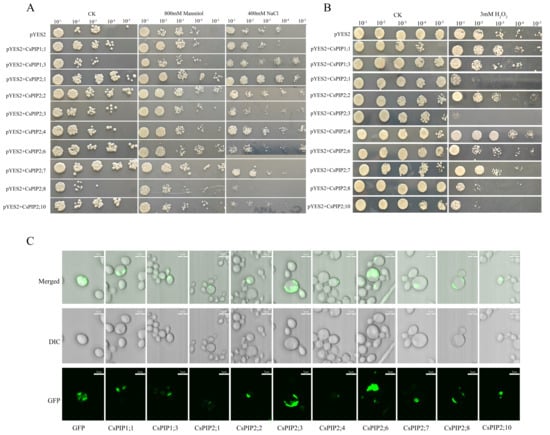
Figure 10.
Functional analysis of CsPIPs in transgenic yeast. CsPIPs were constructed into the pYES2-GFP and transformed into the yeast strain NMY51. (A) Diluted yeast cells were spotted on SD-URA plates with 400 mM NaCl, 800 mM mannitol. (B) Diluted yeast cells were spotted on SD-URA plates with 3 mM H2O2. (C) The subcellular localization of CsPIPs in yeast cells.
3. Discussion
AQPs are crucial transmembrane channels that facilitate the transport of water and small solutes in plants. While a subset of 20 CsAQPs had been previously identified in the tea plant [25], a comprehensive genomic overview was lacking. Our genome-wide analysis now reveals a notable expansion of this family in the tea plant, with 61 identified CsAQP genes. This number exceeds that of many other species (Figure 1A), a phenomenon potentially linked to the Polemonioids–Primuloids-core Ericales (PPC) whole-genome duplication event, which may have amplified genetic material pertinent to stress adaptation and specialized metabolism [35]. This expansion appears to have been driven by various duplication events, with purifying selection (Ka/Ks < 1) playing a major role in shaping the family’s evolution, suggesting strong functional constraints on most members. Furthermore, the substantial collinearity observed with species like Vitis vinifera underscores deep evolutionary conservation, while the unique expansions highlight lineage-specific adaptations in the tea plant.
The composition of the CsAQP family, featuring five subfamilies (PIPs, TIPs, NIPs, SIPs, and XIPs) with a notable expansion of CsTIPs, aligns with patterns observed in other perennial plants like Actinidia chinensis, Glycine max, and Populus trichocarpa (Figure 1A) but contrasts with the dominance of PIPs in cucumber [36] or NIPs in sugar beet [28]. Interestingly, three CsSIPs and three CsXIPs genes were also identified from the tea plant, and each of them could be divided into two groups. Gene structures and protein motifs exhibited high conservation within subfamilies. This structural diversity with sequence conservation may reflect functional heterogeneity among isoforms. The functional differentiation among subfamilies, with PIPs and TIPs governing the transport of water and key signaling molecules like H2O2 and CO2 [1], NIPs facilitating the uptake of beneficial metalloids like silicic and boric acid, and SIPs/XIPs handling substrates such as glycerol and urea [37]—collectively equips the tea plant to precisely manage a wide array of solutes. This functional diversity, stemming from gene family expansion and divergence, likely constitutes a critical molecular foundation for the tea plant’s adaptation to diverse environmental challenges.
Such functional diversity likely supports environmental adaptation during speciation. For instance, it has been reported that the domesticated olive (Olea europaea) contains more AQP genes than its wild relatives [38]. Therefore, CsAQPs gene expansion represents a critical mechanism for evolutionary adaptation in tea plants. In this study, we also investigated the potential CsPIPs in H2O2 transportation using yeast cells and identified CsPIP2;1, CsPIP2;3, CsPIP2;6, CsPIP2;8, and CsPIP2;10 as having a high ability to transporting H2O2 (Figure 10B), suggesting that these genes may play important roles in tea plant response to stress by modulating H2O2 transportation.
The molecular architecture of aquaporins is evolutionarily conserved across plants, and tea plant CsAQPs are no exception. Most CsAQPs retain the characteristic six transmembrane α-helices that form the aqueous pore, with cytoplasmic N- and C-termini. Critically, all identified CsAQPs contain at least one conserved NPA (Asn-Pro-Ala) motif (Figures S1 and S2). The NPA constriction governs substrate size permeability, while Ar/R filters and P1-P5 residues determine substrate specificity [15,39]. CsAQPs display 17 distinct Ar/R filter types (Table 2), exceeding the nine types in Arabidopsis thaliana’s 35 AQPs, indicating greater substrate transport diversity. For instance, CsNIP1;2 shares the WVAR Ar/R filter with AtNIP1;2 [40] and Prunus avium NIP1;1 [41], suggesting conserved transport functions. CsPIPs contain water-transporting FHTR filters, documented to transport CO2, boric acid, urea, and H2O2 in other species [42]. CsTIP1s (HIAV filter) and CsTIP2s (HIGR filter) resemble orthologs, indicating potential H2O2 or urea/ammonia transport roles [43]. Pore feature prediction revealed channel diameters of 1.69–3.35 Å, enabling broad substrate permeability that supports functional diversity. Protein–protein interaction predictions showed that AQPs had strong interactions with each other, particularly between members of the CsPIP1 and CsPIP2 subfamilies, indicating that the formation of hetero- or homotetrameric complexes is a key regulatory mechanism for trafficking and function [44]. Furthermore, several CsAQPs were also predicted to interact with proteins such as the NAC091 transcription factor, PIP1, and NEP1-interacting protein 2 (Figure S3), suggesting potential roles in biotic stress responses. Similar functional interactions have been reported in papaya, where TIPs interact with PAT proteins and NIPs bind to ACR proteins [45]. Together, these findings implicate CsAQPs in a wide range of physiological processes in the tea plant.
In tea plants, CsAQPs were predicted to have a high possibility of being located in the plasma membrane, vacuole, and endoplasmic reticulum, indicating their diverse functions in plants. In this study, we determined the subcellular localization of CsPIPs in yeast, showing they were mainly located in the plasma membrane (Figure 10C). Except for their subcellular localization diversity, CsAQPs exhibit tissue-specific expression patterns in tea plants. Most expressed genes showed elevated transcript levels in roots, indicating fundamental roles in water diffusion or root regulatory functions. In support of a role in root development, CsTIPs demonstrated particularly high root abundance. Reinhardt et al. indicated that tonoplast-localized AtTIP1;1, AtTIP1;2, and AtTIP2;1 facilitate lateral root formation in Arabidopsis thaliana [46]. Conversely, CsPIP2;7, CsPIP2;4, CsPIP2;6, and CsPIP1;3 displayed higher floral expression, implying a potential role in flowering regulation. This is consistent with studies in rose and other species, where PIP genes have been critically implicated in flowering control [47,48,49,50]. Genes including CsPIP2;3, CsTIP1;2, and CsTIP1;6 exhibited increased bud expression, aligning with prior evidence of their functions in bud dormancy cycles [25]. Interestingly, the expression patterns of several genes varied with seasonal changes across different tissues, indicating that these genes may play critical roles in the tea plant’s adaptation to environmental fluctuations.
The presence of diverse abiotic and biotic stress-responsive cis-acting elements in the promoters of CsAQPs suggests their central role in the tea plant’s transcriptional reprogramming upon stress perception. Our expression profiling under various stress conditions revealed a complex regulatory landscape, characterized by a predominant downregulation of most CsAQPs. This widespread suppression may represent a conserved strategy to minimize water and solute loss by reducing membrane permeability under adverse conditions, a phenomenon observed in tea plants [25] and other species [28,40,51,52]. In contrast, the significant upregulation of a subset of CsAQPs points to their specialized roles in stress adaptation. These distinct expression profiles suggest that CsAQPs play critical roles in maintaining cellular water homeostasis during adverse conditions. Growing evidence indicates that AQPs facilitate H2O2 transport, which is involved in stress signaling and growth regulation. For instance, in melon, CmPIP2;3 enhances cold tolerance via CmABF2/3-mediated H2O2 transport [53]. Similarly, OsPIP2;2 in rice regulates innate immunity through H2O2 signaling [54] and in Pyrus betulaefolia, a PbERF3–PbHsfC1a–PbNCED4–PbPIP1;4 regulatory module mediates drought adaptation via H2O2 transport [55]. In this study, we detected the expression levels of CsPIPs in response to drought, salt, and cold stress (Figure 10) and identified that CsPIP1;1, CsPIP2;1, CsPIP2;3, CsPIP2;4, and CsPIP2;10 might be closely related to tea plant stress responsiveness. Moreover, the H2O2 transport ability assay in yeast showed that CsPIP2;3 and CsPIP2;10 could transport H2O2 in the tea plant (Figure 10B), indicating their potential roles in the tea plant response to stress. Interestingly, stress-responsive AQP expression is further modulated by ABA, trehalose, and other signaling molecules. Particularly, we found that there are many ABA-related cis-elements, including ARE and ABRE, identified in the promoters of CsAQPs. Although ABA treatment responses were not experimentally tested here, prior work confirms ABA-mediated regulation of several CsAQPs. These findings collectively indicate that ABA-dependent CsAQPs responses are critical for tea plant stress adaptation.
Additionally, tea plants exhibit high Al tolerance and are recognized as Al hyperaccumulators. AQPs have been validated to transport Al in plants. In this study, we analyzed the expression patterns of CsAQPs under Al treatment to identify candidates involved in Al transport. Results showed downregulation of most genes, while the expressions of CsNIP4;1, CsTIP4;1, CsTIP4;2, CsPIP2;7, and CsSIP1;1 were upregulated. In Arabidopsis thaliana, the expression of AtNIP1;2 is rapidly induced by Al stress, and loss-of-function mutants display increased Al sensitivity, indicating its role in Al uptake, translocation, and tolerance [56]. Notably, AtNIP1;2 contains a WVAR signature in its Ar/R selectivity filter, identical to motifs in CsNIP4;1 and CsNIP4;2. Previous studies also report induced CsNIPs transcription during Al treatments in the tea plant [57]. These upregulated CsAQPs, particularly CsNIPs, may contribute significantly to tea plant Al resistance.
It has been well known that AQPs control plant innate immunity via mediating H2O2 transport into the plant cell. Anthracnose and gray blight represent key fungal diseases in tea plants. Transcriptomic and proteomic studies have explored tea plant responses to these pathogens, yet key regulatory genes remain unidentified. Analysis revealed significant upregulation of several CsPIPs, CsTIPs, and CsNIPs genes during both infections under biotic stress. Crucially, the transcription levels of CsPIP2;1, CsPIP2;3, and CsPIP2;10 increased during infections, and they were determined to facilitate H2O2 transport in tea plants (Figure 10B), indicating their crucial roles in tea plants’ pathogen response. This aligns with established PIP functions in biotic stress adaptation: rice OsPIP2;2 mediates H2O2 transport to regulate immunity [54], while phosphorylated TaPIP2;10 enables cytoplasmic H2O2 transport for enhanced defense in wheat [58]. Collectively, our findings present a systematic characterization of the CsAQPs family in the tea plant, establishing a critical foundation for future functional studies.
4. Materials and Methods
4.1. Identification of AQP Genes in Tea Plant
The whole genome of the tea plant was downloaded from the TPIA (http://tpia.teaplants.cn/ (accessed on 24 January 2024)). The protein sequences of AQPs in the Arabidopsis thaliana (http://www.arabidopsis.org/index.jsp (accessed on 28 February 2024)), Vitis vinifera (http://bioinformatics.psb.ugent.be/orcae/ (accessed on 4 April 2024)), Vigna angularis (https: //www.ncbi.nlm.nih.gov/genome/?term=vigna%20angularis (accessed on 11 April 2024)), were used as queries in this research. The protein sequences of 35 AQP genes identified in Arabidopsis thaliana were BLASTed against the entire protein sequence of the tea plant to obtain candidate CsAQPs gene protein sequences. Because XIP does not exist in Arabidopsis thaliana, we used Vitis vinifera XIPs for blast searching. After predicting conserved domains and removing genes that lacked these domains, 61 CsAQPs gene family members were identified. The physicochemical properties of the CsAQPs family members’ proteins were predicted using the ProtParam (https://web.expasy.org/protparam/ (accessed on 15 April 2024)) and ProtScale (https://web.expasy.org/protscale/ (accessed on 15 April 2024)) analysis tools. Transmembrane helices were predicted using DeepTMHMM-1.0 services (https://services.healthtech.dtu.dk/services/DeepTMHMM-1.0/ (accessed on 15 May 2024)).
4.2. Gene Structure, Motif Composition, and Domains Analysis in Tea Plant
The protein sequences of the CsAQPs gene family were analyzed using the MEME (https://meme-suite.org/meme/tools/meme (accessed on 20 April 2024)) to identify the conserved motifs. The gene family’s motifs were visualized using TBtools visualization module [59]. The conserved domains of the CsAQPs gene family members were exported using the Batch-CD-Search function of NCBI and visualized with TBtools.
4.3. Phylogenetic Tree Analysis of CsAQPs Gene Family Members
The AQP gene family sequences were extracted from the whole genomes of Vitis vinifera, Arabidopsis thaliana, and Vigna angularis. An unrooted phylogenetic tree was constructed using MEGA11 [60] with the neighbor-joining method based on the LG model, and 1000 bootstrap test replicates were used during the construction. The phylogenetic tree was illustrated using Evolview v3 (https://www.evolgenius.info/evolview/#/ (accessed on 16 December 2024)). The combined tree was generated to systematically classify AQPs, and the systematic names were assigned based on their evolutionary relationships.
4.4. Chromosome Localization and Gene Duplication Analysis of CsAQPs Gene Family Members
Synteny files were analyzed with default parameters using TBtools, and the synteny map of the tea plant was visualized using TBtools. The GFF3 file of the tea plant was analyzed and visualized using TBtools to determine chromosomal locations. The number of synonymous substitutions per synonymous site (Ka), the number of nonsynonymous substitutions per nonsynonymous site (Ks), and the p-value from Fisher’s exact test of neutrality were calculated using TBtools. A Ka/Ks ratio <1 indicates purifying selection, a Ka/Ks ratio = 1 indicates neutral selection, and a Ka/Ks ratio >1 indicates positive selection. The Ks value was calculated for the AQP homologous gene pairs and was used to calculate the gene duplication age T = Ks/2λ, λ = 6.5 × 10⁻⁹.
4.5. Prediction of Protein 3D Structures
Five CsAQPs protein sequences were submitted to the Phyre2 server (https://www.sbg.bio.ic.ac.uk/phyre2/html/page.cgi?id=index (accessed on 12 February 2025)) to predict the three-dimensional (3D) structures under ‘Normal’ mode based on homologous modeling. The CsPIP1;1 model was constructed based on the Spinacia oleracea PIP2;1 template, with a sequence identity of 72%. The CsTIP1;1 model was constructed based on the Arabidopsis thaliana AtTIP2;1 template, with a sequence identity of 59%. The CsNIP1;1 model was constructed based on the Oryza sativa NIP2;1 template, with a sequence identity of 48%. The CsSIP2;1 model was constructed based on the Homo sapiens SIP2;1 template, with a sequence identity of 21%. Finally, the CsXIP2;1 model was also constructed based on the Homo sapiens Aquaporin-5, with a sequence identity of 28%. Subsequently, the predicted protein models and pore morphology were confirmed using the program in the PoreWalker. PoreWalker [61] (https://www.ebi.ac.uk/thornton-srv/software/PoreWalker/ (accessed on 12 February 2025)) with the protein database file (Protein Data Bank, PDB format) generated by Phyre 2. All line charts were generated using Origin 2025b.
4.6. Interaction Network Construction of CsAQPs
The STRING (http://string-db.org/cgi (accessed on 3 January 2025)) database was used to predict the interaction network of CsAQPs based on their orthologs in the model plant Arabidopsis thaliana. The minimum required interaction score was set to 0.70, and the maximum number of interactors was set to no more than 5.
4.7. Analysis of Regulatory Cis-Acting Elements
To further analyze the regulatory mechanisms of the CsAQPs genes in the tea plant in response to stress and growth and development, the sequence of the region 2000 bp upstream of the translation start site of the CsAQPs genes was extracted from the whole genomes of Camellia sinensis cv. Shuchazao and the putative cis-acting elements were identified through the PlantCARE program (https://bioinformatics.psb.ugent.be/webtools/plantcare/html/ (accessed on 29 May 2024)). The cis-acting elements involved in abiotic stress responses, biotic stress responses, tissue element, light response element, the circadian rhythm, cell cycle, and core promoter elements were summarized and analyzed.
4.8. Expression Pattern Analysis of CsAQPs Under Stresses Using Transcriptome Data
Six publicly available RNA sequencing (RNA-seq) datasets were downloaded from the Short Read Archive of the NCBI database for expression analysis in different tissues of the tea plant (project accession number: PRJEB39502), in response to drought stress (project accession number: PRJCA012395), in response to cold stress (project accession number: PRJNA387105), in response to salinity (project accession number: PRJEB11522), in response to Al treatment (project accession number: PRJNA517582), and in response to anthracnose (project accession number: PRJNA595772) and gray blight (project accession number: PRJNA564655). A heatmap was generated and visualized using TBtools software. The color scale shown with the heatmap represents the TPM counts, and the ratios were log2 transformed.
4.9. Quantitative Real-Time PCR (qRT-PCR) Analysis of the Expression Patterns of CsPIPs in Response to Abiotic Stresses
Healthy, uniformly growing one-year-old clonal tea plant seedlings, Camellia sinensis cv. Fudingdabaicha were used to perform drought, salt, heat, and cold stress treatments as described by our previous reports [62]. To initiate the drought and salt stresses, tea plants were cultured in a nutrient solution (Coolaber, NSP1030) for at least four weeks until the tea plants grew new roots. The hydroponic solution with 25% (w/v) polyethylene glycol (PEG) 6000 was used to carry out drought stress, and the samples at 0 h, 6 h, 24 h, and 72 h were collected for gene detection. The hydroponics solution with 200 mM NaCl was used to induce salt stress, and the samples at 0 h, 24 h, 48 h, and 72 h were collected for analysis. To initiate cold stress, the tea plants were pre-cultured in the growth chambers (temperature: 25 ± 2 °C, light/dark: 14/10 h, humidity: 75 ± 5%, light intensity: 200 mmol m−2 s−1) for four weeks. After that, tea plants were transferred into growth chambers with 4 °C for cold treatment, and the samples at 0 h, 6 h, 12 h, and 24 h were used for the analysis. For sampling, the top of third leaves were collected and immediately frozen in liquid nitrogen and stored at −80 °C until RNA extraction. Each treatment was carried out in triplicate.
For gene expression analysis, total RNA was extracted using an RNAprep Pure Plant Kit (Tiangen, Beijing, China), and qRT-PCR detection was conducted as previously described using an SYBR Green PCR Kit (Takara, Beijing, China) on a QuanStudioTM 1 Real-Time PCR instrument [63]. The CsActin gene was used as the internal reference [64]. Gene-specific primers were designed using Primer Premier 6.0 software and listed in Table S4. Relative gene expression levels were calculated using the 2−∆∆Ct method [65].
4.10. Transformation and Functional Analysis of CsPIP Genes in Yeast
To investigate the function and subcellular localization of CsPIP genes, these genes were transformed into yeast. The coding sequences of CsPIP genes were amplified using PrimeSTAR® GXL DNA Polymerase (Takara, Beijing, China) and cloned into the vector pYES2-green fluorescent protein (GFP) using the In-Fusion® Snap Assembly Master Mix (Takara, Beijing, China) using primers listed in Table S4. The constructed plasmids and the empty plasmid were then transformed into the yeast strain NMY51 by the lithium acetate method. The positive transformants were selected after culturing at 29 °C for 3 days on synthetic dropout medium-uracil (SD-URA) media with 2% (w/v) glucose. CsPIP-transformed yeast cell functional analysis and subcellular localization assays were conducted as previously described [66]. Briefly, yeast cells were incubated on SD-URA liquid medium at 29 °C for 24 h and then diluted with sterile water to OD 600 of 1.0, 1 × 10⁻¹, 1 × 10⁻², 1 × 10⁻³, 1 × 10⁻⁴ and 1 × 10⁻⁵ and then spotted on the SD-URA solid medium with 2% (w/v) galactose and 1% (w/v) raffinose with or without 3 mM H2O2, 800 mM mannitol, and 400 mM NaCl. The treated yeast cells were cultured at 29 °C for 3–4 days for analysis. To visualize the subcellular localization of CsPIPs in yeast, cells were directly aspirated and imaged through the GFP channel using an Olympus FV3000 laser confocal microscope.
5. Conclusions
In this study, 61 CsAQPs genes were identified from the tea plant genome. Their bioinformation characteristics, including encoded proteins, gene structures, chromosomal distributions, phylogenetic relationships, conserved motifs, and cis-acting elements, were comprehensively investigated. Like other plants, CsAQPs were classified into five subfamilies (PIP, TIP, NIP, SIP, and XIP). Expression profiling revealed tissue-specific and seasonal dynamics of CsAQPs, along with their responses to abiotic stresses (cold, drought, salinity), aluminum exposure, and biotic stresses (anthracnose, gray blight). Moreover, the potential functions of CsPIPs were investigated in yeast cells, and the key CsPIPs involved in H2O2 transport were identified. These findings highlight several candidate genes with significant regulatory roles under stress conditions. Overall, this work provides a foundational resource for elucidating the functional diversity of CsAQPs in the tea plant and prioritizes key targets for future mechanistic studies on their roles in stress adaptation and substance transport.
Supplementary Materials
The following supporting information can be downloaded at: https://www.mdpi.com/article/10.3390/plants14243786/s1, Figure S1: Sequences alignment of CsAQPs; Figure S2: The sequence of 20 motifs; Figure S3. Protein interaction network of CsAQPs in the tea plant based on the STRING database. Table S1: Gene duplication event analysis of CsAQPs; Table S2: The Ka/Ks ratios of CsAQPs collinearity gene pairs in tea plant; Table S3: Analysis of cis-acting element in CsAQPs genes; Table S4: Primers used in this study.
Author Contributions
Funding acquisition, C.Y.; Investigation, H.W., J.T., H.S., S.C., and C.Y.; Methodology, H.W., J.T., H.S., S.C., H.C., and C.Y.; Resources, H.W.; Supervision, C.Y.; Visualization, H.C.; Writing—original draft, H.W. and C.Y.; Writing—review and editing, C.Y. All authors have read and agreed to the published version of the manuscript.
Funding
This research was funded by the National Natural Science Foundation of China (32372762), Chongqing Technology Innovation and Application Demonstration Project (CSTB2025TIAD-KPX0072), and Fundamental Research Funds for the Central Universities (SWU-KR22016, SWU-XDJH202316).
Data Availability Statement
Data is contained within the article and Supplementary Materials.
Conflicts of Interest
The authors declare no conflicts of interest.
References
- Maurel, C.; Boursiac, Y.; Luu, D.T.; Santoni, V.; Shahzad, Z.; Verdoucq, L. Aquaporins in plants. Physiol. Rev. 2015, 95, 1321–1358. [Google Scholar] [CrossRef] [PubMed]
- Assmann, S.M.; Jegla, T. Guard cell sensory systems: Recent insights on stomatal responses to light, abscisic acid, and CO2. Curr. Opin. Plant Biol. 2016, 33, 157–167. [Google Scholar] [CrossRef] [PubMed]
- Hove, R.M.; Bhave, M. Plant aquaporins with non-aqua functions: Deciphering the signature sequences. Plant Mol. Biol. 2011, 75, 413–430. [Google Scholar] [CrossRef] [PubMed]
- Maurel, C.; Santoni, V.; Luu, D.T.; Wudick, M.M.; Verdoucq, L. The cellular dynamics of plant aquaporin expression and functions. Curr. Opin. Plant Biol. 2009, 12, 690–698. [Google Scholar] [CrossRef]
- Tyerman, S.D.; Niemietz, C.M.; Bramley, H. Plant aquaporins: Multifunctional water and solute channels with expanding roles. Plant Cell Environ. 2002, 25, 173–194. [Google Scholar] [CrossRef]
- Danielson, J.Å.; Johanson, U. Unexpected complexity of the Aquaporin gene family in the moss Physcomitrella patens. BMC Plant Biol. 2008, 8, 45. [Google Scholar] [CrossRef]
- Shivaraj, S.M.; Deshmukh, R.; Bhat, J.A.; Sonah, H.; Bélanger, R.R. Understanding aquaporin transport system in Eelgrass (Zostera marina L.), an aquatic plant species. Front. Plant Sci. 2017, 8, 1334. [Google Scholar] [CrossRef]
- Johanson, U.; Karlsson, M.; Johansson, I.; Gustavsson, S.; Sjövall, S.; Fraysse, L.; Weig, A.R.; Kjellbom, P. The complete set of genes encoding major intrinsic proteins in Arabidopsis provides a framework for a new nomenclature for major intrinsic proteins in plants. Plant Physiol. 2001, 126, 1358–1369. [Google Scholar] [CrossRef]
- Deshmukh, R.K.; Vivancos, J.; Ramakrishnan, G.; Guérin, V.; Carpentier, G.; Sonah, H.; Labbé, C.; Isenring, P.; Belzile, F.J.; Bélanger, R.R. A precise spacing between the NPA domains of aquaporins is essential for silicon permeability in plants. Plant J. 2015, 83, 489–500. [Google Scholar] [CrossRef]
- Sakurai, J.; Ishikawa, F.; Yamaguchi, T.; Uemura, M.; Maeshima, M. Identification of 33 rice aquaporin genes and analysis of their expression and function. Plant Cell Physiol. 2005, 46, 1568–1577. [Google Scholar] [CrossRef]
- Zhang, D.Y.; Ali, Z.; Wang, C.B.; Xu, L.; Yi, J.X.; Xu, Z.L.; Liu, X.Q.; He, X.L.; Huang, Y.H.; Khan, I.A.; et al. Genome-wide sequence characterization and expression analysis of major intrinsic proteins in Soybean (Glycine max L.). PLoS ONE 2013, 8, e56312. [Google Scholar] [CrossRef] [PubMed]
- Chen, S.; Wang, P.; Kong, W.; Chai, K.; Zhang, S.; Yu, J.; Wang, Y.; Jiang, M.; Lei, W.; Chen, X.; et al. Gene mining and genomics-assisted breeding empowered by the pangenome of tea plant Camellia sinensis. Nat. Plants 2023, 9, 1986–1999. [Google Scholar] [CrossRef] [PubMed]
- Fu, D.; Lu, M. The structural basis of water permeation and proton exclusion in aquaporins. Mol. Membr. Biol. 2007, 24, 366–374. [Google Scholar] [CrossRef] [PubMed]
- Gonen, T.; Walz, T. The structure of aquaporins. Q. Rev. Biophys. 2006, 39, 361–396. [Google Scholar] [CrossRef]
- Törnroth-Horsefield, S.; Wang, Y.; Hedfalk, K.; Johanson, U.; Karlsson, M.; Tajkhorshid, E.; Neutze, R.; Kjellbom, P. Structural mechanism of plant aquaporin gating. Nature 2006, 439, 688–694. [Google Scholar] [CrossRef]
- Bansal, A.; Sankararamakrishnan, R. Homology modeling of major intrinsic proteins in rice, maize and Arabidopsis: Comparative analysis of transmembrane helix association and aromatic/arginine selectivity filters. BMC Struct. Biol. 2007, 7, 27. [Google Scholar] [CrossRef]
- Froger, A.; Tallur, B.; Thomas, D.; Delamarche, C. Prediction of functional residues in water channels and related proteins. Protein Sci. A Publ. Protein Soc. 1998, 7, 1458–1468. [Google Scholar] [CrossRef]
- Singh, R.K.; Deshmukh, R.; Muthamilarasan, M.; Rani, R.; Prasad, M. Versatile roles of aquaporin in physiological processes and stress tolerance in plants. Plant Physiol. Biochem. 2020, 149, 178–189. [Google Scholar] [CrossRef]
- Ding, L.; Milhiet, T.; Couvreur, V.; Nelissen, H.; Meziane, A.; Parent, B.; Aesaert, S.; Van Lijsebettens, M.; Inzé, D.; Tardieu, F.; et al. Modification of the expression of the aquaporin ZmPIP2;5 affects water relations and plant growth. Plant Physiol. 2020, 182, 2154–2165. [Google Scholar] [CrossRef]
- Wang, S.; Dai, X.; Tang, Q.; Ding, J.; Shi, H.; Zhou, W.; Sheng, S.; Li, P. Genome-wide identification of Morus notabilis Aquaporin gene family and differential expression of plasma membrane intrinsic proteins in response to Ralstonia pseudosolanacearum infection. BMC Plant Biol. 2025, 25, 531. [Google Scholar] [CrossRef]
- Zhang, M.; Liu, R.; Liu, H.; Yang, H.; Li, X.; Wang, P.; Zhu, F.; Xu, R.; Xue, S.; Cheng, Y. Citrus NIP5;1 aquaporin regulates cell membrane water permeability and alters PIPs plasma membrane localization. Plant Mol. Biol. 2021, 106, 449–462. [Google Scholar] [CrossRef]
- Li, X.; Guo, Y.; Ling, Q.; Guo, Z.; Lei, Y.; Feng, X.; Wu, J.; Zhang, N. Advances in the structure, function, and regulatory mechanism of plant plasma membrane intrinsic proteins. Genes 2024, 16, 10. [Google Scholar] [CrossRef]
- Chen, P.; Li, C.; Chen, S.; Li, Z.; Zhang, H.; Zhao, C. Tea cultivation suitability evaluation and driving force analysis based on AHP and geodetector Results: A case study of Yingde in Guangdong, China. Remote Sens. 2022, 14, 2412. [Google Scholar] [CrossRef]
- Gupta, A.; Rico-Medina, A.; Caño-Delgado, A.I. The physiology of plant responses to drought. Science 2020, 368, 266–269. [Google Scholar] [CrossRef] [PubMed]
- Yue, C.; Cao, H.; Wang, L.; Zhou, Y.; Hao, X.; Zeng, J.; Wang, X.; Yang, Y. Molecular cloning and expression analysis of tea plant aquaporin (AQP) gene family. Plant Physiol. Biochem. 2014, 83, 65–76. [Google Scholar] [CrossRef] [PubMed]
- Ren, H.; Li, X.; Guo, L.; Wang, L.; Hao, X.; Zeng, J. Integrative transcriptome and proteome analysis reveals the absorption and metabolism of selenium in tea plants [Camellia sinensis (L.) O. Kuntze]. Front. Plant Sci. 2022, 13, 848349. [Google Scholar] [CrossRef] [PubMed]
- Seth, R.; Maritim, T.K.; Parmar, R.; Sharma, R.K. Underpinning the molecular programming attributing heat stress associated thermotolerance in tea (Camellia sinensis (L.) O. Kuntze). Hortic. Res. 2021, 8, 99. [Google Scholar] [CrossRef]
- Kong, W.; Yang, S.; Wang, Y.; Bendahmane, M.; Fu, X. Genome-wide identification and characterization of aquaporin gene family in Beta vulgaris. PeerJ 2017, 5, e3747. [Google Scholar] [CrossRef]
- Yuan, D.; Li, W.; Hua, Y.; King, G.J.; Xu, F.; Shi, L. Genome-wide identification and characterization of the aquaporin gene family and transcriptional responses to boron deficiency in Brassica napus. Front. Plant Sci. 2017, 8, 1336. [Google Scholar] [CrossRef]
- Geng, L.; Yu, S.; Zhang, Y.; Su, L.; Lu, W.; Zhu, H.; Jiang, X. Transcription factor RcNAC091 enhances rose drought tolerance through the abscisic acid-dependent pathway. Plant Physiol. 2023, 193, 1695–1712. [Google Scholar] [CrossRef]
- Jeyaraj, A.; Elango, T.; Chen, X.; Zhuang, J.; Wang, Y.; Li, X. Advances in understanding the mechanism of resistance to anthracnose and induced defence response in tea plants. Mol. Plant Pathol. 2023, 24, 1330–1346. [Google Scholar] [CrossRef] [PubMed]
- Wang, S.; Liu, L.; Mi, X.; Zhao, S.; An, Y.; Xia, X.; Guo, R.; Wei, C. Multi-omics analysis to visualize the dynamic roles of defense genes in the response of tea plants to gray blight. Plant J. 2021, 106, 862–875. [Google Scholar] [CrossRef] [PubMed]
- Liu, X.; Chen, M.; Yuan, Y.; Sheng, J.; Zhong, P.; Gong, S.; Liu, Z.; Xiang, G.; Hu, J.; Yan, M.; et al. Genome-wide identification of the OPT gene family and screening of Sb-responsive genes in Brassica juncea. Plants 2025, 14, 3399. [Google Scholar] [CrossRef]
- Cao, L.; Xie, F.; Chen, L.; Wang, Z.; Zhang, M.; Jian, S. Molecular characterization of Tetragonia tetragonoides (Pall.) Aquaporin (AQP) members and their roles in the response to combined high salinity-alkalinity-drought and heat stress. BMC Plant Biol. 2025, 25, 1488. [Google Scholar] [CrossRef] [PubMed]
- Wang, Y.; Chen, F.; Ma, Y.; Zhang, T.; Sun, P.; Lan, M.; Li, F.; Fang, W. An ancient whole-genome duplication event and its contribution to flavor compounds in the tea plant (Camellia sinensis). Hortic. Res. 2021, 8, 176. [Google Scholar] [CrossRef]
- Zhu, Y.X.; Yang, L.; Liu, N.; Yang, J.; Zhou, X.K.; Xia, Y.C.; He, Y.; He, Y.Q.; Gong, H.J.; Ma, D.F.; et al. Genome-wide identification, structure characterization, and expression pattern profiling of aquaporin gene family in cucumber. BMC Plant Biol. 2019, 19, 345. [Google Scholar] [CrossRef]
- Tong, T.; Zeng, F.; Ye, S.; Ji, Z.; Wang, Y.; Chen, Z.H.; Ouyang, Y. Evolutionary and structural analysis of the aquaporin gene family in rice. Plants 2025, 14, 2035. [Google Scholar] [CrossRef]
- Faize, M.; Fumanal, B.; Luque, F.; Ramírez-Tejero, J.A.; Zou, Z.; Qiao, X.; Faize, L.; Gousset-Dupont, A.; Roeckel-Drevet, P.; Label, P.; et al. Genome wild analysis and molecular understanding of the aquaporin diversity in olive trees (Olea europaea L.). Int. J. Mol. Sci. 2020, 21, 4183. [Google Scholar] [CrossRef]
- Fu, D.; Libson, A.; Miercke, L.J.; Weitzman, C.; Nollert, P.; Krucinski, J.; Stroud, R.M. Structure of a glycerol-conducting channel and the basis for its selectivity. Science 2000, 290, 481–486. [Google Scholar] [CrossRef]
- Salvatierra, A.; Mateluna, P.; Toro, G.; Solís, S.; Pimentel, P. Genome-wide identification and gene expression analysis of sweet cherry aquaporins (Prunus avium L.) under abiotic stresses. Genes 2023, 14, 940. [Google Scholar] [CrossRef]
- Zhang, G.; Yu, Z.; Teixeira da Silva, J.A.; Wen, D. Identification of aquaporin members in Acacia auriculiformis and functional characterization of AaPIP1-2 involved in drought stress. Environ. Exp. Bot. 2021, 185, 104425. [Google Scholar] [CrossRef]
- Wang, Y.; Xiao, E.; Wu, G.; Bai, Q.; Xu, F.; Ji, X.; Li, C.; Li, L.; Liu, J. The roles of selectivity filters in determining aluminum transport by AtNIP1;2. Plant Signal. Behav. 2021, 16, 1991686. [Google Scholar] [CrossRef] [PubMed]
- Sudhakaran, S.; Mandlik, R.; Kumawat, S.; Raturi, G.; Gupta, S.K.; Shivaraj, S.M.; Patil, G.; Deshmukh, R.; Sharma, T.R.; Sonah, H. Evolutionary analysis of tonoplast intrinsic proteins (TIPs) unraveling the role of TIP3s in plant seed development. Plant Physiol. Biochem. 2024, 215, 109022. [Google Scholar] [CrossRef] [PubMed]
- Przedpelska-Wasowicz, E.M.; Wierzbicka, M. Gating of aquaporins by heavy metals in Allium cepa L. epidermal cells. Protoplasma 2011, 248, 663–671. [Google Scholar] [CrossRef]
- Zeng, Q.; Jia, H.; Ma, Y.; Xu, L.; Ming, R.; Yue, J. Genome-wide identification and expression pattern profiling of the aquaporin gene family in Papaya (Carica papaya L.). Int. J. Mol. Sci. 2023, 24, 17276. [Google Scholar] [CrossRef]
- Reinhardt, H.; Hachez, C.; Bienert, M.D.; Beebo, A.; Swarup, K.; Voß, U.; Bouhidel, K.; Frigerio, L.; Schjoerring, J.K.; Bennett, M.J.; et al. Tonoplast aquaporins facilitate lateral root emergence. Plant Physiol. 2016, 170, 1640–1654. [Google Scholar] [CrossRef]
- Herrera-Ubaldo, H. Masters of flower-bending: Aquaporins regulate flower re-opening. Plant Cell 2022, 34, 2578–2579. [Google Scholar] [CrossRef]
- Li, Q.; Tong, T.; Jiang, W.; Cheng, J.; Deng, F.; Wu, X.; Chen, Z.H.; Ouyang, Y.; Zeng, F. Highly conserved evolution of aquaporin PIPs and TIPs confers their crucial contribution to flowering process in plants. Front. Plant Sci. 2021, 12, 761713. [Google Scholar] [CrossRef]
- Liu, K.; Zhang, T.; Zhao, S.; Chen, J.; Zhou, W.; Chen, S.; Su, Y.; Liu, Q.; Gao, J.; Zhang, C. Scaffold protein RhCASPL1D1 stabilizes RhPIP2 aquaporins and promotes flower recovery after dehydration in rose (Rosa hybrida). Hortic. Res. 2025, 12, uhaf119. [Google Scholar] [CrossRef]
- Nemoto, K.; Niinae, T.; Goto, F.; Sugiyama, N.; Watanabe, A.; Shimizu, M.; Shiratake, K.; Nishihara, M. Calcium-dependent protein kinase 16 phosphorylates and activates the aquaporin PIP2;2 to regulate reversible flower opening in Gentiana scabra. Plant Cell 2022, 34, 2652–2670. [Google Scholar] [CrossRef]
- Song, S.; Zhang, D.; Ma, F.; Xing, W.; Huang, D.; Wu, B.; Chen, J.; Chen, D.; Xu, B.; Xu, Y. Genome-wide identification and expression analyses of the aquaporin gene family in Passion Fruit (Passiflora edulis), revealing PeTIP3-2 to be involved in drought stress. Int. J. Mol. Sci. 2022, 23, 5720. [Google Scholar] [CrossRef] [PubMed]
- Wong, D.C.J.; Zhang, L.; Merlin, I.; Castellarin, S.D.; Gambetta, G.A. Structure and transcriptional regulation of the major intrinsic protein gene family in grapevine. BMC Genom. 2018, 19, 248. [Google Scholar] [CrossRef] [PubMed]
- Han, Y.; Luo, F.; Liang, A.; Xu, D.; Zhang, H.; Liu, T.; Qi, H. Aquaporin CmPIP2;3 links H2O2 signal and antioxidation to modulate trehalose-induced cold tolerance in melon seedlings. Plant Physiol. 2024, 197, kiae477. [Google Scholar] [CrossRef] [PubMed]
- Zhang, M.; Shi, H.; Li, N.; Wei, N.; Tian, Y.; Peng, J.; Chen, X.; Zhang, L.; Zhang, M.; Dong, H. Aquaporin OsPIP2;2 links the H2O2 signal and a membrane-anchored transcription factor to promote plant defense. Plant Physiol. 2022, 188, 2325–2341. [Google Scholar] [CrossRef]
- Zhang, F.; Pan, Z.; Han, C.; Dong, H.; Lin, L.; Qiao, Q.; Zhao, K.; Wu, J.; Tao, S.; Zhang, S.; et al. Pyrus betulaefolia ERF3 interacts with HsfC1a to coordinately regulate aquaporin PIP1;4 and NCED4 for drought tolerance. Hortic. Res. 2024, 11, uhae090. [Google Scholar] [CrossRef]
- Wang, Y.; Li, R.; Li, D.; Jia, X.; Zhou, D.; Li, J.; Lyi, S.M.; Hou, S.; Huang, Y.; Kochian, L.V.; et al. NIP1;2 is a plasma membrane-localized transporter mediating aluminum uptake, translocation, and tolerance in Arabidopsis. Proc. Natl. Acad. Sci. USA 2017, 114, 5047–5052. [Google Scholar] [CrossRef]
- Hao, J.; Peng, A.; Li, Y.; Zuo, H.; Li, P.; Wang, J.; Yu, K.; Liu, C.; Zhao, S.; Wan, X.; et al. Tea plant roots respond to aluminum-induced mineral nutrient imbalances by transcriptional regulation of multiple cation and anion transporters. BMC Plant Biol. 2022, 22, 203. [Google Scholar] [CrossRef]
- Lu, K.; Chen, X.; Yao, X.; An, Y.; Wang, X.; Qin, L.; Li, X.; Wang, Z.; Liu, S.; Sun, Z.; et al. Phosphorylation of a wheat aquaporin at two sites enhances both plant growth and defense. Mol. Plant 2022, 15, 1772–1789. [Google Scholar] [CrossRef]
- Chen, C.; Wu, Y.; Li, J.; Wang, X.; Zeng, Z.; Xu, J.; Liu, Y.; Feng, J.; Chen, H.; He, Y.; et al. TBtools-II: A “one for all, all for one” bioinformatics platform for biological big-data mining. Mol. Plant 2023, 16, 1733–1742. [Google Scholar] [CrossRef] [PubMed]
- Tamura, K.; Stecher, G.; Kumar, S. MEGA11: Molecular evolutionary genetics analysis version 11. Mol. Biol. Evol. 2021, 38, 3022–3027. [Google Scholar] [CrossRef] [PubMed]
- Pellegrini-Calace, M.; Maiwald, T.; Thornton, J.M. PoreWalker: A novel tool for the identification and characterization of channels in transmembrane proteins from their three-dimensional structure. PLoS Comput. Biol. 2009, 5, e1000440. [Google Scholar] [CrossRef]
- Yue, C.; Cao, H.; Lin, H.; Hu, J.; Ye, Y.; Li, J.; Hao, Z.; Hao, X.; Sun, Y.; Yang, Y.; et al. Expression patterns of alpha-amylase and beta-amylase genes provide insights into the molecular mechanisms underlying the responses of tea plants (Camellia sinensis) to stress and postharvest processing treatments. Planta 2019, 250, 281–298. [Google Scholar] [CrossRef]
- Yue, C.; Cao, H.; Zhang, S.; Shen, G.; Wu, Z.; Yuan, L.; Luo, L.; Zeng, L. Multilayer omics landscape analyses reveal the regulatory responses of tea plants to drought stress. Int. J. Biol. Macromol. 2023, 253, 126582. [Google Scholar] [CrossRef]
- Yu, S.; Zhu, M.; Li, P.; Zuo, H.; Li, J.; Li, Y.; Peng, A.; Huang, J.; Fernie, A.R.; Liu, Z.; et al. Dissection of the spatial dynamics of biosynthesis, transport, and turnover of major amino acids in tea plants (Camellia sinensis). Hortic. Res. 2024, 11, uhae060. [Google Scholar] [CrossRef]
- Livak, K.J.; Schmittgen, T.D. Analysis of relative gene expression data using real-time quantitative PCR and the 2−ΔΔCT method. Methods 2001, 25, 402–408. [Google Scholar] [CrossRef]
- Guo, Z.; Wei, M.; Xu, C.; Wang, L.; Li, J.; Liu, J.; Zhong, Y.; Chi, B.; Song, S.; Zhang, L.; et al. Genome-wide identification of Avicennia marina aquaporins reveals their role in adaptation to intertidal habitats and their relevance to salt secretion and vivipary. Plant Cell Environ. 2024, 47, 832–853. [Google Scholar] [CrossRef]
Disclaimer/Publisher’s Note: The statements, opinions and data contained in all publications are solely those of the individual author(s) and contributor(s) and not of MDPI and/or the editor(s). MDPI and/or the editor(s) disclaim responsibility for any injury to people or property resulting from any ideas, methods, instructions or products referred to in the content. |
© 2025 by the authors. Licensee MDPI, Basel, Switzerland. This article is an open access article distributed under the terms and conditions of the Creative Commons Attribution (CC BY) license (https://creativecommons.org/licenses/by/4.0/).