Abstract
Environmental and health concerns have increased the demand for ready-to-eat vegetables rich in bioactive compounds. This study explores the impact of red and blue (R:B) LED light on the metabolic responses of lamb’s lettuce (Valerianella locusta L.), focusing on sugars, organic acids, total phenolics, antioxidant activity, and enzyme inhibition. Post-harvest analyses were also conducted to assess shelf-life and microbiological characteristics of the product. The R:B LED treatment significantly enhanced plant growth, with a 133% and 68% increase in shoot fresh and dry weights, respectively, and a 21% increase in leaf area compared to controls (white LED light). Biochemical profiling revealed substantial increases in fructose (255%), sucrose (169%), citric acid (350%), and malic acid (868%) under R:B LED light. Additionally, phenolic content increased by 30%, alongside a notable modulation of 258 secondary metabolites, including flavonoid glycosides, alkaloids, and terpenoids. These biochemical changes contributed to a marked improvement in antioxidant capacity (12–45% across multiple assays) and a 300% increase in α-glucosidase inhibition, suggesting potential antidiabetic properties. Furthermore, post-harvest analysis revealed comparable shelf-life and microbiological safety between R:B and white LED-grown samples. The research highlights the potential of LED light to enhance plant biochemical responses and improve crop quality without affecting post-harvest quality, paving the way for sustainable agricultural innovations.
1. Introduction
The United Nations Food and Agriculture Organization’s (FAO) estimated that between 691 and 783 million people in the world faced hunger in 2022 and more than 3.1 billion people were unable to afford healthy diet in 2021 [1]. Additionally, about two billion individuals experienced micronutrient malnutrition (MNM) or “hidden hunger”, which is a form of hunger resulting from insufficient vital micronutrients daily dietary intake [2]. Today, new trends in agriculture are therefore aimed at growing nutrient-rich food crops to counter MNM rather than focusing solely on increasing yields.
Indeed, improving the bioavailability of essential minerals, vitamins, and antioxidants in crops is becoming increasingly important for human health and disease prevention. Within this framework, plant secondary metabolites—especially polyphenols, flavonoids, and other antioxidants—are key to developing more nutritious crops, helping address the low nutritional quality of Western diets. Many studies now assess antioxidant activity in food and plant samples as an initial screening step [3], since antioxidants protect against diseases linked to oxidative stress, including cancer, cardiovascular, and neurodegenerative disorders [4]. Among these substances, phenolic compounds (e.g., flavonoids, phenolic acids, and tannins) are widespread in plants and act as powerful antioxidants [5]. Indeed, these together with ascorbic acid, carotenoids, and vitamin E counteract oxidative damage by neutralizing free radicals and ROS [6,7]. To boost these health-promoting compounds in crops, various agronomic strategies have been explored, especially light-based approaches that influence phenolic compound synthesis [8,9]. A recent study demonstrated the significant impact of the light-emitting diode (LED) on the levels of sulphur compounds, polyphenols, and the antioxidant potential of the biomass extracts of watercress plants [10]. A LED is a semiconductive diode that can produce light through electroluminescence, which emits a narrow spectrum of light in a non-coherent manner. Distinct wavelengths of light are emitted, giving rise to monochromatic light with specific visible colours [11]. The colour of the emitted light is determined by the band gap energy of the semiconductor material used [12]. The capability of modulating monochromatic light makes the use of LEDs interesting for plant applications. In fact, the growth and development of plants are significantly influenced by light intensity and its spectral properties, with red and blue light being considered the most important ones [13]. Red (R) wavelengths (600–700 nm) and blue (B) wavelengths (400–500 nm) can elicit higher CO2 assimilation or O2 production rates in plants, with R light being particularly efficient [14]. B light influences plant growth, leaf expansion, photomorphogenesis, stomatal opening, photosynthesis, and pigment accumulation [15]. Moreover, the utilization of B LED light stimulates the biosynthesis of both primary and secondary metabolites in plants [16]. On the other hand, R light plays a crucial role in regulating chloroplast function, stem and petiole growth, as well as the reproductive system [15]. Furthermore, it was demonstrated that R light can also effectively reduce nitrate levels in plants [17]. Notwithstanding this, different studies revealed that either monochromatic R or B light is insufficient to meet the normal growth requirements of plants. Indeed, plants showed photosynthetic inefficiencies when one of these light qualities was absent [18]. Conversely, the combined use of R and B LEDs to irradiate plants showed synergetic effects inducing improvements in fresh mass and dry mass content of cucumber compared to R LEDs alone [18]. Similarly, the combination of R and B LED lights led to a significant increase of 161% in the dry weight of plants, as concluded in a recent meta-analysis [19]. Moreover, the synergistic effect of B and R light was demonstrated to enhance pigment contents, growth, and antioxidant activity of kale, basil, lettuce, spinach, and sweet pepper [20]. A study conducted on two varieties of Ocimum basilicum reported that a treatment involving a 2.3:1 R:B LED combination led to enhanced synthesis of phenols and carotenoids [21]. Moreover, different R:B LED combination treatments resulted in an elevation of the overall antioxidant pool in basil with an observed 70% increase in flavonoids across all LED treatments [22]. Besides their significant role in plant growth, development, and the enhancement of secondary metabolites and bioactive compounds, LEDs also find application as a non-chemical sanitation treatment. Although the sterilizing properties of UV radiation are well-established, recent studies have revealed that visible light can also exhibit bactericidal effects under specific conditions, highlighting its potential role in ensuring food safety [11]. A recent study demonstrated that plants exposed to high light intensity before harvest exhibited higher initial levels of carbohydrates and ascorbic acid that were maintained throughout the storage period. As a result, these plants exhibited improved visual quality and a longer shelf-life compared to other treatments [23]. In this context, the concepts of eustress, the beneficial and low-dose stress that enhances plant quality and productivity, and hormesis are gaining attention in agriculture as strategies to improve crop quality and sustainability under climate challenges, particularly through physical stressors like specific LED light wavelengths [24,25].
Lamb’s lettuce (Valerianella locusta L.) is a fresh leafy vegetable renowned for its abundance of phenolic compounds and remarkably high folate content [26]. Additionally, it is rich in many other pro-health nutrients (e.g., ascorbic acid and omega-3 fatty acids) and it is characterized by exceptional taste qualities which make it appealing to consumers. Lamb’s lettuce plants were previously successfully investigated in LED light experiments [27,28,29]; however, the effects at the post-harvest and phenolic profiling of this light growing condition was still to be investigated.
Thus, this work focused on the study of the R:B (70%:30%) LED light treatment impacts on lamb’s lettuce. Indeed, this R:B LED combination was previously demonstrated as optimal for phenolic compounds and chemical composition of lamb’s lettuce [27,30]. The growth of lamb’s lettuce in control and R:B LED conditions was investigated from the morphological and biochemical point of view. Moreover, the potential enrichment of bioactive compounds was evaluated in plants and the R:B LED light impact on the quality and stability of the fresh-cut product thereof.
2. Results
2.1. Plants Growth Evaluation
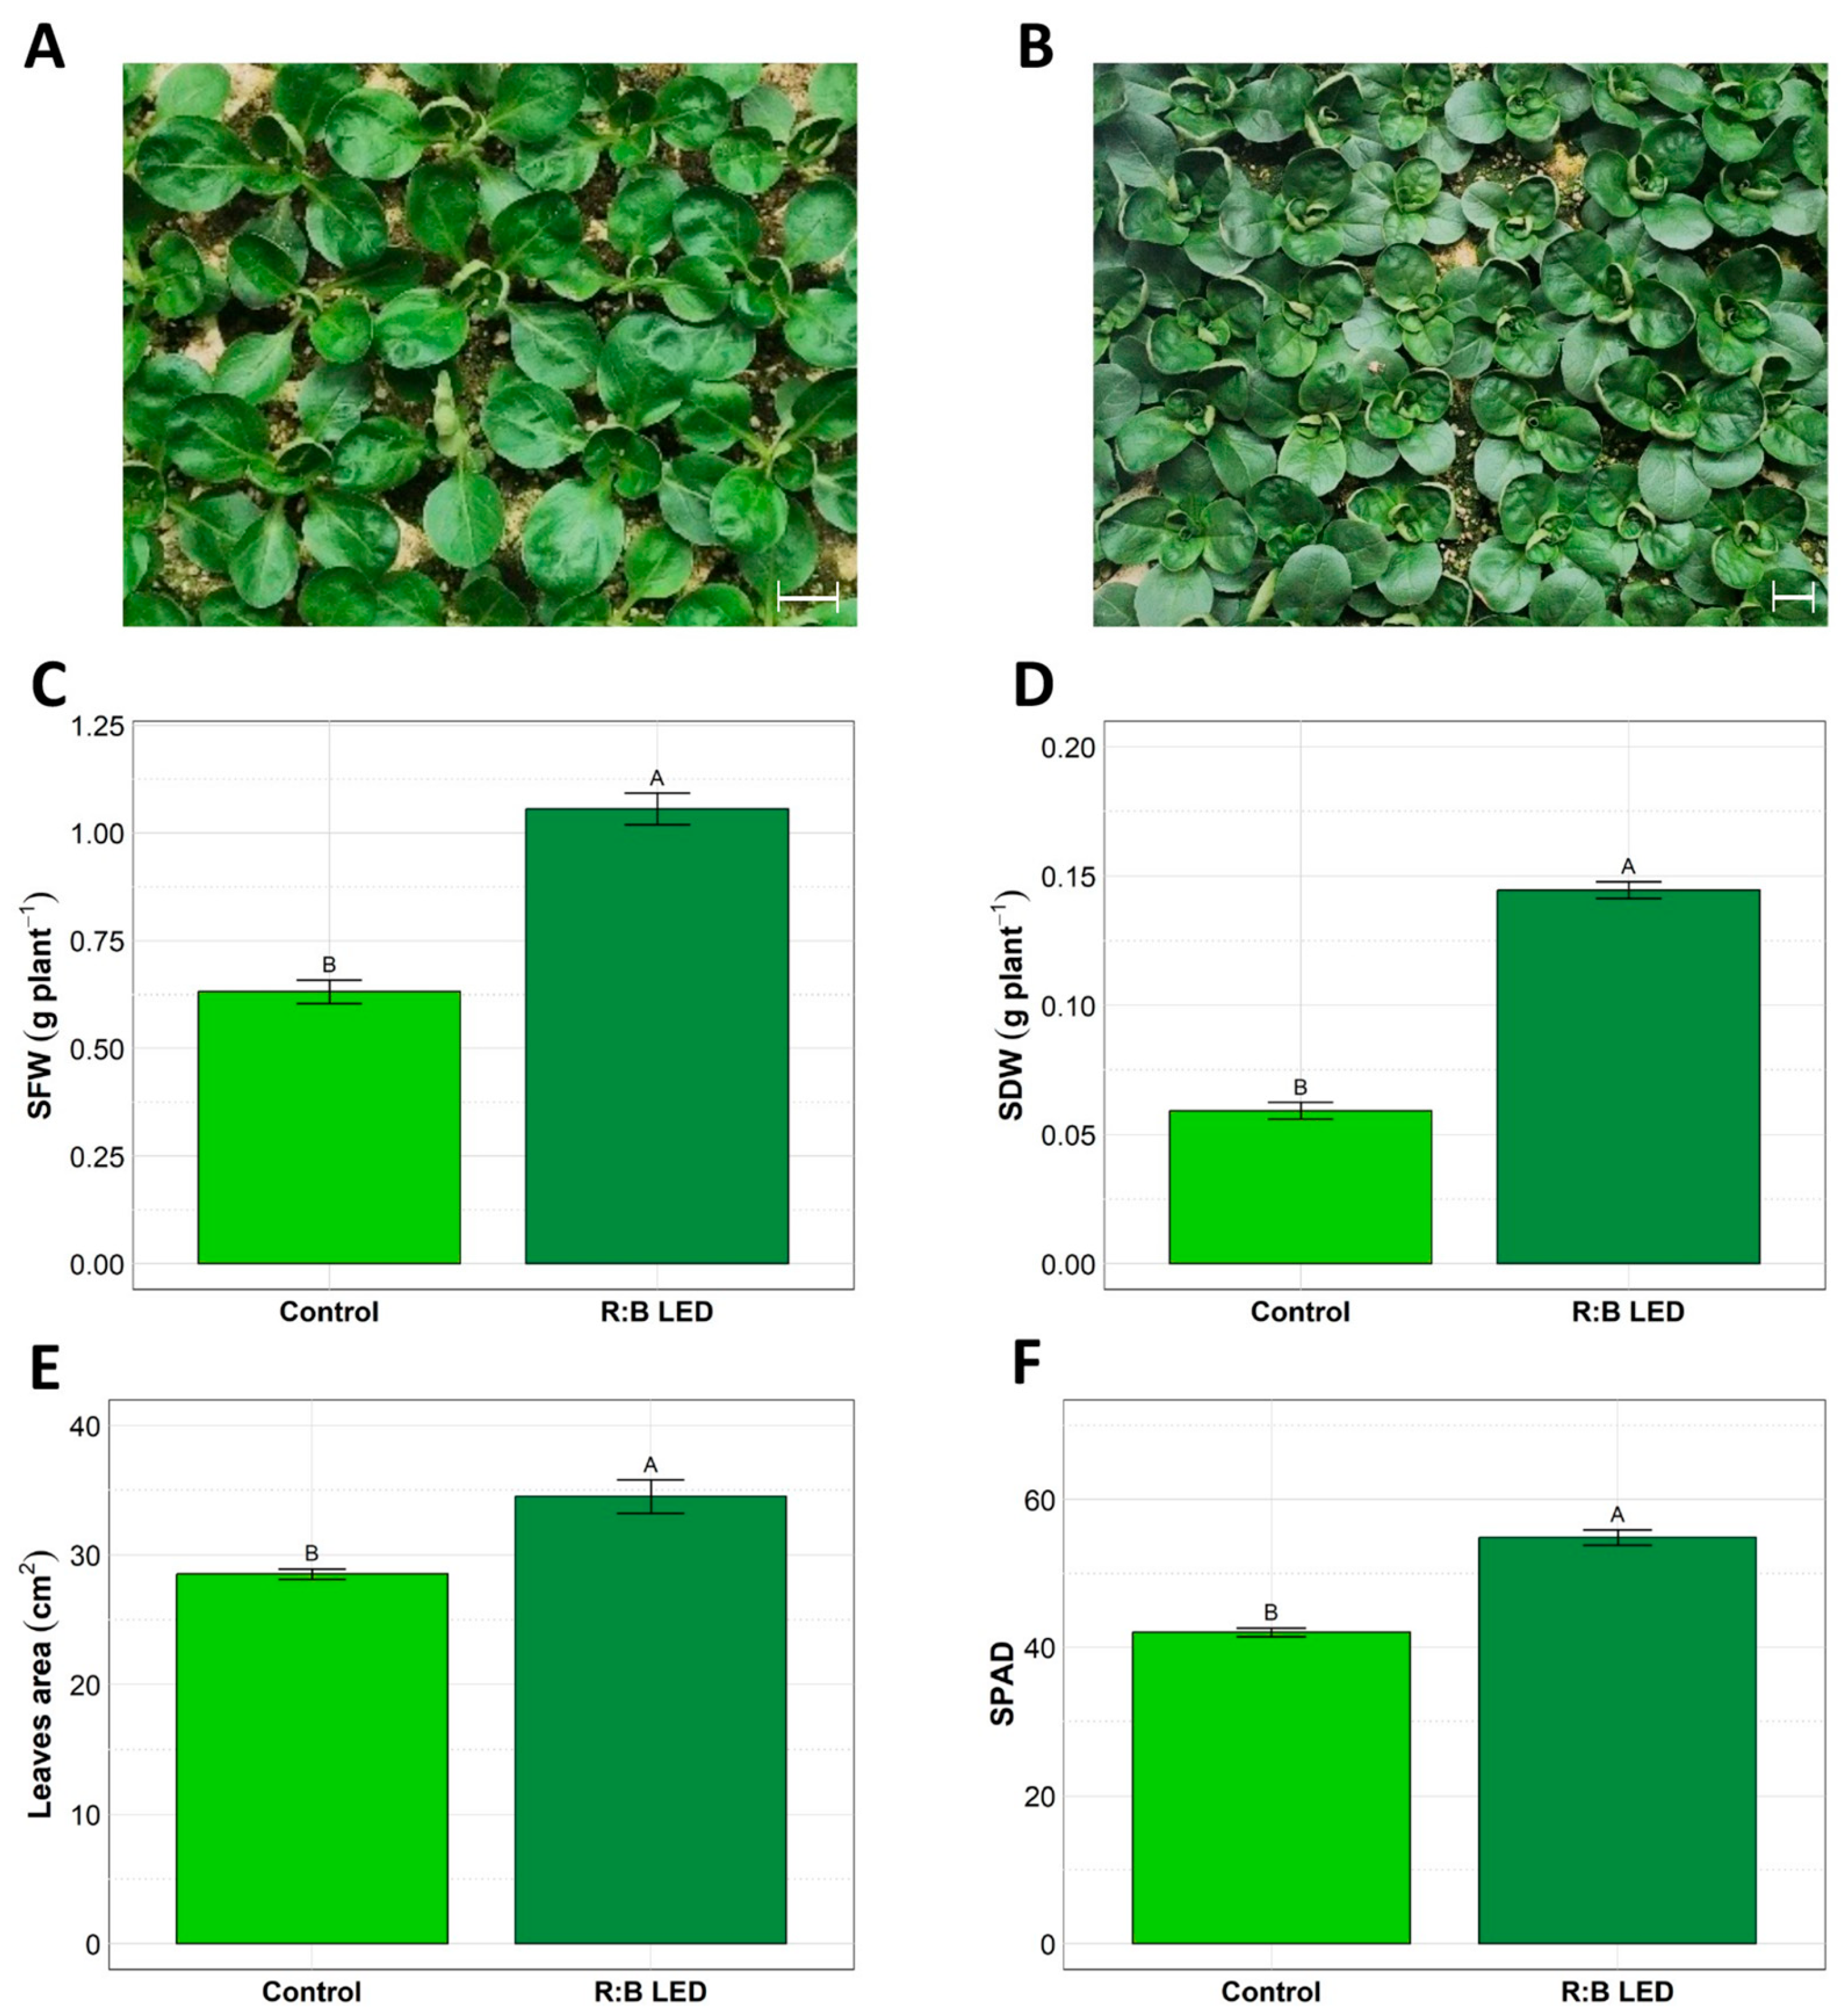
In Figure 1 is depicted the visual comparison between V. locusta plants grown under control (white LED light) (Figure 1A) and R:B LED light (Figure 1B) conditions. Notably, the LED group exhibited a distinct darker green coloration and appeared larger overall compared to the control group. These visible differences were further confirmed by biometric parameters which were evaluated at harvest time (Figure 1).
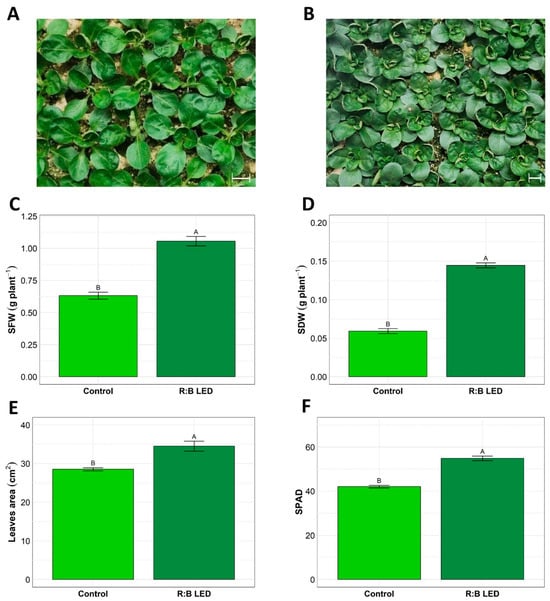
Figure 1.
Valerianella locusta L. growth parameters. Representative pictures of V. locusta plants grown in control conditions at harvest (A); representative pictures of V. locusta plants grown in R:B LED light conditions at harvest (B). White bars in the pictures represent 1 cm length. Fresh biomass accumulation (C), dry biomass accumulation (D), leaf area development (E), and SPAD index (F) in V. locusta plants grown in either R:B LED light or control conditions at harvest. Data are reported as mean ± SE (n = 4 for SFW and SDW, n = 10 for SPAD index). The statistical significance has been tested through one-way ANOVA and Tukey post hoc test (p value < 0.05). Different letters indicate significantly different values.
The R:B LED light significantly impacted the V. locusta shoot fresh weight (SFW) and shoot dry weight (SDW) (Figure 1C,D). Indeed, treated plants showed 133% and 68% increase in SFW and SDW, respectively, suggesting the positive effect of R:B LED lights on the biomass accumulation. This was further confirmed by the leaf area (LA) evaluation (Figure 1E). Treated plants showed a statistically significant 21% increase in LA compared to the control ones. Furthermore, the mean SPAD index was significantly higher in LED-treated plants (54.86) as compared to control plants (42.06) (Figure 1F).
2.2. Organic Acids, Sugars, and Phenolic Compounds Concentrations
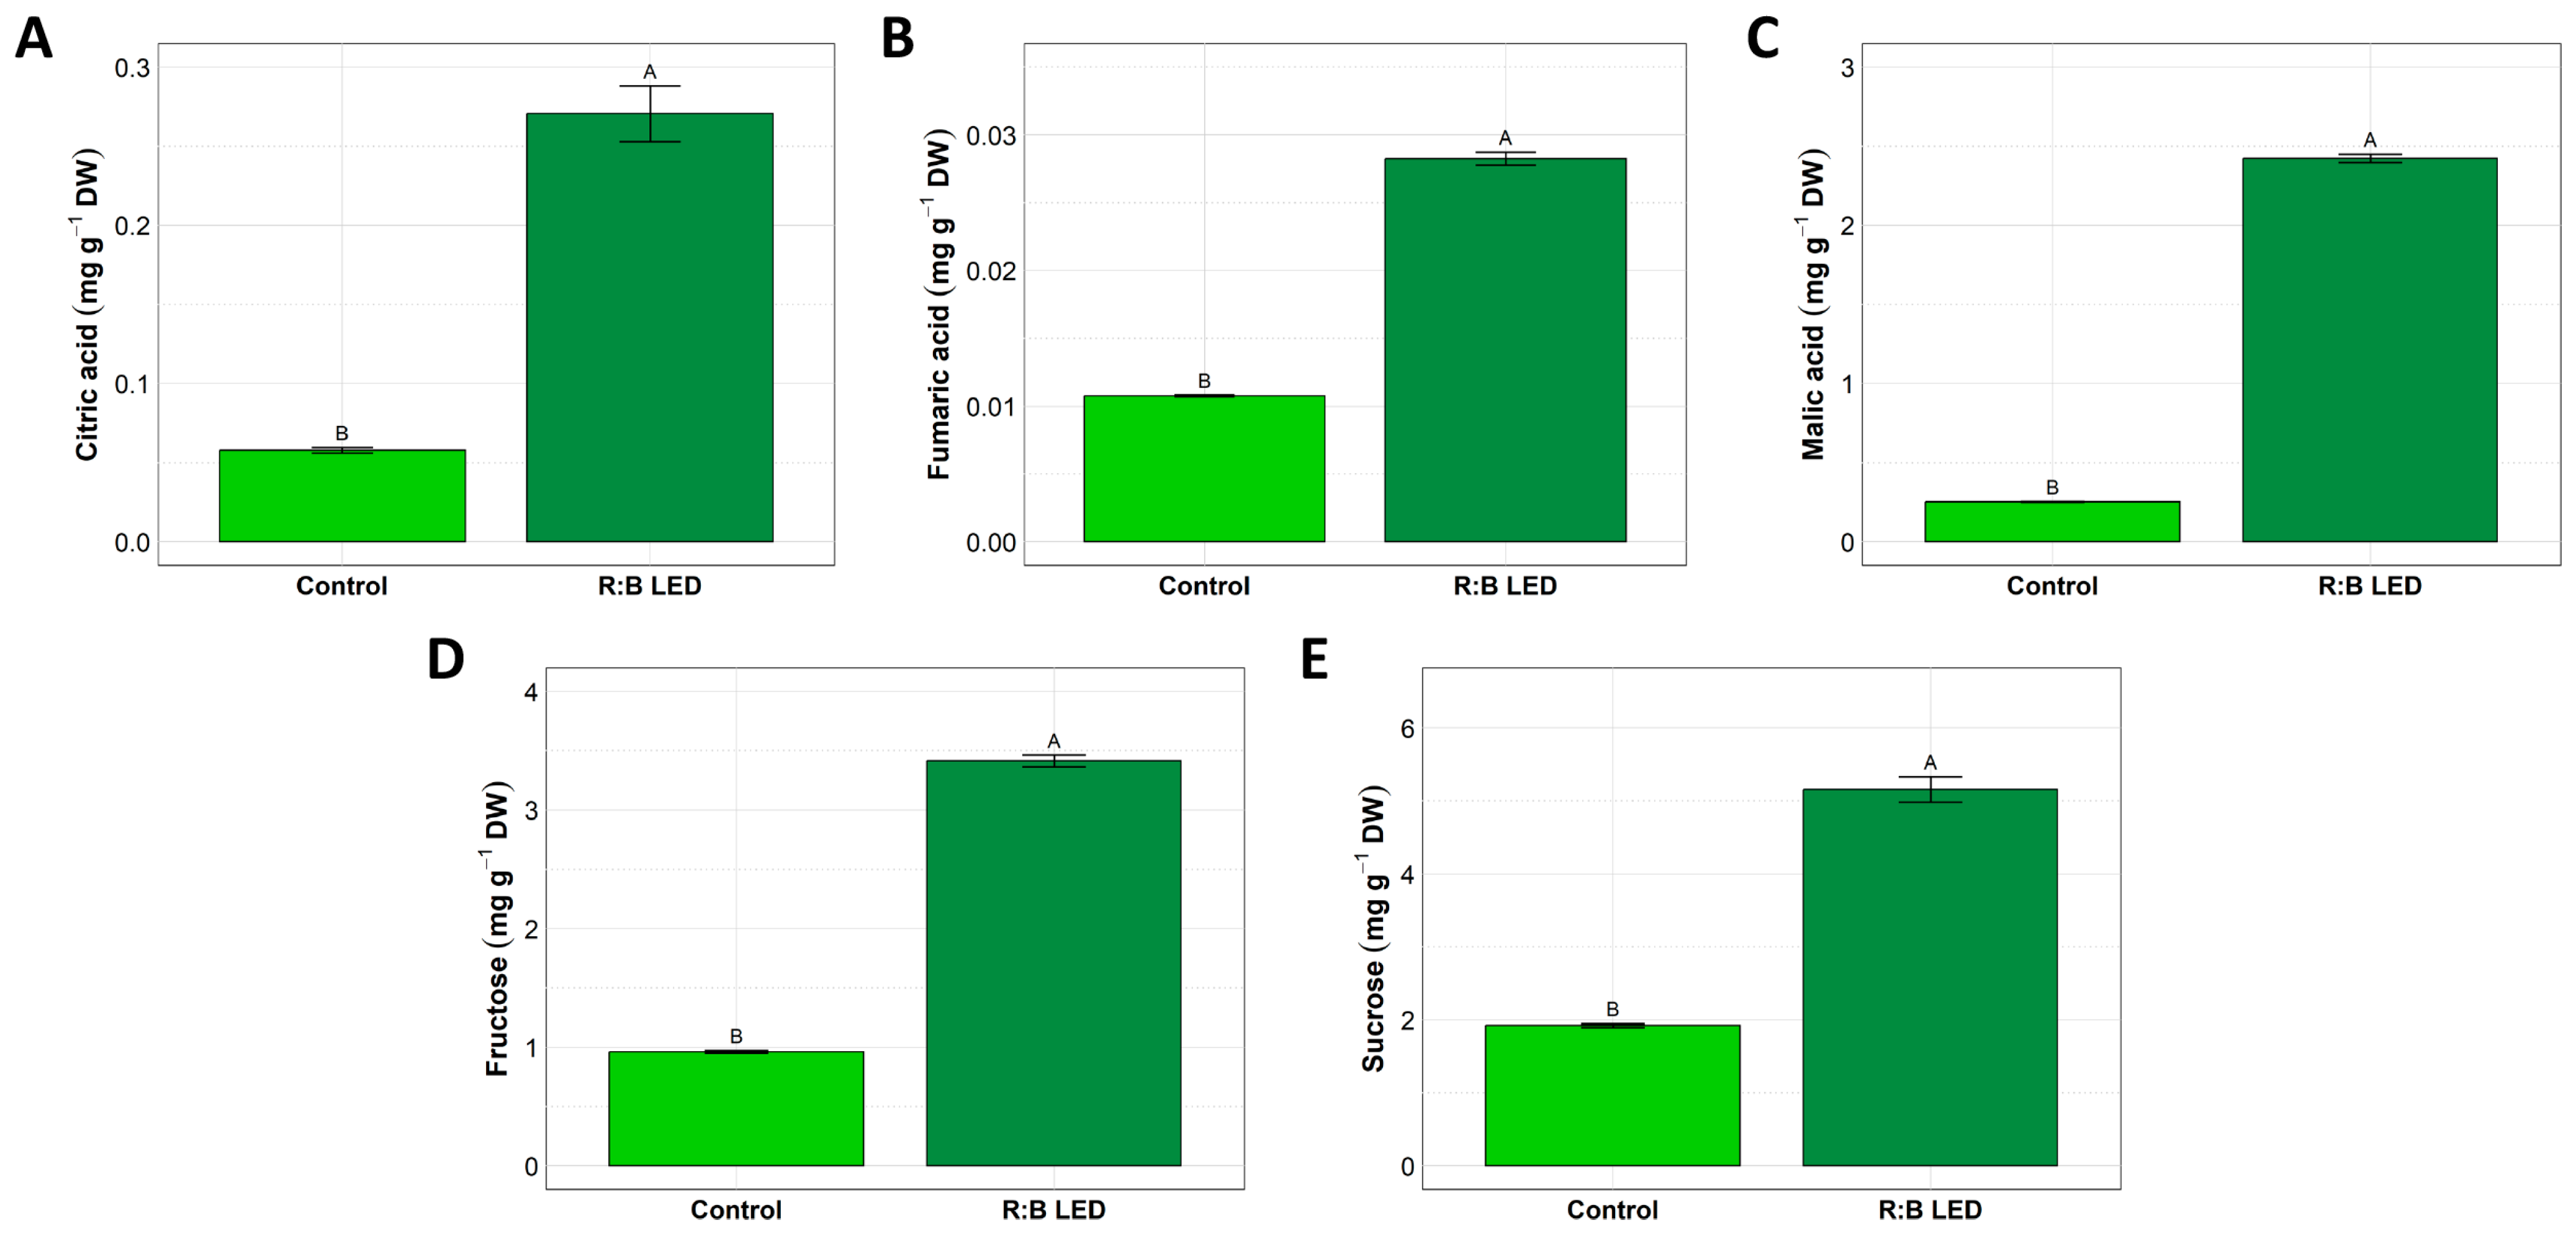
V. locusta samples did not show any detectable peak ascribable to aconitic acid, oxalic acid, and succinic acid. On the other hand, the analysis of citric, fumaric, and malic acids indicated significant variations in the concentrations of these organic acids between the control and R:B LED-treated plants (Figure 2A–C).

Figure 2.
Organic acids and sugars quantification. Concentration of citric acid (A), fumaric acid (B), malic acid (C), fructose (D), and sucrose (E) in V. locusta plants grown in either R:B LED light or control conditions at harvest. Data are reported as mean ± SE (n = 6). The statistical significance has been tested through one-way ANOVA and Tukey post hoc test (p value < 0.05). Different letters indicate significantly different values.
In fact, R:B LED-treated plants exhibited a statistically significant increase in the concentration of citric acid (Figure 2A), fumaric acid (Figure 2B), and malic acid (Figure 2C) by about 350%, 200%, and 868%, respectively, as compared to control plants.
Similarly, V. locusta plants were analysed for the fructose, glucose, and sucrose content. Glucose was not detected in the samples analysed. However, treated plants exhibited a statistically significant increased concentration of fructose and sucrose compared to control plants. In detail, LED light-treated lamb’s lettuce showed an increment by about 255% and 169% of fructose and sucrose, respectively (Figure 2D,E).
As detected for the other metabolites, also phenolic compounds showed a differential accumulation depending on the light conditions. In fact, V. locusta plants subjected to R:B LED lights featured a 30.2% higher phenolic compound concentration with respect to control plants (Table 1).

Table 1.
Quantification of total phenolic compounds and antioxidant activity in extracts of V. locusta L. plants grown in either R:B LED light or control conditions at harvest. Data are reported as mean ± SE (n = 4). The statistical significance has been tested through one-way ANOVA and Tukey post hoc test (p value < 0.05). Different letters indicate significantly different values.
2.3. Untargeted Phenolic Compounds Profiling
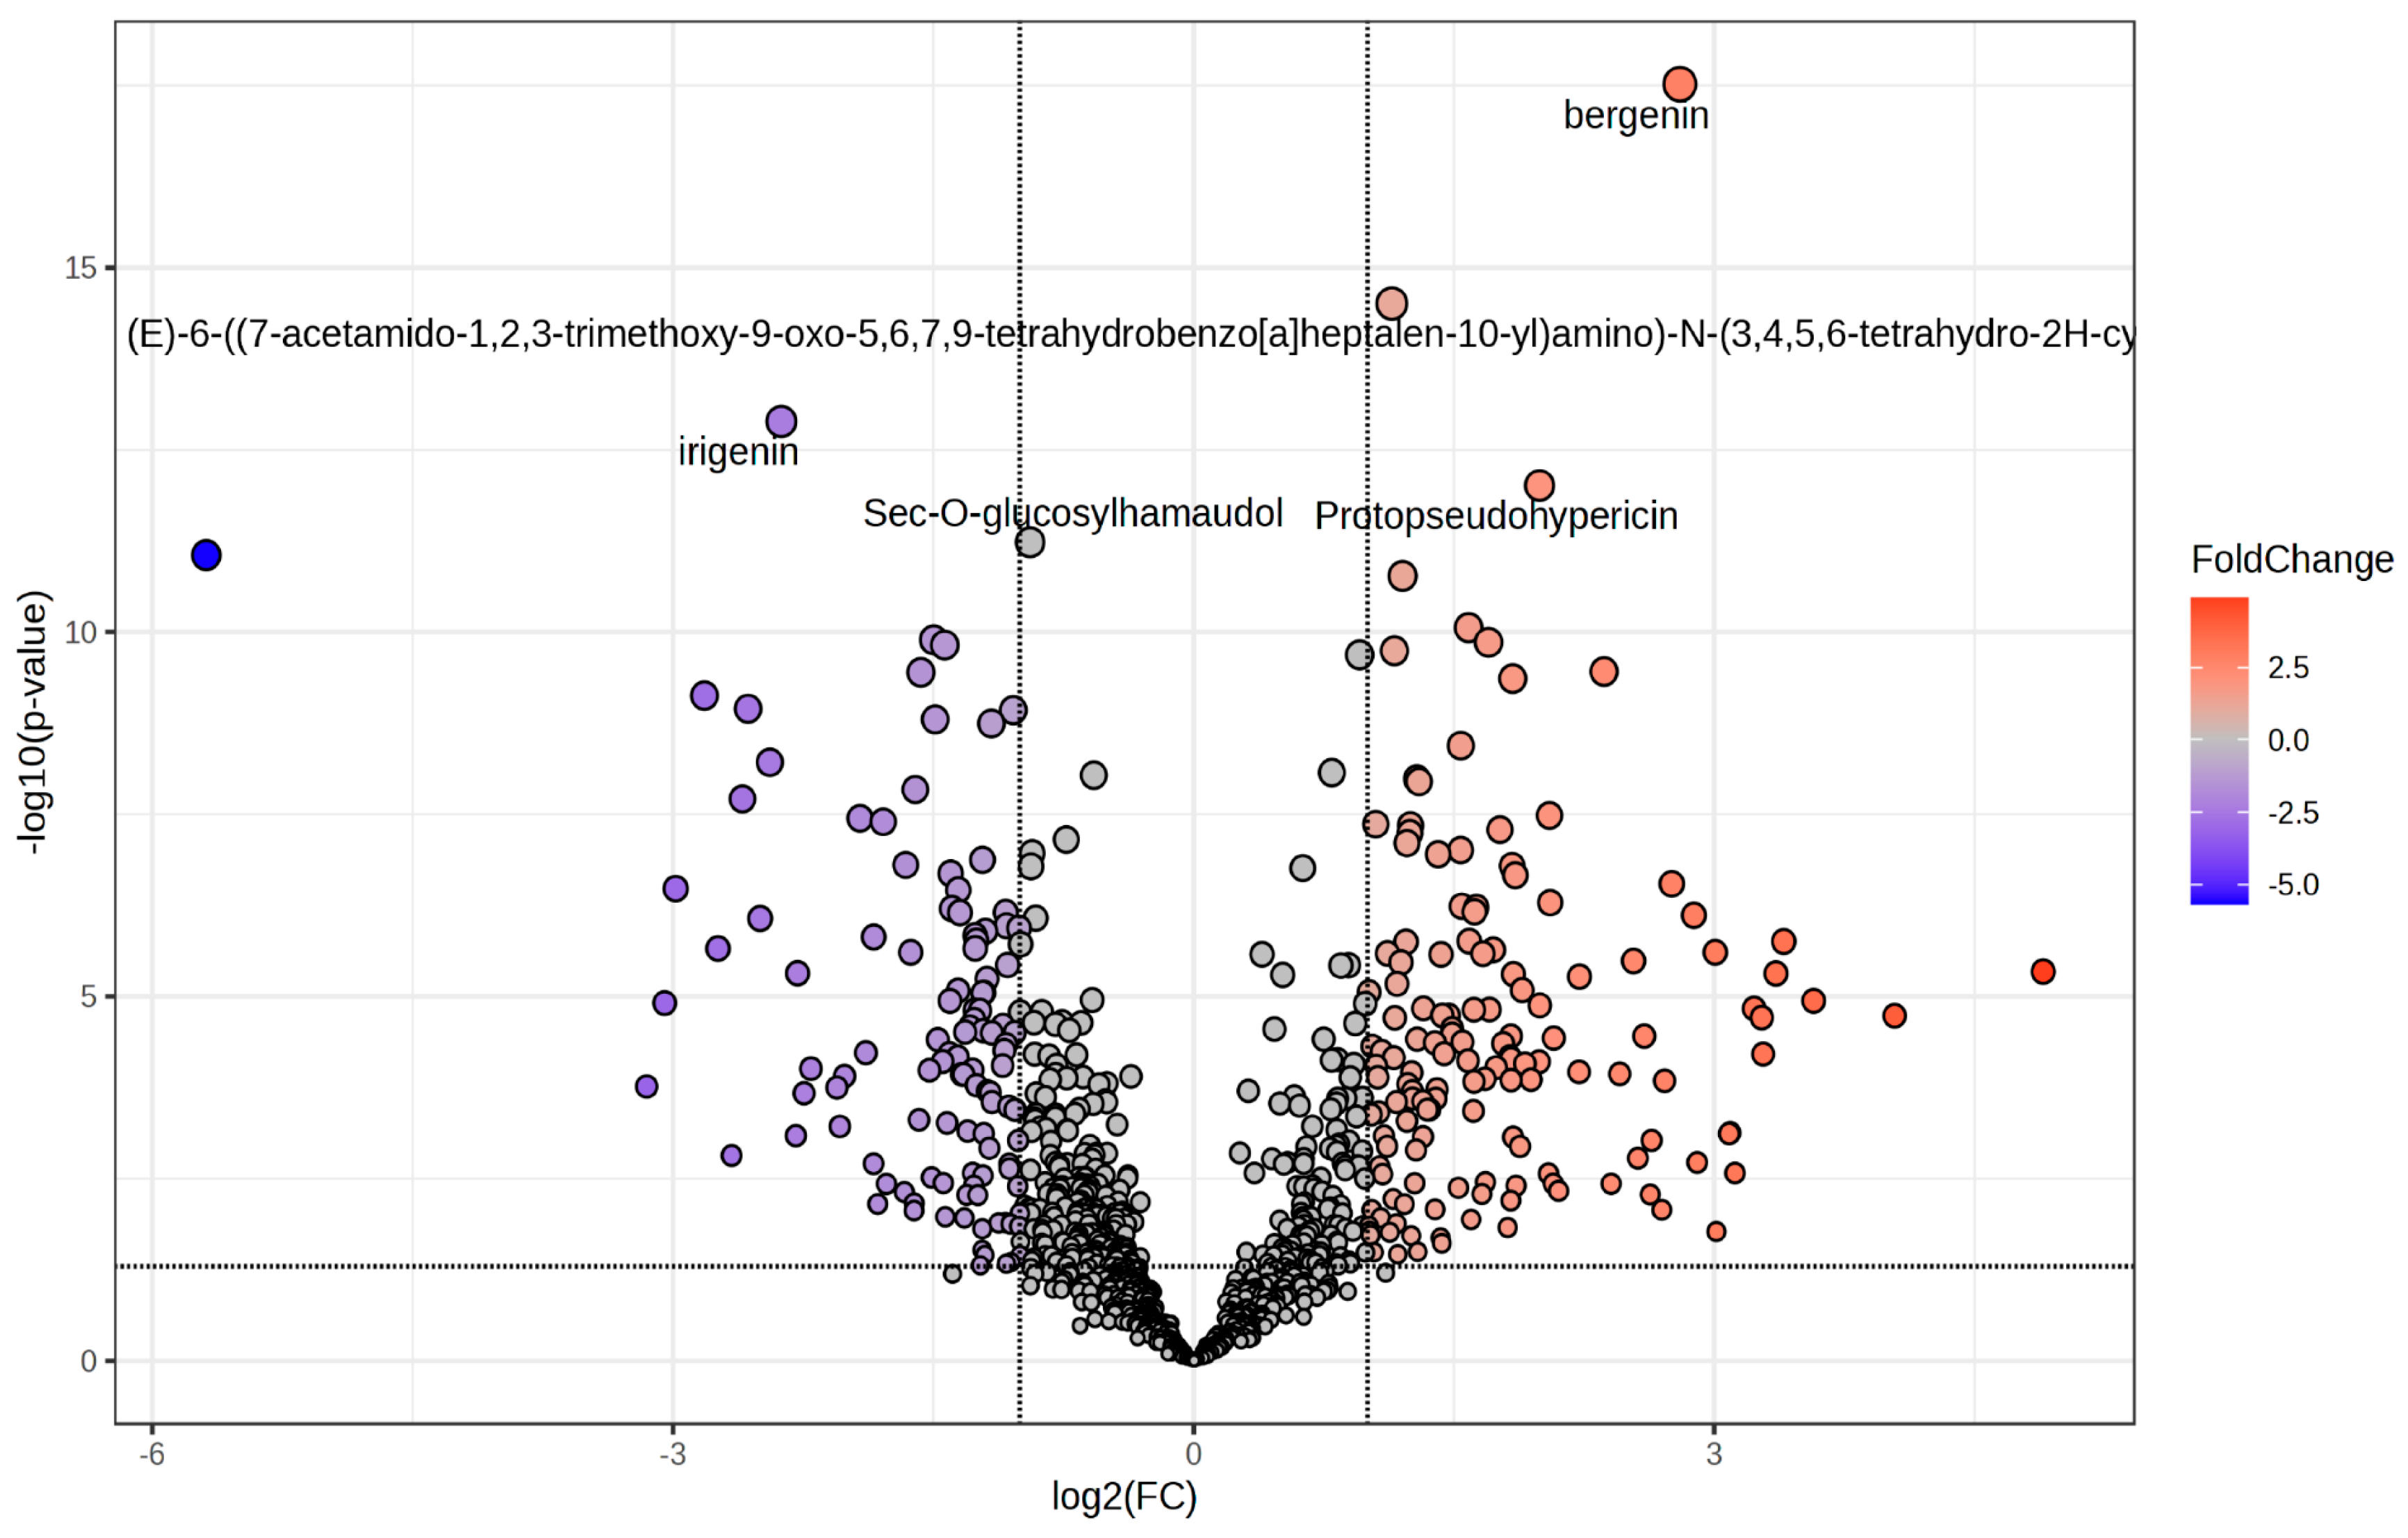
The effect of R:B LED light on the phenolic compounds composition of V. locusta plants was evaluate through UHPLC-HRMS untargeted phenolic compounds profiling. This approach allowed to putatively annotate 991 secondary compounds with 258 significantly modulated (p value < 0.05) in R:B LED-treated plants compared to the control with a |log2FC| ≥ 1 (Figure 3 and Supplementary Table S1).
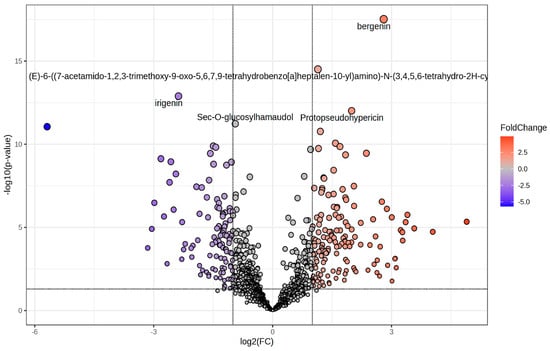
Figure 3.
Volcano plot representing the significantly changed metabolites in V. locusta L. plants in R:B LED light conditions. The metabolites defined as significantly changed were those with log2(FC) > 1 and p value < 0.05, corrected by false discovery rate. The grey dots represent the metabolites with no significant differences; the red dots describe the increasing metabolites while the blue dots show the decreasing.
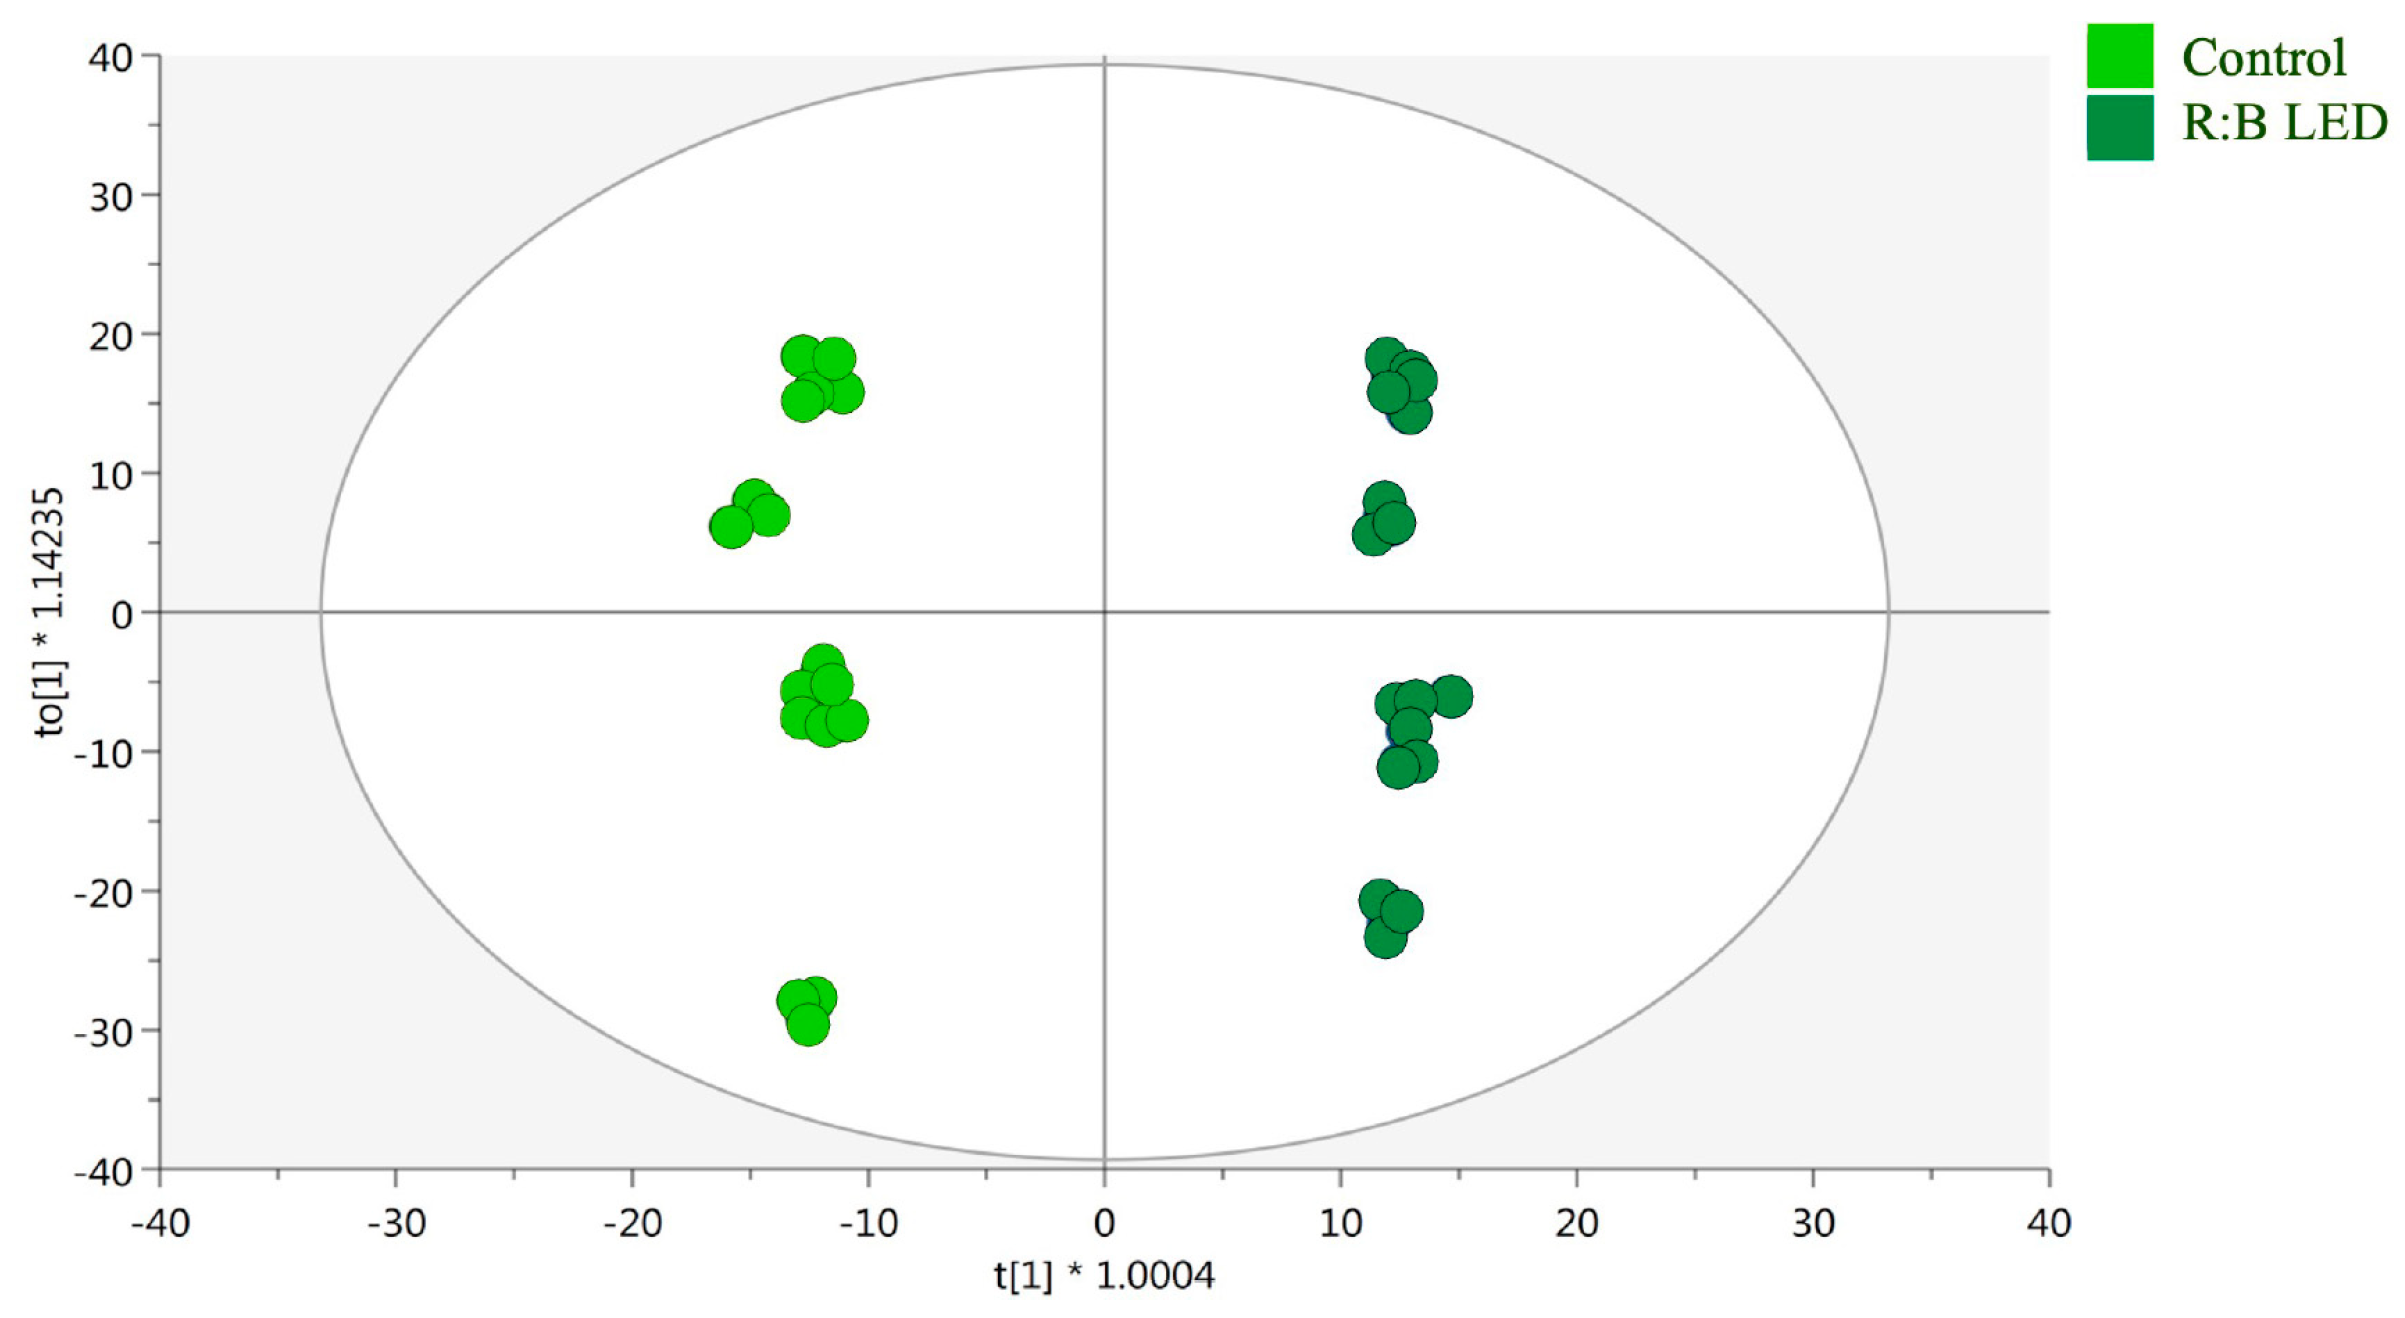
Moreover, supervised OPLS-DA was performed to determine the markers of the differences noted in the control and R:B LED plants. Above all, as reported in the OPLS-DA score plot (Figure 4), the separation of R:B LED light-treated and control samples was observed on the latent vector t [2]. The model parameters were adequate, being goodness of fit (R2) = 0.99 and prediction ability (Q2) = 0.961 with no outliers (Hotelling’s T2). The CV-ANOVA (p value = 4.68 10−17) for regression and the permutation test (n = 100), excluded overfitting (Supplementary Table S1). Then, the variable importance in projection (VIP) method was used for the identification of the most discriminant compounds involved in the differences outlined by the OPLS-DA plot. Using a VIP score > 1.2, 246 compounds were selected, with kaempferol possessing the highest discrimination ability (VIP score = 1.8), followed by the isoflavan glyasperin D (VIP score = 1.78) and the hydroxybenzoic acid 2-hydroxybenzoic acid with a VIP score = 1.77.
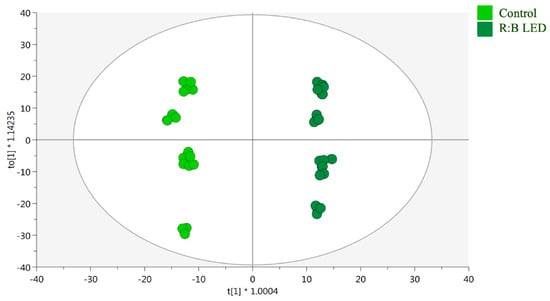
Figure 4.
Supervised orthogonal projection to latent structures discriminant analysis (OPLS-DA). Score plot of the OPLS-DA carried out on untargeted metabolomics profiles of V. locusta plants growth in control and R:B LED conditions (R2Y = 0.99, Q2Y = 0.96). Each dot represents an individual technical replicate (n = 3) derived from each of the six biological replicates per treatment group.
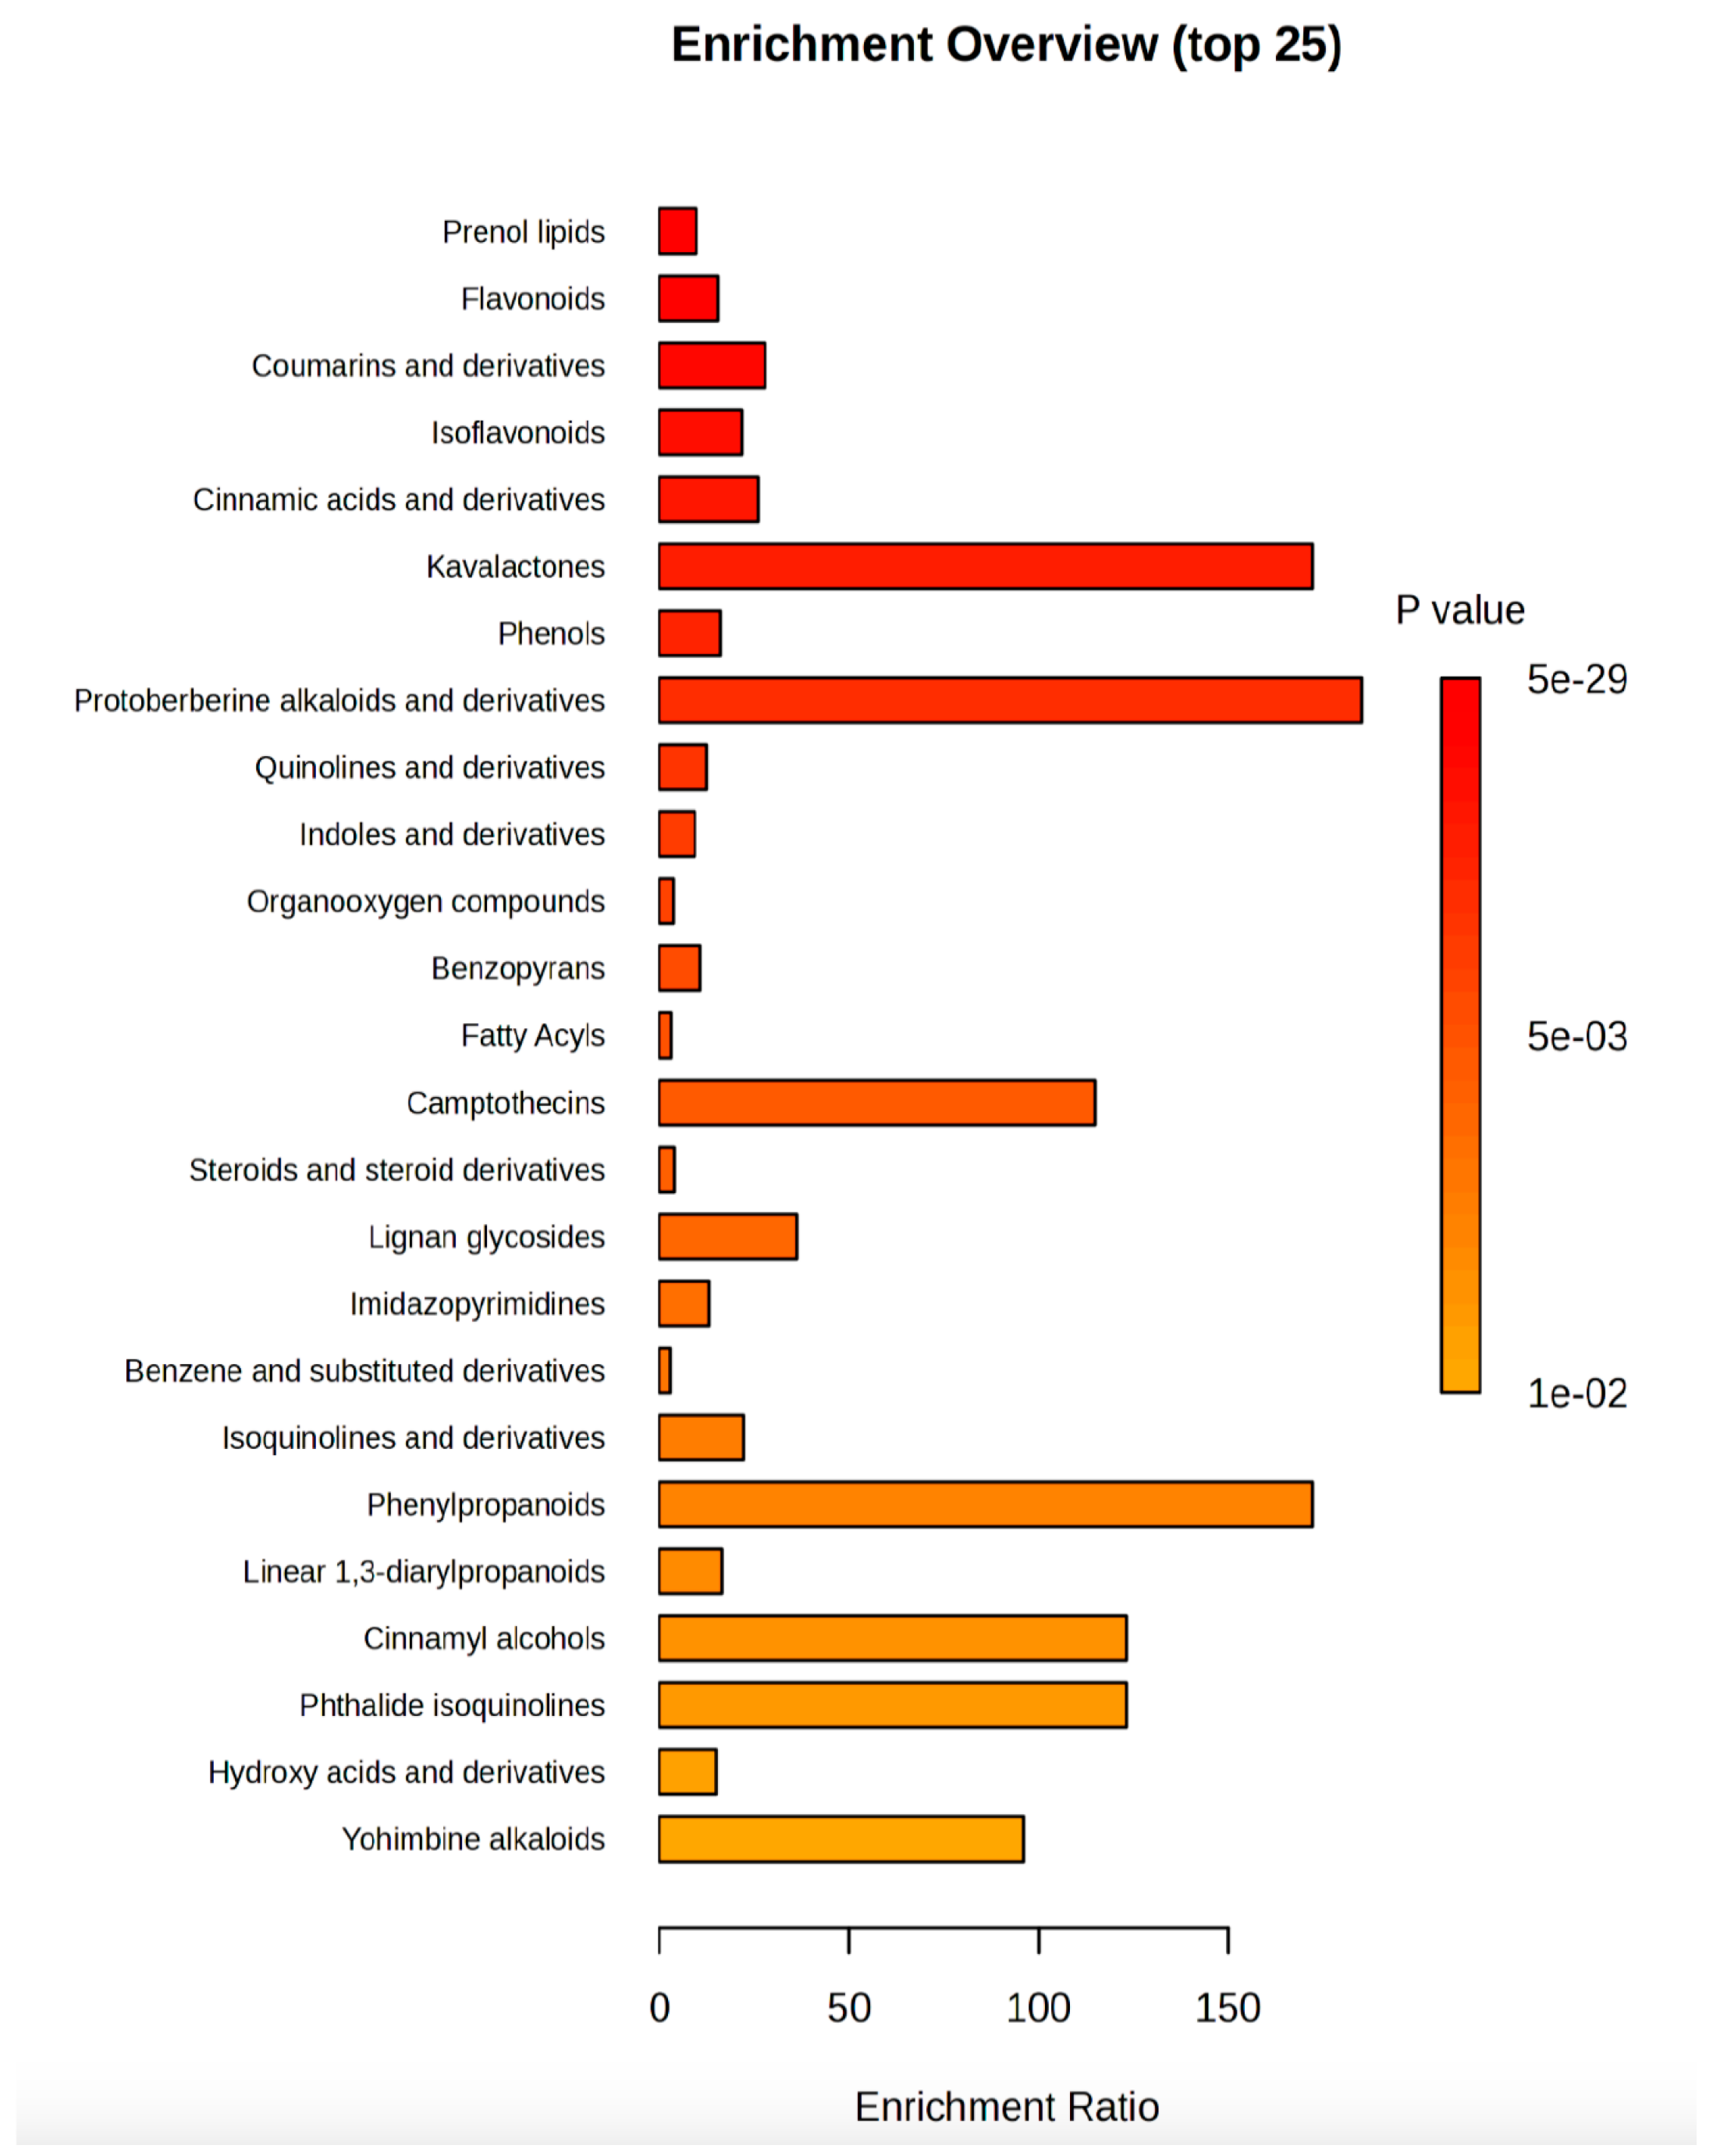
Finally, an overview of the most enriched classes of secondary metabolites (Figure 5) pointed out that kavalactones and protoberberine alkaloids and their derivatives were the classes with the lowest p value and the enrichment ratio higher than 50, followed by camptothecins, phenylpropanoids, cinnamyl alcohols, phthalide isoquinolines, and yohimbine alkaloids.

Figure 5.
Metabolites enrichment analysis. The metabolites diagram displayed the 25 significantly (p value < 0.05) enriched classes of compounds in R:B LED light-treated V. locusta plants. The enrichment ratio is determined by the number of observed hits divided by the expected number of hits.
2.4. Antioxidant Properties
In this study, the antioxidant activities were evaluated using four different methods: 1,1-Diphenyl-2-picrylhydrazyl (DPPH), 2,2’-Azino-bis (3-ethylbenzothiazoline-6-sulfonic acid) (ABTS), Cupric Reducing Antioxidant Capacity (CUPRAC), and Ferric Reducing Antioxidant Power (FRAP) assays (Table 1). In general, independently from the assay considered, the antioxidant capacity of plants grown under R:B LED light resulted higher compared to control plants. In detail, DPPH scavenging activity resulted 12% higher in R:B LED-treated plants as compared to control plants, whereas slightly higher antioxidant ability, ranging between 42% and 45%, was assessed by ABTS, CUPRAC, and FRAP assays in V. locusta plants grown under R:B LED light. Also, the phosphomolybdenum assay (PBD), generally used to measure the total antioxidant capacity, resulted in a significantly higher activity (+18%) in lambs’ lettuce grown under R:B LED light with respect to control plants (Table 1).
Consistently, the determination of metal-chelating activity (MCA), applied to assess the ability of a sample to bind metal ions and prevent their catalytic activity, displayed higher values (+12%) in the case of R:B LED light-treated plants with respect to control ones (Table 1). The variability in the extent of responses observed among the assays can be attributed to the different chemical principles and sensitivities of each method. In fact, each antioxidant assay assesses distinct mechanisms of action and target specific classes of antioxidant compounds.
2.5. Enzyme Inhibitory Activity
The inhibitory potential of V. locusta extracts against cholinesterases (AChE and BChE), α-amylase, α-glucosidase, and tyrosinase enzymes was investigated (Table 2).
Table 2.
Quantification of enzyme inhibition activities in extracts of V. locusta L. plants grown in either R:B LED light or control conditions at harvest. Data are reported as mean ± SE (n = 4). The statistical significance has been tested through one-way ANOVA and Tukey post hoc test (p value < 0.05). Different letters indicate significantly different values.
The biochemical assays did not show any significant difference between R:B LED light-treated plants and control ones when AChE, BChE, tyrosinase, and α-amylase inhibitory activity were considered. On the other hand, V. locusta plants exposed to R:B LED light featured a significant increase, by about 300%, in α-glucosidase inhibition with respect to control plants (Table 2).
2.6. Quality Evolution of Ready-to-Eat Lamb’s Lettuce During Refrigerated Storage
The lamb’s lettuce weight loss during the storage in refrigerated conditions was around 1–2% for both control and R:B LED-treated plants and was unchanged throughout the entire storage time. Similarly, firmness was comparable for both samples, accounting for ~0.72 kN during up to 28 days at 4 °C.
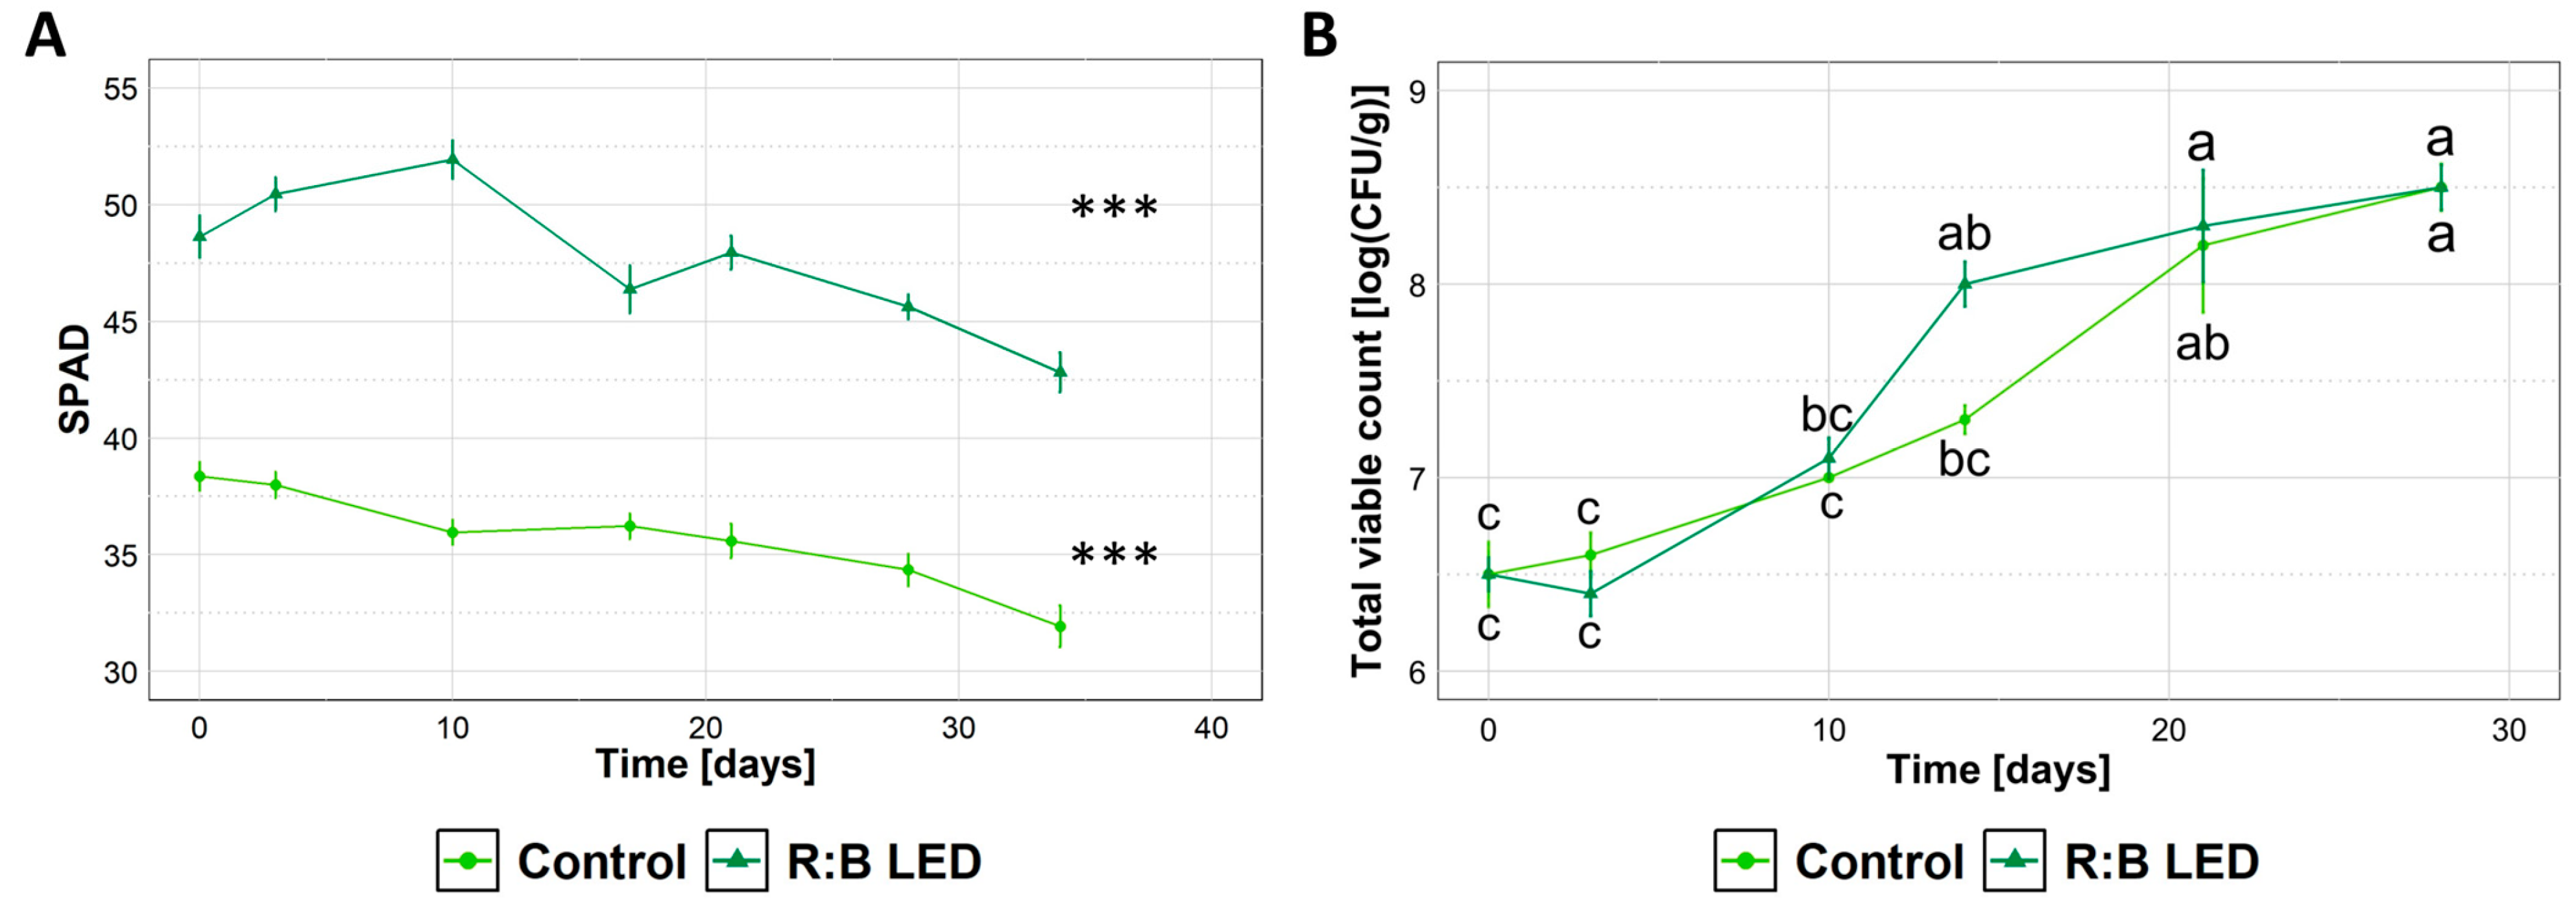
Regardless of the cultivation system, the SPAD index progressively decreased upon storage (Figure 6A) indicating a loss of chlorophyll content of samples. Upon storage of lamb’s lettuce, no alterative events (i.e., rotting, browning) were visually detected. Similarly, no off flavours were detected upon informal sniffing, indicating that overall sensory attributes of lamb’s lettuce were preserved. Independently of the exposure or not of lamb’s lettuce to R:B LED light, microbiological analysis revealed that samples did not support the growth of coliforms, which were found to be below 5 CFU/g for the entire storage time. Just after preparation, the total viable count (TVC) (Figure 6B) was 6.5 log CFU/g for both samples, in agreement with Manzocco et al. (2021) [31] who reported similar results for the fresh-cut product obtained from V. locusta. Upon cold storage, a progressive increase in TVC was detected, reaching 8.5 log CFU/g after 28 days, independently of the cultivation system.
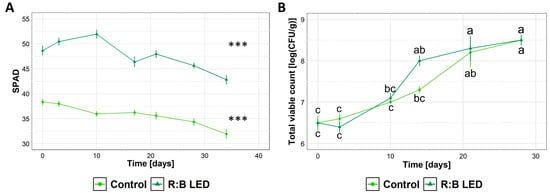
Figure 6.
Characteristics of ready-to-eat Valerianella locusta L. upon cold storage. SPAD Index (A) and total viable count (TVC) (B) of ready-to-eat V. locusta grown in R:B LED light and control conditions at harvest. Data were collected from the harvest through 28 days for TVC and 34 days for SPAD of storage at 4 °C. SPAD index data are reported as mean ± SE (n = 10). TVC data are reported as mean ± SE (n = 3). The statistical significance has been tested through one-way ANOVA and Tukey post hoc test (p value < 0.05). Asterisks indicate significant difference upon storage within the same growing condition. Different letters indicate significantly different values.
3. Discussion
3.1. Plant Morphology and Growth Parameters
The scrutiny extended to the biometric parameters of shoot fresh weight (SFW) and shoot dry weight (SDW) of V. locusta plants yielded insights into growth dynamics showing that R:B LED treatment had a significant impact on plants growth. Additionally, an intriguing trend emerged from the SPAD measurement data, showing that the mean SPAD index increased in R:B LED-treated plants as compared to control plants. Similarly, the R:B LED treatment induced a significant increase in the total leaf area per plant with respect to control plants. Overall, these findings emphasized that R:B LED light can significantly stimulate the growth of V. locusta plants also inducing a significant accumulation of pigments at the leaf level.
Plant biomass holds substantial importance as a critical growth parameter and it is conventionally regarded as a dependable marker for evaluating a plant’s resilience or vulnerability to stress factors [32]. The plant’s morphogenetic responses, like shoot branching or tillering, stem elongation, and flowering induction, are significantly influenced by the surrounding light conditions [33]. The spectral composition of light emerged as the dominant factor in influencing stem elongation and subsequently causing more significant variations in plant height, overshadowing the role of light intensity [33]. Sequential and coordinated interplay of various photosensors [34], phytochromes (A and B), which are susceptible to red and far-red light, as well as phototropins and cryptochromes, which detect blue light, collectively contribute to the inhibition of stem elongation [35]. Notably, the interaction of red and blue LED irradiation has proven to be a catalyst for shoot organogenesis enhancement in a variety of species, including potato [36] and lilium bulb formation [37]. In addition, the augmentation of shoot regeneration has been documented in different species through monochromatic red or blue LED irradiation [38,39]. Moreover, our findings also align with other shoot elongation results induced in plants like blueberries [40] and sugarcane [41].
3.2. Content of Organic Acids, Sugars, and Phenolic Compounds
Malic, citric, and fumaric acid levels were measured for this study. Their concentrations are intricately regulated by phosphoenolpyruvate carboxylase (PEPC), citrate synthase (CS), and malate dehydrogenase (MDH), through either direct or indirect mechanisms [42]. Interestingly, there are few studies that mention the impact of LED light on organic acid metabolism. Nevertheless, it is well known that the concentration of organic acids in plants fluctuates in response to diverse environmental and developmental factors. These factors encompass variations in light and temperature, diurnal and seasonal changes, the ripening of fruits, the aging process, the specific plant tissue and cell compartments, as well as a broad spectrum of environmental stressors [43]. In fact, the ultimate content of organic acids within a plant or specific tissue is dictated by the overall equilibrium between acid synthesis, degradation, utilization, and compartmentalization. Several factors including temperature, light exposure, fertilization, water availability, and various plant management techniques influence the source-to-sink ratio, consequently impacting the organic acid content [44]. However, another study that focused specifically on the metabolic changes of organic acids failed to provide conclusive data on the effect of light on the synthesis of citric acid, malic acid and fumaric acid in plants [45]. Therefore, the impact of light on organic acid metabolism is a subject of conflicting findings in the literature. The observed variations in organic acid concentrations of our study underline the potential influence of light quality on primary metabolic pathways in V. locusta plants, as large differences in citric, malic, and fumaric acid concentrations were observed between the two treatments considered. In fact, the specific light spectra we provided by LED supplementation appeared to trigger metabolic shifts, leading to altered organic acid profiles. These findings suggested a direct interaction between light perception and metabolic regulation, emphasizing the need for further research to understand the molecular mechanisms behind these observations.
The findings of this study further revealed the complex relationship between light quality, carbohydrate metabolism, and their implications for plant growth and development. Our results, which showed variations in sucrose and fructose levels under different light conditions, aligned with previous research that emphasized the pivotal role of light quality in shaping plant physiological processes. Interestingly, besides functioning as carbon (C) source and energy reservoir, sugars also play a crucial role in responding to oxidative stress and stabilization mechanisms, highlighting their sensitivity to environmental cues, including light quality [46]. Recent research conducted by Li et al. (2017) [47] shed light on the relationship between sucrose accumulation and the activation of specific antioxidant enzymes responsible for mitigating reactive oxygen species. In particular, Li et al. (2017) [47] also demonstrated that the exposure of tomato fruits to red light amplifies the activity of enzymes associated with sucrose metabolism, ultimately resulting in an elevated soluble sugar content. These observations were further confirmed in other plants such as Chinese bayberry [48].
In addition, numerous investigations have addressed the influence of light quality on plant C and nitrogen (N) metabolism. For instance, in cabbage, exposure to red LED light promotes the accumulation of carbon metabolites, including soluble sugars, sucrose, and starch [49]. Conversely, lettuce seedlings exposed to intermitting R:B LED lighting showed the highest levels of soluble sugars, starch, and sucrose, along with a higher C/N ratio, compared to those under R LED light alone [50]. On the other hand, it was observed that a 3 h supplementation of R:B LED light increased the expression of key Calvin cycle genes and sugar metabolism enzymes, enhancing CO2 fixation and photosynthetic capacity in cucumber plants [51]. The enzymes involved included invertases, sucrose synthases, and hexokinases. This treatment promoted the synthesis and accumulation of photosynthates in cucumber leaves [51].
The further biochemical profiling of V. locusta exposure to R:B LED light revealed a significant accumulation of phenolic compounds, suggesting that the light spectrum provided may have triggered a specific metabolic response. The synthesis of phenolic compounds follows the shikimate pathway in plants, where phenylalanine acts as a crucial intermediate. Interestingly, this pathway is regulated by several factors, among which light conditions and reactive oxygen species generated in response to excessive light exposure are well-characterized [52]. Indeed, earlier research has revealed that the combination of B and R LED lights, both individually [53] and concurrently [54], enhanced total phenolic content by increasing the photosynthetic activity and promoting the accumulation of malonyl-CoA, which is a precursor associated with phenolic compound synthesis.
3.3. Profiling of Phenolic Compounds
Untargeted phenolic compounds investigation demonstrated that V. locusta control samples and those subjected to R:B LED light had a completely different metabolic profile, as represented by the clear separation in the OPLS-DA score plot. One of the compounds that drove the differences between the two conditions was the secondary metabolite protopseudohypericin (VIP score = 1.70). This hydrated proto-form, together with protohypericin, are biosynthetic precursors that are subsequently converted into the cyclic compounds pseudohypericin and hypericin when exposed to light. These molecules have beneficial activity in neurodegenerative disorders due to their neuroprotective and antidepressant properties [55]. Thus, the quality and wavelength of light determine the synthesis of primary (proteins, carbohydrates, vitamins, etc.) and secondary metabolites which provided favourable properties to the cultivated agricultural and horticultural species [13]. Several studies reported the positive effect of R:B LED light on sugars content and antioxidant capacity, phenolic compounds, carotenoids, ascorbic acid, and chlorophyll in different leafy vegetable crops [56,57]. In fact, exposure to different wavelengths induces distinct physiological processes in plants leading to changes in pigments and their related biosynthetic enzymes [58]. These effects are mediated through specific photoreceptors such as phytochromes (red/far-red light) and cryptochromes or phototropins (blue light), which regulate downstream gene expression related to metabolic pathways [59].
Accordingly, in our results, compared to the control, the R:B LED light induced an over-accumulation of several flavonoid glycosides including kaempferol-4’-glucoside, naringin dihydrochalcone, baohuoside I, and engeletin. These compounds are well documented for their strong antioxidant, anti-inflammatory, and anticancer properties [60,61,62]. Modulation of isoflavones, gallic acid, coumaric acid, cinnamic acid, and triterpenoids was also observed. These compounds are likely key contributors to the enhanced antioxidant activity measured in R:B LED-treated samples. Notably, the first stage of the phenylpropanoids synthesis is light-dependent because the activity of phenylalanine ammonia-lyase (PAL) is regulated by the light; this enzyme catalyses the deamination of p-phenylalanine to trans-cinnamic acid. In addition, the expression and the activity of chalcone synthase, which condenses the CoA-ester of cinnamic acid with malonyl-CoA, is also regulated by light [58]. In particular, Długosz-Grochowska et al. (2017) [28] outlined that blue LED light has a major role in the regulation of polyphenol synthesis, with low concentrations of these compounds under lacks blue wavelengths radiation. Therefore, the result obtained from the volcano analysis outlined an increase in the alkaloid baptifoline (log2FC = 4.89) under R:B LED light. The biosynthesis of alkaloids is also influenced by light-mediated gene expression, as B and R light promote transcription of alkaloid pathway enzymes [63]. These compounds might possess a wide range of pharmacological properties including antitumor, antibacterial, and anti-inflammatory activities [64].
Likewise, our analysis suggested also an increase in terpenoids under combined R:B LED light. These results were in accordance with previous data [65], pointing out that a combination of R:B LED light induced an increase in terpenoid content in basil, achieving similar results in Perovskia [66]. A modulation of coumarins and derivatives was noted supporting earlier findings [67] and revealing that light stimulated the accumulation of coumarins in Eclipta alba. Together with these bioactive compounds, the enrichment analysis also suggested an increase in kavalactones including dihydrokawain, yangonin, and dihydromethysticin.
3.4. Antioxidant Properties and Enzyme Inhibitory Activity
The assessment of antioxidant activity through various assays provided valuable insights into the capacity of plant extracts to neutralize free radicals and oxidative stress. Our observations collectively suggested that the R:B LED light supplementation had the capability to enhance the antioxidant capacity of V. locusta plants, potentially leading to increased protection against oxidative stress. Indeed, phenolic compounds and flavonoids are known to possess strong antioxidant properties, and their presence in a sample can contribute to its overall antioxidant capacity as measured by these assays. The observed increase in phenolic content and antioxidant activity under R:B LED light aligns with and, in some cases, surpasses findings reported in similar studies. This work recorded a 30% increase in total phenolic content, which is comparable to or exceeds the 15–25% increases previously observed in lamb’s lettuce and basil under similar R and B LED light treatments [21,28]. In terms of antioxidant capacity, this study showed an enhancement of 12–45% across DPPH, ABTS, CUPRAC, and FRAP assays, which is consistent with prior findings on kale and spinach where antioxidant activity improvements ranged from 30–40% [20]. Moreover, Samuolienė et al. (2011) [68] found that the application of B and R LED light had the potential to enhance the antioxidant properties of sprouted lentil and wheat seeds, which was attributed to the higher levels of total phenols present in the sprouted seeds. However, besides phenolics, other compounds (e.g., carotenoids) can also contribute to the antioxidant activity [69].
In addition to antioxidant activity, enzyme inhibition also plays a central role in pharmaceutical and nutraceutical applications, as many diseases can be traced back to the activity of certain enzymes in the human body [70]. For this reason, the inhibitory potential of V. locusta extracts were evaluated against an array of key enzymes, namely cholinesterases (AChE and BChE), α-amylase, α-glucosidase, and tyrosinase. In particular, the combination of R:B LED light was shown to positively impact only the α-glucosidase inhibition activity. α-glucosidase inhibitors have gained significant pharmacological interest since they are widely used in the management of type 2 diabetes, particularly for mitigating postprandial hyperglycaemia by slowing down the breakdown of dietary carbohydrates [71]. The enhanced α-glucosidase inhibition observed under R:B LED light is likely due to the specific induction of secondary metabolites, such as flavonoids (e.g., kaempferol derivatives) and alkaloids (e.g., baptifoline), which are known inhibitors of this enzyme [72,73,74]. These compounds may act synergistically to modulate glycaemic response, providing a functional food benefit and suggesting that targeted light strategies could improve the antidiabetic potential of leafy vegetables. In contrast, enzymes like AChE and BChE are likely regulated by other metabolites that were not significantly modulated in our study, underscoring the specificity of light-induced metabolic pathways. This evidence encourages further investigation into the potential connections between light conditions and enzymatic modulation.
3.5. Post-Harvest Quality
Lamb’s lettuce is mainly consumed as a fresh-cut product, sealed in bags and stored at refrigeration temperature to guarantee adequate product shelf life. For this reason, V. locusta samples subjected to R:B LED light conditions were also processed into a fresh-cut product, which was evaluated for quality parameters upon a refrigeration period of 30 days. Our observations highlighted a loss of firmness and a decrease in SPAD index upon storage, which were indeed in accordance with previous data [31] showing the same downward trend when ready-to-eat lamb’s lettuce was stored at 4 °C for up to 30 days.
The detected microbial contamination level was expected since vegetables were not sterile. Cutting and washing operations, which are typically performed during fresh-cut processing, are well known to induce a moderate decrease in bacteria count solely [75]. The assessment of TVC during product storage was thus performed with the aim of assessing if the applied LED light pre-treatment could impair product stability during storage, modifying product shelf life. The observed increase in TVC upon storage can be attributed to the fact that minimally processed products are more prone to microbial multiplication than intact plants due to the presence of cutting surfaces, altered plant tissue respiration, and confinement in the packaging [75]. In this regard, some European countries suggest producers to adopt a specific microbiological limit, corresponding to 7 log CFU/g, to estimate the shelf life of minimally processed fruit and vegetables. According to this criterion, the 7 log CFU/g limit was exceeded at 14 days of storage for both control and R:B LED light-exposed plants. This period is in line with the average shelf life of fresh-cut vegetables, which has been reported to vary between 6 and 21 days depending on the product, packaging material, and storage temperature [76]. Indeed, these results demonstrated that hygienic quality should be considered as the main indicator of qualitative decay of fresh-cut V. locusta during refrigerated storage. In fact, microbial count grew beyond the acceptability limit much earlier than any changes in other quality parameters (i.e., SPAD index, weight loss, and firmness) were detectable, making it a key parameter for assessing the quality of V. locusta.
3.6. Conclusions
The study of red and blue (R:B, 70%:30%) LED light supplementation on V. locusta revealed significant effects on plant physiology and biochemistry. R:B light improved chlorophyll content, shoot and root biomass, and leaf area, indicating enhanced plant morphology. It also increased fructose and sucrose levels, suggesting a positive influence on carbohydrate metabolism and energy allocation.
Significant changes in citric and malic acids under R:B light highlighted their role in modulating primary metabolic pathways. Notably, the rise in phenolic compounds and associated antioxidant activity pointed out a strengthened in defense system and enhanced synthesis of bioactive metabolites, including flavonoids, alkaloids, and terpenoids.
Enzyme inhibition assays revealed a marked increase in α-glucosidase inhibition, suggesting potential antidiabetic properties. Lastly, post-harvest analysis showed that all light conditions supported acceptable shelf-life and microbiological quality in fresh-cut V. locusta.
Incorporating these findings into the broader context of plant science and controlled environment agriculture (e.g., vertical farming), this study underscored the significance of light quality in shaping plant biochemistry, paving the way for informed strategies in crop cultivation. Nevertheless, the significant variability of some results necessitates further analyses to understand the precise molecular mechanisms driving these observed phenomena. Overall, this research opened promising avenues for optimizing crop production to deliver nutrient-dense and high-quality products, with potential implications for both agriculture and human health.
4. Materials and Methods
4.1. Plant Growth Conditions
Lamb’s lettuce (Valerianella locusta L. cv Volhart 3) plants were cultivated in 104-well trays filled with a mixture of river sand (Laterlite Spa, Milano, Italy) and perlite (Orvital Spa, Milano, Italy) (1:1 v/v). Plant cultivation was carried out in fall season in the plant-growth chamber Microcosm (Piano Green Srl, Bolzano, Italy) equipped with LED lights. All plants, one per well, were cultivated for 36 days from seed sowing, with a photoperiod of 16/8 h (day/night) and a total photosynthetic photon flux density (PPFD) of 200 µmol m−2 s−1. Control plants were illuminated for the whole growth period with white (350–750 nm) LED light (Supplementary Figure S1A), whereas treated plants were illuminated for the first 14 days with white LED light, followed by 22 days of red (645–695 nm) LED light and blue (425–475 nm) LED light mixed in a ratio of 70%:30% red/blue (R:B) (Supplementary Figure S1B). The Microcosm maintained the average temperature at 20 °C, with a relative humidity (RH) of 56% and a ventilation rate of 10 air changes per hour (ACH). All plants were irrigated three times per week with 10 mL of a modified Hoagland’s solution with the following composition: 0.36 g L−1 Ca(NO3)2, 0.1 g L−1 KH2PO4, 0.13 g L−1 MgSO4, 0.8 g L−1 KNO3, 0.04 g L−1 NH4NO3, and 0.01 mg L−1 Mikron fertilizer (Cifo Srl, Bologna, Italy).
4.2. Plant Growth Evaluation
On the 36th growth day, four plants of each treatment were considered for leaf area (LA) evaluation. All the plant leaves were digitally scanned utilizing Easy Leaf Area software (version 2.0) [77], using as reference 1 cm2 square and default parameters.
The same plants were considered for shoot fresh weight (SFW) and subsequently dried at 65 °C until constant weight to determine the shoot dry weight (SDW).
Additionally, the SPAD index of fully expanded leaves of ten plants of each treatment was assessed using a SPAD-502 portable chlorophyll meter (Minolta, Osaka, Japan). The average of five SPAD measurements was calculated for each leaf.
4.3. Preparation of Fresh-Cut Lamb’s Lettuce
Lamb’s lettuce leaves were immediately processed after harvesting. In particular, leaves were washed with water at 8 °C for 3 min with a salad-water ratio of 1:18 (w/w) and then centrifuged in a manual kitchen centrifuge for 1 min. Aliquots of 20 g of lamb’s lettuce were packed under air in 30 × 20 cm bags of a commercial bioriented polypropylene (BOPP, 30 µm thickness) (Taghleef Industries SPA, S. Giorgio di Nogaro, Italy), sealed by a packaging machine (Easy Packer EP-400-C; AVC Italia, Turin, Italy), and stored at 4 °C for increasing times up to 28 days.
4.4. Organic Acids and Sugars Content
Organic acids (aconitic, citric, fumaric, malic, oxalic, and succinic acids) and sugars (fructose, glucose, and sucrose) were quantified according to Pii et al. (2018) [78] and Valentinuzzi et al. (2018) [79]. Briefly, freeze-dried leaves of six biological replicates of each treatment were extracted with methanol (HPLC grade, Merck, Darmstadt, Germany) using a 1:10 extraction ratio. Samples were then sonicated for 30 min in a thermostatic bath and centrifuged at 14,000× g for 30 min at 0 °C. Finally, the supernatant was collected and filtered through a 0.2 μm filter (Sarstedt AG, Nümbrecht, Germany). The compound separation was carried out through HPLC using a cation exchange Aminex 87-H column (300 × 7.8 mm, 9 μm, Bio-Rad), employing an isocratic elution with 10 mM H2SO4 as the carrier solution at a flow rate of 0.6 mL min−1. Detection of organic acids occurred at 210 nm utilizing a Waters 2998 photodiode array detector (Waters Spa, Milano, Italy), while sugars were detected via a refractive index detector (Waters Spa, Milano, Italy). Standard acids and sugars from Sigma Aldrich (St. Louis, MO, USA) were used to produce calibration curves for each molecule considered.
4.5. Total Phenolic Compounds Content
Four biological replicates of each treatment were used for the determination of total phenolic compounds leaf content. Total phenolic content evaluation was conducted as reported in Uysal et al. (2017) [80]. A sample solution (0.25 mL) was vigorously combined with a diluted Folin–Ciocâlteu reagent (1 mL, 1:9, v/v). After 3 min, a Na2CO3 solution (0.75 mL, 1%) was added to the mixture. The absorbance was measured at 760 nm following a 2 h incubation at room temperature. The total phenolic content was calculated in milligrams of gallic acid equivalents per gram of extract (mg GAE g−1).
4.6. Untargeted Phenolic Compounds Profiling by HRMS Metabolomics
The lamb’s lettuce metabolites were extracted by six biological replicates in a hydro-alcoholic solution (80% methanol, v/v) acidified with 0.1% formic acid with a homogenizer (Polytron PT 1200 E, Kinematica AG, Lucerne, Switzerland). The extracts were then centrifuged (6000 × g for 15 min at 4 °C) and filtered with 0.2 μm cellulose syringe filters into vials. The UHPLC-HRMS analysis was performed through a Q Exactive™ Focus Hybrid Quadrupole-Orbitrap Mass Spectrometer (Thermo Scientific, Waltham, MA, USA) coupled to a Vanquish ultra-high-performance liquid chromatography (UHPLC) pump, equipped with a heated electrospray ionization (HESI)-II probe (Thermo Scientific, USA). The mobile phases were water and acetonitrile (both LC-MS grade, from Sigma-Aldrich, Milan, Italy), gradient elution from 6 to 94% acetonitrile in 35 min, and as phase modifier 0.1% formic acid. The analytical column used for chromatographic separation was an ACQUITY UPLC BEH C18 (2.1 × 100 mm, 1.7 μm). The MS analysis was in full scan mode (in the m/z range 80–1200) with positive ionization (mass resolution: 70,000 at m/z 200), flow rate of 200 μL/min, and injection volume of 6 μL. Moreover, n = 3 quality control (QC) samples were injected randomly and analysed in a data-dependent (top n = 3) MS/MS mode, with the fragmentation of the most abundant ions under stepped normalized collisional energy (i.e., 10, 20, 40 eV).
Subsequently, the raw data were handled in the software MS-DIAL (version 4.90) [81], according to automatic peak finding, locally weighted scatterplot smoothing (LOWESS) normalization, and annotation via spectral matching. The comprehensive FooDB (https://www.foodb.ca) database was exploited for annotation; identification was achieved by accurate mass tolerance, isotopic pattern, and spectral matching. Accordingly, a level 2 confidence in annotation (typical of untargeted metabolomics) was achieved, according to the COSMOS standards in metabolomics [82]. A confidence level of 2 implies putative compounds annotation without confirmation by authentic standards allowing a broad metabolic coverage, but leading to potential uncertainties in compound identification which is a common limitation of untargeted metabolomics [83].
4.7. Antioxidants and Enzyme Inhibitory Activities
The antioxidant potential was assessed using a range of complementary assays, including DPPH and ABTS radical scavenging assays (which measure the ability of compounds to neutralize free radicals through hydrogen or electron donation), reducing power assays (CUPRAC and FRAP, which evaluate the electron-donating capacity of antioxidants), phosphomolybdenum assay (PBD) (used to determine total antioxidant capacity, capturing both hydrophilic and lipophilic antioxidants), and metal-chelating activity (MCA) (which assesses the ability of compounds to bind transition metals such as Fe2+, thereby preventing the generation of reactive oxygen species via Fenton-type reactions). Enzyme inhibitory activities were also evaluated, including cholinesterase (AChE and BChE) via Elmann’s method, tyrosinase using the dopachrome method, α-amylase employing the iodine/potassium iodide method, and α-glucosidase through the chromogenic PNPG method. These assays were conducted on four biological replicates per treatment, following methodologies previously outlined [80,84]. DPPH, ABTS, CUPRAC, and FRAP assays were expressed as mg Trolox equivalents (TE) g−1 extract. Total antioxidant activity carried out through PBD assay was expressed as mmol TE g−1 extract, whereas the MCA was reported as mg EDTA equivalents (EDTAE) g−1 extract.
AChE and BChE inhibitory activities were given as mg galanthamine equivalents (GALAE) g−1 extract, tyrosinase inhibitory activity was expressed as mg kojic acid equivalents (KAE) g−1 extract, and amylase and glucosidase inhibitory activities were presented as mmol acarbose equivalents (ACAE) g−1 extract.
4.8. Weight Loss and Firmness
Weight loss of fresh-cut lettuce was determined by weighing the content of the packages before and after the storage period, whereas SPAD values were recorded regularly during the storage period.
The firmness of the lamb’s lettuce was measured by an Instron 4301 universal tester (Instron Ltd., High Wycombe, UK) using a ten-blade Kramer shear cell. The instrumental settings and operations were accomplished using the software Automated Materials Testing System (version 5, Series IX; Instron Ltd.). Aliquots of 10 g of lamb’s lettuce were compressed to 50 mm. The test speed was 50 mm/min. Force–distance curves were recorded and firmness was taken as the maximum force required to compress salad. The determination was performed at the beginning and end of storage.
4.9. Microbiological Analyses
About 10 g of fresh-cut lamb’s lettuce were homogenised in a Stomacher (International PBI, Milan, Italy) for 1 min at normal speed with 90 mL of maximum recovery diluent (MRD; Oxoid, Basingstoke, UK). Serial dilutions (1:10) were made in MRD and analysed for microbial counts. Appropriate aliquots (0.1 mL or 1 mL) were spread on agar plates. Plate count agar (Oxoid) was used for the enumeration of aerobic mesophilic bacteria at 30 °C for 48 h. Pour plating in Coli ID (bioMerieux, Mercy l’Etoile, France) with a covering layer of the same medium incubated at 37 °C for 24 h was used for the enumeration of total and faecal coliforms. The determinations were conducted at 0, 3, 10, 14, 21, and 28 days.
4.10. Statistical Analysis
Statistical significance analysis for each data assay was conducted applying one-way ANOVA test followed by Tukey’s HSD test with p value < 0.05 using R software (version 4.0.3). The following R packages were used for data visualization and statistical analyses: ggplot2, agricolae, and ggpbur.
For metabolomics data, both unsupervised and supervised statistical analysis were performed in MetaboAnalyst 5.0 and SIMCA 13 (Umetrics, Malmo, Sweden) software, respectively. The raw data were centred by median, log2 transformed, Pareto scaled, and used to build the hierarchical cluster analysis (HCA, using Euclidean distance and Ward’s method as the linkage rule) and the orthogonal projections to latent structures discriminant analysis (OPLS-DA), considering the control samples and R:B LED light-treated lettuces. Following the OPLS-DA model validation parameters, goodness-of-fit (R2) and goodness-of-prediction (Q2) were registered, the model was inspected for outliers, cross-validated (CV-ANOVA), and the permutation test (n = 100) was executed to exclude overfitting. Then, the compounds mostly responsible for discrimination between the condition tested were investigated through the variable importance of projection (VIP) analysis, using a VIP score > 1.1.
Supplementary Materials
The following Supporting Information can be downloaded at: https://www.mdpi.com/article/10.3390/plants14121887/s1. Table S1: List of significantly modulated metabolites in extracts of V. locusta plants grown in R:B LED light as compared to control conditions. Figure S1: Emission spectra of white LED light (A) and of R:B LED light (B).
Author Contributions
S.M. (Sonia Monterisi): Writing—original draft, visualization, investigation, data curation, methodology, validation, writing—review and editing; C.R.V.: Writing—original draft, data curation, methodology, validation; M.Y.A.Z.: Investigation, data curation, methodology, validation; S.M. (Sofia Melchior): Writing—original draft, visualization, investigation, data curation, methodology, validation, writing—review and editing; B.S.: Writing—original draft, visualization, investigation, data curation, methodology, validation, writing—review and editing; G.Z.: Investigation, data curation, methodology, validation; R.F.: Investigation, data curation, methodology, validation; U.L.: Investigation, data curation, methodology, validation; T.d.O.C.: Investigation, data curation, methodology, validation; L.M.: Supervision, writing—review and editing; L.L.: Supervision, writing—review and editing; S.C.: Conceptualization, supervision, writing—review and editing; Y.P.: Conceptualization, supervision, validation, resources, visualization, project administration, funding acquisition, writing—review and editing. All authors have read and agreed to the published version of the manuscript.
Funding
This work was financially supported by Project funded under the National Recovery and Resilience Plan (NRRP), Mission 4 Component 2 Investment 1.3—Call for tender No. 341 of 15 March 2022 of Italian Ministry of University and Research funded by the European Union—NextGenerationEU; Project code PE00000003, Concession Decree No. 1550 of 11 October 2022 adopted by the Italian Ministry of University and Research, CUP D93C22000890001, Project title “ON Foods—Research and innovation network on food and nutrition Sustainability, Safety and Security—Working ON Foods”.
Data Availability Statement
The authors declare that the data supporting the findings of this study are available within the paper and its Supplementary Information Files. Should any raw data files be needed in another format they are available from the corresponding author upon reasonable request.
Conflicts of Interest
The authors declare no conflicts of interest.
Abbreviations
The following abbreviations are used in this manuscript:
| ABTS | 2,2’-Azino-bis (3-ethylbenzothiazoline-6-sulfonic acid) |
| ACAE | acarbose equivalents |
| ACH | air changes per hour |
| AChE | acetylcholinesterase |
| BChE | butyrylcholinesterase |
| BOPP | bioriented polypropylene |
| CUPRAC | Cupric Reducing Antioxidant Capacity |
| DPPH | 1,1-Diphenyl-2-picrylhydrazyl |
| EDTAE | EDTA equivalents |
| FRAP | Ferric Reducing Antioxidant Power |
| GAE | gallic acid equivalents |
| GALAE | galanthamine equivalents |
| HESI | heated electrospray ionization |
| HPLC | High-Performance Liquid Chromatography |
| KAE | kojic acid equivalents |
| LA | leaf area |
| LED | Light-Emitting Diode |
| MCA | metal-chelating activity |
| MNM | micronutrient malnutrition |
| MRD | maximum recovery diluent |
| PBD | phosphomolybdenum activity |
| PNPG | p-nitrophenyl-β-glucopyranoside |
| PPFD | photosynthetic photon flux density |
| R:B | red/blue |
| RH | relative humidity |
| SDW | shoot dry weight |
| SFW | shoot fresh weight |
| TE | Trolox equivalents |
| UHPLC-HRMS | ultra-high-performance liquid chromatography–high-resolution mass spectrometry |
| UV | ultraviolet |
References
- FAO; IFAD; UNICEF; WFP; WHO. The State of Food Security and Nutrition in the World 2023. Urbanization, Agrifood Systems Transformation and Healthy Diets Across the Rural–Urban Continuum; FAO: Rome, Italy, 2023; ISBN 978-92-5-137226-5. [Google Scholar]
- Kiani, A.K.; Dhuli, K.; Donato, K.; Aquilanti, B.; Velluti, V.; Matera, G.; Iaconelli, A.; Connelly, S.T.; Bellinato, F.; Gisondi, P.; et al. Main Nutritional Deficiencies. J. Prev. Med. Hyg. 2022, 63, E93–E101. [Google Scholar] [CrossRef] [PubMed]
- Yahia, Y.; Benabderrahim, M.A.; Tlili, N.; Bagues, M.; Nagaz, K. Bioactive Compounds, Antioxidant and Antimicrobial Activities of Extracts from Different Plant Parts of Two Ziziphus mill. Species. PLoS ONE 2020, 15, e0232599. [Google Scholar] [CrossRef] [PubMed]
- Sadeer, N.B.; Montesano, D.; Albrizio, S.; Zengin, G.; Mahomoodally, M.F. The Versatility of Antioxidant Assays in Food Science and Safety—Chemistry, Applications, Strengths, and Limitations. Antioxidants 2020, 9, 709. [Google Scholar] [CrossRef] [PubMed]
- Babbar, N.; Oberoi, H.S.; Sandhu, S.K.; Bhargav, V.K. Influence of Different Solvents in Extraction of Phenolic Compounds from Vegetable Residues and Their Evaluation as Natural Sources of Antioxidants. J. Food Sci. Technol. 2014, 51, 2568–2575. [Google Scholar] [CrossRef]
- Martínez, V.; Mitjans, M.; Vinardell, M.P. Cytoprotective Effects of Polyphenols against Oxidative Damage. Polyphen. Hum. Health Dis. 2014, 1, 275–288. [Google Scholar] [CrossRef]
- Šamec, D.; Karalija, E.; Šola, I.; Vujčić Bok, V.; Salopek-Sondi, B. The Role of Polyphenols in Abiotic Stress Response: The Influence of Molecular Structure. Plants 2021, 10, 118. [Google Scholar] [CrossRef]
- Fortier, E.; Desjardins, Y.; Tremblay, N.; Bélec, C.; Côté, M. Influence of Irrigation and Nitrogen Fertilization on Broccoli Polyphenolics Concentration. Acta Hortic. 2010, 856, 55–62. [Google Scholar] [CrossRef]
- Takahashi, S.; Badger, M.R. Photoprotection in Plants: A New Light on Photosystem II Damage. Trends Plant Sci. 2011, 16, 53–60. [Google Scholar] [CrossRef]
- Klimek-Szczykutowicz, M.; Prokopiuk, B.; Dziurka, K.; Pawłowska, B.; Ekiert, H.; Szopa, A. The Influence of Different Wavelengths of LED Light on the Production of Glucosinolates and Phenolic Compounds and the Antioxidant Potential in in Vitro Cultures of Nasturtium officinale (Watercress). Plant Cell Tissue Organ Cult. 2022, 149, 113–122. [Google Scholar] [CrossRef]
- D’Souza, C.; Yuk, H.G.; Khoo, G.H.; Zhou, W. Application of Light-Emitting Diodes in Food Production, Postharvest Preservation, and Microbiological Food Safety. Compr. Rev. Food Sci. Food Saf. 2015, 14, 719–740. [Google Scholar] [CrossRef]
- Dutta Gupta, S.; Jatothu, B. Fundamentals and Applications of Light-Emitting Diodes (LEDs) in Vitro Plant Growth and Morphogenesis. Plant Biotechnol. Rep. 2013, 7, 211–220. [Google Scholar] [CrossRef]
- Livadariu, O.; Maximilian, C.; Rahmanifar, B.; Cornea, C.P. LED Technology Applied to Plant Development for Promoting the Accumulation of Bioactive Compounds: A Review. Plants 2023, 12, 1075. [Google Scholar] [CrossRef] [PubMed]
- Cope, K.R.; Snowden, M.C.; Bugbee, B. Photobiological Interactions of Blue Light and Photosynthetic Photon Flux: Effects of Monochromatic and Broad-Spectrum Light Sources. Photochem. Photobiol. 2014, 90, 574–584. [Google Scholar] [CrossRef] [PubMed]
- Li, Y.; Xin, G.; Liu, C.; Shi, Q.; Yang, F.; Wei, M. Effects of Red and Blue Light on Leaf Anatomy, CO2 Assimilation and the Photosynthetic Electron Transport Capacity of Sweet Pepper (Capsicum annuum L.) Seedlings. BMC Plant Biol. 2020, 20, 318. [Google Scholar] [CrossRef]
- Kopsell, D.A.; Sams, C.E.; Morrow, R.C. Blue Wavelengths from LED Lighting Increase Nutritionally Important Metabolites in Specialty Crops. HortScience 2015, 50, 1285–1288. [Google Scholar] [CrossRef]
- Lillo, C.; Appenroth, K.J. Light Regulation of Nitrate Reductase in Higher Plants: Which Photoreceptors Are Involved? Plant Biol. 2001, 3, 455–465. [Google Scholar] [CrossRef]
- Hogewoning, S.W.; Trouwborst, G.; Maljaars, H.; Poorter, H.; van Ieperen, W.; Harbinson, J. Blue Light Dose–Responses of Leaf Photosynthesis, Morphology, and Chemical Composition of Cucumis sativus Grown under Different Combinations of Red and Blue Light. J. Exp. Bot. 2010, 61, 3107–3117. [Google Scholar] [CrossRef]
- Ma, Y.; Xu, A.; Cheng, Z.M. (Max) Effects of Light Emitting Diode Lights on Plant Growth, Development and Traits a Meta-Analysis. Hortic. Plant J. 2021, 7, 552–564. [Google Scholar] [CrossRef]
- Naznin, M.T.; Lefsrud, M.; Gravel, V.; Azad, M.O.K. Blue Light Added with Red LEDs Enhance Growth Characteristics, Pigments Content, and Antioxidant Capacity in Lettuce, Spinach, Kale, Basil, and Sweet Pepper in a Controlled Environment. Plants 2019, 8, 93. [Google Scholar] [CrossRef]
- Hosseini, A.; Zare Mehrjerdi, M.; Aliniaeifard, S. Alteration of Bioactive Compounds in Two Varieties of Basil (Ocimum basilicum) Grown under Different Light Spectra. J. Essent. Oil Bear. Plants 2018, 21, 913–923. [Google Scholar] [CrossRef]
- Piovene, C.; Orsini, F.; Bosi, S.; Sanoubar, R.; Bregola, V.; Dinelli, G.; Gianquinto, G. Optimal Red:Blue Ratio in Led Lighting for Nutraceutical Indoor Horticulture. Sci. Hortic. 2015, 193, 202–208. [Google Scholar] [CrossRef]
- Min, Q.; Marcelis, L.F.M.; Nicole, C.C.S.; Woltering, E.J. High Light Intensity Applied Shortly before Harvest Improves Lettuce Nutritional Quality and Extends the Shelf Life. Front. Plant Sci. 2021, 12, 615355. [Google Scholar] [CrossRef] [PubMed]
- Godínez-Mendoza, P.L.; Rico-Chávez, A.K.; Ferrusquía-Jimenez, N.I.; Carbajal-Valenzuela, I.A.; Villagómez-Aranda, A.L.; Torres-Pacheco, I.; Guevara-González, R.G. Plant Hormesis: Revising of the Concepts of Biostimulation, Elicitation and Their Application in a Sustainable Agricultural Production. Sci. Total Environ. 2023, 894, 164883. [Google Scholar] [CrossRef] [PubMed]
- Vázquez-Hernández, M.C.; Parola-Contreras, I.; Montoya-Gómez, L.M.; Torres-Pacheco, I.; Schwarz, D.; Guevara-González, R.G. Eustressors: Chemical and Physical Stress Factors Used to Enhance Vegetables Production. Sci. Hortic. 2019, 250, 223–229. [Google Scholar] [CrossRef]
- Johansson, M.; Jägerstad, M.; Frølich, W. Folates in Lettuce: A Pilot Study. Food Nutr. Res. 2007, 51, 22–30. [Google Scholar] [CrossRef]
- Długosz-Grochowska, O.; Kołton, A.; Wojciechowska, R. Modifying Folate and Polyphenol Concentrations in Lamb’s Lettuce by the Use of LED Supplemental Lighting during Cultivation in Greenhouses. J. Funct. Foods 2016, 26, 228–237. [Google Scholar] [CrossRef]
- Długosz-Grochowska, O.; Wojciechowska, R.; Kruczek, M.; Habela, A. Supplemental Lighting with LEDs Improves the Biochemical Composition of Two Valerianella locusta (L.) Cultivars. Hortic. Environ. Biotechnol. 2017, 58, 441–449. [Google Scholar] [CrossRef]
- Wojciechowska, R.; Kołton, A.; Długosz-Grochowska, O.; Knop, E. Nitrate Content in Valerianella locusta L. Plants Is Affected by Supplemental LED Lighting. Sci. Hortic. 2016, 211, 179–186. [Google Scholar] [CrossRef]
- Wojciechowska, R.; Kurpaska, S.; Malinowski, M.; Sikora, J.; Krakowiak-Bal, A.; Długosz-Grochowska, O. Effect of Supplemental LED Lighting on Growth and Quality of Valerianella locusta L. and Economic Aspects of Cultivation in Autumn Cycle. Acta Sci. Pol. Hortorum Cultus 2016, 15, 233–244. [Google Scholar]
- Manzocco, L.; Foschia, M.; Tomasi, N.; Maifreni, M.; Dalla Costa, L.; Marino, M.; Cortella, G.; Cesco, S. Influence of Hydroponic and Soil Cultivation on Quality and Shelf Life of Ready-to-Eat Lamb’s Lettuce (Valerianella locusta L. Laterr). J. Sci. Food Agric. 2011, 91, 1373–1380. [Google Scholar] [CrossRef]
- Mirzahosseini, Z.; Shabani, L.; Sabzalian, M.R. LED Lights Increase an Antioxidant Capacity of Arabidopsis thaliana under Wound-Induced Stresses. Funct. Plant Biol. 2020, 47, 853–864. [Google Scholar] [CrossRef] [PubMed]
- Monostori, I.; Heilmann, M.; Kocsy, G.; Rakszegi, M.; Ahres, M.; Altenbach, S.B.; Szalai, G.; Pál, M.; Toldi, D.; Simon-Sarkadi, L.; et al. LED Lighting—Modification of Growth, Metabolism, Yield and Flour Composition in Wheat by Spectral Quality and Intensity. Front. Plant Sci. 2018, 9, 605. [Google Scholar] [CrossRef] [PubMed]
- Folta, K.M.; Childers, K.S. Light as a Growth Regulator: Controlling Plant Biology with Narrow-Bandwidth Solid-State Lighting Systems. HortScience Horts 2008, 43, 1957–1964. [Google Scholar] [CrossRef]
- Parks, B.M.; Hoecker, U.; Spalding, E.P. Light-Induced Growth Promotion by SPA1 Counteracts Phytochrome-Mediated Growth Inhibition during de-Etiolation. Plant Physiol. 2001, 126, 1291–1298. [Google Scholar] [CrossRef]
- Edesi, J.; Kotkas, K.; Pirttilä, A.M.; Häggman, H. Does Light Spectral Quality Affect Survival and Regeneration of Potato (Solanum tuberosum L.) Shoot Tips after Cryopreservation? Plant Cell Tissue Organ Cult. (PCTOC) 2014, 119, 599–607. [Google Scholar] [CrossRef]
- Lian, M.-L.; Murthy, H.N.; Paek, K.-Y. Effects of Light Emitting Diodes (LEDs) on the in Vitro Induction and Growth of Bulblets of Lilium Oriental Hybrid ‘Pesaro.’. Sci. Hortic. 2002, 94, 365–370. [Google Scholar] [CrossRef]
- Poudel, P.R.; Kataoka, I.; Mochioka, R. Effect of Red- and Blue-Light-Emitting Diodes on Growth and Morphogenesis of Grapes. Plant Cell Tissue Organ Cult. 2008, 92, 147–153. [Google Scholar] [CrossRef]
- Wu, H.-C.; Lin, C.-C. Red Light-Emitting Diode Light Irradiation Improves Root and Leaf Formation in Difficult-to-Propagate Protea cynaroides L. Plantlets in Vitro. HortScience Horts 2012, 47, 1490–1494. [Google Scholar] [CrossRef]
- Hung, C.D.; Hong, C.-H.; Kim, S.-K.; Lee, K.-H.; Park, J.-Y.; Nam, M.-W.; Choi, D.-H.; Lee, H.-I. LED Light for in Vitro and Ex Vitro Efficient Growth of Economically Important Highbush Blueberry (Vaccinium corymbosum L.). Acta Physiol. Plant. 2016, 38, 152. [Google Scholar] [CrossRef]
- Silva, M.M.A.; de Oliveira, A.L.B.; Oliveira-Filho, R.A.; Gouveia-Neto, A.S.; Camara, T.J.R.; Willadino, L.G. Effect of Blue/Red LED Light Combination on Growth and Morphogenesis of Saccharum Officinarum Plantlets in Vitro. In Proceedings of the Proceedings Volume 8947, Imaging, Manipulation, and Analysis of Biomolecules, Cells, and Tissues XII, San Francisco, CA, USA, 3–6 February 2014; p. 89471X. [Google Scholar]
- Saradhuldhat, P.; Paull, R.E. Pineapple Organic Acid Metabolism and Accumulation during Fruit Development. Sci. Hortic. 2007, 112, 297–303. [Google Scholar] [CrossRef]
- Igamberdiev, A.U.; Eprintsev, A.T. Organic Acids: The Pools of Fixed Carbon Involved in Redox Regulation and Energy Balance in Higher Plants. Front. Plant Sci. 2016, 7, 1042. [Google Scholar] [CrossRef] [PubMed]
- Vallarino, J.G.; Osorio, S. Organic Acids. In Postharvest Physiology and Biochemistry of Fruits and Vegetables; Yahia, E.M., Ed.; Woodhead Publishing: Sawston, UK, 2019; pp. 207–224. ISBN 978-0-12-813278-4. [Google Scholar]
- Annunziata, M.G.; Apelt, F.; Carillo, P.; Krause, U.; Feil, R.; Mengin, V.; Lauxmann, M.A.; Köhl, K.; Nikoloski, Z.; Stitt, M.; et al. Getting Back to Nature: A Reality Check for Experiments in Controlled Environments. J. Exp. Bot. 2017, 68, 4463–4477. [Google Scholar] [CrossRef] [PubMed]
- Cioć, M.; Tokarz, K.; Dziurka, M.; Pawłowska, B. Energy-Saving LED Light Affects the Efficiency of the Photosynthetic Apparatus and Carbohydrate Content in Gerbera Jamesonii Bolus Ex Hook. f. Axillary Shoots Multiplied in Vitro. Biology 2021, 10, 1035. [Google Scholar] [CrossRef] [PubMed]
- Li, Y.; Xin, G.; Wei, M.; Shi, Q.; Yang, F.; Wang, X. Carbohydrate Accumulation and Sucrose Metabolism Responses in Tomato Seedling Leaves When Subjected to Different Light Qualities. Sci. Hortic. 2017, 225, 490–497. [Google Scholar] [CrossRef]
- Shi, L.; Cao, S.; Shao, J.; Chen, W.; Yang, Z.; Zheng, Y. Chinese Bayberry Fruit Treated with Blue Light after Harvest Exhibit Enhanced Sugar Production and Expression of Cryptochrome Genes. Postharvest Biol. Technol. 2016, 111, 197–204. [Google Scholar] [CrossRef]
- Li, H.; Tang, C.; Xu, Z.; Liu, X.; Han, X. Effects of Different Light Sources on the Growth of Non-Heading Chinese Cabbage (Brassica campestris L.). J. Agric. Sci. 2012, 4, 262–273. [Google Scholar] [CrossRef]
- Chen, X.; Yang, Q. Effects of Intermittent Light Exposure with Red and Blue Light Emitting Diodes on Growth and Carbohydrate Accumulation of Lettuce. Sci. Hortic. 2018, 234, 220–226. [Google Scholar] [CrossRef]
- Wang, S.; Fang, H.; Xie, J.; Wu, Y.; Tang, Z.; Liu, Z.; Lv, J.; Yu, J. Physiological Responses of Cucumber Seedlings to Different Supplemental Light Duration of Red and Blue LED. Front. Plant Sci. 2021, 12, 709313. [Google Scholar] [CrossRef]
- Al Murad, M.; Razi, K.; Jeong, B.R.; Samy, P.M.A.; Muneer, S. Light Emitting Diodes (LEDs) as Agricultural Lighting: Impact and Its Potential on Improving Physiology, Flowering, and Secondary Metabolites of Crops. Sustainability 2021, 13, 1985. [Google Scholar] [CrossRef]
- Qian, H.; Liu, T.; Deng, M.; Miao, H.; Cai, C.; Shen, W.; Wang, Q. Effects of Light Quality on Main Health-Promoting Compounds and Antioxidant Capacity of Chinese Kale Sprouts. Food Chem. 2016, 196, 1232–1238. [Google Scholar] [CrossRef]
- Huang, J.; Xu, Y.; Duan, F.; Du, X.; Yang, Q.; Zheng, Y. Improvement of the Growth and Nutritional Quality of Two-Leaf-Color Pak Choi by Supplemental Alternating Red and Blue Light. HortScience Horts 2021, 56, 118–125. [Google Scholar] [CrossRef]
- Doukani, K.; Selles, A.S.M.; Bouhenni, H. Chapter 3.1.11—Hypericin and Pseudohypericin. In Naturally Occurring Chemicals Against Alzheimer’s Disease; Belwal, T., Nabavi, S.M., Nabavi, S.F., Dehpour, A.R., Shirooie, S., Eds.; Academic Press: Cambridge, MA, USA, 2021; pp. 155–165. ISBN 978-0-12-819212-2. [Google Scholar]
- Samuolienė, G.; Brazaitytė, A.; Jankauskienė, J.; Viršilė, A.; Sirtautas, R.; Novičkovas, A.; Sakalauskienė, S.; Sakalauskaitė, J.; Duchovskis, P. LED Irradiance Level Affects Growth and Nutritional Quality of Brassica Microgreens. Cent. Eur. J. Biol. 2013, 8, 1241–1249. [Google Scholar] [CrossRef]
- Pennisi, G.; Blasioli, S.; Cellini, A.; Maia, L.; Crepaldi, A.; Braschi, I.; Spinelli, F.; Nicola, S.; Fernandez, J.A.; Stanghellini, C.; et al. Unraveling the Role of Red:Blue LED Lights on Resource Use Efficiency and Nutritional Properties of Indoor Grown Sweet Basil. Front. Plant Sci. 2019, 10, 305. [Google Scholar] [CrossRef] [PubMed]
- Huyskens-Keil, S.; Eichholz-Dündar, I.; Hassenberg, K.; Herppich, W.B. Impact of Light Quality (White, Red, Blue Light and UV-C Irradiation) on Changes in Anthocyanin Content and Dynamics of PAL and POD Activities in Apical and Basal Spear Sections of White Asparagus after Harvest. Postharvest Biol. Technol. 2020, 161, 111069. [Google Scholar] [CrossRef]
- Paik, I.; Huq, E. Plant Photoreceptors: Multi-Functional Sensory Proteins and Their Signaling Networks. Semin. Cell Dev. Biol. 2019, 92, 114–121. [Google Scholar] [CrossRef]
- Patel, D.K. Medicinal Importance, Pharmacological Activities, and Analytical Aspects of Engeletin in Medicine: Therapeutic Benefit Through Scientific Data Analysis. Endocr. Metab. Immune Disord. Drug Targets 2023, 23, 273–282. [Google Scholar] [CrossRef]
- Chen, A.Y.; Chen, Y.C. A Review of the Dietary Flavonoid, Kaempferol on Human Health and Cancer Chemoprevention. Food Chem. 2013, 138, 2099–2107. [Google Scholar] [CrossRef]
- Wang, S.; Wang, N.; Huang, X.; Yang, B.; Zheng, Y.; Zhang, J.; Wang, X.; Lin, Y.; Wang, Z. Baohuoside i Suppresses Breast Cancer Metastasis by Downregulating the Tumor-Associated Macrophages/C-X-C Motif Chemokine Ligand 1 Pathway. Phytomedicine 2020, 78, 153331. [Google Scholar] [CrossRef]
- Liu, Y.; Singh, S.K.; Pattanaik, S.; Wang, H.; Yuan, L. Light Regulation of the Biosynthesis of Phenolics, Terpenoids, and Alkaloids in Plants. Commun. Biol. 2023, 6, 1055. [Google Scholar] [CrossRef]
- Rajput, A.; Sharma, R.; Bharti, R. Pharmacological Activities and Toxicities of Alkaloids on Human Health. Mater. Today Proc. 2022, 48, 1407–1415. [Google Scholar] [CrossRef]
- Rihan, H.Z.; Aldarkazali, M.; Mohamed, S.J.; McMulkin, N.B.; Jbara, M.H.; Fuller, M.P. A Novel New Light Recipe Significantly Increases the Growth and Yield of Sweet Basil (Ocimum basilicum) Grown in a Plant Factory System. Agronomy 2020, 10, 934. [Google Scholar] [CrossRef]
- Ghaffari, Z.; Rahimmalek, M.; Sabzalian, M.R. Variation in the Primary and Secondary Metabolites Derived from the Isoprenoid Pathway in the Perovskia Species in Response to Different Wavelengths Generated by Light Emitting Diodes (LEDs). Ind. Crops Prod. 2019, 140, 111592. [Google Scholar] [CrossRef]
- Khurshid, R.; Ullah, M.A.; Tungmunnithum, D.; Drouet, S.; Shah, M.; Zaeem, A.; Hameed, S.; Hano, C.; Abbasi, B.H. Lights Triggered Differential Accumulation of Antioxidant and Antidiabetic Secondary Metabolites in Callus Culture of Eclipta alba L. PLoS ONE 2020, 15, e0233963. [Google Scholar] [CrossRef] [PubMed]
- Samuolienė, G.; Urbonavičiūtė, A.; Brazaitytė, A.; Šabajevienė, G.; Sakalauskaitė, J.; Duchovskis, P. The Impact of LED Illumination on Antioxidant Properties of Sprouted Seeds. Cent. Eur. J. Biol. 2011, 6, 68–74. [Google Scholar] [CrossRef]
- Liu, Y.; Roof, S.; Ye, Z.; Barry, C.; Van Tuinent, A.; Vrebalov, J.; Bowler, C.; Giovannoni, J. Manipulation of Light Signal Transduction as a Means of Modifying Fruit Nutritional Quality in Tomato. Proc. Natl. Acad. Sci. USA 2004, 101, 9897–9902. [Google Scholar] [CrossRef]
- Rauf, A.; Jehan, N. Natural Products as a Potential Enzyme Inhibitors from Medicinal Plants. In Enzyme Inhibitors and Activators; Senturk, M., Ed.; IntechOpen: Rijeka, Croatia, 2017. [Google Scholar]
- Lankatillake, C.; Luo, S.; Flavel, M.; Lenon, G.B.; Gill, H.; Huynh, T.; Dias, D.A. Screening Natural Product Extracts for Potential Enzyme Inhibitors: Protocols, and the Standardisation of the Usage of Blanks in α-Amylase, α-Glucosidase and Lipase Assays. Plant Methods 2021, 17, 3. [Google Scholar] [CrossRef]
- Fontana Pereira, D.; Cazarolli, L.H.; Lavado, C.; Mengatto, V.; Figueiredo, M.S.R.B.; Guedes, A.; Pizzolatti, M.G.; Silva, F.R.M.B. Effects of Flavonoids on α-Glucosidase Activity: Potential Targets for Glucose Homeostasis. Nutrition 2011, 27, 1161–1167. [Google Scholar] [CrossRef]
- Peng, X.; Zhang, G.; Liao, Y.; Gong, D. Inhibitory Kinetics and Mechanism of Kaempferol on α-Glucosidase. Food Chem. 2016, 190, 207–215. [Google Scholar] [CrossRef]
- Adhikari, B. Roles of Alkaloids from Medicinal Plants in the Management of Diabetes Mellitus. J. Chem. 2021, 2021, 2691525. [Google Scholar] [CrossRef]
- Santos, M.I.; Grácio, M.; Silva, M.C.; Pedroso, L.; Lima, A. One Health Perspectives on Food Safety in Minimally Processed Vegetables and Fruits: From Farm to Fork. Microorganisms 2023, 11, 2990. [Google Scholar] [CrossRef]
- USDA. Fresh-Cut Produce Shipping Point and Market Inspection Instructions; USDA: Washington, DC, USA, 2016.
- Easlon, H.M.; Bloom, A.J. Easy Leaf Area: Automated Digital Image Analysis for Rapid and Accurate Measurement of Leaf Area. Appl. Plant Sci. 2014, 2, 1400033. [Google Scholar] [CrossRef] [PubMed]
- Pii, Y.; Graf, H.; Valentinuzzi, F.; Cesco, S.; Mimmo, T. The Effects of Plant Growth-Promoting Rhizobacteria (PGPR) on the Growth and Quality of Strawberries. Acta Hortic. 2018, 1217, 231–238. [Google Scholar] [CrossRef]
- Valentinuzzi, F.; Pii, Y.; Mimmo, T.; Savini, G.; Curzel, S.; Cesco, S. Fertilization Strategies as a Tool to Modify the Organoleptic Properties of Raspberry (Rubus idaeus L.) Fruits. Sci. Hortic. 2018, 240, 205–212. [Google Scholar] [CrossRef]
- Uysal, S.; Zengin, G.; Locatelli, M.; Bahadori, M.B.; Mocan, A.; Bellagamba, G.; Luca, E.D.; Mollica, A.; Aktumsek, A. Cytotoxic and Enzyme Inhibitory Potential of Two Potentilla Species (P. speciosa L. and P. reptans Willd.) and Their Chemical Composition. Front. Pharmacol. 2017, 8, 249316. [Google Scholar] [CrossRef]
- Tsugawa, H.; Cajka, T.; Kind, T.; Ma, Y.; Higgins, B.; Ikeda, K.; Kanazawa, M.; VanderGheynst, J.; Fiehn, O.; Arita, M. MS-DIAL: Data-Independent MS/MS Deconvolution for Comprehensive Metabolome Analysis. Nat. Methods 2015, 12, 523–526. [Google Scholar] [CrossRef]
- Salek, R.M.; Steinbeck, C.; Viant, M.R.; Goodacre, R.; Dunn, W.B. The Role of Reporting Standards for Metabolite Annotation and Identification in Metabolomic Studies. GigaScience 2013, 2, 2047-2217X-2–13. [Google Scholar] [CrossRef]
- Schrimpe-Rutledge, A.C.; Codreanu, S.G.; Sherrod, S.D.; McLean, J.A. Untargeted Metabolomics Strategies—Challenges and Emerging Directions. J. Am. Soc. Mass Spectrom. 2016, 27, 1897–1905. [Google Scholar] [CrossRef]
- Grochowski, D.M.; Uysal, S.; Aktumsek, A.; Granica, S.; Zengin, G.; Ceylan, R.; Locatelli, M.; Tomczyk, M. In Vitro Enzyme Inhibitory Properties, Antioxidant Activities, and Phytochemical Profile of Potentilla thuringiaca. Phytochem. Lett. 2017, 20, 365–372. [Google Scholar] [CrossRef]
Disclaimer/Publisher’s Note: The statements, opinions and data contained in all publications are solely those of the individual author(s) and contributor(s) and not of MDPI and/or the editor(s). MDPI and/or the editor(s) disclaim responsibility for any injury to people or property resulting from any ideas, methods, instructions or products referred to in the content. |
© 2025 by the authors. Licensee MDPI, Basel, Switzerland. This article is an open access article distributed under the terms and conditions of the Creative Commons Attribution (CC BY) license (https://creativecommons.org/licenses/by/4.0/).