Abstract
The B-box (BBX) gene family includes zinc finger protein transcription factors that regulate a multitude of physiological and developmental processes in plants. While BBX gene families have been previously determined in various plants, the members and roles of peanut BBXs are largely unknown. In this research, on the basis of the genome-wide identification of BBXs in three peanut species (Arachis hypogaea, A. duranensis, and A. ipaensis), we investigated the expression profile of the BBXs in various tissues and in response to salt and drought stresses and selected AhBBX6 for functional characterization. We identified a total of 77 BBXs in peanuts, which could be grouped into five subfamilies, with the genes from the same branch of the same subgroup having comparable exon–intron structures. In addition, a significant number of cis-regulatory elements involved in the regulation of responses to light and hormones and abiotic stresses were found in the promoter region of peanut BBXs. Based on the analysis of transcriptome data and qRT-PCR, we identified AhBBX6, AhBBX11, AhBBX13, and AhBBX38 as potential genes associated with tolerance to salt and drought. Silencing AhBBX6 using virus-induced gene silencing compromised the tolerance of peanut plants to salt and drought stresses. The results of this study provide knowledge on peanut BBXs and establish a foundation for future research into their functional roles in peanut development and stress response.
1. Introduction
Peanuts (Arachis hypogaea L.), rich in protein and oil, hold significance as an important oilseed and valuable economic crop worldwide. With the rising global population, the demand for peanut oil and other products derived from peanuts is gradually increasing. Global warming has exacerbated drought and soil salinization, which are major constraints for increasing peanut yield and quality. As such, understanding the genetic and molecular pathways underpinning peanut responses to abiotic stresses has become a primary objective in addressing these issues when faced with the production of not only peanuts but also other crops worldwide.
The B-box (BBX) family is a subfamily of the zinc-finger structural protein family. B-box proteins can bind to RNA and DNA through their interaction with zinc ions to regulate gene expression. The B-box gene family has been extensively studied in numerous plant species [1,2,3,4,5,6,7,8]. In Arabidopsis, CONSTANS (CO) was identified as the first plant BBX involved in photoperiod-dependent flowering [9]. Subsequently, more BBX members such as AtBBX4 [10], AtBBX5 [11], AtBBX6 [12], AtBBX7 [13], AtBBX28 [14], and AtBBX32 [15] were also found to play important roles in controlling plant flowering.
BBXs regulate the biological processes of not only flowering but also responding to abiotic stresses [14]. The salt tolerance protein STO, encoded by AtBBX24, was discovered to have a positive impact on the salt stress response, and STO-OE improves salt tolerance in Arabidopsis [16]. In chrysanthemum (Chrysanthemum morifolium), the suppressed expression of CmBBX24 is linked to a decrease in the plant’s ability to withstand cold and drought conditions [17]. The expression of CmBBX19 is down-regulated in chrysanthemums under drought stress and ABA treatment [18]. Overexpressing CmBBX19 results in reduced drought tolerance [18]. In rice, the expression of OsBBX1 and OsBBX24 was found to cause significant changes in response to abiotic stresses [19]. Overexpressing MdBBX7 enhances drought tolerance in apples [20]. A different study on apples discovered that by interacting with MdABI5 (the protein that regulates ABA signals) and MdEIL1 (the protein that regulates ethylene signals), MdBBX37 controls the process of leaf senescence mediated by ABA and ethylene [21]. In tomatos, overexpressing SlBBX17 enhances cold tolerance, while silencing SlBBX17 increases cold susceptibility [22]. Taken together, these findings indicate that BBXs are significant factors in controlling plant growth and development, as well as in regulating responses to abiotic stresses. Despite the findings on the role of BBXs in many plants [16,17,18,19,20,21,22], there is limited knowledge about the BBXs in peanuts and their functions in the development and stress response of peanuts.
The cultivated peanut (Arachis hypogaea L.) is an allotetraploid (AABB, 2n = 4x = 40) [23,24]. The availability of the peanut reference genome sequence [25] enables the genome-wide identification and analysis of gene families.
In this study, we analyzed the peanut BBX gene family, including phylogenetic relationships, the gene structure, and cis-acting elements. Additionally, we explored the expression patterns of AhBBXs in various tissues and in response to abiotic stress using publicly accessible RNA-Seq data. The main objectives of this research were to establish a comprehensive theoretical and technical framework that enhances our comprehension of the functional role of AhBBXs, particularly in drought and salt tolerance.
2. Results
2.1. Identification and Physicochemical Analysis of AhBBXs
A total of 39 (A. hypogaea), 19 (A. duranensis), and 19 (A. ipaensis) BBXs were identified from the genomes of the cultivated and the two wild peanut species. The number of BBXs in the cultivated peanut was roughly the sum of the numbers in the two wild peanut species. The BBXs were given the names AdBBX1-AdBBX19, AiBBX1-AiBBX19, and AhBBX1-AhBBX39, respectively, based on their chromosomal locations.
The length of peanut BBX proteins ranged from 154 amino acids (AiBBX17) to 546 amino acids (AdBBX14). The BBX proteins had a molecular weight range from 16.98 kDa (AiBBX17, AhBBX37) to 61.01 kDa (AdBBX14). The predicted isoelectric points (pI) ranged from 4.12 (AiBBX17, AhBBX37) to 9.41 (AhBBX28), with most of the members having an isoelectric point less than seven. Only nine members, AdBBX7 (pI 7.12), AdBBX15 (pI 8.19), AiBBX7 (pI 8.59), AiBBX11 (pI 7.47), AiBBX15 (pI 8.88), AhBBX12 (pI 8.19), AhBBX17 (pI 8.86), AhBBX28 (pI 9.41), and AhBBX35 (pI 9.13), had isoelectric points above seven. Except for AdBBX14, which was predicted to be placed on the cell membrane, all other BBXs were predicted to be located in the nucleus (Table S2).
2.2. Phylogenetic Analysis of Peanut BBXs
To obtain a deeper understanding of the phylogenetic relationships of peanut BBX proteins, the 77 BBX protein sequences from wild and cultivated peanuts were compared with those from Arabidopsis and rice. A phylogenetic tree was generated using sequence alignment (Figure 1, Table S3).
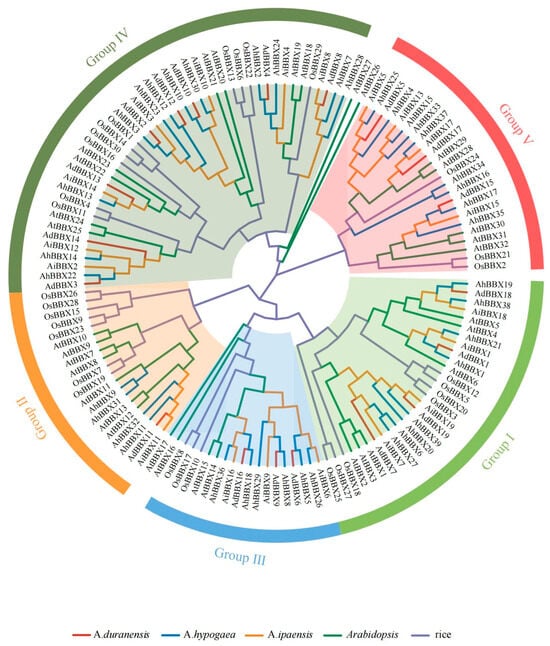
Figure 1.
The phylogenic tree of BBX proteins from different species. The BBXs were classified into five subfamilies indicated by different colors on the outermost circle. The BBXs from different species were color-coded with red lines representing A. duranensis, blue lines representing A. hypogaea, orange lines representing A. ipaensis, green lines representing Arabidopsis, and purple lines representing rice. At: Arabidopsis, Os: rice, Ad: A. duranensis, Ai: A. ipaensis, and Ah: A. hypogaea.
The B-box and CCT domains were used to divide the 77 peanut BBX proteins into five major subfamilies (Figure S1). Subfamily I (Group I) BBXs consisted of two B-box structural domains and one CCT structural domain, including four AdBBXs, four AiBBXs, and eight AhBBXs. Subfamily II (Group II) BBXs also contained two B-box structural domains and one CCT structural domain, including one AdBBX, one AiBBX, and four AhBBXs, but the amino acid sequence of the B-box 2 domain was somewhat different between the two groups. Subfamily III (Group III) BBXs contained one B-box structural domain and one CCT structural domain, including three AdBBXs, three AiBBXs, and six AhBBXs. Subfamily IV (Group IV) BBXs contained only two B-box structural domains, including eight AdBBXs, seven AiBBXs, and 12 AhBBXs. Subfamily V (Group V) BBXs contained only one B-box structural domain, including three AdBBXs, four AiBBXs, and nine AhBBXs.
2.3. Chromosome Locations and Gene Duplication Prediction of Peanut BBXs
BBXs are distributed on all chromosomes except chromosomes A2, B2, and B7 of the two wild species and chromosomes 2, 12, and 17 of the cultivated species, with most of the genes distributed at chromosome ends (Figure 2). Among them, chromosome 13 contains the most BBXs, with six genes. Chromosomes A3 and B3 each have five genes, while chromosomes A10, B8, B10, 6, 16, and 20 each have three genes. Chromosome 3 has four genes, and the remaining chromosomes contain one or two BBXs.
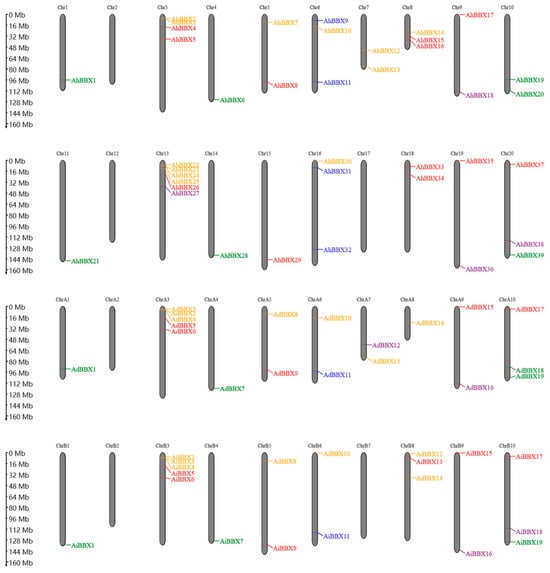
Figure 2.
The chromosomal location of BBXs. The positions of the 77 peanut BBXs are displayed on the right side of the chromosomes. BBXs of different subfamilies are indicated by different colors. The top two panels show the chromosomes of the tetraploid cultivated peanut species, and the bottom two panels show the chromosomes of the two wild peanut species.
Segment duplications and tandem duplications have been proposed as primary factors in gene family expansion in previous studies [26]. Hence, the BBXs in the cultivated peanut were analyzed for segmental duplications or genome-wide duplication events. The 39 AhBBXs generated a total of 43 sets of segmental duplications (Figure 3, Table S4), suggesting that the emergence of certain peanut BBXs might be attributed to duplication events.
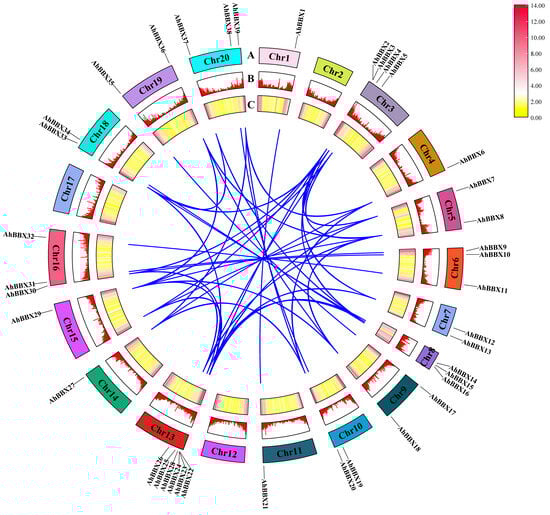
Figure 3.
Segmental duplication analyses of AhBBXs. Blue lines indicate the potential duplication relationship between AhBBXs. (A) Positions of AhBBXs on chromosomes (AhChr1-AhChr20) with different chromosomes are indicated by different colors. The chromosomes were scaled based on their lengths. (B) Bar graphs showing gene density on each chromosome, with higher bars representing higher gene density. (C) Heat map showing the distribution of gene density on each chromosome, with red and yellow colors representing high and low densities, respectively.
2.4. Syntenic Analysis
To investigate the phylogenetic relationship between AhBBXs, we constructed collinearity maps between peanuts and four typical species as follows: Arabidopsis, soybeans, tomato, and rice (Figure 4). In this study, a total of 31 AhBBXs showed collinearity with tomato BBX genes, followed by 29 in soybeans, 24 in Arabidopsis and 11 in rice (Table S5). Among the identified orthologos, 101 pairs belonged to soybeans, 48 pairs to tomato, 32 pairs to Arabidopsis, and 17 pairs to rice (Table S5). In addition, seven genes had gene pairs in all four species, suggesting that they might have existed before species differentiation. Interestingly, some genes identified as collinear pairs between peanuts and three dicotyledonous plants were not found in rice, suggesting that these collinear pairs may have appeared after the differentiation of dicotyledonous and monocotyledonous plants.
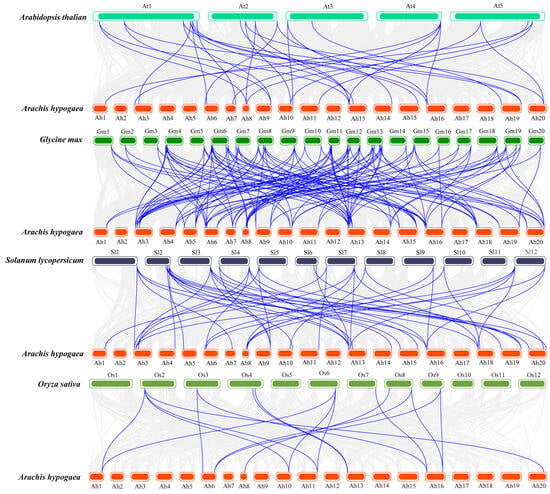
Figure 4.
The syntenic analysis of AhBBXs among the four species. The grey lines represent the collinear blocks among the peanuts and various species. The blue lines represent the collinearity between AhBBXs and various species.
2.5. Gene Structure and Conserved Motif Analysis of Peanut BBXs
A maximum likelihood phylogenetic analysis was performed utilizing peanut BBX proteins (Figure 5A) to link different groups to gene structure, conserved protein motifs (Figure 5B, Table S7) and exon–intron structures (Figure 5C). It was found that the number of exons in BBXs varied from one (AdBBX15) to six (AhBBX28). Among them, six genes contained one exon, 35 genes contained two exons, 20 genes contained three exons, nine genes contained four exons, six genes contained five exons, and one gene contained six exons.
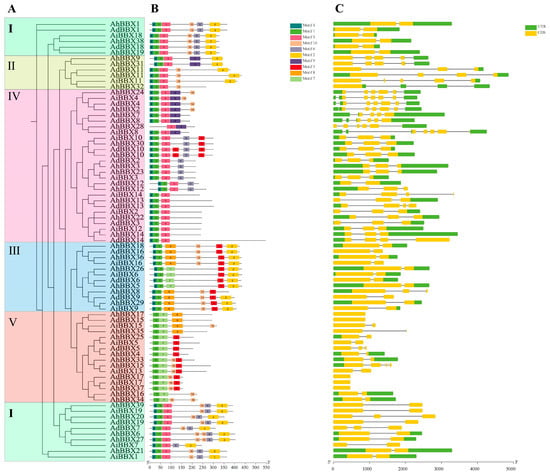
Figure 5.
Gene structure and conserved motifs of peanut BBXs from different subfamilies (I–V). (A) The phylogenetic tree constructed with MEGA X, categorizing BBXs into five subfamilies denoted by Roman numerals (I–V). Different subgroups are represented by differently colored boxes. (B) The conserved motifs in each of the BBX proteins, with ten motifs indicated by distinctly colored boxes. (C) Gene structures of each BBX gene. Yellow and green boxes represent the exons and UTR, respectively, and grey lines depict introns.
According to the phylogenetic tree and gene structure analysis, genes located in the same branch usually have similar gene structures. For example, AiBBX18, AdBBX18, AhBBX19, and AhBBX38 all contain two exons with the same exon position. Similarly, AiBBX10, AdBBX10, AhBBX10, and AhBBX30 all have three exons in similar positions. Furthermore, the genes of the same subfamily in the evolutionary tree exhibit similar gene structures, implying potential functional resemblances among BBXs from the same subfamily.
The examination of the conserved structural domains indicated that the BBX family members possess between three and seven conserved structural motifs. All members have the core sequence of the B-box 1 domain (motif 1), except AhBBX28. In total, 49 members contain the B-box 2-conserved domain (motif 3, motif 4), and 32 members contain the CCT domain (motif 2) in addition to the typical B-box domain. It remains to be investigated whether the deletion of these motifs confers some function specific to the protein, though the highly conserved motifs among peanut BBX proteins prove useful for an analysis of their functionality.
2.6. Analysis of cis-Acting Elements in the Promoters of the Peanut BBXs
The expression of genes is mainly regulated by promoters. Gene responses to external environmental or internal developmental signals can be predicted using cis-acting elements in the promoter region. Therefore, we conducted predictive analysis for cis-acting elements using the 2000 bp sequence upstream of the translation start site of the BBXs and identified 1639 such elements (Figure 6, Table S8).
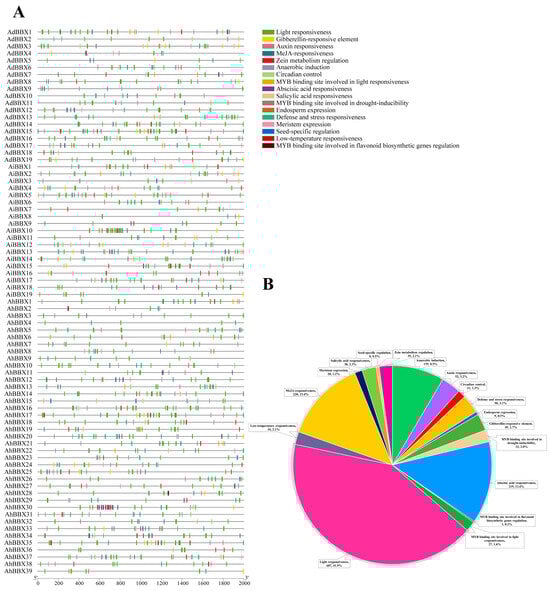
Figure 6.
The cis-acting regulatory elements within the promoters of BBXs. (A) Distribution of cis-acting elements in the promoters of peanut BBXs. (B) A pie chart visually depicts the proportions of various cis-acting elements in peanut BBXs.
Almost all peanut BBX promoter regions were found to be rich in cis-acting elements related to responses to hormones such as ABA, MeJA, gibberellins (GA), and salicylic acid (SA), as well as responses to adverse stresses like drought and low temperature. Among them, at least 51 elements were present in the AdBBX15 promoter sequence. The AiBBX10 promoter contains at least 61 elements. The AhBBX30 promoter contains at least 65 elements, comprising 19 components sensitive to ABA and 32 components responding to light, as well as a number of other elements responsive to MeJA and others. The most abundant cis-acting elements found in the promoter sequences of peanut BBXs are the ones that react to light, MeJA, and ABA, accounting for 42% (687), 13% (220), and 13% (219), respectively. The implication is that peanut BBXs might have significant functions in response to light signaling pathways and adverse stress [27].
2.7. Expression of Peanut BBXs in Different Tissues
By utilizing publicly available RNA-seq data, we studied the expression levels of peanut BBXs in 22 tissues from various stages of development. (Figure 7, Table S9). After processing the log2-transformed FPKM results, we discovered that peanut BBXs were expressed in 22 distinct tissues with varying expression levels. This disparity suggests potential differences in the functions of the individual genes. Furthermore, genes from the same phylogenetic branch demonstrated similar expression patterns.
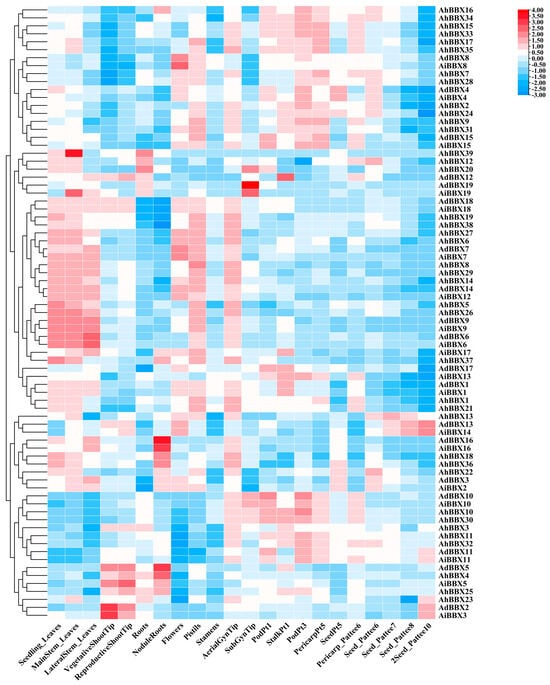
Figure 7.
Expression profiles of BBXs in 22 tissues of peanuts. The heatmap was generated using TBtools software, with the log2−transformed FPKM values of BBXs. The red and blue colors represent high and low expression values, respectively.
By analyzing the expression patterns of the genes in various tissues, we generated further predictions regarding the role of peanut BBXs. For example, AdBBX7, AiBBX7, AdBBX8, and AiBBX8 exhibited higher expression in flowers, indicating their potential involvement in flower development. AdBBX2 and AiBBX3 were highly expressed in vegetative shoot tips, suggesting that these genes may play a role in regulating the growth and development of the stems. AdBBX5, AdBBX16, AiBBX16, AhBBX4, AhBBX18, and AhBBX36 showed high expression in nodal roots, suggesting that these genes may have a role in the control of nitrogenase synthesis and activity.
Moreover, homologous genes exhibited similar expression patterns. For example, AdBBX10, AiBBX10, AhBBX10, and AhBBX30 were predominantly expressed in pods, implying that these genes may influence the development of peanut seeds. The expression levels of AdBBX6, AiBBX6, AdBBX9, AiBBX9, AhBBX5, and AhBBX26 in leaves were higher than in other tissues. However, the expression of AdBBX12, AdBBX19, and AiBBX19 in the subterranean gynophore tip was reversed. Peanut evolution involved polyploidization and gene duplication events, which might result in different expression patterns for homoeologous genes. These analytical results can provide a foundation for investigating the regulatory functions of BBXs.
2.8. Expression Patterns of Peanut BBXs under Abiotic Stresses
To comprehend how AhBBXs react to abiotic stresses, we analyzed the expression of peanut BBXs utilizing transcriptomic data during drought or high salinity stress that were previously generated by others [28,29] (Figure 8, Table S10).
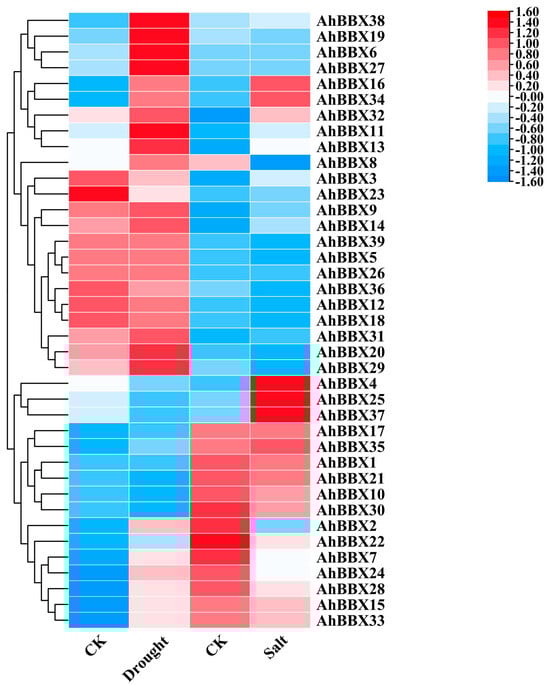
Figure 8.
The changes in the expression levels of AhBBXs in response to salt or drought stress treatments based on the RNA−seq data reported in references [28,29]. CK (control) indicates the expression level of AhBBXs without stress treatment. Drought indicates the expression level of AhBBXs in the mixed plant samples collected at 6 h, 12 h, 24 h and 48 h after treatment with 20% PEG (MW: 6000). Salt indicates the expression level of AhBBXs in plant samples at 24 h after treatment with 200 mmol L−1 NaCl. The FPKM values of AhBBXs were log2-transformed and used to generate a heatmap with TBtools software. The red and blue colors represent the higher and lower relative abundance of AhBBXs, respectively.
The findings revealed that, among the 39 AhBBXs of cultivated peanuts, 15 genes demonstrated a two-fold increase in expression under drought stress, while nine genes exhibited a two-fold increase in expression when exposed to salt stress. AhBBX6, AhBBX9, AhBBX11, AhBBX13, AhBBX14, AhBBX16, AhBBX17, AhBBX27, AhBBX31, AhBBX32, AhBBX34, AhBBX35, and AhBBX38 showed an increase in expression under both drought and salt stress. Most genes belonging to the same subgroup showed similar expression patterns when subjected to salt or drought stress. For example, the expressions of AhBBX7, AhBBX15, AhBBX24, AhBBX28, and AhBBX33 increased under drought stress and decreased under salt stress. The expressions of AhBBX4, AhBBX25, and AhBBX37 decreased under drought stress and increased under salt stress. The expressions of AhBBX6, AhBBX7, AhBBX15, AhBBX27, AhBBX28, and AhBBX33 were elevated more than 15-fold under drought stress, and the expressions of AhBBX4, AhBBX6, AhBBX25, and AhBBX37 were elevated more than eight-fold under salt stress. These results imply that BBXs are probably involved in controlling a variety of plant signal transduction pathways in response to stress regulation.
2.9. qRT-PCR of BBXs under Salt and Drought Stresses
Earlier research has shown the significant involvement of BBXs in responses to hormones and different biotic or abiotic pressures [30]. To further analyze the potential role of AhBBXs in response to abiotic stresses, eight BBXs that were highly expressed based on transcriptome data under salt and/or drought stress were selected for qRT-PCR validation (Figure 9).
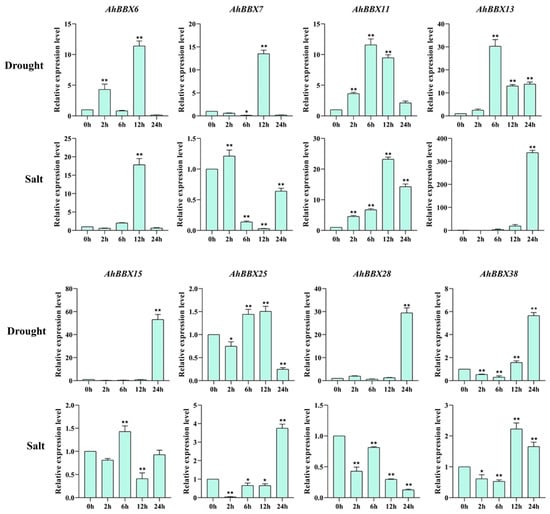
Figure 9.
Comparison of the expression of 8 AhBBXs uner drought or salt stress based on qRT-PCR. The data are presented as the mean ± SD (n = 3). The * and ** symbols represent a significant difference compared to 0 h at p < 0.05 and p < 0.01, respectively.
Under drought treatment, the expression levels of AhBBX6, AhBBX7, AhBBX11, AhBBX13, AhBBX15, AhBBX28, and AhBBX38 increased, while the expression level of AhBBX25 increased and then decreased. Under the high salt treatment of the eight genes, except AhBBX7, AhBBX15, and AhBBX28, the expression levels of AhBBX6, AhBBX11, AhBBX13, AhBBX25, and AhBBX38 increased. Together, all eight genes were found to be responsive to salt and/or drought treatments, with AhBBX6, AhBBX11, AhBBX13, and AhBBX38 all showing increased expression under salt and drought stress, suggesting their potential involvement in regulating tolerance against salt and drought stresses.
2.10. Subcellular Localization Analysis of AhBBX6
The predicted subcellular localization results showed that AhBBX6 is localized in the nucleus. To verify the location of AhBBX6 in the cell, we performed subcellular localization experiments by transiently expressing the AhBBX6-GFP fusion protein and 35S-GFP (empty vector) in tobacco epidermal cells. The results showed that AhBBX6-GFP was expressed only in the nucleus, indicating that AhBBX6 was localized in the nucleus (Figure 10).
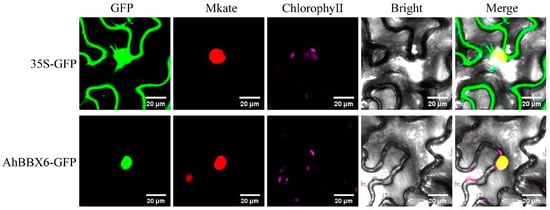
Figure 10.
Subcellular localization of AhBBX6 in tobacco leaves. The green fluorescence in the GFP plot represents the GFP fluorescence signal. The red fluorescence in the Mkate plot represents the nucleu marker. The purple fluorescence in the ChlorophyeⅡ plot represents the Chloroplast fluorescence signal. The Bright plot is the bright field. The yellow fluorescence in the Merge plot represents the overlap of the green fluorescence from GFP with the red fluorescence from the marker. The visible light, and merged green fluorescence and visible light images are presented.
2.11. Silencing of AhBBX6 Reduces Tolerance to Salt and Drought Stresses
We used virus-induced gene silencing to explore the potential function of AhBBX6 in salt and drought tolerance. The octahydro lycopene desaturase (PDS) gene in peanuts (Arahy.M5MKEZ) was chosen as an indicator gene for the success of the VIGS system [31,32]. Based on qRT-PCR, the relative expression of PDS-encoding genes was significantly decreased in AhPDS-silenced plants compared to the control plants (pTRV2/0) (Figure S2).
The qRT-PCR results showed that the expression level of AhBBX6 was reduced in AhBBX6-silenced plants (pTRV2/AhBBX6) compared with the control plants, suggesting the effective suppression of AhBBX6 (Figure S3). Under the conditions of no salt or drought, the control and gene-silenced plants exhibited no significant disparity (Figure S4). However, after the treatment of salt stress, the leaves of pTRV2/AhBBX6 plants curled and wilted, which were not observed in the control plants (pTRV2/0) (Figure 11A). We then determined the levels of antioxidant (CAT, SOD, and POD) and oxidant (MDA) enzyme concentrations in the control and AhBBX6-silenced plants. Compared to the control plants, the silenced plants had reduced concentrations of antioxidants and increased concentrations of MDA (Figure 11B–E).
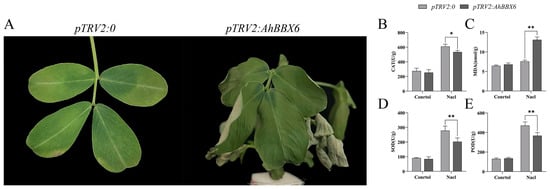
Figure 11.
Silencing of AhBBX6 reduces tolerance to salt in peanuts. (A) Phenotype of the control (pTRV2/0) and gene-silenced (pTRV2/AhBBX6) plant after salt treatment. (B–E) Comparison of CAT (B), MDA (C), SOD (D), and POD (E) activities before and after salt treatment. The * and ** symbols indicate significant differences at p < 0.05 and p < 0.01, respectively.
After drought stress treatment, the leaves of pTRV2/AhBBX6 plants showed significant crumpling and wilting compared to those of the control plants (Figure 12A), and the concentration of antioxidants (CAT, SOD, and POD) was significantly reduced in the silenced plants, whereas the concentration of MDA increased (Figure 12B–E). These results suggest that AhBBX6-silenced plants are more sensitive to salt and drought stresses.
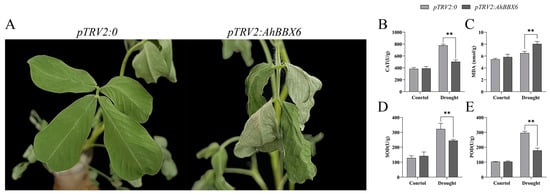
Figure 12.
Silencing of AhBBX6 reduces tolerance to drought in peanuts. (A) Phenotype of the control (pTRV2/0) and gene-silenced (pTRV2/AhBBX6) plant after drought treatment. (B–E) Comparison of CAT (B), MDA (C), SOD (D) and POD (E) activities before and after drought treatment. The ** symbol indicates significant differences at p < 0.01, respectively.
3. Materials and Methods
3.1. Identification of AhBBX Members
The protein sequences of A. hypogaea, A. duranensis, and A. ipaensis were obtained from Peanutbase (https://legacy.peanutbase.org/peanut_genome (accessed on 14 March 2023)). The HMM profile for the zinc finger domain of the BBX protein (PF00643) [33] was acquired from the Pfam website and employed in the identification of AhBBXs using TBtools (version 2.069) [34]. The domains of BBX proteins were further examined using tools available on NCBI [35] and Pfam [36], and the location of the B-box 1/B-box 2/CCT structural domain was determined. A further manual examination was conducted to remove the candidate BBXs lacking the B-box domain to obtain the final set of peanut BBXs.
The online program ExPASy was used to determine the molecular weight (Mw) and isoelectric point (pI) of BBX proteins [37]. Based on Cell-PLoc 2.0, the subcellular localization of BBXs was predicted [38].
3.2. Sequence Alignment and Phylogenetic Analysis
BBX proteins from peanuts, Arabidopsis (https://www.arabidopsis.org/index.jsp (accessed on 14 March 2023)), and rice (https://riceome.hzau.edu.cn/ (accessed on 14 March 2023)) were aligned using the multiple sequence alignment function of Clustal W. The neighbor-joining (NJ) method of MEGA X software (version 10.2.6) was used to construct a phylogenetic tree with 1000 bootstrap replicates [39]. The tree was further edited using the R programming language.
3.3. Chromosomal Localization and Gene Duplication Analyses
The GFF file downloaded from PeanutBase was used to extract the chromosomal positions and lengths of AhBBXs, and the chromosomal positions of the genes were visualized using the online tool MG2C [40]. Gene duplication events and collinearity analysis were performed using TBtools software (version 2.069). The results of the gene duplication analysis and collinearity analysis were visualized using TBtools (version 2.069) [34].
3.4. Analysis of Gene Structure and Conserved Motif of BBX Proteins
The CDS and genomic sequences of peanut BBXs were obtained from PeanutBase. The TBtools software (version 2.069) was used to analyze gene structures. The conserved motifs of BBXs were analyzed using TBtools software (version 2.069) with parameters set to a maximum of 10 motifs, each of which was 6–50 amino acid residues in length. The conserved motifs were then mapped using TBtools software (version 2.069) [34].
3.5. Prediction of cis-Acting Elements in Promoter Sequences
To gain a better understanding of the cis-acting elements present in the promoter region of AhBBXs, the promoter sequences (2000 bp sequences located upstream of the transcription start site) of the genes were downloaded from PeanutBase and used for the analysis of cis-regulatory elements. The analysis was carried out utilizing the online program PlantCARE [41], and TBtools software (version 2.069) was used to visualize the findings [34].
3.6. RNA-Seq-Based Expression Profiling of AhBBXs
To ascertain the expression profile of peanut BBXs across different tissues and in response to abiotic stresses, we acquired publicly available peanut RNA-seq data from NCBI and PeanutBase and investigated the expression profile of AhBBXs in 22 different developmental stages and tissues [42], as well as under high salt and drought stresses [28,29]. The expression data of AhBBXs were filtered and normalized and then visualized by TBtools software (version 2.069) [34].
3.7. Abiotic Stress Treatments
The seeds of the cultivated peanut (A. hypogaea L.) variety Jinghua11 were provided by the Variety Resource Group of the Peanut Research Institute, Shandong, China. Seed germination was performed in a light incubator. When seedlings reached 3–4 fully expanded true leaves, they were treated with 200 mmol L−1 of NaCl [28] or 20% PEG (MW: 6000) [29]. The leaves and roots of the plants were collected at 0, 2, 6, 12, and 24 h post-treatment, with leaves and roots from the untreated plants serving as controls. Three biological replicate samples were collected for each time point. The collected specimens were promptly preserved in liquid nitrogen and kept at −80 °C for subsequent qRT-PCR analysis.
3.8. Total RNA Extraction, Reverse Transcription and qRT-PCR
Total RNA was extracted using the MiniBEST Plant RNA Extraction Kit (TaKaRa) and reversely transcribed to generate first-strand cDNA using the EScript RT-PCR (TaKaRa). The qRT-PCR was performed using the PerfectStart Green qPCR SuperMix kit. The reaction system and conditions were described by Mou et al., 2022 [43]. The qRT-PCR was carried out on a LightCycler 480 II instrument. Gene expression levels were calculated using the 2−ΔΔC method [44]. Three biological replicates were used for each PCR assay. The peanut Actin gene [45] served as the internal reference gene.
3.9. Subcellular Localization of AhBBX6
The amplified AhBBX6 coding sequence was first ligated into the pBWA(V)HS-GFP vector using the in-fusion method and transfected into E. coli-competent cells (5α) to construct the pBWA(V)HS-AhBBX6-GFP vector plasmid. The constructed vector plasmid generated was transferred into the Agrobacterium tumefaciens strain GV3101 and cultivated at 30 °C for 2 d. The suspension OD value was adjusted to 0.6, and then the cultured strain was injected into the lower epidermis of vigorously growing tobacco leaves. After cultivation, under low light conditions for 2 d, the injected leaf samples were taken to make slides and then observed under a laser confocal microscope (Nikon C2-ER, Tokyo, Japan). The GFP vector without AhBBX6 was used as a control.
3.10. Virus-Induced Gene Silencing (VIGS) of AhBBX6
In order to study the function of AhBBX6 under salt and drought tolerance, we used virus-inducted gene-silencing techniques to silence the gene. The peanut variety chosen was the cultivated peanut (A. hypogaea L.) variety Huayu9306 provided by the Variety Resource Group of the Peanut Research Institute, Shandong, China. The VIGS vectors, pTRV1 and pTRV2, were maintained by our laboratory. pTRV2/AhBBX6 with restriction enzyme cleavage sites EcoRI and BamHI was constructed. Plants were injected with the viral vector (pTRV2/AhBBX6) when they had grown to two fully expanded true leaves, and plants inoculated only with the TRV2 vector were utilized as controls. After injection, the plants were cultured in the dark for 3d and then placed in a light incubator. When the plants had their 5th fully expanded true leaf, the expression level of AhBBX6 in the plants was analyzed using qRT-PCR. Plants with a gene silencing efficiency of more than 50% were regarded as true silencers and used in salt (200 mmol L−1 NaCl) and drought (20% PEG (MW: 6000)) treatments. Plants treated with water were used as controls.
3.11. Adversity Assay of Gene-Silenced Plants
Plants treated with slat or drought stress were subjected to the detection of MDA (malondialdehyde) content, SOD (catalase), POD (peroxidase), and CAT (catalase) activities using commercial assay kits (Geruisi Bio, Suzhou, China). For each assay, three biological replications were conducted.
4. Discussion
The BBX gene family is a class of zinc-finger transcription factors that are widely distributed in plants and exert significant influence on plant development and responses to various stresses. The identification of BBX family members has been documented in multiple plant species, highlighting the significance of the gene family [1,2,3,4,5,6,7,8].
On the basis of the identification of 77 BBXs in three peanut species, this study performed a comprehensive phylogenetic analysis of BBXs in three peanut species, Arabidopsis and rice. The analysis classified the 77 peanut BBXs into five subfamilies (Figure 1, Tables S2 and S3), which is consistent with previous research conducted in Arabidopsis [1]. Members within the same subfamily exhibit conserved or similar distributions of protein motifs (Figure 5B, Table S6), supporting the results of the evolutionary analysis and also suggesting that peanut BBX members within the same subfamily might have similar biological functions. Previous studies have shown that the intron–exon structure can provide support for the phylogenetic relationships of gene families [46]. In this study, genes on the same sub-branch of the phylogenetic tree generally possessed comparable exon–intron structures (Figure 5C, Table S7). Furthermore, gene duplication events could potentially play a role in the expansion of gene families [26]. In this study, 43 segmental duplicated gene pairs were identified among AhBBXs (Figure 3, Table S4), indicating that each duplicated gene pair may have relatively close evolutionary relationships and gene functions.
Salt stress and drought stress can severely affect crop growth and yield [47,48,49]. Currently, it has been reported that a variety of plants have been able to achieve high or stable yields under drought and high salt conditions by increasing or decreasing the expression of some of their own genes to withstand adverse external conditions. For instance, AhABI4-silenced plants exhibited increased survival rates under salt stress [32]. Overexpressing the TaGPX1-D [50] or TaNCL2-A [51] of wheat (Triticum aestivum) in Arabidopsis enhanced Arabidopsis tolerance to salt and osmotic stresses. In addition, the overexpression of the zinc finger protein GmZF351 has been reported to improve the tolerance of soybeans to salt and drought stress [52]. Numerous studies have demonstrated that BBXs have a vital function in controlling the complex mechanisms of abiotic stress response [30,53].
The analysis of transcriptome data from previous studies revealed that 11 AhBBXs had a two-fold increase in expression under drought stress, while six AhBBXs exhibited a two-fold increase in expression under salt stress (Figure 8, Table S10). The stress responses of some of these genes were validated by qRT-PCR (Figure 9). Previous studies have found that AtBBX24 is involved in salt stress signal transduction [54]. Plants overexpressing AtBBX24 show improved salt tolerance compared to wild-type Arabidopsis [55], and AhBBX13 belongs to the same cluster as AtBBX24, which is highly expressed under salt stress. Therefore, it is hypothesized that AhBBX13 is likely to be related to responses to salt stress. The complex of CmBBX19 and ABF3 (ABA signaling) is capable of regulating plant drought tolerance via the ABA-dependent pathway [18]. OsBBX2 and OsBBX24 of subfamily V are involved in regulating signal transduction pathways under cold and drought stresses [19]. AhBBX15, located in the same subfamily as these two rice genes, is highly expressed under drought stress. Thus, it is speculated that AhBBX15 might play a role in drought tolerance in peanuts. The overexpression of AtBBX5 leads to increased resistance to salt stress in genetically modified Arabidopsis through the abscisic acid-dependent signaling pathway [56]. In this study, AhBBX38 clustered together with AtBBX5 and showed a differential expression under salt stress, suggesting the potential functional similarity between AhBBX38 and AtBBX5 and the potential involvement of AhBBX38 in the salt stress response.
We discovered significant increases in AhBBX6 expression after both salt and drought treatments (Figure 9) and AhBBX6-silenced plants were more sensitive to salt and drought treatments (Figure 11 and Figure 12), indicating the role of this gene in salt and drought tolerance. Previous studies have demonstrated that the activities of the antioxidant enzyme system are positively correlated with plant salt and drought tolerance [57]. These enzymes not only protect various components of the cell from damage but also play a vital role in plant growth and development by regulating cell–subcellular processes [58,59,60,61]. Under salt or drought stress, the antioxidant contents decreased significantly in pTRV2/AhBBX6 plants, and the MDA content increased significantly, suggesting that the integrality of the plasma membrane is associated with AhBBX6-meditated salt and drought tolerance.
Overall, AhBBXs likely play crucial roles in controlling how peanuts react to various stresses, and AhBBX6 positively regulates peanut tolerance to salt and drought stresses. Further studies are required to elucidate the precise functions and fundamental mechanisms of AhBBXs in peanut growth and stress responses. The findings of this study establish a fundamental basis for selecting candidate AhBBXs for further investigation.
5. Conclusions
In this study, 77 BBXs were identified from wild and cultivated peanut species. The newly identified BBX family members were comprehensively analyzed using bioinformatics methods such as phylogenetic analysis, protein-conserved motifs, chromosomal localization, intraspecific collinearity, and expression patterns. Furthermore, four BBXs were identified as candidate regulators of tolerance to saline and drought stresses. Notably, the silencing of AhBBX6 reduced tolerance to salt and drought stress in peanuts. These findings contribute information for further studying the function and regulatory mechanisms of BBXs in peanuts under salt or drought stress.
Supplementary Materials
The following supporting information can be downloaded at: https://www.mdpi.com/article/10.3390/plants13070955/s1, Figure S1: The structural domains of peanut BBXs; Figure S2: The expression level of AhPDS in pTRV2/AhPDS-silenced plants compared to pTRV2/0 plants The * and ** symbols represent a significant difference compared to control plants (pTRV2/0) at p < 0.05 and p < 0.01, respectively; Figure S3: The results of the gene silencing efficiency test. The ** symbols represents a significant difference compared to control plants (pTRV2/0) at p < 0.01, respectively; Figure S4: Control plants (pTRV2/0) and pTRV2/AhBBX6-silenced plants after 14d of injection. Table S1: The primers used throughout this investigation; Table S2: The information on BBXs in the cultivated and the two wild peanut species; Table S3: The name of Arabidopsis and rice BBX family members in the text; Table S4: The details of segmental duplications gene pairs; Table S5: The syntenic pairs between AhBBXs and four plant species (Arabidopsis, soybean, tomato, and rice); Table S6: The details of conserved protein motifs; Table S7: Information on the number of exons of peanut BBX family members; Table S8: Information on cis-acting elements of peanut BBX family members; Table S9: Information on the 22 tissues expressed by the peanut BBX family members; Table S10: The transcriptome data of AhBBXs under salt and drought stresses.
Author Contributions
H.T., J.S. and Q.S. conceived and designed the study. H.T. performed the experiments and wrote the manuscript. H.S. helped with the experiment. S.S., F.L., C.Y. and Z.W. revised the paper. F.L., Q.S. and Z.W provide funding. All authors have read and agreed to the published version of the manuscript.
Funding
This research was funded by the Natural Science Foundation of China (31960369), the National Key Research and Development Program (2022YFD1200403, 2022YFD1000105), the Research project of Xinjiang Academy of Agricultural and Reclamation Science: Gene mapping and functional verification on peg strength of peanuts (No. 2024YJPY01).
Data Availability Statement
All data supporting the findings of this study are available within the paper and within its Supplementary Materials published online.
Acknowledgments
The authors are grateful to Shihezi University and the Shandong Peanut Research Institute for providing us with a platform. We thank Qian-Hao Zhu (CSIRO Agriculture and Food) and Shouhong Zhu (Chinese Academy of Agricultural Sciences) for editing the English text of a draft of this manuscript.
Conflicts of Interest
The authors declare no conflicts of interest.
References
- Khanna, R.; Kronmiller, B.; Maszle, D.R.; Coupland, G.; Holm, M.; Mizuno, T.; Wu, S.H. The Arabidopsis B-Box Zinc Finger Family. Plant Cell 2009, 21, 3416–3420. [Google Scholar] [CrossRef] [PubMed]
- Talar, U.; Kielbowicz-Matuk, A.; Czarnecka, J.; Rorat, T. Genome-wide survey of B-box proteins in potato (Solanum tuberosum)-Identification, characterization and expression patterns during diurnal cycle, etiolation and de-etiolation. PLoS ONE 2017, 12, e0177471. [Google Scholar] [CrossRef] [PubMed]
- Shan, B.; Bao, G.; Shi, T.; Zhai, L.; Bian, S.; Li, X. Genome-wide identification of BBX gene family and their expression patterns under salt stress in soybean. BMC Genom. 2022, 23, 820. [Google Scholar] [CrossRef] [PubMed]
- Ma, R.; Chen, J.; Huang, B.; Huang, Z.; Zhang, Z. The BBX gene family in Moso bamboo (Phyllostachys edulis): Identification, characterization and expression profiles. BMC Genom. 2021, 22, 533. [Google Scholar] [CrossRef] [PubMed]
- Chu, Z.N.; Wang, X.; Li, Y.; Yu, H.Y.; Li, J.H.; Lu, Y.G.; Li, H.X.; Ouyang, B. Genomic Organization, Phylogenetic and Expression Analysis of the B-BOX Gene Family in Tomato. Front. Plant Sci. 2016, 7, 1552. [Google Scholar] [CrossRef] [PubMed]
- Liu, X.; Li, R.; Dai, Y.Q.; Chen, X.S.; Wang, X.Y. Genome-wide identification and expression analysis of the B-box gene family in the Apple (Malus domestica Borkh.) genome. Mol. Genet. Genom. 2018, 293, 303–315. [Google Scholar] [CrossRef] [PubMed]
- Huang, J.Y.; Zhao, X.B.; Weng, X.Y.; Wang, L.; Xie, W.B. The Rice B-Box Zinc Finger Gene Family: Genomic Identification, Characterization, Expression Profiling and Diurnal Analysis. PLoS ONE 2012, 7, e48242. [Google Scholar] [CrossRef]
- Xu, X.H.; Li, W.L.; Yang, S.K.; Zhu, X.Z.; Sun, H.W.; Li, F.; Lu, X.B.; Cui, J.J. Identification, evolution, expression and protein interaction analysis of genes encoding B-box zinc-finger proteins in maize. J. Integr. Agric. 2023, 22, 371–388. [Google Scholar] [CrossRef]
- Putterill, J.; Robson, F.; Lee, K.; Simon, R.; Coupland, G. The CONSTANS gene of Arabidopsis promotes flowering and encodes a protein showing similarities to zinc finger transcription factors. Cell 1995, 80, 847–857. [Google Scholar] [CrossRef]
- Datta, S.; Hettiarachchi, G.; Deng, X.W.; Holm, M. Arabidopsis CONSTANS-LIKE3 is a positive regulator of red light signaling and root growth. Plant Cell 2006, 18, 70–84. [Google Scholar] [CrossRef]
- Steinbach, Y. The Arabidopsis thaliana CONSTANS LIKE 4 (COL4)—A Modulator of Flowering Time. Front. Plant Sci. 2019, 10, 429068. [Google Scholar] [CrossRef] [PubMed]
- Hassidim, M.; Harir, Y.; Yakir, E.; Kron, I.; Green, R.M. Over-expression of CONSTANS-LIKE 5 can induce flowering in short-day grown Arabidopsis. Planta 2009, 230, 481–491. [Google Scholar] [CrossRef] [PubMed]
- Cheng, X.F.; Wang, Z.Y. Overexpression of COL9, a CONSTANS-LIKE gene, delays flowering by reducing expression of CO and FT in Arabidopsis thaliana. Plant J. 2005, 43, 758–768. [Google Scholar] [CrossRef]
- Liu, Y.; Lin, G.; Yin, C.M.; Fang, Y.D. B-box transcription factor 28 regulates flowering by interacting with constans. Sci. Rep. 2020, 10, 17789. [Google Scholar] [CrossRef] [PubMed]
- Tripathi, P.; Carvallo, M.; Hamilton, E.E.; Preuss, S.; Kay, S.A. Arabidopsis B-BOX32 interacts with CONSTANS-LIKE3 to regulate flowering. Proc. Natl. Acad. Sci. USA 2017, 114, 172–177. [Google Scholar] [CrossRef] [PubMed]
- Li, F.; Sun, J.J.; Wang, D.H.; Bai, S.N.; Clarke, A.K.; Holm, M. The B-Box Family Gene STO (BBX24) in Arabidopsis thaliana Regulates Flowering Time in Different Pathways. PLoS ONE 2014, 9, e87544. [Google Scholar] [CrossRef] [PubMed]
- Yang, Y.J.; Ma, C.; Xu, Y.J.; Wei, Q.; Imtiaz, M.; Lan, H.B.; Gao, S.; Cheng, L.N.; Wang, M.Y.; Fei, Z.J.; et al. A Zinc Finger Protein Regulates Flowering Time and Abiotic Stress Tolerance in Chrysanthemum by Modulating Gibberellin Biosynthesis. Plant Cell 2014, 26, 2038–2054. [Google Scholar] [CrossRef] [PubMed]
- Xu, Y.J.; Zhao, X.; Aiwaili, P.; Mu, X.Y.; Zhao, M.; Zhao, J.; Cheng, L.N.; Ma, C.; Gao, J.P.; Hong, B. A zinc finger protein BBX19 interacts with ABF3 to affect drought tolerance negatively in chrysanthemum. Plant J. 2020, 103, 1783–1795. [Google Scholar] [CrossRef] [PubMed]
- Shalmani, A.; Jing, X.Q.; Shi, Y.; Muhammad, I.; Zhou, M.R.; Wei, X.Y.; Chen, Q.Q.; Li, W.Q.; Liu, W.T.; Chen, K.M. Characterization of B-BOX gene family and their expression profiles under hormonal, abiotic and metal stresses in Poaceae plants. BMC Genom. 2019, 20, 27. [Google Scholar] [CrossRef] [PubMed]
- Chen, P.X.; Zhi, F.; Li, X.W.; Shen, W.Y.; Yan, M.J.; He, J.Q.; Bao, C.N.; Fan, T.L.; Zhou, S.X.; Ma, F.W.; et al. Zinc-finger protein MdBBX7/MdCOL9, a target of MdMIEL1 E3 ligase, confers drought tolerance in apple. Plant Physiol. 2022, 188, 540–559. [Google Scholar] [CrossRef]
- An, J.P.; Zhang, C.L.; Li, H.L.; Wang, G.L.; You, C.X. Apple SINA E3 ligase MdSINA3 negatively mediates JA-triggered leaf senescence by ubiquitinating and degrading the MdBBX37 protein. Plant J. 2022, 111, 457–472. [Google Scholar] [CrossRef]
- Song, J.N.; Lin, R.; Tang, M.J.; Wang, L.Y.; Fan, P.X.; Xia, X.J.; Yu, J.Q.; Zhou, Y.H. SlMPK1-and SlMPK2-mediated SlBBX17 phosphorylation positively regulates CBF-dependent cold tolerance in tomato. New Phytol. 2023, 239, 1887–1902. [Google Scholar] [CrossRef] [PubMed]
- Bertioli, D.J.; Cannon, S.B.; Froenicke, L.; Huang, G.D.; Farmer, A.D.; Cannon, E.K.S.; Liu, X.; Gao, D.Y.; Clevenger, J.; Dash, S.; et al. The genome sequences of Arachis duranensis and Arachis ipaensis, the diploid ancestors of cultivated peanut. Nat. Genet. 2016, 48, 438–446. [Google Scholar] [CrossRef] [PubMed]
- Zhuang, W.J.; Chen, H.; Yang, M.; Wang, J.P.; Pandey, M.K.; Zhang, C.; Chang, W.C.; Zhang, L.S.; Zhang, X.T.; Tang, R.H.; et al. The genome of cultivated peanut provides insight into legume karyotypes, polyploid evolution and crop domestication. Nat. Genet. 2019, 51, 865–876. [Google Scholar] [CrossRef] [PubMed]
- Chen, X.P.; Lu, Q.; Liu, H.; Zhang, J.A.; Hong, Y.B.; Lan, H.F.; Li, H.F.; Wang, J.P.; Liu, H.Y.; Li, S.X.; et al. Sequencing of Cultivated Peanut, Arachis hypogaea, Yields Insights into Genome Evolution and Oil Improvement. Mol. Plant 2019, 12, 920–934. [Google Scholar] [CrossRef] [PubMed]
- Leister, D. Tandem and segmental gene duplication and recombination in the evolution of plant disease resistance genes. Trends Genet. 2004, 20, 116–122. [Google Scholar] [CrossRef] [PubMed]
- Daszkowska-Golec, A. ABA is important not only under stress—Revealed by the discovery of new ABA transporters. Trends Plant Sci. 2022, 27, 423–425. [Google Scholar] [CrossRef]
- Zhang, H.; Zhao, X.B.; Sun, Q.X.; Yan, C.X.; Wang, J.; Yuan, C.L.; Li, C.J.; Shan, S.H.; Liu, F.Z. Comparative Transcriptome Analysis Reveals Molecular Defensive Mechanism of Arachis hypogaea in Response to Salt Stress. Int. J. Genom. 2020, 2020, 6524093. [Google Scholar] [CrossRef] [PubMed]
- Zhao, X.B.; Li, C.J.; Wan, S.B.; Zhang, T.T.; Yan, C.X.; Shan, S.H. Transcriptomic analysis and discovery of genes in the response of Arachis hypogaea to drought stress. Mol. Biol. Rep. 2018, 45, 119–131. [Google Scholar] [CrossRef] [PubMed]
- Gangappa, S.N.; Botto, J.F. The BBX family of plant transcription factors. Trends Plant Sci. 2014, 19, 460–470. [Google Scholar] [CrossRef]
- Zhao, X.; Wang, Q.; Yan, C.; Sun, Q.; Wang, J.; Li, C.; Yuan, C.; Mou, Y.; Shan, S. The bHLH transcription factor AhbHLH121 improves salt tolerance in peanut. Int. J. Biol. Macromol. 2024, 256, 128492. [Google Scholar] [CrossRef] [PubMed]
- Luo, L.; Wan, Q.; Zhang, K.; Zhang, X.; Guo, R.; Wang, C.; Zheng, C.; Liu, F.; Ding, Z.; Wan, Y. AhABI4s Negatively Regulate Salt-Stress Response in Peanut. Front. Plant Sci. 2021, 12, 741641. [Google Scholar] [CrossRef] [PubMed]
- El-Gebali, S.; Mistry, J.; Bateman, A.; Eddy, S.R.; Luciani, A.; Potter, S.C.; Qureshi, M.; Richardson, L.J.; Salazar, G.A.; Smart, A.; et al. The Pfam protein families database in 2019. Nucleic Acids Res. 2019, 47, D427–D432. [Google Scholar] [CrossRef] [PubMed]
- Chen, C.J.; Chen, H.; Zhang, Y.; Thomas, H.R.; Frank, M.H.; He, Y.H.; Xia, R. TBtools: An Integrative Toolkit Developed for Interactive Analyses of Big Biological Data. Mol. Plant 2020, 13, 1194–1202. [Google Scholar] [CrossRef] [PubMed]
- Marchler-Bauer, A.; Anderson, J.B.; Cherukuri, P.F.; DeWweese-Scott, C.; Geer, L.Y.; Gwadz, M.; He, S.Q.; Hurwitz, D.I.; Jackson, J.D.; Ke, Z.X.; et al. CDD: A conserved domain database for protein classification. Nucleic Acids Res. 2005, 33, D192–D196. [Google Scholar] [CrossRef] [PubMed]
- Finn, R.D.; Mistry, J.; Schuster-Böckler, B.; Griffiths-Jones, S.; Hollich, V.; Lassmann, T.; Moxon, S.; Marshall, M.; Khanna, A.; Durbin, R.; et al. Pfam:: Clans, web tools and services. Nucleic Acids Res. 2006, 34, D247–D251. [Google Scholar] [CrossRef] [PubMed]
- Artimo, P.; Jonnalagedda, M.; Arnold, K.; Baratin, D.; Csardi, G.; de Castro, E.; Duvaud, S.; Flegel, V.; Fortier, A.; Gasteiger, E.; et al. ExPASy: SIB bioinformatics resource portal. Nucleic Acids Res. 2012, 40, W597–W603. [Google Scholar] [CrossRef] [PubMed]
- Chou, K.C.; Shen, H.B. Cell-PLoc: A package of Web servers for predicting subcellular localization of proteins in various organisms. Nat. Protoc. 2008, 3, 153–162. [Google Scholar] [CrossRef]
- Kumar, S.; Stecher, G.; Li, M.; Knyaz, C.; Tamura, K. MEGA X: Molecular Evolutionary Genetics Analysis across Computing Platforms. Mol. Biol. Evol. 2018, 35, 1547–1549. [Google Scholar] [CrossRef]
- Chao, J.; Li, Z.; Sun, Y.; Aluko, O.O.; Wu, X.; Wang, Q.; Liu, G. MG2C: A user-friendly online tool for drawing genetic maps. Mol. Hortic. 2021, 1, 16. [Google Scholar] [CrossRef]
- Lescot, M.; Déhais, P.; Thijs, G.; Marchal, K.; Moreau, Y.; Van de Peer, Y.; Rouzé, P.; Rombauts, S. PlantCARE, a database of plant cis-acting regulatory elements and a portal to tools for in silico analysis of promoter sequences. Nucleic Acids Res. 2002, 30, 325–327. [Google Scholar] [CrossRef]
- Clevenger, J.; Chu, Y.; Scheffler, B.; Ozias-Akins, P. A Developmental Transcriptome Map for Allotetraploid Arachis hypogaea. Front. Plant Sci. 2016, 7, 220711. [Google Scholar] [CrossRef] [PubMed]
- Mou, Y.F.; Yuan, C.L.; Sun, Q.X.; Yan, C.X.; Zhao, X.B.; Wang, J.; Wang, Q.; Shan, S.H.; Li, C.J. MIKC-type MADS-box transcription factor gene family in peanut: Genome-wide characterization and expression analysis under abiotic stress. Front. Plant Sci. 2022, 13, 980933. [Google Scholar] [CrossRef] [PubMed]
- Livak, K.J.; Schmittgen, T.D. Analysis of relative gene expression data using real-time quantitative PCR and the 2ΔΔCT method. Methods 2001, 25, 402–408. [Google Scholar] [CrossRef] [PubMed]
- Chi, X.Y.; Hu, R.B.; Yang, Q.L.; Zhang, X.W.; Pan, L.J.; Chen, N.; Chen, M.N.; Yang, Z.; Wang, T.; He, Y.A.; et al. Validation of reference genes for gene expression studies in peanut by quantitative real-time RT-PCR. Mol. Genet. Genom. 2012, 287, 167–176. [Google Scholar] [CrossRef] [PubMed]
- Li, X.X.; Duan, X.P.; Jiang, H.X.; Sun, Y.J.; Tang, Y.P.; Yuan, Z.; Guo, J.K.; Liang, W.Q.; Chen, L.; Yin, J.Y.; et al. Genome-wide analysis of basic/helix-loop-helix transcription factor family in rice and Arabidopsis. Plant Physiol. 2006, 141, 1167–1184. [Google Scholar] [CrossRef] [PubMed]
- Barkla, B.J.; Vera-Estrella, R.; Pantoja, O. Progress and challenges for abiotic stress proteomics of crop plants. Proteomics 2013, 13, 1801–1815. [Google Scholar] [CrossRef] [PubMed]
- Zhang, H.; Li, Y.Y.; Zhu, J.K. Developing naturally stress-resistant crops for a sustainable agriculture. Nat. Plants 2018, 4, 989–996. [Google Scholar] [CrossRef]
- Papiernik, S.K.; Grieve, C.M.; Lesch, S.M.; Yates, S.R. Effects of Salinity, Imazethapyr, and Chlorimuron Application on Soybean Growth and Yield. Commun. Soil Sci. Plant Anal. 2005, 36, 951–967. [Google Scholar] [CrossRef]
- Tyagi, S.; Shumayla; Sharma, Y.; Sharma, A.; Pandey, A.; Singh, K.; Upadhyay, S.K. TaGPX1-D overexpression provides salinity and osmotic stress tolerance in Arabidopsis. Plant Sci. 2023, 337, 111881. [Google Scholar] [CrossRef]
- Tyagi, S.; Sharma, Y.; Sharma, A.; Pandey, A.; Singh, K.; Upadhyay, S.K. Expression of TaNCL2-A ameliorates cadmium toxicity by increasing calcium and enzymatic antioxidants activities in Arabidopsis. Chemosphere 2023, 329, 138636. [Google Scholar] [CrossRef]
- Wei, W.; Lu, L.; Bian, X.-H.; Li, Q.-T.; Han, J.-Q.; Tao, J.-J.; Yin, C.-C.; Lai, Y.-C.; Li, W.; Bi, Y.-D.; et al. Zinc-finger protein GmZF351 improves both salt and drought stress tolerance in soybean. J. Integr. Plant Biol. 2023, 65, 1636–1650. [Google Scholar] [CrossRef] [PubMed]
- Talar, U.; Kielbowicz-Matuk, A. Beyond Arabidopsis: BBX Regulators in Crop Plants. Int. J. Mol. Sci. 2021, 22, 2906. [Google Scholar] [CrossRef] [PubMed]
- Lippuner, V.; Cyert, M.S.; Gasser, C.S. Two classes of plant cDNA clones differentially complement yeast calcineurin mutants and increase salt tolerance of wild-type yeast. J. Biol. Chem. 1996, 271, 12859–12866. [Google Scholar] [CrossRef] [PubMed]
- Nagaoka, S.; Takano, T. Salt tolerance-related protein STO binds to a Myb transcription factor homologue and confers salt tolerance in Arabidopsis. J. Exp. Bot. 2003, 54, 2231–2237. [Google Scholar] [CrossRef] [PubMed]
- Min, J.H.; Chung, J.S.; Lee, K.H.; Kim, C.S. The CONSTANS-like 4 transcription factor, AtCOL4, positively regulates abiotic stress tolerance through an abscisic acid-dependent manner in Arabidopsis. J. Integr. Plant Biol. 2015, 57, 313–324. [Google Scholar] [CrossRef] [PubMed]
- Rajput, V.D.; Harish; Singh, R.K.; Verma, K.K.; Sharma, L.; Quiroz-Figueroa, F.R.; Meena, M.; Gour, V.S.; Minkina, T.; Sushkova, S.; et al. Recent Developments in Enzymatic Antioxidant Defence Mechanism in Plants with Special Reference to Abiotic Stress. Biology 2021, 10, 267. [Google Scholar] [CrossRef] [PubMed]
- de Pinto, M.C.; De Gara, L. Changes in the ascorbate metabolism of apoplastic and symplastic spaces are associated with cell differentiation. J. Exp. Bot. 2004, 55, 2559–2569. [Google Scholar] [CrossRef] [PubMed]
- Liu, N.; Lin, Z.; Guan, L.; Gaughan, G.; Lin, G. Antioxidant Enzymes Regulate Reactive Oxygen Species during Pod Elongation in Pisum sativum and Brassica chinensis. PLoS ONE 2014, 9, e87588. [Google Scholar] [CrossRef]
- Prochazkova, D.; Wilhelmova, N. Leaf senescence and activities of the antioxidant enzymes. Biol. Plant. 2007, 51, 401–406. [Google Scholar] [CrossRef]
- Remacle, J.; Michiels, C.; Raes, M. The importance of antioxidant enzymes in cellular aging and degeneration. Free Radic. Aging 1992, 62, 99–108. [Google Scholar]
Disclaimer/Publisher’s Note: The statements, opinions and data contained in all publications are solely those of the individual author(s) and contributor(s) and not of MDPI and/or the editor(s). MDPI and/or the editor(s) disclaim responsibility for any injury to people or property resulting from any ideas, methods, instructions or products referred to in the content. |
© 2024 by the authors. Licensee MDPI, Basel, Switzerland. This article is an open access article distributed under the terms and conditions of the Creative Commons Attribution (CC BY) license (https://creativecommons.org/licenses/by/4.0/).