Abstract
The rapid production of hydrogen peroxide (H2O2) is a hallmark of plants’ successful recognition of pathogen infection and plays a crucial role in innate immune signaling. Aquaporins (AQPs) are membrane channels that facilitate the transport of small molecular compounds across cell membranes. In plants, AQPs from the plasma membrane intrinsic protein (PIP) family are utilized for the transport of H2O2, thereby regulating various biological processes. Plants contain two PIP families, PIP1s and PIP2s. However, the specific functions and relationships between these subfamilies in plant growth and immunity remain largely unknown. In this study, we explore the synergistic role of AtPIP1;4 and AtPIP2;4 in regulating plant growth and disease resistance in Arabidopsis. We found that in plant cells treated with H2O2, AtPIP1;4 and AtPIP2;4 act as facilitators of H2O2 across membranes and the translocation of externally applied H2O2 from the apoplast to the cytoplasm. Moreover, AtPIP1;4 and AtPIP2;4 collaborate to transport bacterial pathogens and flg22-induced apoplastic H2O2 into the cytoplasm, leading to increased callose deposition and enhanced defense gene expression to strengthen immunity. These findings suggest that AtPIP1;4 and AtPIP2;4 cooperatively mediate H2O2 transport to regulate plant growth and immunity.
1. Introduction
Plants have developed sophisticated signaling and response systems to adapt to various biotic and abiotic stresses. Reactive oxygen species (ROS), such as H2O2, play a crucial role in these processes by acting as signaling molecules that regulate plant growth, development, stress responses, and defenses [1,2]. Rapid production of ROS, especially in apoplasts, indicates effective plant recognition of pathogens [2,3,4]. The plasma membrane-localized NADPH oxidase (NOX) is the primary site of the pathogen-associated molecular pattern (PAMP)-induced ROS burst in plants, which catalyzes the production of superoxide (O2−) by transferring electrons from cytoplasmic NADPH to the plasma ectodomain, and finally the production of H2O2 by superoxide dismutase [4,5,6]. H2O2 can enter the plant cytoplasm via AQPs. Subsequently, H2O2 serves as a signaling to cross-talk with plant immunity pathways, such as activating pathogen-associated molecular pattern-triggered immunity (PTI) and systemic acquired resistance (SAR), enhancing the plants resistance to future pathogen attacks [2,7,8,9,10,11].
AQPs are integral membrane proteins initially characterized as water (H2O) transport channels [12]. Subsequent studies have revealed that AQPs can also transport more than 20 small molecule compounds, such as CO2 [11,13,14,15], H2O2 [9,10,11], NH3 [16], NO [17], and others [18,19]. Through their function in mediating substrate transport, AQPs regulate a variety of pathological and physiological processes [4,20,21,22]. AQP4, a key protein in astrocytes, plays a crucial role in the development and regulation of water balance in the brain and spinal cord by facilitating bidirectional water movement across cell membranes [23]. In mice, AQPs are essential for the transport of H2O2 into colonic epithelial cells, playing pivotal roles in wound repair, defense against infection, and inflammation in the colon [24]. In plants, PIPs transport small solutes to regulate plant growth and defense [21,22]. For instance, AtPIP1;4 facilitates the transport of H2O2 from the apoplast into the cytoplasm, thereby activating the SAR and PTI pathways in response to bacterial pathogens [9]. AtPIP2;1 is crucial for the intracellular accumulation of H2O2 following treatment with flg22 or ABA, thereby promoting stomatal closure [8]. In rice, OsPIP2;2 transports pathogen-induced H2O2 into the cytoplasm and facilitates the translocation of the OsmaMYB into the nucleus, intensifying defense responses against pathogens [10]. OsPIP1;3 and OsPIP2;1 enhances rice growth and grain yield by facilitating CO2 transport [15,25]. ZmPIP2;5 facilitates maize growth by transporting H2O [26,27,28]. TaPIP2;10 enhances both wheat growth and defense by promoting CO2 transport for photosynthesis and facilitating the cellular uptake of H2O2 to increase resistance against pathogen and aphid infections [11,29].
Plant PIPs can be categorized into two families based on sequence similarity: PIP1 and PIP2 [21,30,31]. The main structural distinctions between PIP1 and PIP2 lie in the lengths of their N-segment and C-terminal, and they also exhibit differences in their functional properties [32]. Several studies have indicated that certain PIP1 proteins have low efficiency in H2O transport [33,34], but they often acts as solute channels [15,35,36]. In comparison, the PIP2 group has been found to possess a higher capacity for H2O transport [37,38]. Some studies have reported that PIP1 is unable to localize to the plasma membrane (PM) when expressed alone, and must be co-expressed with PIP2 to correctly localize in the PM [39,40]. Many studies have focused on how PIP1 or PIP2 family proteins regulate plant physiology and pathology, respectively [9,10,11,25,27,29,38]. However, the specific contribution of PIP1 and PIP2 family proteins in H2O2 transport remain unclear, and their potential in regulating plant growth and immunity is still unknown.
This study bridges this knowledge gap by confirming that AtPIP1;4 and AtPIP2;4 cooperatively mediate H2O2 transport to regulate plant growth and immunity. We demonstrate that both AtPIP1;4 and AtPIP2;4 act as cooperative contributors to plant growth. Furthermore, we present evidence that AtPIP1;4 and AtPIP2;4 are concomitant channels for H2O2 transport from apoplast to cytoplasm, thereby activating PTI to enhance plant disease resistance.
2. Results
2.1. Both AtPIP1;4 and AtPIP2;4 Contribute to Plant Growth
To investigate the functional relationship between AtPIP1;4 and AtPIP2;4, we generated the atpip1;4 and atpip2;4 double mutant (atpip1;4atpip2;4) Arabidopsis lines by hybridizing the single mutants produced previously [9,41]. To further explore this relationship, we also generated Arabidopsis lines with the double overexpression of AtPIP1;4 and AtPIP2;4 genes (AtPIP1;4AtPIP2;4dOE) by crossing the single gene overexpression lines (AtPIP1;4OE and AtPIP2;4OE). Three representative homogeneous double mutant lines (atpip1;4atpip2;4 #19, #25, and #38) and three homogeneous double overexpression lines (AtPIP1;4AtPIP2;4dOE #1, #2, and #3) were obtained (Figure 1). To assess the contribution of AtPIP1;4 and AtPIP2;4 to plant growth, we evaluated the growth of rosette leaves in Arabidopsis plants. The growth of the plants was observed and photographed at 3, 4, and 6 weeks after sowing. Compared with wild-type plants (WT), rosette leaf growth was reduced in both atpip1;4 and atpip2;4 plants. Furthermore, the leaf growth of atpip1;4atpip2;4 #19, #25, and #38 were even more severely inhibited than that of the single mutants (Figure 1 and Figure S1). In contrast, the rosette leaves of AtPIP1;4OE and AtPIP2;4OE were larger than wild-type plants, respectively. Similarly, AtPIP1;4AtPIP2;4dOE plants had larger leaves than AtPIP1;4OE and AtPIP2;4OE (Figure 1 and Figure S1).
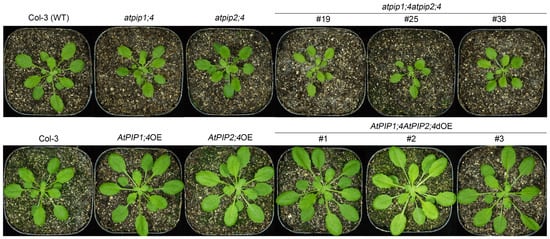
Figure 1.
Both AtPIP1;4 and AtPIP2;4 contribute to plant growth. Photographs were taken of 3-week-old Arabidopsis plants during their growth.
To further elucidate the relationship between AtPIP1;4 and AtPIP2;4 in regulating plant growth, we measured the fresh weight of 15-day-old plants. Compared with the WT plants, the fresh weight of atpip1;4 and atpip2;4 mutants significantly decreased, and significantly reduced further in atpip1;4atpip2;4 (Figure 2). Conversely, the fresh weights of AtPIP1;4OE and AtPIP2;4OE were significantly higher at 15 days (Figure 2). Additionally, the fresh weights of AtPIP1;4AtPIP2;4dOE showed an even more significant increase. These results indicate a synergistic effect on plant growth attributed to AtPIP1;4 and AtPIP2;4 in Arabidopsis.
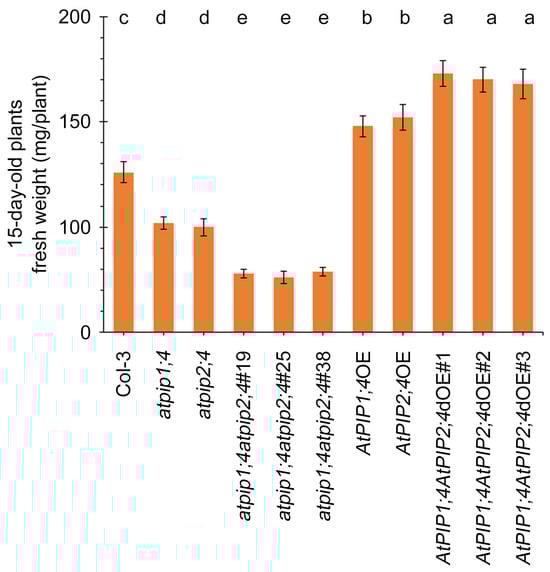
Figure 2.
AtPIP1;4 and AtPIP2;4 contribute to plant fresh weight. The fresh weight of 15-day-old plants. Data are shown as means ± SEM (n = 6). Lowercase letters indicate significant differences by one-way ANOVA and Duncan’s multiple range tests (at p ≤ 0.01).
2.2. AtPIP1;4 and AtPIP2;4 Are Concomitant Channels for H2O2 Transport from Apoplast to Cytoplasm
To clarify how AtPIP1;4 and AtPIP2;4 function in transporting H2O2, we assayed the translocation of externally applied H2O2 to the cytoplasm. H2O2 was applied externally to plant leaves, and H2O2 content in the apoplast and cytoplasm were monitored by using the H2O2-specific fluorescent probe. We utilized the H2O2 probes 2′,7′-dichlorofluorescin (H2DCF) and Amplex Red (AR), which are able to penetrate the membranes and react with cytoplasmic H2O2 to produce intense fluorescence, thus enabling the detection of cytoplasmic H2O2 in living cells [9,42]. Additionally, the Amplex Ultra Red (AUR) probe cannot penetrate the membranes; therefore, it is employed to detect apoplastic H2O2 [42]. These probes have been widely used to detect the translocation of H2O2 [9,10,11,29,43].
We examined the intracellular accumulation of H2O2 in leaves of different plant types, including the WT, atpip1;4, atpip2;4, atpip1;4atpip2;4, AtPIP1;4OE, AtPIP2;4OE, and AtPIP1;4AtPIP2;4dOE plants. These plants were externally treated with an aqueous solution of 0.2 mM of H2O2 and pure water as a control (Figure 3 and Figure S3). After 45 min, apoplast and cytoplasm H2O2 were monitored using confocal laser scanning microscopy (CLSM). In WT plants, the majority of externally applied H2O2 enters the cytoplasm, while a small portion remains in the apoplast. Compared with the WT plants, atpip1;4 and atpip2;4 mutants showed a significant decrease in cytoplasmic H2O2 content and a significant increase in apoplastic H2O2 content. In the double mutant atpip1;4atpip2;4, there was a notable increase in H2O2 content in the apoplast, while a significant decrease in cytoplasmic H2O2 was observed, compared to the WT plants or the single mutants atpip1;4 or atpip2;4. Conversely, the cytoplasmic H2O2 in AtPIP1;4OE and AtPIP2;4OE were significantly higher than in the WT plants. Moreover, the AtPIP1;4AtPIP2;4dOE exhibited an even higher concentration of cytoplasmic H2O2 compared to AtPIP1;4OE and AtPIP2;4OE. In contrast, compared to WT plants, AtPIP1;4OE and AtPIP2;4OE showed markedly reduced apoplastic H2O2 content, with even lower levels observed in AtPIP1;4AtPIP2;4dOE (Figure 3). In control groups treated with H2O, all plant types displayed very low levels of H2O2 in their leaves (Figure S2).
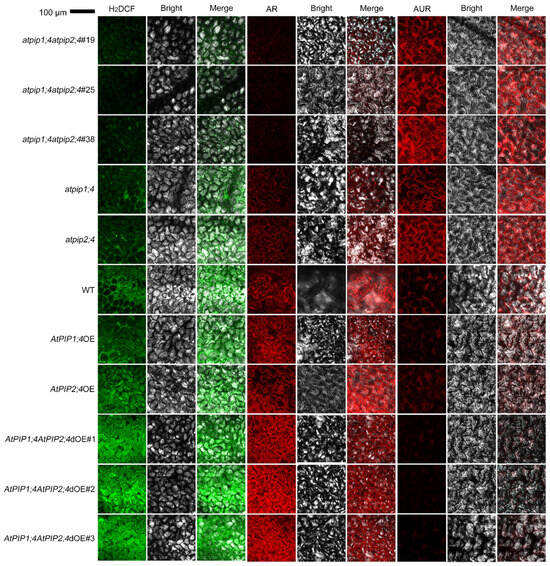
Figure 3.
AtPIP1;4 and AtPIP2;4 collaborate to transport H2O2 from apoplast to cytoplasm in Arabidopsis. LSCM images showing H2DCF- and AUR-probed apoplastic H2O2 and AR-probed cytoplasmic H2O2 in leaves of the Arabidopsis. The plants, 45 min before LSCM, had been treated with 0.2 mM H2O2.
We quantify the fluorescence density, and used this parameter to evaluate the cytoplasmic H2O2 content detected by AR and H2DCF (Figure 4B,C), the apoplastic H2O2 content detected by AUR (Figure 4A). The differences in apoplastic and cytoplasmic H2O2 content in different plants are significant. Compared to WT plants, the loss-of-function mutants atpip1;4 and atpip2;4 exhibited an increase of 28% and 37% in apoplastic H2O2 content, while their cytoplasmic H2O2 contents decreased by 48% and 38%, respectively (Figure 4A,B). Conversely, the overexpression of AtPIP1;4 and AtPIP2;4 led to a decrease in apoplastic H2O2 content by 38% and 23%, and an increase in cytoplasmic H2O2 content by 32% and 27%, respectively (Figure 4A,B). Further investigation revealed that in comparison with WT plants, the apoplastic H2O2 content in the atpip1;4atpip2;4#19, atpip1;4atpip2;4#25, and atpip1;4atpip2;4#38 mutants increased by 66%, 65%, and 65%, respectively (Figure 4A), compared with WT plants, while their cytoplasmic H2O2 content decreased by 74%, 77%, and 79% (Figure 4B). In contrast, the apoplastic H2O2 content in AtPIP1;4AtPIP2;4dOE#1, AtPIP1;4AtPIP2;4dOE#2, and AtPIP1;4AtPIP2;4dOE#3 were reduced by 65%, 59%, and 67%, respectively (Figure 4A), compared with WT plants, while their cytoplasmic H2O2 content increased by 62%, 63%, and 63%, respectively (Figure 4B). These results indicate that both AtPIP1;4 and AtPIP2;4 can mediate H2O2 transport, with AtPIP1;4 having a stronger transport capacity.
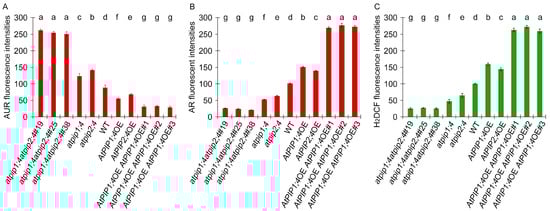
Figure 4.
AtPIP1;4 and AtPIP2;4 govern H2O2 translocation in plants. (A–C) The plants, 45 min before LSCM, had been treated with 0.2 mM H2O2. The fluorescence density was quantitatively analyzed using the ImageJ software (ImageJ-v1.8.0.112). (A) Assessment of apoplastic H2O2 content detected by AUR. (B) Assessment of cytoplasmic H2O2 content detected by AR. (C) Assessment of cytoplasmic H2O2 content detected by H2DCF. (A–C) Data are shown as means ± SD (n = 9). Lowercase letters indicate significant differences by one-way ANOVA and Duncan’s multiple range tests (p < 0.05).
To analyze the dynamics of H2O2 transport, plant leaves were treated with 0.2 mM H2O2 or H2O, and the cytoplasmic H2O2 concentration was quantified by a microplate reader (Figure 5). Within 60 min after the application of H2O2, a large amount of H2O2 quickly entered the cytoplasm of plants overexpressing single or both AtPIP1;4 and AtPIP2;4 genes. However, the translocation of H2O2 was significantly reduced in the AtPIP1;4 and AtPIP2;4 single or double mutant plants. At 60 min, compared to the WT plants, the cytoplasmic H2O2 levels increased by 39.6% and 37.3% in AtPIP1;4OE and AtPIP2;4OE, respectively. Meanwhile, the cytoplasmic H2O2 levels increased by 58.7%, 69.2%, and 60.4% in AtPIP1;4AtPIP2;4dOE#1, AtPIP1;4AtPIP2;4dOE#2, AtPIP1;4AtPIP2;4dOE#3 plants, respectively. In contrast, the cytoplasmic H2O2 levels decreased by 76.8%, 75.4%, and 76.4% in atpip1;4atpip2;4#19, atpip1;4atpip2;4#25, and atpip1;4atpip2;4#38 plants, respectively (Figure 5). Plants treated with water showed no significant difference in translocated H2O2 within 60 min (Figure 5). In addition, we detected the superoxide dismutase (SOD) activity in all plants, confirming that the increase in cytoplasmic H2O2 levels was a result of externally applied H2O2 translocation (Figure S3). These results suggest that AtPIP1;4 and AtPIP2;4 both facilitate the translocation of H2O2 from the apoplast to the cytoplasm, and they are concomitant channels for H2O2 transport.
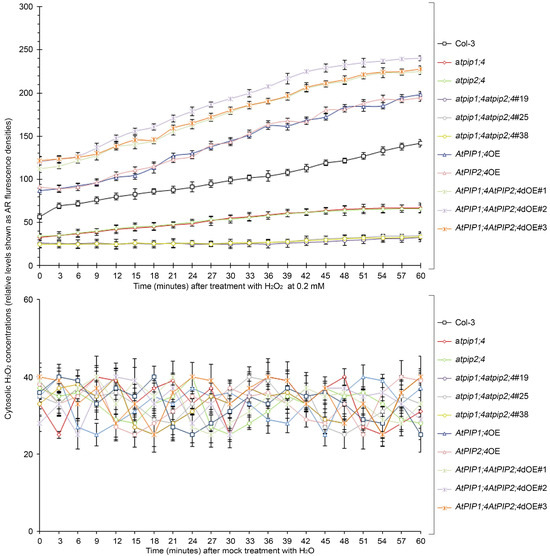
Figure 5.
AtPIP1;4 and AtPIP2;4 are concomitant channels for H2O2 transport. Chronological changes in the H2O2-probing AR fluorescence densities in leaves of 2-week-old plant seedlings after 0.2 Mm H2O2 or H2O treatment (means ± SEM, n = 9).
2.3. AtPIP1;4 and AtPIP2;4 Synergize in Mediating the Cytosolic Import of Apoplastic H2O2 Induce by Bacterial Infection
DC3000, a Pseudomonas syringae pv. tomato strain known for its pathogenicity on Arabidopsis thaliana, was used for the bacterial inoculation experiments. This strain is widely utilized in plant–pathogen interaction studies due to its ability to elicit strong immune responses in Arabidopsis, making it an ideal candidate for our investigation into H2O2 transport and plant immunity [9,44]. To clarify whether AtPIP1;4 and AtPIP2;4 transport H2O2 in the process of plant resistance to bacterial infection, plant leaves were inoculated with DC3000 for leaf infiltration, and the accumulation of cytoplasmic H2O2 within 60 min was monitored with an AR probe. Compared with mock infiltration (inoculation with MgCl2 solution) (Figure 6B,D), DC3000 significantly induced the accumulation of cytoplasmic H2O2 in leaves (Figure 6A,C). The superoxide dismutase (SOD) activity was similar in all plant leaves, confirming that the increase in cytoplasmic H2O2 was indeed caused by the apoplastic H2O2 translocation induced by DC3000 (Figure S4).
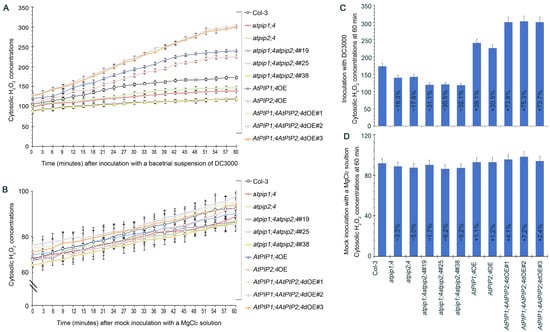
Figure 6.
AtPIP1;4 and AtPIP2;4 synergize in the transport of H2O2 induced by bacterial infection. (A) Chronological changes in the H2O2-probing AR fluorescence densities in leaves of 2-week-old plant seedlings after DC3000 treatment. (B) Chronological changes in the H2O2-probing AR fluorescence densities in leaves of 2-week-old plant seedlings after MgCl2 solution treatment. (C,D) Inoculation with DC3000 or MgCl2 and the cytosolic H2O2 accumulation at 60 min. The percentages shown in the graph represent the relative values of each plant line compared to the wild-type. (A–D) Data are shown as means ± SEM (n = 9).
Starting from 15 min, the cytoplasmic H2O2 content in AtPIP1;4OE, AtPIP2;4OE, and AtPIP1;4AtPIP2;4dOE plants were significantly higher than in WT plants, whereas the cytoplasmic H2O2 accumulation in AtPIP1;4 and AtPIP2;4 single or double gene mutant plants were limited (Figure 6A). At 60 min, the cytoplasmic H2O2 content in AtPIP1;4OE and AtPIP2;4OE plants were 1.39-fold and 1.31-fold higher than in WT plants, respectively. The average H2O2 content in AtPIP1;4AtPIP2;4dOE plants was 1.74 times that of WT plants. Meanwhile, compared to WT plants, the cytoplasmic H2O2 content in atpip1;4 and atpip2;4 decreased by 19.3% and 17.8%, respectively. This reduction was further pronounced in atpip1;4atpip2;4, where the cytosolic H2O2 content was 31.2% lower than in WT plants (Figure 6C). These results suggest that AtPIP1;4 and AtPIP2;4 synergistically mediate the cytosolic import of apoplastic H2O2 induced by bacterial infection.
2.4. AtPIP1;4 and AtPIP2;4 Synergize in Enhancing Plant Resistance to Bacterial Infection
H2O2 serves as a critical signaling molecule in plant immune responses. We have confirmed that AtPIP1;4 and AtPIP2;4 synergistically facilitate the entry of H2O2 into the cytoplasm from the apoplast (Figure 4, Figure 5 and Figure 6), which led us to investigate their contribution to plant immunity. Callose, a widely distributed β-1,3-glucan in plants, and is closely related to H2O2 and has become a popular model system for quantifying plant immunity [9,10,11,45,46]. After 24 h of DC3000 treatment, all plants exhibited callose deposition (Figure 7A). Among them, the callose deposition in AtPIP1;4AtPIP2;4dOE plants was the highest, averaging 3.05 times that of the WT plants. The callose deposition in AtPIP1;4OE and AtPIP2;4OE plants was 1.42 and 1.39 times that of the WT plants, respectively. Conversely, callose deposition in atpip1;4 and atpip2;4 mutants were limited to 46.3% and 43.0% of the WT plants, respectively. Furthermore, atpip1;4atpip2;4 displayed the lowest callose deposition, averaging only 25.9% of WT plants (Figure 7A,B).
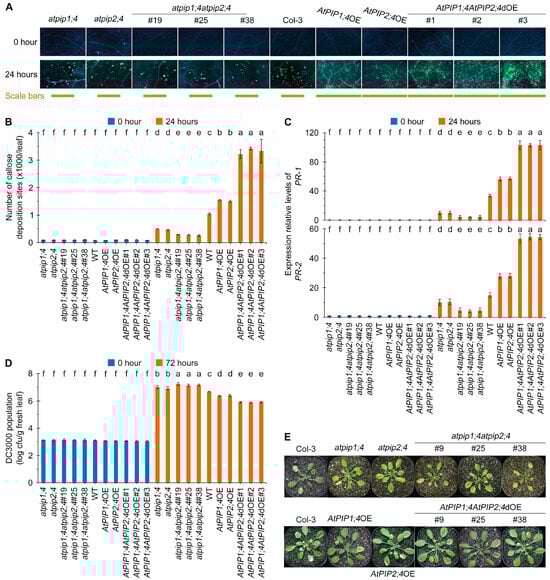
Figure 7.
AtPIP1;4 and AtPIP2;4 synergize in enhancing plant resistance to bacterial infection. (A) DC3000-induced callose deposition in Arabidopsis. The leaves of 3-week-old plant seedlings were treated with DC3000 for 0 h or 24 h and then stained by aniline blue. (B) Quantification of callose deposition from (A). Data are shown as means ± SEMs (n = 6). (C) Expression levels of pathogenesis-related genes PR1 and PR2 in plants inoculated with DC3000 for 24 h. (D,E) Evaluation of Pst DC3000 virulence based on bacterial populations in leaves 3 days after inoculation (dai) (D) and on leaf symptoms (E) at 9 dai. Data are shown as means ± SEMs (n = 6). (B–D) Lowercase letters indicate significant differences by one-way ANOVA and Duncan’s multiple range tests (p < 0.05).
To clarify how AtPIP1;4 and AtPIP2;4 enhance plant immunity, we also detected the expression of the basic defense genes PR1 and PR2 after DC3000 treatment (Figure 7C,D). Compared with WT plants, both AtPIP1;4OE and AtPIP2;4OE showed significantly upregulated expression of PR1 and PR2 after bacterial infection. Moreover, the AtPIP1;4AtPIP2;4dOE plants had an even higher level of defense gene expression compared to AtPIP1;4OE and AtPIP2;4OE plants. Conversely, compared with WT plants, the expression of defense genes in atpip1;4 and atpip2;4 plants were significantly inhibited. Further investigation revealed that the expression of PR1 and PR2 in atpip1;4atpip2;4 plants was the lowest (Figure 7C,D).
We assessed the contribution of AtPIP1;4 and AtPIP2;4 to pathogenic bacterial resistance. Compared with WT plants, atpip1;4 and atpip2;4 mutants showed higher DC3000 bacterial proliferation, and the leaf discoloration and disease severity of atpip1;4atpip2;4 mutant plants were significantly increased (Figure 7D,E). Statistical analysis indicated that the DC3000 bacterial population and leaf spot disease severity was significantly lower in AtPIP1;4OE and AtPIP2;4OE plants compared to WT plants. Notably, the AtPIP1;4AtPIP2;4dOE had the least bacterial population and leaf spot disease among all tested plants (Figure 7D,E). In other words, plant resistance to pathogenic bacteria was weakened by AtPIP1;4 and AtPIP2;4 mutations, strengthened by AtPIP1;4 and AtPIP2;4 overexpression, and further weakened and strengthened by the double mutants and double overexpression. These results suggest that AtPIP1;4 and AtPIP2;4 synergize in enhancing plant resistance to bacterial infection.
2.5. AtPIP1;4 and AtPIP2;4 Synergize in Intensifying PTI
To investigate the effects of AtPIP1;4 and AtPIP2;4 on plant immunity, we first measured the callose deposition in leaves of WT, atpip1;4, atpip2;4, atpip1;4atpip2;4, AtPIP1;4OE, AtPIP2;4OE, and AtPIP1;4AtPIP2;4dOE plants treated with flg22 and Chitin (well-known fungal pathogen-associated molecular pattern, PAMP). Callose deposition at the site of plant cell wall infection is a typical PTI response, which can mitigate the invasion of pathogens [45,47]. Compared with WT, the callose deposition in atpip1;4 and atpip2;4 leaves decreased by 50.7% and 50.1%, respectively, while the callose deposition in atpip1;4atpip2;4#19, atpip1;4atpip2;4#25, and atpip1;4atpip2;4#38 plant leaves decreased by 86.0%, 87.5%, and 86.1%, respectively, after 24 h of treatment with 10 μM flg22. In contrast, compared with WT, the callose deposition in AtPIP1;4OE and AtPIP2;4OE leaves increased by 63.8% and 64.2%, respectively. The callose deposition in leaves of AtPIP1;4AtPIP2;4dOE plants further increased, with a 203.3%, 198.5%, and 203.9% increase in callose deposition in AtPIP1;4AtPIP2;4dOE#1, AtPIP1;4AtPIP2;4dOE#2, and AtPIP1;4AtPIP2;4dOE#3 leaves, respectively (Figure 8A,B). Similar results were obtained with treatment of 0.1 mg/mL chitin; compared with WT, callose deposition increased due to the overexpression of AtPIP1;4 and AtPIP2;4, and decreased due to the functional loss of AtPIP1;4 and AtPIP2;4. Furthermore, the callose deposition further increased or decreased due to the double overexpression or functional loss of AtPIP1;4 and AtPIP2;4 (Figure 8A,B).
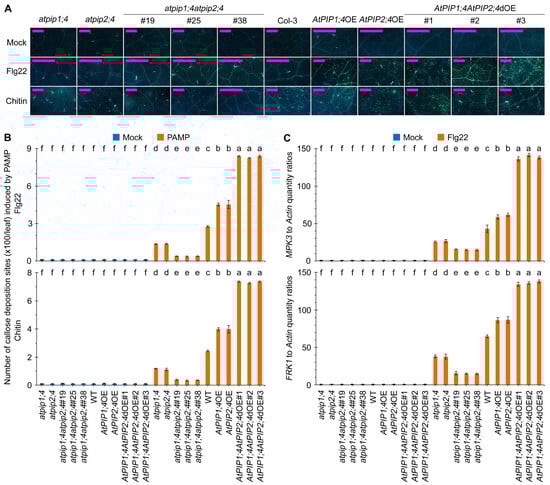
Figure 8.
AtPIP1;4 and AtPIP2;4 synergize in intensifying PTI. (A) Flg22- and chitin- induced callose deposition in Arabidopsis. The leaves of 3-week-old plant seedlings were treated with 10 μM flg22 and 10 μM chitin for 16 hours and then stained by aniline blue. (B) Quantification of callose deposition from (A). Data are shown as means ± SEM (n = 6). (C) Expression levels of PTI-related genes MPK3 and FRK1 expression levels in plants treated with flg22 for 60 min; plants were treated with water (mock), an aqueous solution of 10 μM flg22 and then used in the qRT-PCR assays. Data are shown as means ± SEM (n = 6). (B,C) Lowercase letters indicate significant differences by one-way ANOVA and Duncan’s multiple range tests (p < 0.05).
Flg22 and chitin activate the expression of MPK3 and FRK1, which serve as positive regulators of the PTI defense response [9,44,48]. Both PAMPs can effectively induce the expression of MPK3 and FRK1 in WT plants. Compared with WT plants, the induction of MPK3 and FRK1 expression by two PAMPs was significantly suppressed in atpip1;4 and atpip2;4 plants, with further inhibition observed in atpip1;4atpip2;4 plants (Figure 8C,D and Figure S5). Conversely, compared with WT plants, the expression levels of MPK3 and FRK1 are significantly elevated in AtPIP1;4OE and AtPIP2;4OE, and further increased in AtPIP1;4AtPIP2;4dOE plants after 24 h of flg22 and chitin treatment (Figure 8C,D and Figure S5). These results indicate that AtPIP1;4 and AtPIP2;4 synergistically regulate the PTI pathway.
3. Discussion
AQPs were initially defined as water transport channels, but it has been demonstrated that they can also mediate the transport of many other substrates [12,14,18]. H2O2 is an important immune signaling molecule, and members of the PIP family in plants have been proven to mediate H2O2 transport [8,9,10,11]. In plants, PIP family is divided into PIP1 and PIP2 subfamilies based on the conservation of their sequences, with 13 members comprising the PIP family in Arabidopsis [49,50]. Our previous research has shown that members of the Arabidopsis PIP1 family, such as AtPIP1;4, can enhance photosynthesis by promoting CO2 transport, and they can facilitate the transport of apoplastic H2O2 generated by pathogens or induced by flg22 into the cytoplasm, thereby enhancing plant disease resistance [9,51]. However, AtPIP1;4 may not be the sole facilitator of H2O2 transmembrane transport; it is possible that members of the PIP2 also play a synergistic role [9,41]. This is an important topic for exploring whether PIP1 and PIP2 redundantly coordinate the transport of H2O2 to regulate plant growth and immunity.
Our study finds that AtPIP1;4 and AtPIP2;4 regulate plant growth, which is similar to earlier reports [51,52]. Some plant PIPs have been proven to be efficient CO2 transport channels, capable of promoting CO2 transport to enhance photosynthesis, thereby facilitating growth and grain yield [11,15,25]. We have also identified the important role of AtPIP1;4 in plant growth in our previous research, where AtPIP1;4 interacts with the Hpa1 to enhance CO2 transport, net photosynthetic rate, and mesophyll conductance, thereby promoting plant growth [51]. However, it is still unclear whether other PIPs cooperate with AtPIP1;4 to regulate plant growth and disease resistance. This study explores the functions of AtPIP1;4 and AtPIP2;4 in these processes. We examined not only the independent roles of AtPIP1;4 and AtPIP2;4, but also used statistical methods to assess potential functional synergy between them, further highlighting their significance in plant growth and disease resistance. The investigation began with analyzing the impact of AtPIP1;4 and AtPIP2;4 on plant growth regulation. We compared the growth and fresh weight of WT, atpip1;4, atpip2;4, atpip1;4atpip2;4, AtPIP1;4OE, AtPIP2;4OE, and atpip1;4atpip2;4dOE plants, confirming that both AtPIP1;4 and AtPIP2;4 are positive regulators of plant growth and that they synergistically regulate the fresh weight of the plants (Figure 1 and Figure 2). These results strongly suggest the importance of AtPIP1;4 and AtPIP2;4 in plant growth.
H2O2 is the second messenger that mediates downstream immune reactions and plays a crucial role in regulating plant immune responses [1,2,3,53]. Our research demonstrates that AtPIP1;4 and AtPIP2;4 are concomitant channels for H2O2 transport, and they synergistically regulate plant growth and disease resistance (Figure 1, Figure 2, Figure 3, Figure 4, Figure 5, Figure 6 and Figure 7). H2O2 has been proven to be a substrate of AQPs, with many PIPs demonstrated to transport H2O2 in plants [8,9,10,11,29,43]. However, there is currently no evidence indicating whether PIPs work together in transporting H2O2. We have shown in previous studies that AtPIP1;4 can mediate H2O2 transmembrane transport, but H2O2 ectopic reduction was not completely eliminated in the AtPIP1;4 mutant, indicating that there may be other PIPs in Arabidopsis that transport H2O2 together with AtPIP1;4 [9]. We used a fluorescence probe of H2O2 to examine the translocation of exogenously applied H2O2 to the cytoplasm. Compared with WT plants, the cytoplasmic H2O2 content significantly increased in AtPIP1;4 and AtPIP2;4 overexpression lines, and the double overexpression lines of AtPIP1;4 and AtPIP2;4 had an even higher cytoplasmic H2O2 content (Figure 3, Figure 4 and Figure 5). These collective findings demonstrate that AtPIP1;4 and AtPIP2;4 are common channels for the translocation of H2O2 from the apoplast to the cytoplasm.
In our previous study, we found that AtPIP1;4 acts as an immune-related facilitator in Arabidopsis, responsible for transporting H2O2 from the apoplast to the cytoplasm, leading to the activation of PTI and SAR, and resulting in plant resistance to pathogens [9]. In this study, we confirmed that AtPIP1;4 and AtPIP2;4 work together to transport pathogen-induced apoplastic H2O2 into the cytoplasm, and there is no significant difference in H2O2 production among different strains (Figure 6 and Figure S4). This indicates that AtPIP1;4 and AtPIP2;4 do not affect H2O2 production, but regulate plant defense by transporting H2O2, which is similar to earlier reports [9,10,11]. The entry of apoplastic H2O2 into the cell acts as a signaling molecule to activate downstream immune responses, such as callose deposition and defense gene expression. The apoplastic H2O2 into the cytoplasm acts as a signaling molecule to activate downstream immune responses, such as callose deposition and defense gene expression [53,54]. As expected, compared with WT plants, AtPIP1;4 and AtPIP2;4 overexpression lines showed stronger resistance to DC3000, and the double overexpression line of AtPIP1;4 and AtPIP2;4 exhibited the strongest resistance to the pathogen among all tested plants (Figure 7D,E). This suggests that the roles of AtPIP1;4 and AtPIP2;4 in plant immunity may be overlapping. We observed enhanced callose deposition in the AtPIP1;4OE and AtPIP2;4OE, which was further enhanced in AtPIP1;4AtPIP2;4dOE plants (Figure 7A,B). Compared with WT plants, the expression of PR1 and PR2 was significantly higher in AtPIP1;4OE and AtPIP2;4OE lines, and even higher in the AtPIP1;4 and AtPIP2;4 double overexpression line (Figure 7C). We also demonstrated that AtPIP1;4 and AtPIP2;4 are essential for the typical PAMP-triggered PTI activation (Figure 8). Compared with WT plants, flg22 and chitin-induced callose deposition was significantly suppressed in atpip1;4atpip2;4 plants, and the expression of PTI marker genes MPK3 and FRK1 could not be properly induced in atpip1;4atpip2;4 (Figure 8 and Figure S5). This indicates that flg22 and chitin-induced PTI responses require the cooperation of AtPIP1;4 and AtPIP2;4. In summary, our results strongly support that AtPIP1;4 and AtPIP2;4 work together to transport apoplastic H2O2 into the cytoplasm to regulate plant growth and disease resistance.
4. Conclusions
In summary, we have demonstrated that AtPIP1;4 and AtPIP2;4 function synergistically as concomitant channels for H2O2 transport, playing a pivotal role in both plant growth and the enhancement of disease resistance. Through the comparative analysis of growth phenotypes of wild-type, single and double mutants, and overexpressing lines, we found that AtPIP1;4 and AtPIP2;4 are positive regulators of plant growth. Furthermore, our findings elucidate the dual role of AtPIP1;4 and AtPIP2;4 in mediating H2O2 translocation from the apoplast to the cytoplasm, leading to increased callose deposition and enhanced defense gene expression to strengthen plant immunity. Future studies should focus on the detailed molecular mechanisms by which AtPIP1;4 and AtPIP2;4 interact with other components of the H2O2 signaling pathway, as well as their potential roles in response to abiotic stresses. This research highlights the significance of aquaporins in plant physiological and pathological processes, paving the way for future developments in agricultural biotechnology.
5. Materials and Methods
5.1. Plant Material and Growth Conditions
The Arabidopsis ecotypes atpip1;4, atpip2;4, ATPIP1;4OE, and ATPIP2;4OE were generated in the previously described Col-3 background [9,51]. The atpip1;4atpip2;4 and ATPIP1;4ATPIP2;4dOE hybrid lines were generated in the HD laboratory and used for this study as F3 self-fertilized homozygotes. All gene constructs were sequenced to ensure their correctness. The primers used in this study are provided in Table S1. Seeds were germinated in plastic trays filled with nutrient soil and vermiculite (1:3). A total of 5 days later, the germinated seedlings were transferred to pots with the same substrate. Seed germination and plant growth were carried out in a growth chamber under 23 °C, 250 μM quanta/m2/s illumination, and an 8 h light/16 h dark photoperiod.
5.2. Bacterial Infection and Disease Assessment
Bacterial inoculation was performed on 30-day-old plants without any treatment. The Pst DC3000 inoculum was prepared as an aqueous bacterial suspension, adjusted to an optical density of 0.05 at 600 nm, with a final concentration of 10 mM MgCl2. The inoculum and mock control (10 mM MgCl2) were amended with 0.03% v/v Silwet L-77 and applied to the plants by spraying on the top of the plants. The bacterial count in plant leaves was measured at 72 h to assess the extent of DC3000 infection. At 9 dai, the extent of leaf chlorosis and necrosis symptoms were recorded by photographing the leaves. Differences in leaf DC3000 counts and the extent of leaf bacterial populations and symptom severity among different plant genotypes were used to assess the impact of AtPIP1;4 and AtPIP2;4 on immunity levels [9,44].
5.3. Plant Treatment
Aqueous solutions of 0.2 mM H2O2, 1 μM flg22 aqueous solution, and 0.1 mg/mL chitin solution were mixed with 0.03% v/v Silwet L-77. Each solution was individually sprayed on the top of 30-day-old plants. The top one-third of fully expanded leaves on the plants were used for H2O2 transport, callose deposition, and qRT-PCR.
5.4. H2O2 Transport Assay
The H2O2 transport assay was performed following the previously described method [9]. Briefly, plant leaves were infiltrated with 100 μM H2DCF, AR, or AUR dyes. Leaf samples were taken, avoiding the incision site, and observed under a CLSM. The fluorescence of H2DCF was captured using an excitation filter of 460–490 nm and an emission filter of 525 nm. The excitation filter and emission wavelengths for AR and AUR were 543 nm and 585–610 nm. The fluorescence densities in leaf discs were quantified with a SpectraMax M5 96-microplate luminometer (Molecular Devices, Silicon Valley, San Jose, CA, USA) to estimate relative levels of intracellular H2O2.
5.5. Callose Deposition Assay
Leaves were immersed in a solution consisting of 10 mL of phenol, glycerol, lactic acid, water, and 95% ethanol (1:1:1:1:1:2 v/v) for decolorization until the leaves became transparent. The leaves were then stained with aniline blue for 4 h in the dark. Leaf samples were observed under UV light at a wavelength of 340–380 nm using a Nikon microscope (Tokyo, Japan).
5.6. Gene Expression Analysis
Total RNA from leaves was extracted using the RNA-easy Isolation Reagent Kit (Vazyme, R701-01, Nanjing, China). Reverse transcription was performed on 1 μg of total RNA using the HiScript QRT Super Mix (Vazyme, R123-01, Nanjing, China). AtActin gene was used as the internal control gene, and qRT-PCR was carried out in a 20 µL reaction using ChamQ SYBR qPCR Master Mix (Vazyme, Q711, Nanjing, China). The primers for all qRT-PCR are listed in Table S1. The reactions were conducted on the Quant Studio 3 Real-Time PCR System (Applied Biosystems, Waltham, MA, USA) with the following conditions: 95 °C for 30 s, followed by 40 cycles of 95 °C for 10 s, 60 °C for 30 s, then 95 °C for 15 s, 60 °C for 1 min, and again 95 °C for 15 s to obtain the melting curve. The expression levels of each test gene relative to the constitutively expressed AtActin reference gene were determined by the 2−ΔΔCt method [55].
5.7. SOD Activity Analysis
The SOD activity in the leaves was determined using the SOD Assay Kit (Beyotime S0103, Shanghai, China). Briefly, 0.2 g of leaves were harvested, ground into powder in liquid nitrogen, and resuspended in phosphate buffer. The suspension was centrifuged at 12,000× g for 5 min at 4 °C, and the supernatant was collected for measuring the SOD activity in the leaves.
5.8. Statistical Analysis
Quantitative data were analyzed using Student’s t-test or analysis of variance (ANOVA), followed by Duncan’s multiple range test, with GraphPad Prism 8.0.2 (https://www.graphpad.com/), accessed on 2 March 2023. The number of experimental replicates is specified in the figure legends.
Supplementary Materials
The following supporting information can be downloaded at https://www.mdpi.com/article/10.3390/plants13071018/s1, Figure S1: Both AtPIP1;4 and AtPIP2;4 contribute to plant growth; Figure S2: AtPIP1;4 and AtPIP2;4 collaborate to transport H2O2 from apoplast to cytoplasm in Arabidopsis; Figure S3: Superoxide dismutase activities in plants treated with H2O2; Figure S4: Superoxide dismutase activities in plants treated with DC3000; Figure S5: AtPIP1;4 and AtPIP2;4 synergize in intensifying PTI. Table S1: Information on genes tested and primers used in this study.
Author Contributions
X.Y. and Y.M. performed the experiments and analyzed the data. L.Z., L.C., S.Z. and X.C. contributed to the data analyses and the manuscript revision. K.L. and H.D. conceived the project and designed the experiments. K.L. wrote the paper. All authors have read and agreed to the published version of the manuscript.
Funding
The Natural Science Foundation of China (31772247, 32170202, 32370210, 32302374), the Major Science and Technology Innovation Project of Shandong Province (2019JZZY020608), Special Funds for First-Class Construction of Shandong Agricultural University (539156), and the Natural Science Foundation of Shandong Province (ZR2023QC118) supported this study. The authors confirm that the funding bodies did not contribute to the research design, data collection and analysis, or manuscript preparation.
Data Availability Statement
The datasets supporting the conclusions of this article are included within the article and Supplementary Materials.
Acknowledgments
We thank HD lab members for assistance in the experiments.
Conflicts of Interest
Author Yanjie Mu was employed by the company Qingdao King Agroot Crop Science. The remaining authors declare that the research was conducted in the absence of any commercial or financial relationships that could be construed as a potential conflict of interest.
References
- Mittler, R.; Vanderauwera, S.; Gollery, M.; Van Breusegem, F. Reactive oxygen gene network of plants. Trends Plant Sci. 2004, 9, 490–498. [Google Scholar] [CrossRef] [PubMed]
- Torres, M.A. ROS in biotic interactions. Physiol. Plant 2010, 138, 414–429. [Google Scholar] [CrossRef] [PubMed]
- Torres, M.A.; Jones, J.D.; Dangl, J.L. Reactive oxygen species signaling in response to pathogens. Plant Physiol. 2006, 141, 373–378. [Google Scholar] [CrossRef] [PubMed]
- Li, G.; Chen, T.; Zhang, Z.; Li, B.; Tian, S. Roles of aquaporins in plant-pathogen interaction. Plants 2020, 9, 1134. [Google Scholar] [CrossRef] [PubMed]
- Ryder, L.S.; Dagdas, Y.F.; Kershaw, M.J.; Venkataraman, C.; Madzvamuse, A.; Yan, X.; Cruz-Mireles, N.; Soanes, D.M.; Oses-Ruiz, M.; Styles, V.; et al. A sensor kinase controls turgor-driven plant infection by the rice blast fungus. Nature 2019, 574, 423–427. [Google Scholar] [CrossRef] [PubMed]
- Liu, Y.; He, C. Regulation of plant reactive oxygen species (ROS) in stress responses: Learning from AtRBOHD. Plant Cell Rep. 2016, 35, 995–1007. [Google Scholar] [CrossRef] [PubMed]
- Durrant, W.E.; Dong, X. Systemic acquired resistance. Annu. Rev. Phytopathol. 2004, 42, 185–209. [Google Scholar] [CrossRef]
- Rodrigues, O.; Reshetnyak, G.; Grondin, A.; Saijo, Y.; Leonhardt, N.; Maurel, C.; Verdoucq, L. Aquaporins facilitate hydrogen peroxide entry into guard cells to mediate ABA- and pathogen-triggered stomatal closure. Proc. Natl. Acad. Sci. USA 2017, 114, 9200–9205. [Google Scholar] [CrossRef]
- Tian, S.; Wang, X.; Li, P.; Wang, H.; Ji, H.; Xie, J.; Qiu, Q.; Shen, D.; Dong, H. Plant aquaporin AtPIP1;4 links apoplastic H2O2 Induction to disease immunity pathways. Plant Physiol. 2016, 171, 1635–1650. [Google Scholar] [CrossRef]
- Zhang, M.; Shi, H.; Li, N.; Wei, N.; Tian, Y.; Peng, J.; Chen, X.; Zhang, L.; Zhang, M.; Dong, H. Aquaporin OsPIP2;2 links the H2O2 signal and a membrane-anchored transcription factor to promote plant defense. Plant Physiol. 2022, 188, 2325–2341. [Google Scholar] [CrossRef]
- Lu, K.; Chen, X.C.; Yao, X.H.; An, Y.Y.; Wang, X.; Qin, L.N.; Li, X.X.; Wang, Z.D.; Liu, S.; Sun, Z.M.; et al. Phosphorylation of a wheat aquaporin at two sites enhances both plant growth and defense. Mol. Plant 2022, 15, 1772–1789. [Google Scholar] [CrossRef] [PubMed]
- Preston, G.M.; Agre, P. Isolation of the cDNA for erythrocyte integral membrane protein of 28 kilodaltons: Member of an ancient channel family. Proc. Natl. Acad. Sci. USA 1991, 88, 11110–11114. [Google Scholar] [CrossRef] [PubMed]
- Nakhoul, N.L.; Davis, B.A.; Romero, M.F.; Boron, W.F. Effect of expressing the water channel aquaporin-1 on the CO2 permeability of Xenopus oocytes. Am. J. Physiol. 1998, 274, C543–C548. [Google Scholar] [CrossRef] [PubMed]
- Uehlein, N.; Lovisolo, C.; Siefritz, F.; Kaldenhoff, R. The tobacco aquaporin NtAQP1 is a membrane CO2 pore with physiological functions. Nature 2003, 425, 734–737. [Google Scholar] [CrossRef] [PubMed]
- Chen, X.; Ma, J.; Wang, X.; Lu, K.; Liu, Y.; Zhang, L.; Peng, J.; Chen, L.; Yang, M.; Li, Y.; et al. Functional modulation of an aquaporin to intensify photosynthesis and abrogate bacterial virulence in rice. Plant J. 2021, 108, 330–346. [Google Scholar] [CrossRef] [PubMed]
- Loque, D.; Ludewig, U.; Yuan, L.; von Wiren, N. Tonoplast intrinsic proteins AtTIP2;1 and AtTIP2;3 facilitate NH3 transport into the vacuole. Plant Physiol. 2005, 137, 671–680. [Google Scholar] [CrossRef] [PubMed]
- Yusupov, M.; Razzokov, J.; Cordeiro, R.M.; Bogaerts, A. Transport of reactive oxygen and nitrogen species across aquaporin: A molecular level picture. Oxid. Med. Cell Longev. 2019, 2019, 2930504. [Google Scholar] [CrossRef] [PubMed]
- Quiroga, G.; Erice, G.; Aroca, R.; Delgado-Huertas, A.; Ruiz-Lozano, J.M. Elucidating the possible involvement of maize aquaporins and arbuscular mycorrhizal symbiosis in the plant ammonium and urea transport under drought stress conditions. Plants 2020, 9, 148. [Google Scholar] [CrossRef] [PubMed]
- Ma, J.F.; Yamaji, N. Silicon uptake and accumulation in higher plants. Trends Plant Sci. 2006, 11, 392–397. [Google Scholar] [CrossRef]
- Brown, D. The Discovery of Water Channels (Aquaporins). Ann. Nutr. Metab. 2017, 70 (Suppl. S1), 37–42. [Google Scholar] [CrossRef]
- Zhang, L.; Chen, L.; Dong, H. Plant aquaporins in infection by and immunity against pathogens—A critical review. Front. Plant Sci. 2019, 10, 632. [Google Scholar] [CrossRef] [PubMed]
- Su, W.; Cao, R.; Zhang, X.Y.; Guan, Y. Aquaporins in the kidney: Physiology and pathophysiology. Am. J. Physiol. Renal. Physiol. 2020, 318, F193–F203. [Google Scholar] [CrossRef]
- Kitchen, P.; Salman, M.M.; Halsey, A.M.; Clarke-Bland, C.; MacDonald, J.A.; Ishida, H.; Vogel, H.J.; Almutiri, S.; Logan, A.; Kreida, S.; et al. Targeting aquaporin-4 subcellular localization to treat central nervous system edema. Cell 2020, 181, 784–799.e19. [Google Scholar] [CrossRef] [PubMed]
- Thiagarajah, J.R.; Chang, J.; Goettel, J.A.; Verkman, A.S.; Lencer, W.I. Aquaporin-3 mediates hydrogen peroxide-dependent responses to environmental stress in colonic epithelia. Proc. Natl. Acad. Sci. USA 2017, 114, 568–573. [Google Scholar] [CrossRef] [PubMed]
- Xu, F.; Wang, K.; Yuan, W.; Xu, W.; Shuang, L.; Kronzucker, H.J.; Chen, G.; Miao, R.; Zhang, M.; Ding, M.; et al. Overexpression of rice aquaporin OsPIP1;2 improves yield by enhancing mesophyll CO2 conductance and phloem sucrose transport. J. Exp. Bot. 2019, 70, 671–681. [Google Scholar] [CrossRef] [PubMed]
- Hachez, C.; Veselov, D.; Ye, Q.; Reinhardt, H.; Knipfer, T.; Fricke, W.; Chaumont, F. Short-term control of maize cell and root water permeability through plasma membrane aquaporin isoforms. Plant Cell Environ. 2012, 35, 185–198. [Google Scholar] [CrossRef] [PubMed]
- Ding, L.; Milhiet, T.; Couvreur, V.; Nelissen, H.; Meziane, A.; Parent, B.; Aesaert, S.; Van Lijsebettens, M.; Inze, D.; Tardieu, F.; et al. Modification of the expression of the aquaporin ZmPIP2;5 affects water relations and plant growth. Plant Physiol. 2020, 182, 2154–2165. [Google Scholar] [CrossRef] [PubMed]
- Ding, L.; Milhiet, T.; Parent, B.; Meziane, A.; Tardieu, F.; Chaumont, F. The plasma membrane aquaporin ZmPIP2;5 enhances the sensitivity of stomatal closure to water deficit. Plant Cell Environ. 2022, 45, 1146–1156. [Google Scholar] [CrossRef] [PubMed]
- Wang, X.; Lu, K.; Yao, X.; Zhang, L.; Wang, F.; Wu, D.; Peng, J.; Chen, X.; Du, J.; Wei, J.; et al. The aquaporin TaPIP2;10 confers resistance to two fungal diseases in wheat. Phytopathology 2021, 111, 2317–2331. [Google Scholar] [CrossRef]
- Chaumont, F.; Barrieu, F.; Wojcik, E.; Chrispeels, M.J.; Jung, R. Aquaporins constitute a large and highly divergent protein family in maize. Plant Physiol. 2001, 125, 1206–1215. [Google Scholar] [CrossRef]
- Afzal, Z.; Howton, T.C.; Sun, Y.; Mukhtar, M.S. The roles of aquaporins in plant stress responses. J. Dev. Biol. 2016, 4, 9. [Google Scholar] [CrossRef] [PubMed]
- Yaneff, A.; Vitali, V.; Amodeo, G. PIP1 aquaporins: Intrinsic water channels or PIP2 aquaporin modulators? FEBS. Lett. 2015, 589, 3508–3515. [Google Scholar] [CrossRef] [PubMed]
- Suga, S.; Maeshima, M. Water channel activity of radish plasma membrane aquaporins heterologously expressed in yeast and their modification by site-directed mutagenesis. Plant Cell Physiol. 2004, 45, 823–830. [Google Scholar] [CrossRef] [PubMed]
- Ding, X.; Iwasaki, I.; Kitagawa, Y. Overexpression of a lily PIP1 gene in tobacco increased the osmotic water permeability of leaf cells. Plant Cell Environ. 2004, 27, 177–186. [Google Scholar] [CrossRef]
- Otto, B.; Uehlein, N.; Sdorra, S.; Fischer, M.; Ayaz, M.; Belastegui-Macadam, X.; Heckwolf, M.; Lachnit, M.; Pede, N.; Priem, N.; et al. Aquaporin tetramer composition modifies the function of tobacco aquaporins. J. Biol. Chem. 2010, 285, 31253–31260. [Google Scholar] [CrossRef] [PubMed]
- Gaspar, M. Cloning and characterization of ZmPIP1-5b, an aquaporin transporting water and urea. Plant Sci. 2003, 165, 21–31. [Google Scholar] [CrossRef]
- Tornroth-Horsefield, S.; Wang, Y.; Hedfalk, K.; Johanson, U.; Karlsson, M.; Tajkhorshid, E.; Neutze, R.; Kjellbom, P. Structural mechanism of plant aquaporin gating. Nature 2006, 439, 688–694. [Google Scholar] [CrossRef] [PubMed]
- Li, X.; Wang, X.; Yang, Y.; Li, R.; He, Q.; Fang, X.; Luu, D.T.; Maurel, C.; Lin, J. Single-molecule analysis of PIP2;1 dynamics and partitioning reveals multiple modes of Arabidopsis plasma membrane aquaporin regulation. Plant Cell 2011, 23, 3780–3797. [Google Scholar] [CrossRef] [PubMed]
- Shibasaka, M.; Horie, T.; Katsuhara, M. Mechanisms activating latent functions of pip aquaporin water channels via the interaction between PIP1 and PIP2 proteins. Plant Cell Physiol. 2021, 62, 92–99. [Google Scholar] [CrossRef]
- Fetter, K.; Van Wilder, V.; Moshelion, M.; Chaumont, F. Interactions between plasma membrane aquaporins modulate their water channel activity. Plant Cell 2004, 16, 215–228. [Google Scholar] [CrossRef]
- Wang, H.; Zhang, L.; Tao, Y.; Wang, Z.; Shen, D.; Dong, H. Transmembrane helices 2 and 3 determine the localization of plasma membrane intrinsic proteins in eukaryotic cells. Front. Plant Sci. 2019, 10, 1671. [Google Scholar] [CrossRef] [PubMed]
- Ashtamker, C.; Kiss, V.; Sagi, M.; Davydov, O.; Fluhr, R. Diverse subcellular locations of cryptogein-induced reactive oxygen species production in tobacco Bright Yellow-2 cells. Plant Physiol. 2007, 143, 1817–1826. [Google Scholar] [CrossRef] [PubMed]
- Wang, Y.; Yue, J.; Yang, N.; Zheng, C.; Zheng, Y.; Wu, X.; Yang, J.; Zhang, H.; Liu, L.; Ning, Y.; et al. An ERAD-related ubiquitin-conjugating enzyme boosts broad-spectrum disease resistance and yield in rice. Nat. Food 2023, 4, 774–787. [Google Scholar] [CrossRef] [PubMed]
- Wang, Z.; Li, X.; Yao, X.; Ma, J.; Lu, K.; An, Y.; Sun, Z.; Wang, Q.; Zhou, M.; Qin, L.; et al. MYB44 regulates PTI by promoting the expression of EIN2 and MPK3/6 in Arabidopsis. Plant Commun. 2023, 4, 100628. [Google Scholar] [CrossRef] [PubMed]
- Luna, E.; Pastor, V.; Robert, J.; Flors, V.; Mauch-Mani, B.; Ton, J. Callose deposition: A multifaceted plant defense response. Mol. Plant-Microbe Interact. 2011, 24, 183–193. [Google Scholar] [CrossRef] [PubMed]
- Wang, Y.; Li, X.; Fan, B.; Zhu, C.; Chen, Z. Regulation and function of defense-related callose deposition in plants. Int. J. Mol. Sci. 2021, 22, 2393. [Google Scholar] [CrossRef] [PubMed]
- Ellinger, D.; Voigt, C.A. Callose biosynthesis in Arabidopsis with a focus on pathogen response: What we have learned within the last decade. Ann. Bot. 2014, 114, 1349–1358. [Google Scholar] [CrossRef] [PubMed]
- Hu, L.; Kvitko, B.H.; Severns, P.M.; Yang, L. Shoot maturation strengthens FLS2-mediated resistance to Pseudomonas syringae. Mol. Plant Microbe Interact. 2023, 36, 796–804. [Google Scholar] [CrossRef] [PubMed]
- Abascal, F.; Irisarri, I.; Zardoya, R. Diversity and evolution of membrane intrinsic proteins. Biochim. Biophys. Acta 2014, 1840, 1468–1481. [Google Scholar] [CrossRef]
- Groszmann, M.; De Rosa, A.; Chen, W.; Qiu, J.; McGaughey, S.A.; Byrt, C.S.; Evans, J.R. A high-throughput yeast approach to characterize aquaporin permeabilities: Profiling the Arabidopsis PIP aquaporin sub-family. Front. Plant Sci. 2023, 14, 1078220. [Google Scholar] [CrossRef]
- Li, L.; Wang, H.; Gago, J.; Cui, H.; Qian, Z.; Kodama, N.; Ji, H.; Tian, S.; Shen, D.; Chen, Y.; et al. Harpin Hpa1 interacts with aquaporin PIP1;4 to promote the substrate transport and photosynthesis in Arabidopsis. Sci. Rep. 2015, 5, 17207. [Google Scholar] [CrossRef] [PubMed]
- Israel, D.; Lee, S.H.; Robson, T.M.; Zwiazek, J.J. Plasma membrane aquaporins of the PIP1 and PIP2 subfamilies facilitate hydrogen peroxide diffusion into plant roots. BMC Plant Biol. 2022, 22, 566. [Google Scholar] [CrossRef] [PubMed]
- Wu, B.; Qi, F.; Liang, Y. Fuels for ROS signaling in plant immunity. Trends Plant Sci. 2023, 28, 1124–1131. [Google Scholar] [CrossRef] [PubMed]
- Hu, K.; Cao, J.; Zhang, J.; Xia, F.; Ke, Y.; Zhang, H.; Xie, W.; Liu, H.; Cui, Y.; Cao, Y.; et al. Improvement of multiple agronomic traits by a disease resistance gene via cell wall reinforcement. Nat. Plants 2017, 3, 17009. [Google Scholar] [CrossRef]
- Livak, K.J.; Schmittgen, T.D. Analysis of relative gene expression data using real-time quantitative PCR and the 2(-Delta Delta C(T)) Method. Methods 2001, 25, 402–408. [Google Scholar] [CrossRef]
Disclaimer/Publisher’s Note: The statements, opinions and data contained in all publications are solely those of the individual author(s) and contributor(s) and not of MDPI and/or the editor(s). MDPI and/or the editor(s) disclaim responsibility for any injury to people or property resulting from any ideas, methods, instructions or products referred to in the content. |
© 2024 by the authors. Licensee MDPI, Basel, Switzerland. This article is an open access article distributed under the terms and conditions of the Creative Commons Attribution (CC BY) license (https://creativecommons.org/licenses/by/4.0/).