Abstract
Amid urbanization, studying leaf functional traits of woody plants in urban environments is essential for understanding how urban green spaces function and how they can be effectively managed sustainably. In this study, we investigated the effects of different growing conditions on the morpho-physiological traits of Populus laurifolia and Ulmus pumila across five contrasting urban sites. The leaf area (LA), leaf length (LL), leaf width (LW), leaf biomass (LB), specific leaf area (SLA), leaf chlorophyll concentration, chlorophyll fluorescence parameters, leaf water potential at predawn (Ψpd) and midday (Ψmd), leaf performance index (PIabs), and phenotypic plasticity index (PPI) were compared across five contrasting urban sites. The soil chemical and physical properties were also compared between sites. There were significant differences in soil physicochemical characteristics between sites. We found significant effects of site on most of the morpho-physiological traits measured, except for Ψmd. The leaf chlorophyll concentration of P. laurifolia and U. pumila varied significantly between sites. The Ψpd was significantly different between years and sites. In U. pumila, the mean PPI for morphological traits (0.20) was lower than that for physiological traits (0.21). In conclusion, we revealed significant variations in the morpho-physiological traits of P. laurifolia and U. pumila across the five urban sites. Hence, long-term, large-scale studies are recommended to examine how diverse species respond to different urban growing conditions and to include other ecologically important plant traits for a better understanding of urban trees in a changing environment.
1. Introduction
The trend of urbanization is rapidly increasing, with more than half of the world’s population today now living in urban areas [1]. As cities continue to expand, the presence of urban green spaces (e.g., parks, gardens, and street trees) becomes even more critical in ensuring urban sustainability and development [2]. Urban spaces provide numerous ecological, environmental, and cultural benefits to both the environment and the well-being of urban populations [3]. They not only provide a place for recreation and relaxation, but they also serve as habitats for a variety of plant and animal species and play an important role in controlling air quality, temperature, noise pollution, and general biodiversity in metropolitan areas [4,5]. Trees also enhance the value of properties in the cities, capture stormwater runoff, and reduce the energy required for cooling buildings during periods of high temperatures [6]. However, urban trees’ capacity to remove pollutants from the urban atmosphere largely depends on species traits (e.g., leaf area) [7]. Moreover, trees must possess physiological tolerance or phenotypic plasticity in their functional traits in order to survive and thrive in urban environments over the long term [8]. Hence, studying leaf functional traits (e.g., leaf size, shape, thickness, and chlorophyll content) of woody plants in urban green space environments is essential for understanding how these green spaces function and how they can be effectively managed and maintained sustainably. This kind of study can also help us determine tree species that are potentially more resilient to stresses that are commonly present in urban environments.
Leaf functional traits of plants are the important bridge between plants and their environments, which can directly reflect the plant survival and adaptive strategies to the environment [9]. Plant morphological and physiological processes are extremely sensitive to environmental changes [10,11]. In particular, leaf shape and size correlate strongly with environmental conditions (e.g., temperature) from local to global scales [12,13]. The shape index, area, and thickness of leaves directly reflect a plant’s trade-off strategies in response to environmental stresses [14]. Plant functional traits (morphological, physiological, and phenological features), which are important indicators of plant growth and ecosystem dynamics, serve as a link between plants and environments. These traits determine a plant’s ability to acquire, use, and preserve resources in a particular environment [15]. For instance, Specific Leaf Area (SLA) is evident in the survival strategies that plants have developed to effectively deal with environmental fluctuations and optimize carbon assimilation [16].
Plant growth conditions of urban trees in most cities are deteriorating due to increasing urbanization rates and environmental stressors, such as water stress, high temperature, and increased ozone concentration [17]. Studies have demonstrated significant declines in the maximum photochemical quantum efficiency (Fv/Fm) and chlorophyll content of the different tree species in urban green spaces when ozone concentration and water shortage increase [18,19]. Dry air, high temperature, and soil conditions in cities or areas with comparable environmental conditions strongly affected stomatal conductance, water-use efficiency (WUE), and leaf water potential (Ψpd, Ψmd) of woody trees [20,21]. Some tree species have strategies to cope with heat and drought stresses by decreasing Ψmd and WUE [22]. However, considering Mongolia’s high temperature variations among seasons, information about the response of leaf functional traits of woody plants in Ulaanbaatar remains sparse to date.
Mongolia’s capital city, Ulaanbaatar, covers a total land area of 470,445.06 hectares. In 2017, the land use in the city was categorized into six different types, with agricultural land accounting for 50.20%, built-up areas for 14.78%, and forested areas for 15.75% of the urban land [23]. Ulaanbaatar is growing rapidly, with the human population reaching over 1.5 million in 2021, according to the National Statistics Committee [24]. This population growth coincides with an increase in urban green spaces in the capital city, which started in 2013. Many plants have been planted in various green spaces in the built-up areas of Ulaanbaatar. The dominant trees and shrubs planted in urban green zones are Salicaceae Lindl (7.79%), Ulmaceae Mirb (48.14%), and Leguminosae Juss (24.74%) [25]. Specifically, Populus laurifolia and Ulmus pumila have been widely planted in urban areas of Ulaanbaatar for a long time because of their high adaptability to poor environments, such as drought and degraded soil [26]. Populus species are considered pioneer species because of their fast growth rates and ability to inhabit large ranges [27]. Contrarily, U. pumila has a slow growth rate but is known for its high drought resistance, which stems from its natural habitat in the Mongolian desert [28].
Consequently, examining how their leaf functional traits respond to the urban environment will provide us with science-based insights into their adaptive mechanisms for coping with the harsh physical conditions in Ulaanbaatar.
In this study, we investigated the effects of different growing conditions on the morpho-physiological traits of P. laurifolia and U. pumila across five contrasting urban sites. It is hypothesized that there are significant variations in the morpho-physiological traits of P. laurifolia and U. pumila across five urban sites because of contrasting plant traits and study sites’ soil physicochemical characteristics.
2. Results
2.1. Environmental Conditions
Soil chemical and physical properties were different among study sites, particularly at 20 cm soil depth. The dominant type of soil was sandy loam at all sites, indicating comparable values at all sites. The average pH ranges from 7.55–8.02, indicating slightly alkaline soil conditions across sites. Elements such as calcium, magnesium, potassium, and organic matter, which are the major elements of soil nutrients, had high values in the BE site. Soil calcium carbonate contents were similar across different sites (Table 1; Table S1).

Table 1.
Soil physicochemical properties of the contrasting study sites in Ulaanbaatar, Mongolia. Values represent the mean of soil depth (n = 3 ± SE). Different lowercase letters indicate significant differences across the treatments at α = 0.05.
2.2. Leaf Morpho-Physiological Traits
The interaction between study sites and leaf morphological traits was significant (p < 0.0001) in both species (Table S2). We found significant site effects on most of the morpho-physiological traits measured, except for the Ψmd (Table S2).
The SLA, LL (p < 0.01), and LW (p < 0.0001) were significantly different between the study years, and a reverse pattern was observed for LA and LB of P. laurifolia. The mean LA, LB, SLA, LW, and LL of P. laurifolia were significantly lower in the TA site than in other sites. In contrast, in BE site, they were higher (Figure 1A–E). The LB, LA, SLA, LW, and LL of P. laurifolia were also highly significant between the study sites. Specifically, the SLA and LA were lower in 2022 than in 2021 (Figure 1B,C).
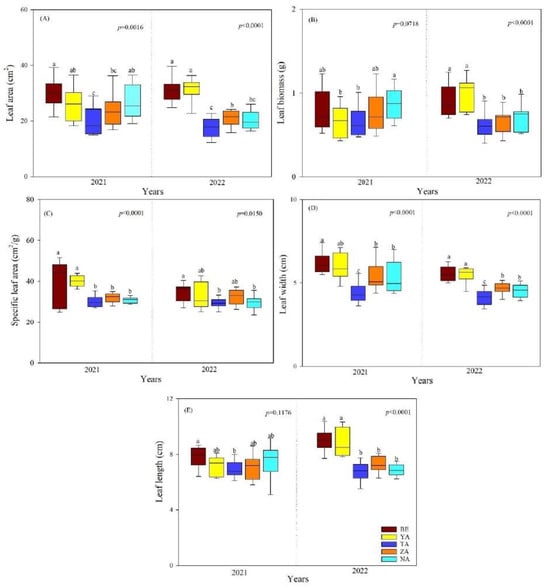
Figure 1.
Leaf morphological traits of P. laurifolia across different urban study sites (BE-Beejin, YA-Yavuu, TA-Tasgan, ZA-Zanabazar, NA-Naadamchid) in Ulaanbaatar, Mongolia. Different lowercase letters indicate significant differences between study sites within the same year. (A) leaf area (LA); (B) leaf biomass (LB); (C) specific leaf area (SLA); (D) leaf width (LW); and (E) leaf length (LL).
For U. pumila, LA, LW, and LL did not differ significantly between years, but LB and SLA were significantly different (p < 0.05). Additionally, LA, LB, LW, and LL were strongly and significantly different between sites in 2021 but showed significant decreases in 2022. Both in 2021 and 2022, the SLA was significantly different between sites (p < 0.0001, Figure 2). The leaf morphological traits of U. pumila were significantly lower in the TA site than in other sites (Figure 2).
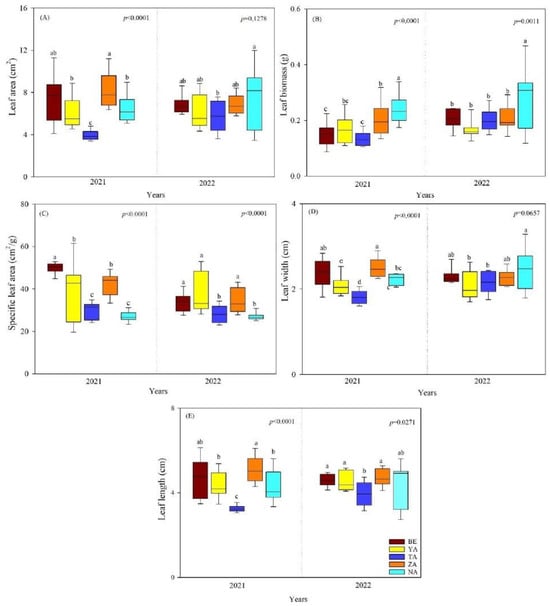
Figure 2.
The leaf morphological traits of U. pumila across different urban study sites (BE-Beejin, YA-Yavuu, TA-Tasgan, ZA-Zanabazar, NA-Naadamchid) in Ulaanbaatar, Mongolia. Different lowercase letters indicate significant differences between study areas within the same year. (A) Leaf area (LA); (B) leaf biomass (LB); (C) specific leaf area (SLA); (D) leaf width (LW); and (E) leaf length (LL).
The leaf chlorophyll concentration of P. laurifolia and U. pumila ranged from 294.58 to 496.87 µmol m−2 and significantly varied between sites (p < 0.05, Table S1, Figure 3). The leaf chlorophyll concentration of both species differed significantly between sites only in 2021 (p < 0.05). Specifically, the leaf chlorophyll concentration of P. laurifolia at the ZA site was the highest, whereas U. pumila had a lower concentration. Contrarily, the leaf chlorophyll concentration of P. laurifolia growing in the BE site was the lowest.
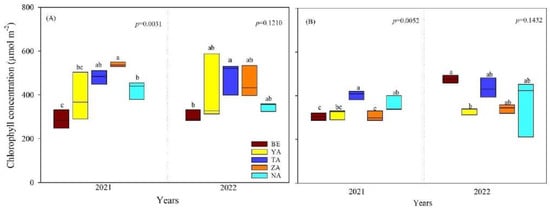
Figure 3.
Leaf chlorophyll concentration of P. laurifolia (A) and U. pumila (B) growing in different urban study sites in Ulaanbaatar, Mongolia. Different lowercase letters indicate significant differences among sites.
Table 2 shows an overview of the measured mean values of Fv/Fm and PIabs parameters. Overall, both Fv/Fm and PIabs tended to be slightly lower in 2022 compared to 2021 for both species, regardless of site.
Table 2.
Maximum quantum yield of photochemistry (Fv/Fm) and performance index (PIabs) measured from P. laurifolia and U. pumila across different study sites in Ulaanbaatar, Mongolia. Different lowercase letters indicate significant differences among study sites at α = 0.05.
In both species, the lowest declines in water potential detected in all sites were at 13:00 and 15:00 in 2019 and 2020, respectively (Figure 4). The trees in the study sites experienced water deficits at 09:00 and gradually recovered from these deficits after 17:00.
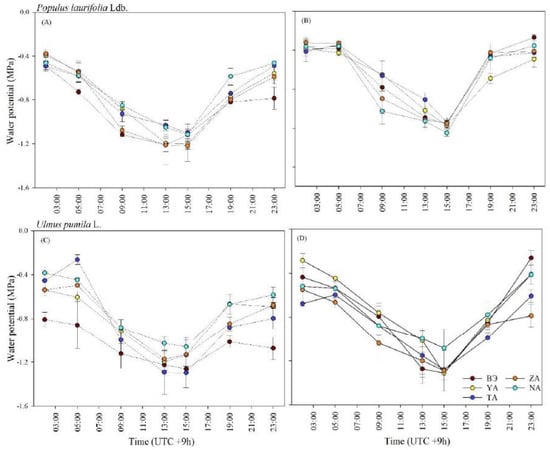
Figure 4.
Diurnal variation in leaf water potential of P. laurifolia (A,B) and U. pumila (C,D) growing in the urban study sites measured in July 2019 and 2020 in Ulaanbaatar, Mongolia. Vertical bars represent standard error.
In all species, the leaf predawn water potential (Ψpd) was significantly different between years (p < 0.01) and sites (p < 0.05, Table 3). The Ψpd of P. laurifolia leaves showed significant decreases in all sites in 2021 compared to 2022, but even in these cases, the value of Ψpd did not fall below −0.71 MPa. In TA, Ψpd and Ψmd decreased significantly in U. pumila in 2021 compared to 2022.
Table 3.
Mean predawn and midday leaf water potentials of P. laurifolia and U. pumila across contrasting study sites in Ulaanbaatar, Mongolia. Different letters indicate the significant differences in the mean values among study sites and research years for species at α = 0.05.
2.3. Phenotypic Plasticity Index of Morphological and Physiological Traits
In this study, we demonstrated that the morphological traits and the mean phenotypic plasticity index (PPI) of leaf biomass for all species were higher compared to other traits. Additionally, the physiological traits and performance index (PIabs) exhibited greater plasticity in both species (Table 4). They displayed different phenotypic plasticity responses across the study sites. In P. laurifolia, the mean PPI for morphological traits (0.21) and physiological traits (0.17) were similar. However, in U. pumila, the mean PPI for morphological traits (0.20) was lower than that for physiological traits (0.21).
Table 4.
Index of phenotypic plasticity (mean value of study years) of leaf morphological and physiological traits of P. laurifolia and U. pumila across contrasting study sites in Ulaanbaatar, Mongolia. Different letters indicate the significant differences in the mean values among study sites at α = 0.05.
3. Discussion
3.1. Variation in Leaf Morphological Traits across Different Urban Green Spaces
Environmental conditions directly and indirectly influence plant function by affecting various traits [29]. Trees were sensitive to the urban environment and adapted to the environmental changes by adjusting their leaf functional traits. Some studies have shown that leaf length, leaf width, and leaf area all increase with more shade, making their structure and function adapt to the changing environment [30,31]. In this study, the mean values of LA, LB, and SLA of P. laurifolia in study sites were BE > YA > NA > ZA > TA, and this result agrees with our hypothesis (i.e., there are significant variations in morphological traits of P. laurifolia across sites). The result can be explained by variations in environmental conditions. P. laurifolia trees growing in BE and YA have higher tree heights and thus have greater light access compared to those in the other sites, resulting in a competitive advantage for the species. In general, taller trees receive more sunlight exposure, which allows them to develop larger leaves and a wider canopy [32]. This can be supported by increased SLA since larger leaves have thinner leaves, making them more efficient at capturing light and conducting photosynthesis in changing light conditions [33]. Moreover, a higher LA, LB, and SLA of P. laurifolia can be due to a higher organic matter content in BE than in other sites. A higher organic matter content can result in increased LA and SLA due to the availability of essential macro and micronutrients, improved soil structure and moisture retention, and the promotion of root growth and development [34,35]. The P2O5 level, which is critical to leaf metabolic processes and growth [36], was also significantly higher in BE and YA sites. The availability of phosphorus in a particular area influences leaf expansion biomass accumulation and root development [37]. This can explain the observed significant effect of year (time) on the specific leaf area of P. laurifolia. Changes in SLA over years suggest that P. laurifolia adjusts its leaf growth in response to phosphorus levels.
In the case of U. pumila, most of the measured morphological traits were greater in ZA and lower in TA. Similarly, the U. pumila trees in ZA were 5% taller than those in the TA site, which explains their higher morphological traits. The ZA site also has 30% higher OM compared to TA. The richness of OM in ZA may have resulted in a high macronutrient supply (e.g., nitrogen) due to improved soil nutrient retention, which is important for leaf and overall plant growth development [38]. Higher OM in ZA may have also stimulated root growth due to enhanced soil structure, which may have supported better leaf expansion and growth.
Specific leaf area is an important plant functional trait, as it is an indicator of ecophysiological characteristics, such as relative growth rate, stress tolerance, and leaf longevity [39]. In urban environments, the urban heat island effect, drought, and heavy metal exposure tend to decrease SLA, while high-nutrient soils, increased light levels, and disturbances tend to increase SLA [40]. This further explains the observed lower SLA of both P. laurifolia and U. pumila in more exposed study sites (e.g., TA and NA). Soil in more exposed areas or with less tree cover may have low nutrient and organic matter content, causing trees to experience greater stress [15]. Trees in these areas may allocate less carbon to leaf production, thereby reducing leaf area and biomass [9]. SLA and LA have a significant relationship with soil fertility, as soil plays a fundamental role in the performance of plant functional traits [41].
3.2. Variation in Leaf Physiological Traits and Phenotypic Plasticity Index across Contrasting Sites
Here, U. pumila also had a higher PPI for physiological traits than morphological traits, suggesting that the species exhibited more significant plasticity in its physiological responses than in its morphological characteristics across sites. The result further implies that while U. pumila can adjust to environmental stresses in the urban area, its leaf morphological traits are less responsive or less flexible. The higher PPI in U. pumila could allow the species to grow and survive in harsh conditions typical of urban environments. Specifically, our results demonstrate that U. pumila in the NA site had a higher average performance index (PIabs) than other sites, possibly indicating lower overall stress and higher photosynthetic capacity [42]. The results suggest that the prevailing environmental conditions at the NA site are favorable for the species. This can lead to more efficient physiological performance and efficiency in photosynthesis. Moreover, the chlorophyll fluorescence parameters and leaf traits of some species varied by site type [43]. In our study, we found that the chlorophyll concentration of U. pumila varied significantly between different sites. This variation also indicates that the species is highly responsive to changing environmental conditions, exemplifying its physiological plasticity.
Leaf water potential as a direct index can be used to indicate the water conditions and the drought stress degree of plants in urban environments [44]. In the present study, the declines in Ψ of the two tree species in all sites, particularly during the 13:00 to 15:00 time periods, suggest that both species were highly vulnerable to water stress during the warmest part of the day in the study sites [34,35]. Our results also found that Ψ of both species can be reversed to normal conditions, under which the species are expected to exhibit their regular physiological functions. This means that the species can effectively recover Ψ from diurnal water stress (e.g., increased transpiration rates, soil moisture deficits). This result was consistent with the result of our previous study [45]. Such a recovery can be made through various mechanisms, including stomatal regulation and increased root water uptake.
4. Materials and Methods
4.1. Tree Species and Study Sites
The study was in Ulaanbaatar (47°94′23.58″ N, 106°90′15.04″ E), which is the capital and the political, economic, and cultural center of Mongolia (Figure 5). It has a moist and cold summer and a harsh winter climate, with a mean annual temperature of −3.1–1.5 °C. The mean elevation of the city area is 1350 masl.
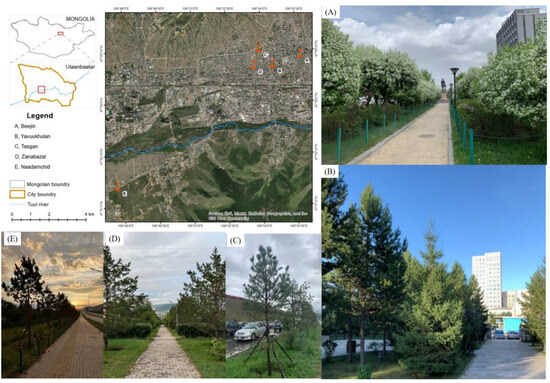
Figure 5.
Location of the five contrasting urban sites (background image from Google Earth) showing (A) Beejin, (B) Yavuu, (C) Tasgan, (D) Zanabazar, and (E) Naadamchid sites in Ulaanbaatar, Mongolia.
The mean annual precipitation is about 250 mm, with over 80% occurring from June to September. During growing seasons, the average air temperature and precipitation of growing seasons (May–September) in 2021–2022 were 13.0–13.7 °C and 51.8–52.6 mm, respectively (Figure 6). The precipitation in July of 2022 exceeded that of July 2021 (c.a., 10–15%). The 2021–2022 meteorological data were obtained from the nearest weather station [46], which is approximately five kilometers away from the study site. The mean non-frost period is 90–110 days [47]. Moreover, the study area is characterized by dark kastanozem soil [48,49] and mollic leptosols by international soil classification [50].
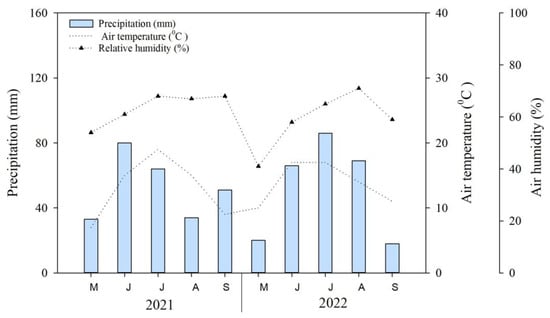
Figure 6.
Mean monthly air temperature (broken line), precipitation (bar), and air humidity (broken dotted line) in the study area in Ulaanbaatar, Mongolia (i.e., May–September 2021–2022).
Three subplots were established at each site, with an area of 10 m × 30 m and a distance of 5 m between plots. In this study, we selected two woody plants (P. laurifolia and U. pumila) in five sites (Table 5). In urban green areas in Ulaanbaatar, they are among the most common tree species due to their fast growth rate [51,52].
Table 5.
Characteristics of each urban site and tree species in Ulaanbaatar, Mongolia.
4.2. Soil Analysis
Soil analyses [53] were performed for each site before sampling and measuring plant morpho-physiological traits. Soil samples were taken to a depth of 0–20 cm (0–10 cm, 10–20 cm) at each urban site for the analysis of physicochemical properties (Table 1). The soil samples were air-dried, sieved through a 2 mm sieve, and stored at room temperature. Soil pH was determined on a 1:2.5 air-dried soil/distilled water mixture using a glass electrode pH meter [54]. Calcium carbonate content was determined by the volumetric method [55]. Available phosphorus (P2O5) was measured by molybdenum blue colorimetry after (NH4)2CO3 digestion [56]. Nitrate-nitrogen (NO2-N) was determined using a CH3COONa digestion and Spectro colorimetry. Potassium (K2O) was analyzed by flame spectrometry [57].
4.3. Leaf Morphology and Physiological Trait Analysis
The research was conducted over two growing seasons (2021 and 2022). For the measurement of leaf morpho-physiological traits, three mature and healthy individuals from each species were randomly selected from each site. All measurements were taken on clear days of the growing season. From three individuals of each species, twenty healthy and fully expanded leaves were chosen for measuring the leaf area (LA), leaf length (LL), leaf width (LW), leaf biomass (LB), and specific leaf area (SLA). Immediately after collection, the leaves were sealed in a plastic zip-lock bag and stored in a cold container to avoid water loss during transportation until further processing in the laboratory. The leaves were photo-scanned using an HP LaserJet scanner (M1132 MFP, ID, USA) with a 600 dpi resolution, and ImageJ v1.52 (National Institutes of Health, Bethesda, MD, USA) processing software was used to measure leaf morphological parameters following the procedure in Schneider et al. [58] and the modified procedure by Hernandez et al. [59].
The fresh weight of the leaves was weighed using a high-precision electronic scale (d = 0.001 g, Discovery Semi-Micro and Analytical Balance, Ohaus Corp., Nanikon, Switzerland), and they were dried at 80 °C for 48 h until they were a constant dry weight. The SLA was determined using the ratio of leaf area to leaf dry weight (SLA = LA (cm2)/LDM (g); [60]).
The Ψpd was measured before sunrise and Ψmd at solar noon following the procedures in Scholander et al. [61], and the Ψpd and Ψmd (MPa) were measured on healthy, fully expanded, and sun-exposed apical leaves using a pressure chamber (Model 1505D EXP, PMS Instrument Company, Albany, OR, USA) (c.a. 1.5 m above the ground). The leaf chlorophyll concentration was measured by an MC-100 chlorophyll concentration meter (Apogee Instruments, Inc., Logan, UT, USA) at midday [62].
In the assessment of chlorophyll fluorescence indicators, we focused on the values of Fv/Fm and PIabs physiological parameters measured on two species grown at five sites. Chlorophyll fluorescence measurements were performed using the Handy-PEA continuous excitation plant efficiency analyzer (Hansatech Instruments Ltd., King Lynn, UK) in 2021 and 2022. The leaf clips were applied to the leaves 20 min (i.e., based on our pilot experiments) before the measurements were taken to allow for dark adaptation. The light pulse intensity used was 3000 µmol m−2 s−1 for 1 s. The maximum quantum yield of PS II photochemistry Fv/Fm and performance index were calculated according to Guidi et al. [63]. Moreover, the leaf performance index (PIabs) of each species was determined in the present study. The performance index (PIabs) is a parameter thought to be sensitive to various types of stress. It is widely used to compare primary photochemical reactions [64].
4.4. Phenotypic Plasticity Index and Data and Statistical Analyses
Here, we made sure that all instruments used to measure all the parameters were calibrated against standardized references. Potential outliers were identified using boxplots and subsequently verified by cross-referencing the results with the original raw data. For all studied traits, a phenotypic plasticity index (PPI) was calculated using the following formula: PPI = (maximum mean value − minimum mean value)/(maximum mean value). The index varies from zero to one and allows comparisons among traits with different units [65]. The phenotypic plasticity index (PPI) is one of the important indicators that reflects the conservation and heritability of traits in the evolutionary process. The higher the value of the indicator, the stronger the adaptability of plants to the environment [31].
Before statistical analysis, we conducted the Shapiro–Wilk test to test whether our data follow a normal distribution. One-way analysis of variance (ANOVA) was employed to determine the effects of sites on the morpho-physiological traits measured for each species. To assess multiple comparisons among the treatments, Duncan’s multiple range test (DMRT) was used. All the statistical analyses were conducted by the Statistical Analysis Software (SAS, version 9.4) package [66].
5. Conclusions
The present study generally demonstrated that growing environment conditions in urban green spaces significantly influenced the leaf morpho-physiological functional traits of both P. laurifolia and U. pumila. In conclusion, we revealed significant variations in the morpho-physiological traits of P. laurifolia and U. pumila across the five urban sites. These variations reflect the effects of local environmental conditions in urban spaces in Mongolia. However, the limitations of the present study, such as a limited number of sites and only two tree species included, may have influenced the overall results and conclusions drawn. Other plant traits (e.g., wood traits), which are good indicators of a plant’s responses to urban environments, could also have a substantial influence on the results. Hence, long-term, large-scale studies are recommended to examine how diverse species respond to different urban growing conditions and to include other ecologically important plant traits for a better understanding of urban trees in a changing environment.
Supplementary Materials
The following supporting information can be downloaded at: https://www.mdpi.com/article/10.3390/plants13192709/s1, Table S1: Different soil physical and chemical properties of study sites; Table S2: Impact of site conditions on leaf functional traits of tree species.
Author Contributions
Conceptualization, B.N.-O. and O.B.; methodology, B.N.-O., O.B. and S.-O.B.; software and data analysis, S.-O.B.; data collection, O.B., A.B.-A. and T.N.-O.; writing—original draft preparation, O.B. and A.B.-A.; writing—review and editing, B.N.-O., S.-O.B. and J.O.H.; supervision, B.N.-O.; funding acquisition, B.N.-O. All authors have read and agreed to the published version of the manuscript.
Funding
This work was financially supported by the Mongolia–Korea Joint “Green Belt” Plantation Project by the Korea Forest Service.
Data Availability Statement
The data used are primarily reflected in the article. Other relevant data are available from the authors upon request.
Acknowledgments
We thank the members of the Laboratory of Forest Genetics and Ecophysiology, National University of Mongolia for their help in field survey and plant material collection.
Conflicts of Interest
The authors declare no conflict of interest.
References
- Kabisch, N.; Haase, D. Diversifying European agglomerations: Evidence of urban population trends for the 21st century. Popul. Space Place 2011, 17, 236–253. [Google Scholar] [CrossRef]
- Lisotova, E.; Suntsova, L.; Inshakov, E. State of woody vegetation in an urbanized environment (the example of Krasnoyarsk). IOP Conf. Ser. Earth Environ. Sci. 2021, 875, 012080. [Google Scholar] [CrossRef]
- Paudel, S.; States, S.L. Urban green spaces and sustainability: Exploring the ecosystem services and disservices of grassy lawns versus floral meadows. Urban For. Urban Green. 2023, 84, 127932. [Google Scholar] [CrossRef]
- Jaung, W.; Carrasco, L.R.; Shaikh, S.F.E.A.; Tan, P.Y.; Richards, D.R. Temperature and air pollution reductions by urban green spaces are highly valued in a tropical city-state. Urban For. Urban Green. 2020, 55, 126827. [Google Scholar] [CrossRef]
- Abhijith, K.V.; Kumar, P.; Gallagher, J.; McNabola, A.; Baldauf, R.; Pilla, F.; Broderick, B.; Di Sabatino, S.; Pulvirenti, B. Air pollution abatement performances of green infrastructure in open road and built-up street canyon environments—A review. Atmos. Environ. 2017, 162, 71–86. [Google Scholar] [CrossRef]
- Isaifan, R.J.; Baldauf, R.W. Estimating Economic and Environmental Benefits of Urban Trees in Desert Regions. Front. Ecol. Evol. 2020, 8, 16. [Google Scholar] [CrossRef]
- Sæbø, A.; Popek, R.; Nawrot, B.; Hanslin, H.M.; Gawronska, H.; Gawronski, S.W. Plant species differences in particulate matter accumulation on leaf surfaces. Sci. Total Environ. 2012, 427–428, 347–354. [Google Scholar] [CrossRef]
- Esperon-Rodriguez, M.; Rymer, P.D.; Power, S.A.; Challis, A.; Marchin, R.M.; Tjoelker, M.G. Functional adaptations and trait plasticity of urban trees along a climatic gradient. Urban For. Urban Green. 2020, 54, 126771. [Google Scholar] [CrossRef]
- Xiong, L.; Long, C.; Liao, Q.; Hue, F. Leaf functional traits and their interrelationships of woody plants in Karst forest of Maolan. China J. Appl. Environ. Biol. 2022, 27, 152–159. [Google Scholar]
- Bohora Schlickmann, M.; da Silva, A.C.; de Oliveira, L.M.; Oliveira Matteucci, D.; Domingos Machado, F.; Cuchi, T.; Duarte, E.; Higuchi, P. Specific leaf area is a potential indicator of tree species sensitive to future climate change in the mixed Subtropical Forests of southern Brazil. Ecol. Indic. 2020, 116, 106477. [Google Scholar] [CrossRef]
- Hernandez, J.O.; An, J.Y.; Combalicer, M.S.; Chun, J.P.; Oh, S.K.; Park, B.B. Morpho-Anatomical Traits and Soluble Sugar Concentration Largely Explain the Responses of Three Deciduous Tree Species to Progressive Water Stress. Front. Plant Sci. 2021, 12, 738301. [Google Scholar] [CrossRef] [PubMed]
- Royer, D.L.; Wilf, P. Why do toothed leaves correlate with cold climates? Gas exchange at leaf margins provides new insights into a classic paleotemperature proxy. Int. J. Plant Sci. 2006, 167, 11–18. [Google Scholar] [CrossRef]
- Royer, D.L.; Miller, I.M.; Peppe, D.J.; Hickey, L.J. Leaf economic traits from fossils support a weedy habit for early angiosperms. Am. J. Bot. 2010, 97, 438–445. [Google Scholar] [CrossRef] [PubMed]
- Klich, M.G. Leaf variations in Elaeagnus angustifolia related to environmental heterogeneity. Environ. Exp. Bot. 2000, 44, 171–183. [Google Scholar] [CrossRef]
- Cornelissen, J.H.C.; Lavorel, S.; Garnier, E.; Diaz, S.; Buchmann, N.; Gurvich, D.E.; Reich, P.B.; Ter Steege, H.; Morgan, H.D.; Van Der Heijden, M.G.A.; et al. A handbook of protocols for standardised and easy measurement of plant functional traits worldwide. Aust. J. Bot. 2003, 51, 335–380. [Google Scholar] [CrossRef]
- Wang, Z.; Huang, H.; Wang, H.; Peñuelas, J.; Sardans, J.; Niinemets, Ü.; Niklas, K.J.; Li, Y.; Xie, J.; Wright, I.J. Leaf water content contributes to global leaf trait relationships. Nat. Commun. 2022, 13, 5525. [Google Scholar] [CrossRef]
- Czaja, M.; Kołton, A.; Muras, P. The complex issue of urban trees-stress factor accumulation and ecological service possibilities. Forests 2020, 11, 932. [Google Scholar] [CrossRef]
- Percival, G.C.; Keary, I.P.; AL-Habsi, S. An assessment of the drought tolerance of Fraxinus genotypes for urban landscape plantings. Urban For. Urban Green. 2006, 5, 17–27. [Google Scholar] [CrossRef]
- Gao, Y.; Liu, Y.; Chen, B.; Tao, Y.; Cui, C.; Wen, Y.; Deng, W.; Chen, Q.; Yuan, X. Response of Fluorescence and Chlorophyll Physiological Characteristics of Typical Urban Trees to Ozone Stress. Atmosphere 2022, 13, 1885. [Google Scholar] [CrossRef]
- Urban, J.; Ingwers, M.; Mcguire, M.A.; Teskey, R.O.; Urban, J.; Ingwers, M.; Mcguire, M.A.; Teskey, R.O. Stomatal conductance increases with rising temperature. Plant Signal. Behav. 2017, 12, e1356534. [Google Scholar] [CrossRef]
- Petrík, P.; Petek-petrik, A.; Mukarram, M.; Schuldt, B.; Lamarque, L.J. Emerging voices in botany leaf physiological and morphological constraints of water-use efficiency in C3 plants. AoB Plants 2023, 15, plad047. [Google Scholar] [CrossRef] [PubMed]
- Gillner, S.; Korn, S.; Hofmann, M.; Roloff, A. Contrasting strategies for tree species to cope with heat and dry conditions at urban sites. Urban Ecosyst. 2017, 20, 853–865. [Google Scholar] [CrossRef]
- Sonomdagva, C. Environmental of Mongolian Cities; Dorjgotov, D., Ed.; NUM Press: Ulaanbaatar, Mongolia, 2019. [Google Scholar]
- IFRC. Climate Change Impacts on Health and Livelihoods: Mongolia Assessment; International Federation of Red cross and Red Crescent Societies: Ulaanbaatar, Mongolia, 2021. [Google Scholar]
- Chantsalnyam, N.; Otgonsaikhan, B.; Tsengel, B. Report of Study of Inventory Monitoring of Trees and Shrubs in the Capital’s Green Spaces; NUM Press: Ulaanbaatar, Mongolia, 2018. [Google Scholar]
- Chantsalnyam, D. Trees and Shrubs Grown in Botanical Gardens; Erdenejav, G., Ed.; Master Press: Ulaanbaatar, Mongolia, 2010. [Google Scholar]
- Barchet, G.L.H.; Dauwe, R.; Guy, R.D.; Schroeder, W.R.; Soolanayakanahally, R.Y.; Campbell, M.M.; Mansfield, S.D. Investigating the drought-stress response of hybrid poplar genotypes by metabolite profiling. Tree Physiol. 2014, 34, 1203–1219. [Google Scholar] [CrossRef] [PubMed]
- Hilbig, W. The Vegetation of Mongolia; SPB Academic Publishing: Amsterdam, The Netherlands, 1995; ISBN 90-5103106-8. [Google Scholar]
- Zirbel, C.R.; Bassett, T.; Grman, E.; Brudvig, L.A. Plant functional traits and environmental conditions shape community assembly and ecosystem functioning during restoration. J. Appl. Ecol. 2017, 54, 1070–1079. [Google Scholar] [CrossRef]
- Perrin, P.M.; Mitchell, F.J.G. Effects of shade on growth, biomass allocation and leaf morphology in European yew (Taxus baccata L.). Eur. J. For. Res. 2013, 132, 211–218. [Google Scholar] [CrossRef]
- Huang, R.; Tian, Q.; Zhang, Y.; Wu, Y.; Li, Z.; Tang, Z.; Zhou, A. Response of Leaf Functional Traits of Landscape Plants to Urban Green Space Environment in Lanzhou, China. Forests 2022, 13, 682. [Google Scholar] [CrossRef]
- Fiorucci, A.S.; Fankhauser, C. Plant Strategies for Enhancing Access to Sunlight. Curr. Biol. 2017, 27, R931–R940. [Google Scholar] [CrossRef]
- Liu, M.; Wang, Z.; Li, S.; Lü, X.; Wang, X.; Han, X. Changes in specific leaf area of dominant plants in temperate grasslands along a 2500-km transect in northern China. Sci. Rep. 2017, 7, 10780. [Google Scholar] [CrossRef]
- Ye, S.; Peng, B.; Liu, T. Effects of organic fertilizers on growth characteristics and fruit quality in Pear-jujube in the Loess Plateau. Sci. Rep. 2022, 12, 13372. [Google Scholar] [CrossRef]
- Huang, Y.; Jing, Y.; Bei, M.; Yang, H.; Cha, Z.; Lin, Q.; Luo, W. Short-term effects of organic amendments on soil fertility and root growth of rubber trees on Hainan Island, China. J. For. Res. 2020, 31, 2137–2144. [Google Scholar] [CrossRef]
- Khan, F.; Siddique, A.B.; Shabala, S.; Zhou, M.; Zhao, C. Phosphorus Plays Key Roles in Regulating Plants’ Physiological Responses to Abiotic Stresses. Plants 2023, 12, 2861. [Google Scholar] [CrossRef] [PubMed]
- Mollier, A.; Pellerin, S. Maize root system growth and development as influenced by phosphorus deficiency. J. Exp. Bot. 1999, 50, 487–497. [Google Scholar] [CrossRef]
- Gerke, J. The Central Role of Soil Organic Matter in Soil Fertility and Carbon Storage. Soil Syst. 2022, 6, 33. [Google Scholar] [CrossRef]
- Scheepens, J.F.; Frei, E.S.; Stöcklin, J. Genotypic and environmental variation in specific leaf area in a widespread Alpine plant after transplantation to different altitudes. Oecologia 2010, 164, 141–150. [Google Scholar] [CrossRef] [PubMed]
- Williams, N.S.G.; Hahs, A.K.; Vesk, P.A. Urbanisation, plant traits and the composition of urban floras. Perspect. Plant Ecol. Evol. Syst. 2015, 17, 78–86. [Google Scholar] [CrossRef]
- Borowy, D.; Swan, C.M. A Multi-Trait Comparison of an Urban Plant Species Pool Reveals the Importance of Intraspecific Trait Variation and Its Influence on Distinct Functional Responses to Soil Quality. Front. Ecol. Evol. 2020, 8, 68. [Google Scholar] [CrossRef]
- Poorter, H.; Niinemets, Ü.; Poorter, L.; Wright, I.J.; Villar, R. Causes and consequences of variation in leaf mass per area (LMA): A meta-analysis. New Phytol. 2009, 182, 565–588. [Google Scholar] [CrossRef]
- Sonti, N.F.; Hallett, R.A.; Griffin, K.L.; Trammell, T.L.E.; Sullivan, J.H. Chlorophyll fluorescence parameters, leaf traits and foliar chemistry of white oak and red maple trees in urban forest patches. Tree Physiol. 2021, 41, 269–279. [Google Scholar] [CrossRef]
- Grzesiak, M.T.; Grzesiak, S.; Skoczowski, A. Changes of leaf water potential and gas exchange during and after drought in triticale and maize genotypes differing in drought tolerance. Photosynthetica 2006, 44, 561–568. [Google Scholar] [CrossRef]
- Byambadorj, S.-O.; Park, B.B.; Hernandez, J.O.; Tsedensodnom, E.; Byambasuren, O.; Montagnoli, A.; Chiatante, D.; Nyam-osor, B. Effects of Irrigation and Fertilization on the Morphophysiological Traits of Populus sibirica Hort. Ex Tausch and Ulmus pumila L. in the Semiarid Steppe Region of Mongolia. Plants 2021, 10, 2407. [Google Scholar] [CrossRef]
- NAMEM The National Agency for Meteorology and Environmental Monitoring of Mongolia. Weather Data. Available online: http://namem.gov.mn/eng/?p=56 (accessed on 2 October 2020).
- Dorjgotov, D. National Atlas of Mongolia; Dorjgotov, D., Ed.; The Geography and Geoecology Institute: Ulaanbaatar, Mongolia, 2022. [Google Scholar]
- Oyunbat, P. Soil Pollution and Ways to Reduce Ulaanbaatar City; NUM Press: Ulan Bator, Mongolia, 2022. [Google Scholar]
- Batkhishig, O. Soil classification of Mongolia. J. Mong. Soil Sci. 2016, 1, 18–31. [Google Scholar]
- IUSS Working Group. World Reference Base for Soil Resources. International Soil Classification System for Naming Soils and Creating Legends for Soil Maps, 4th ed.; International Union of Soil Sciences: Vienna, Austria, 2022; Volume 4, ISBN 9798986245119. [Google Scholar]
- Dimitrova, A.; Balzano, A.; Tsedensodnom, E.; Byambadorj, S.-O.; Nyam-Osor, B.; Scippa, G.S.; Merela, M.; Chiatante, D.; Montagnoli, A. The adaptability of Ulmus pumila and the sensitivity of Populus sibirica to semi-arid steppe is reflected in the stem and root vascular cambium and anatomical wood traits. Front. Plant Sci. 2024, 15, 1393245. [Google Scholar] [CrossRef] [PubMed]
- Byambadorj, S.-O.; Chiatante, D.; Akhmadi, K.; Lunten, J.; Ochirbat, B.; Park, B.B.; Scippa, G.S.; Montagnoli, A.; Nyam-Osor, B. The effect of different watering regimes and fertilizer addition on the growth of tree species used to afforest the semi-arid steppe of Mongolia. Plant Biosyst. 2021, 155, 747–758. [Google Scholar] [CrossRef]
- ISO 11464; Soil Quality—Pretreatment of Samples for Physico-Chemical Analysis. International Standard: Vernier, Geneva, 2006.
- ISO 10390:2001; Soil Quality. Determination of pH. International Standard: Vernier, Geneva, 2001.
- ASTM D4373-96; Standard Test Method for Calcium Carbonate Content of Soils. ASTM International: West Conshohocken, PA, USA, 1996.
- MNS 3310:1991; The Soil. Methods of Determination of the Agrochemical Characteristics of Soil. Mongolian agency for standart metrology: Ulaanbaatar, Mongolia, 1991.
- SSIR Soil survey laboratory methods manual. In Soil Survey Investigations Report No.42; Burt, R., Ed.; USDA-NRCS: Lincoln, NE, USA, 2004; pp. 610–613. [Google Scholar]
- Schneider, C.A.; Rasband, W.S.; Eliceiri, K.W. NIH Image to ImageJ: 25 years of image analysis. Nat. Methods 2012, 9, 671–675. [Google Scholar] [CrossRef]
- Hernandez, J.O.; Maldia, L.S.; Pulan, D.E.; Buot, I.E.; Park, B.B. Leaf architecture and petiole anatomy of Philippine Dipterocarpus species (Dipterocarpaceae). Bangladesh J. Plant Taxon. 2020, 27, 1–14. [Google Scholar] [CrossRef]
- Li, Y.; Johnson, D.A.; Su, Y.; Cui, J.; Zhang, T. Specific leaf area and leaf dry matter content of plants growing in sand dunes. Bot. Bull. Acad. Sin. 2005, 46, 127–134. [Google Scholar] [CrossRef]
- Scholander, P.F.; Hammel, H.T.; Hemmingsen, E.A.; Bradstreet, E.D. Hydrostatic Pressure and Osmotic Potential in Leaves of Mangroves and Some Other Plants. Proc. Natl. Acad. Sci. USA 1964, 52, 119–125. [Google Scholar] [CrossRef]
- Padilla, F.M.; de Souza, R.; Peña-Fleitas, M.T.; Gallardo, M.; Giménez, C.; Thompson, R.B. Different responses of various chlorophyll meters to increasing nitrogen supply in sweet pepper. Front. Plant Sci. 2018, 871, 01752. [Google Scholar] [CrossRef]
- Guidi, L.; Lo Piccolo, E.; Landi, M. Chlorophyll fluorescence, photoinhibition and abiotic stress: Does it make any difference the fact to be a C3 or C4 species? Front. Plant Sci. 2019, 10, 174. [Google Scholar] [CrossRef]
- Strasser, R.J.; Srivastava, A.; Tsimilli-Michael, M. The fluorescence transient as a tool to characterize and screen photosynthetic samples. In Probing Photosynthesis: Mechanism, Regulation and Adaptation; Yunus, M., Pathre, U., Mohanty, P., Eds.; Taylor and Francis Ltd.: London, UK, 2000; pp. 443–480. [Google Scholar]
- Larcher, L.; Nogueira, G.; Boeger, M.R. Morphological plasticity and gas exchange of Ligustrum lucidum W.T. Aiton in distinct light conditions. Braz. Arch. Biol. Technol. 2015, 58, 877–885. [Google Scholar] [CrossRef][Green Version]
- SAS Institute Inc. SAS Software 9.4; SAS Inst. Inc.: Cary, NC, USA, 2014. [Google Scholar]
Disclaimer/Publisher’s Note: The statements, opinions and data contained in all publications are solely those of the individual author(s) and contributor(s) and not of MDPI and/or the editor(s). MDPI and/or the editor(s) disclaim responsibility for any injury to people or property resulting from any ideas, methods, instructions or products referred to in the content. |
© 2024 by the authors. Licensee MDPI, Basel, Switzerland. This article is an open access article distributed under the terms and conditions of the Creative Commons Attribution (CC BY) license (https://creativecommons.org/licenses/by/4.0/).