
Development and Validation of a Duplex RT-qPCR for Detection of Peach Latent Mosaic Viroid and Comparison of Different Nucleic-Acid-Extraction Protocols
 , , , ,
  , ,
, ,  , and
, and
Abstract
1. Introduction
2. Results
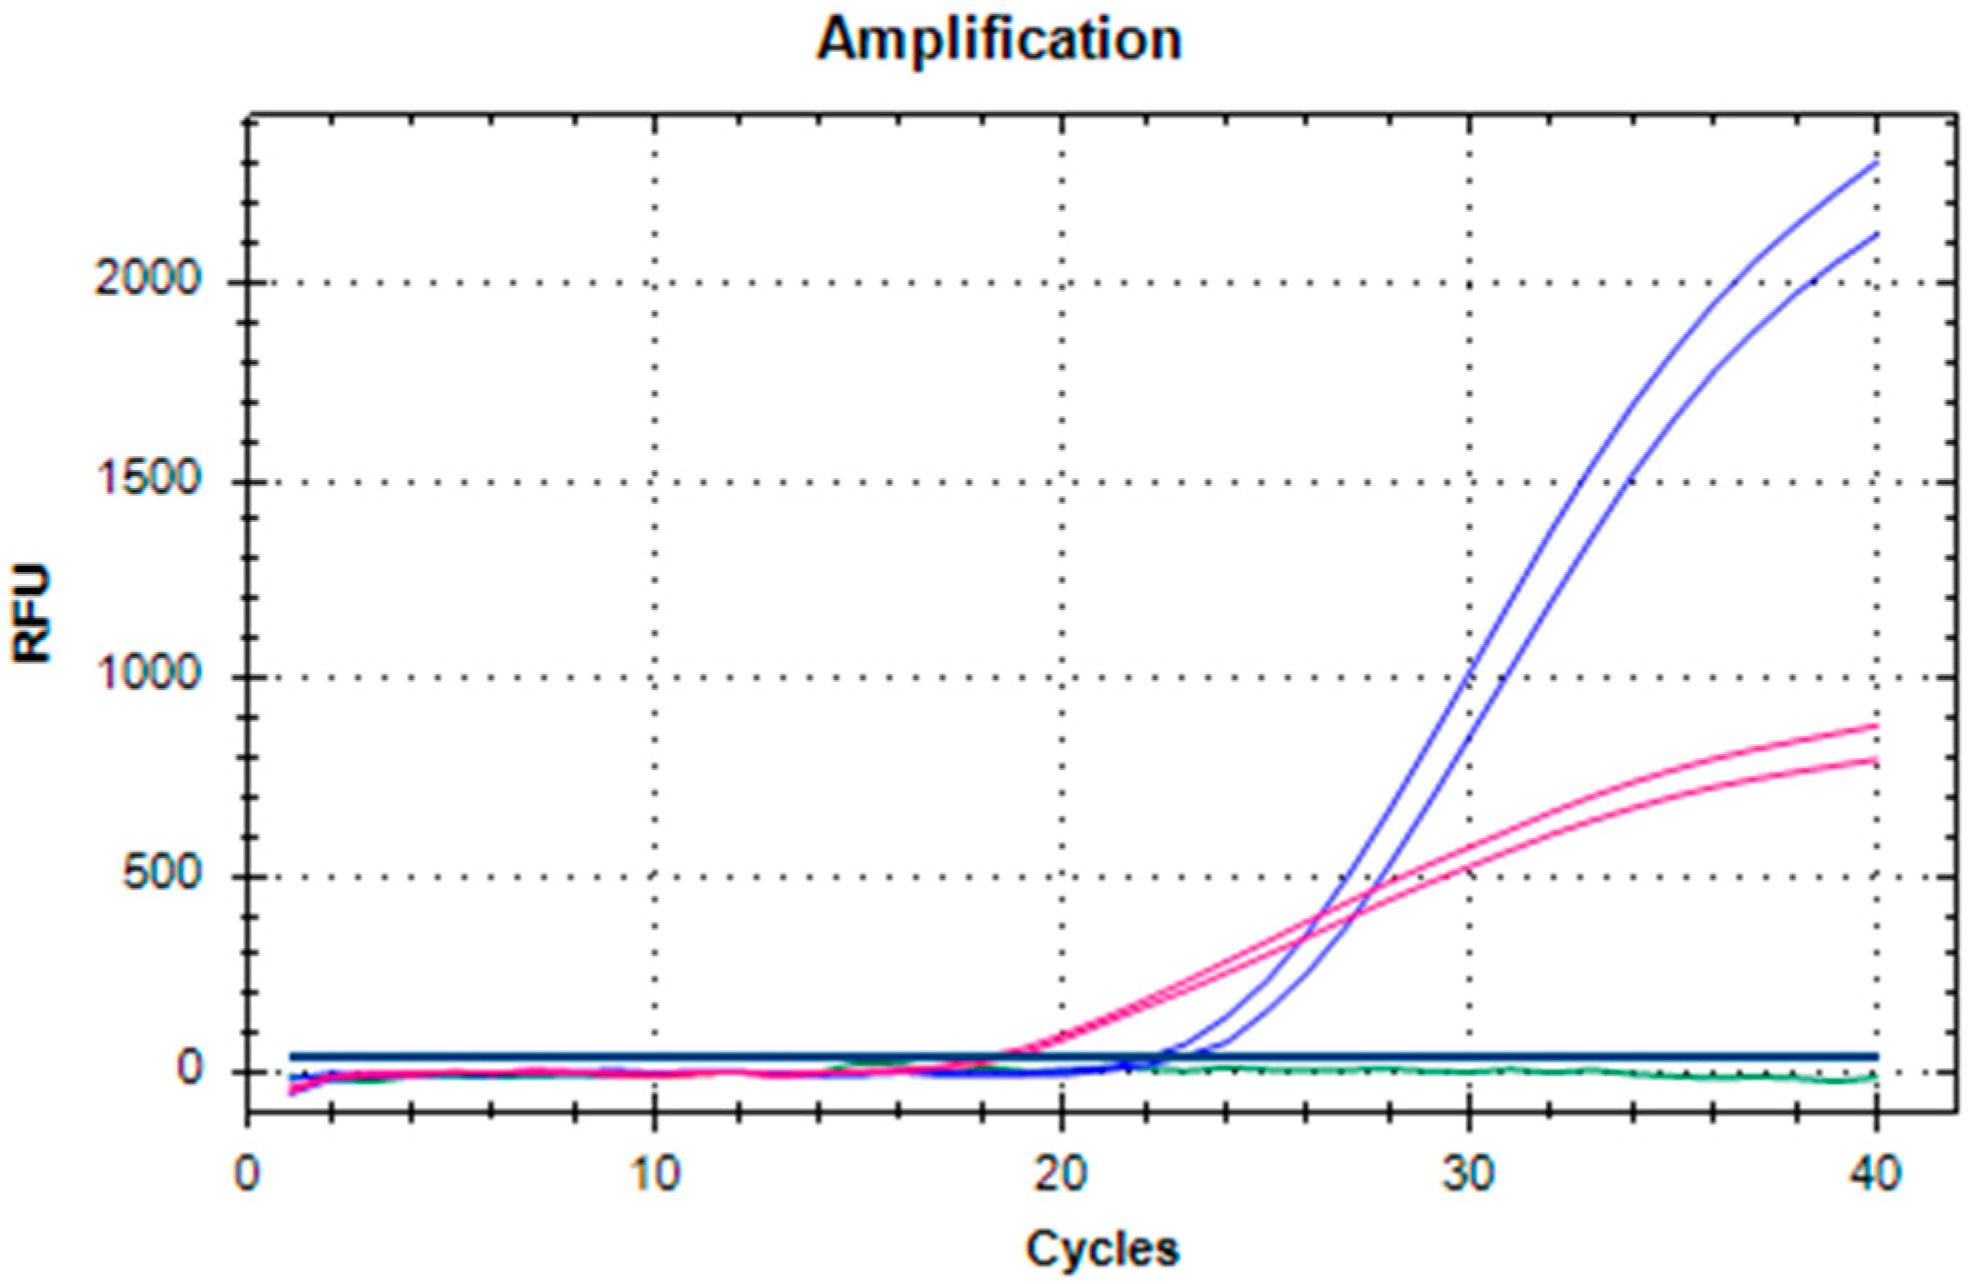
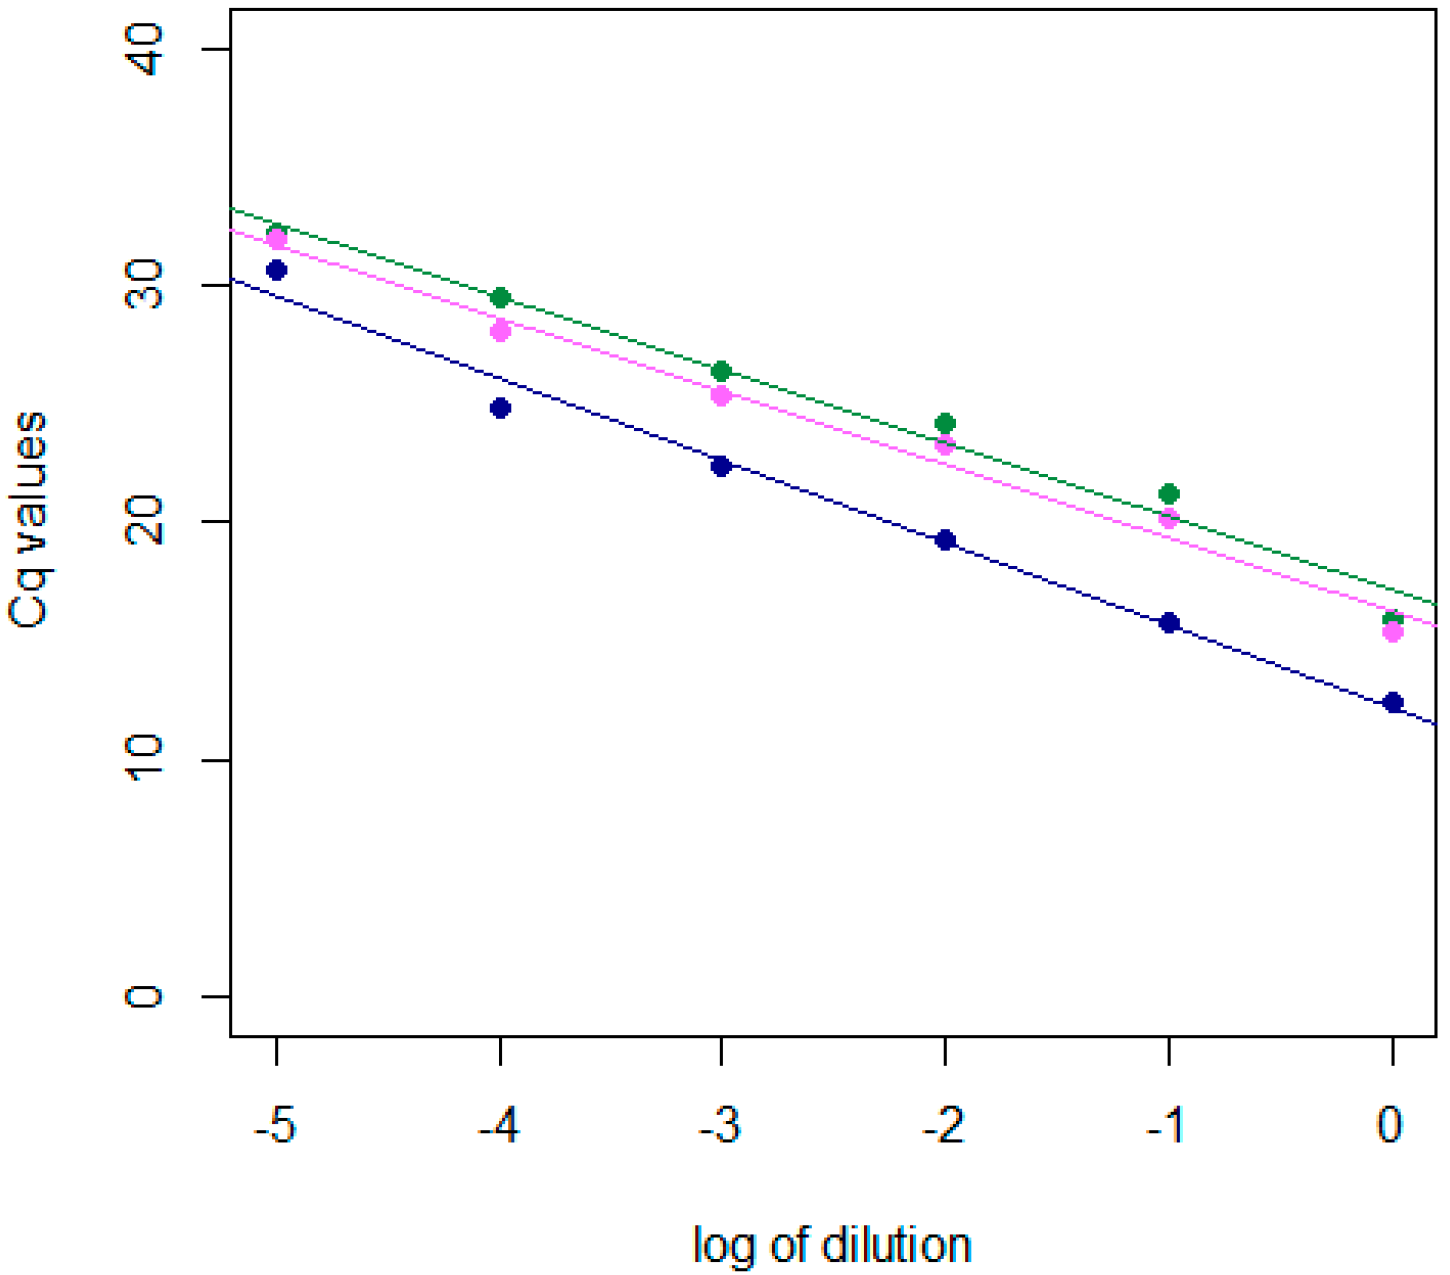
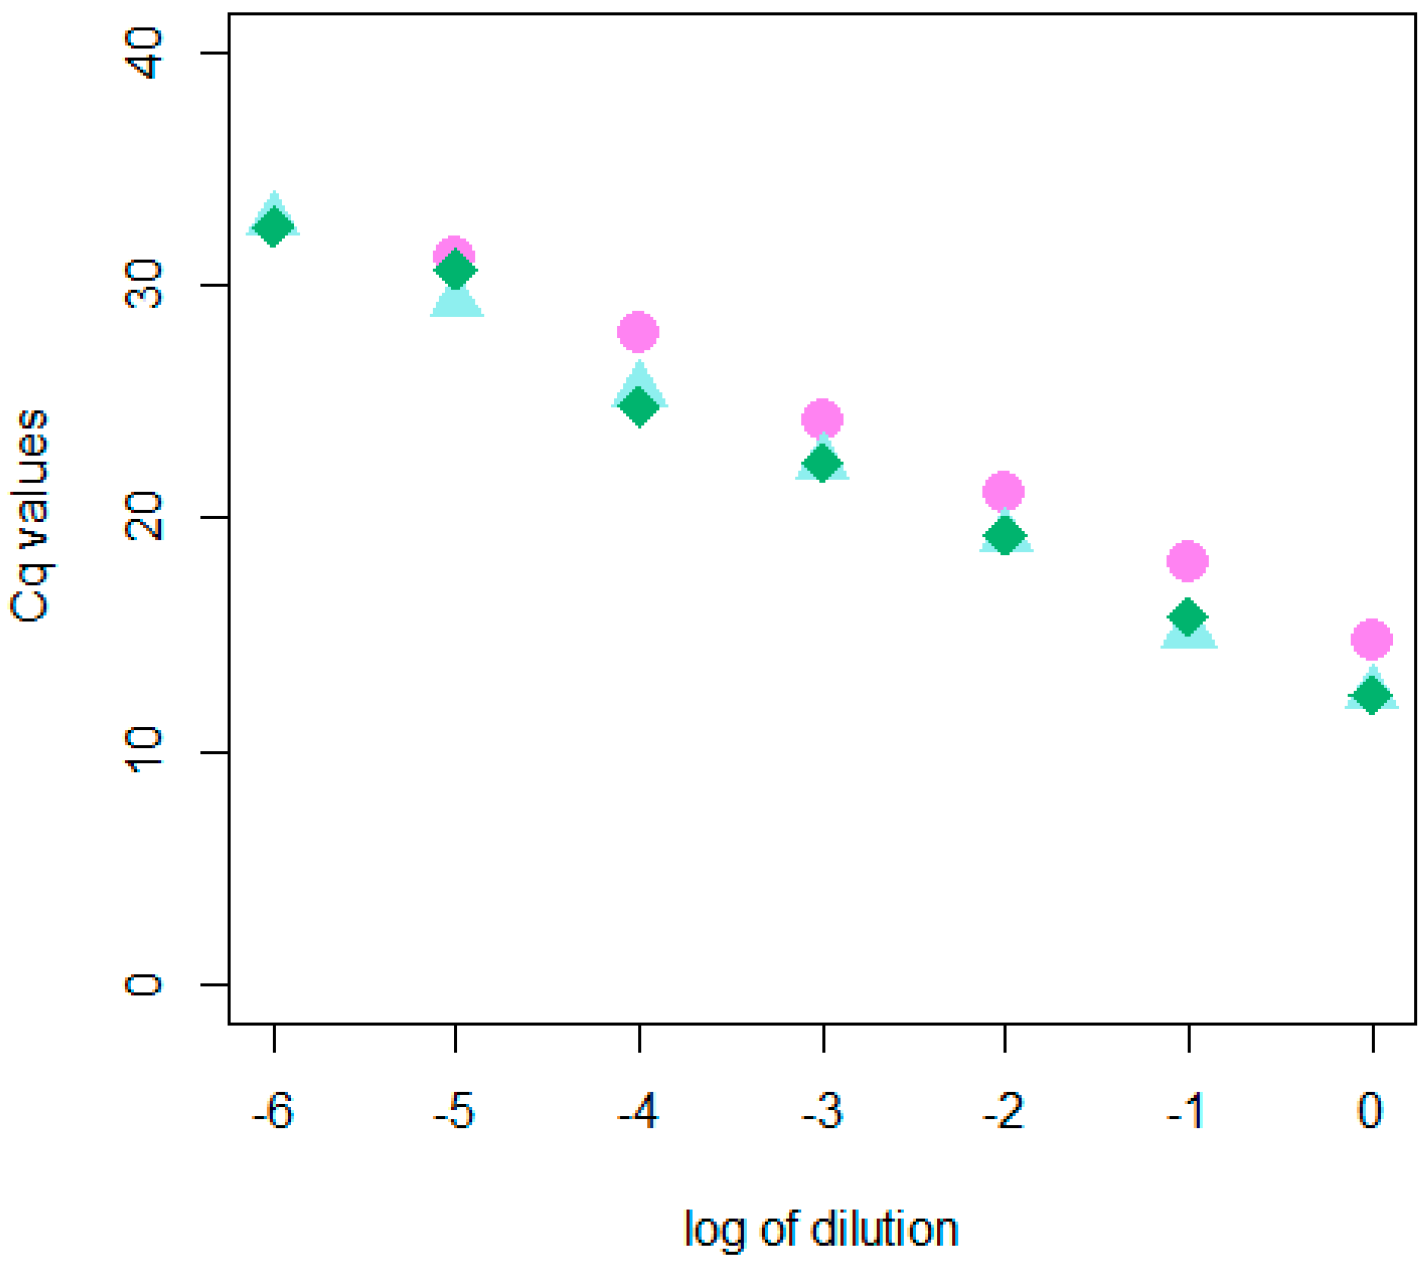
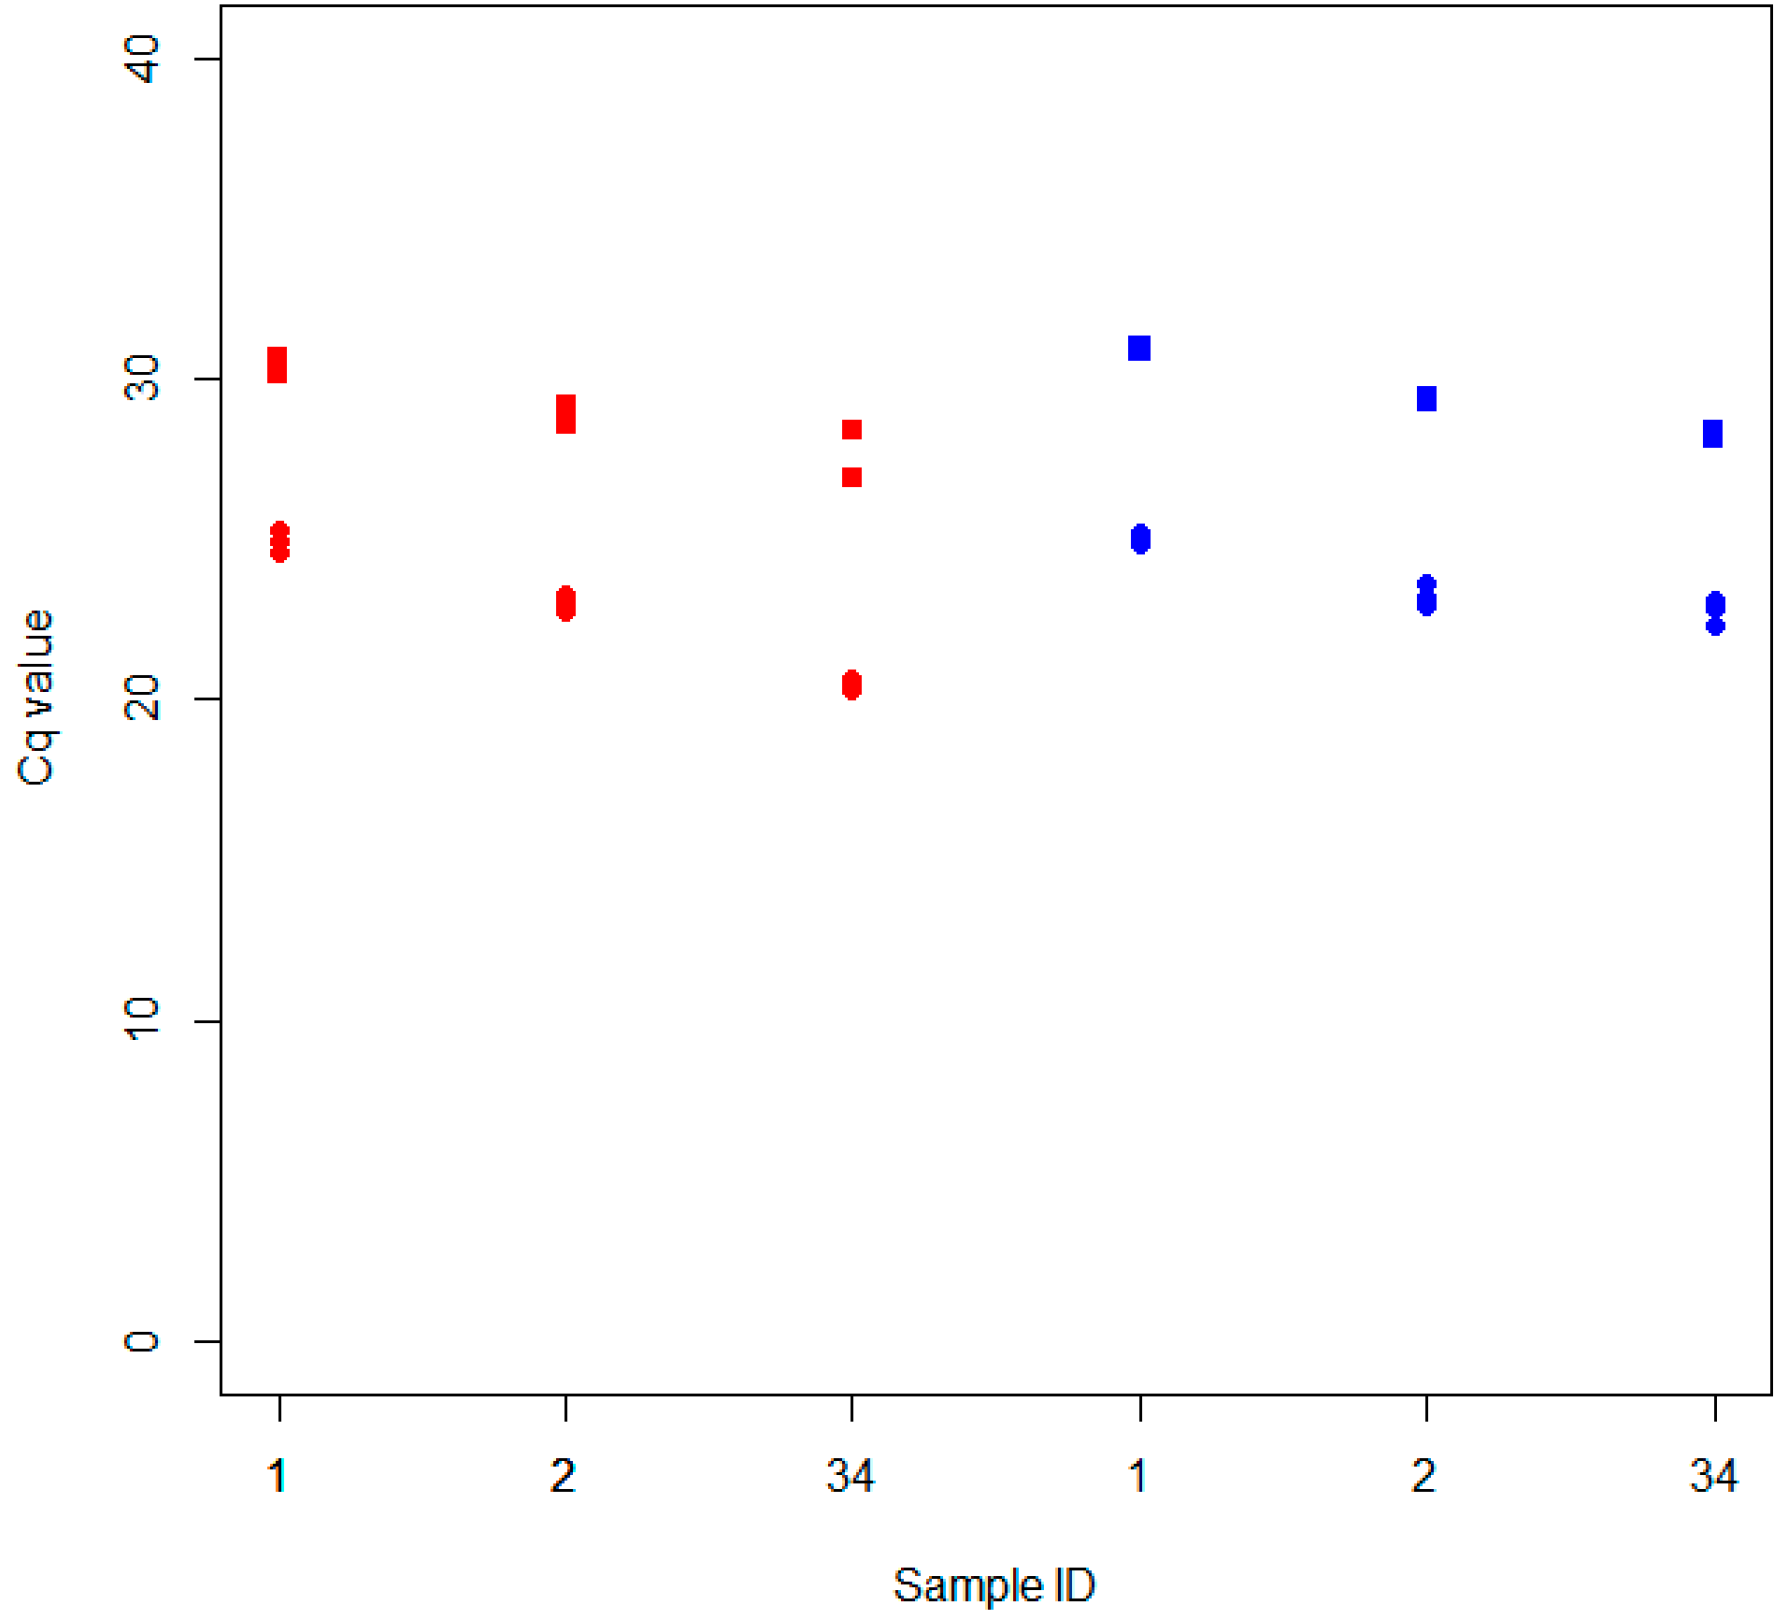
2.1. Development and Validation of the dRT-qPCR
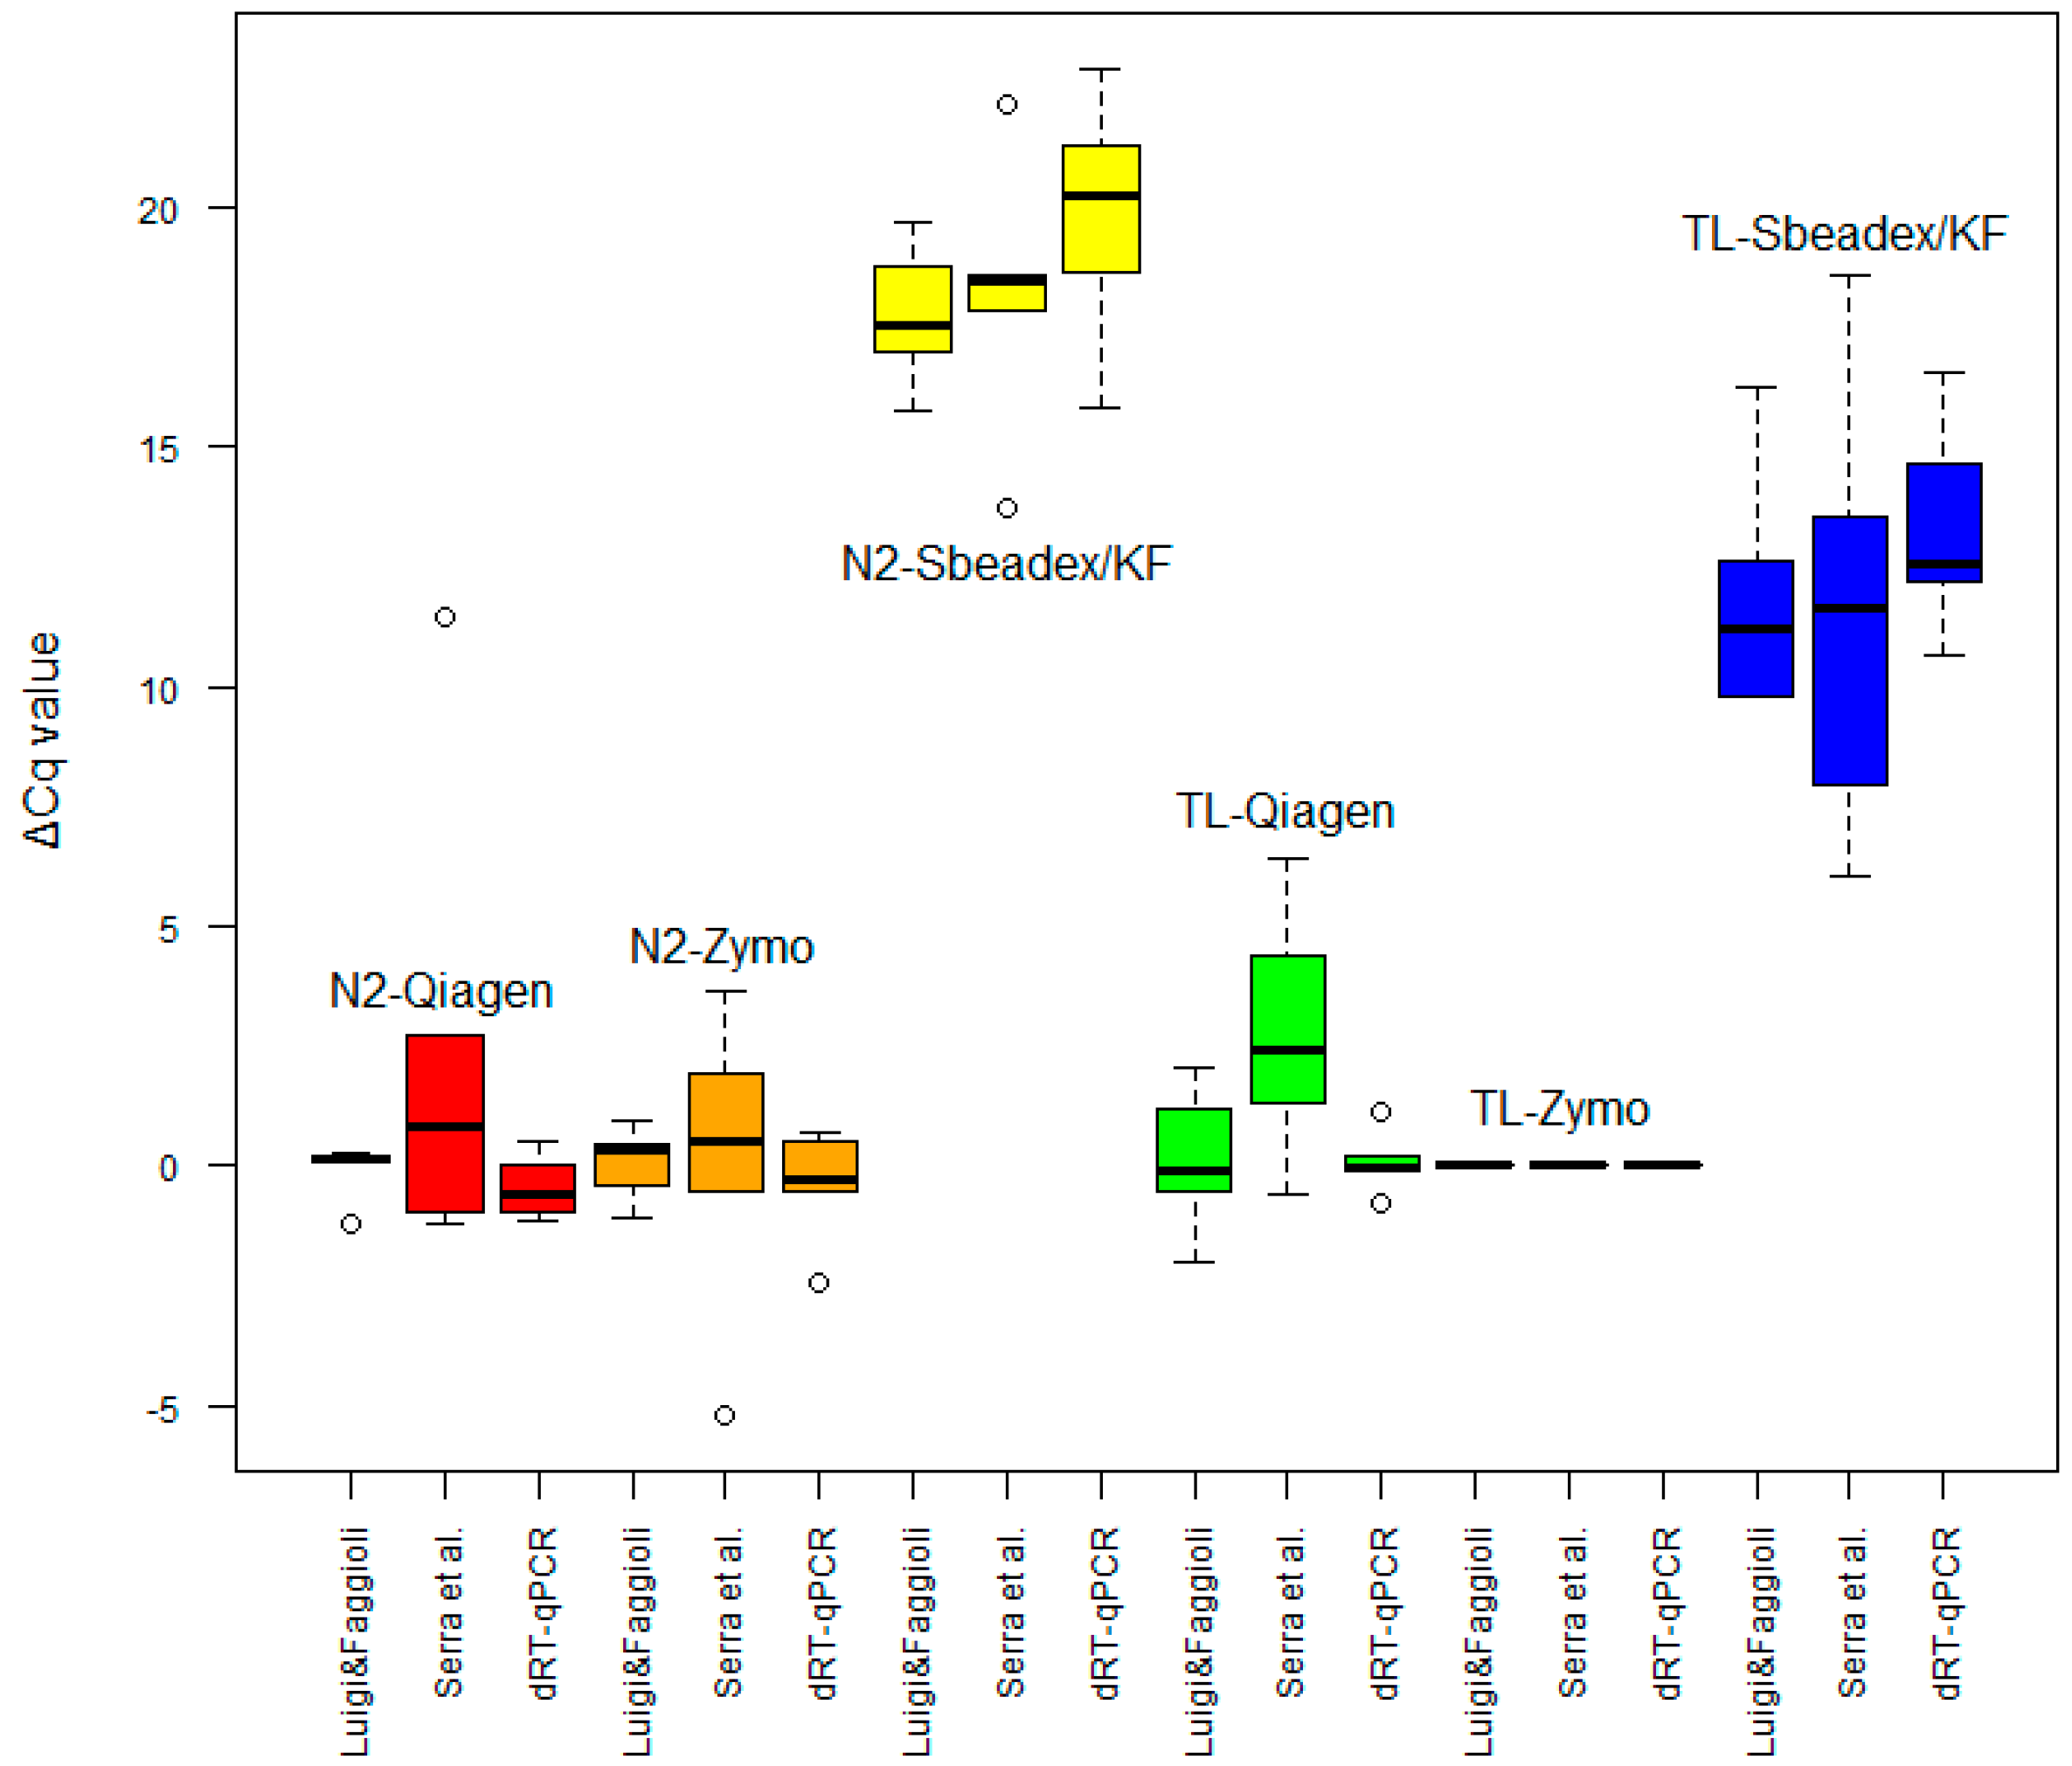
2.2. Extraction Tests
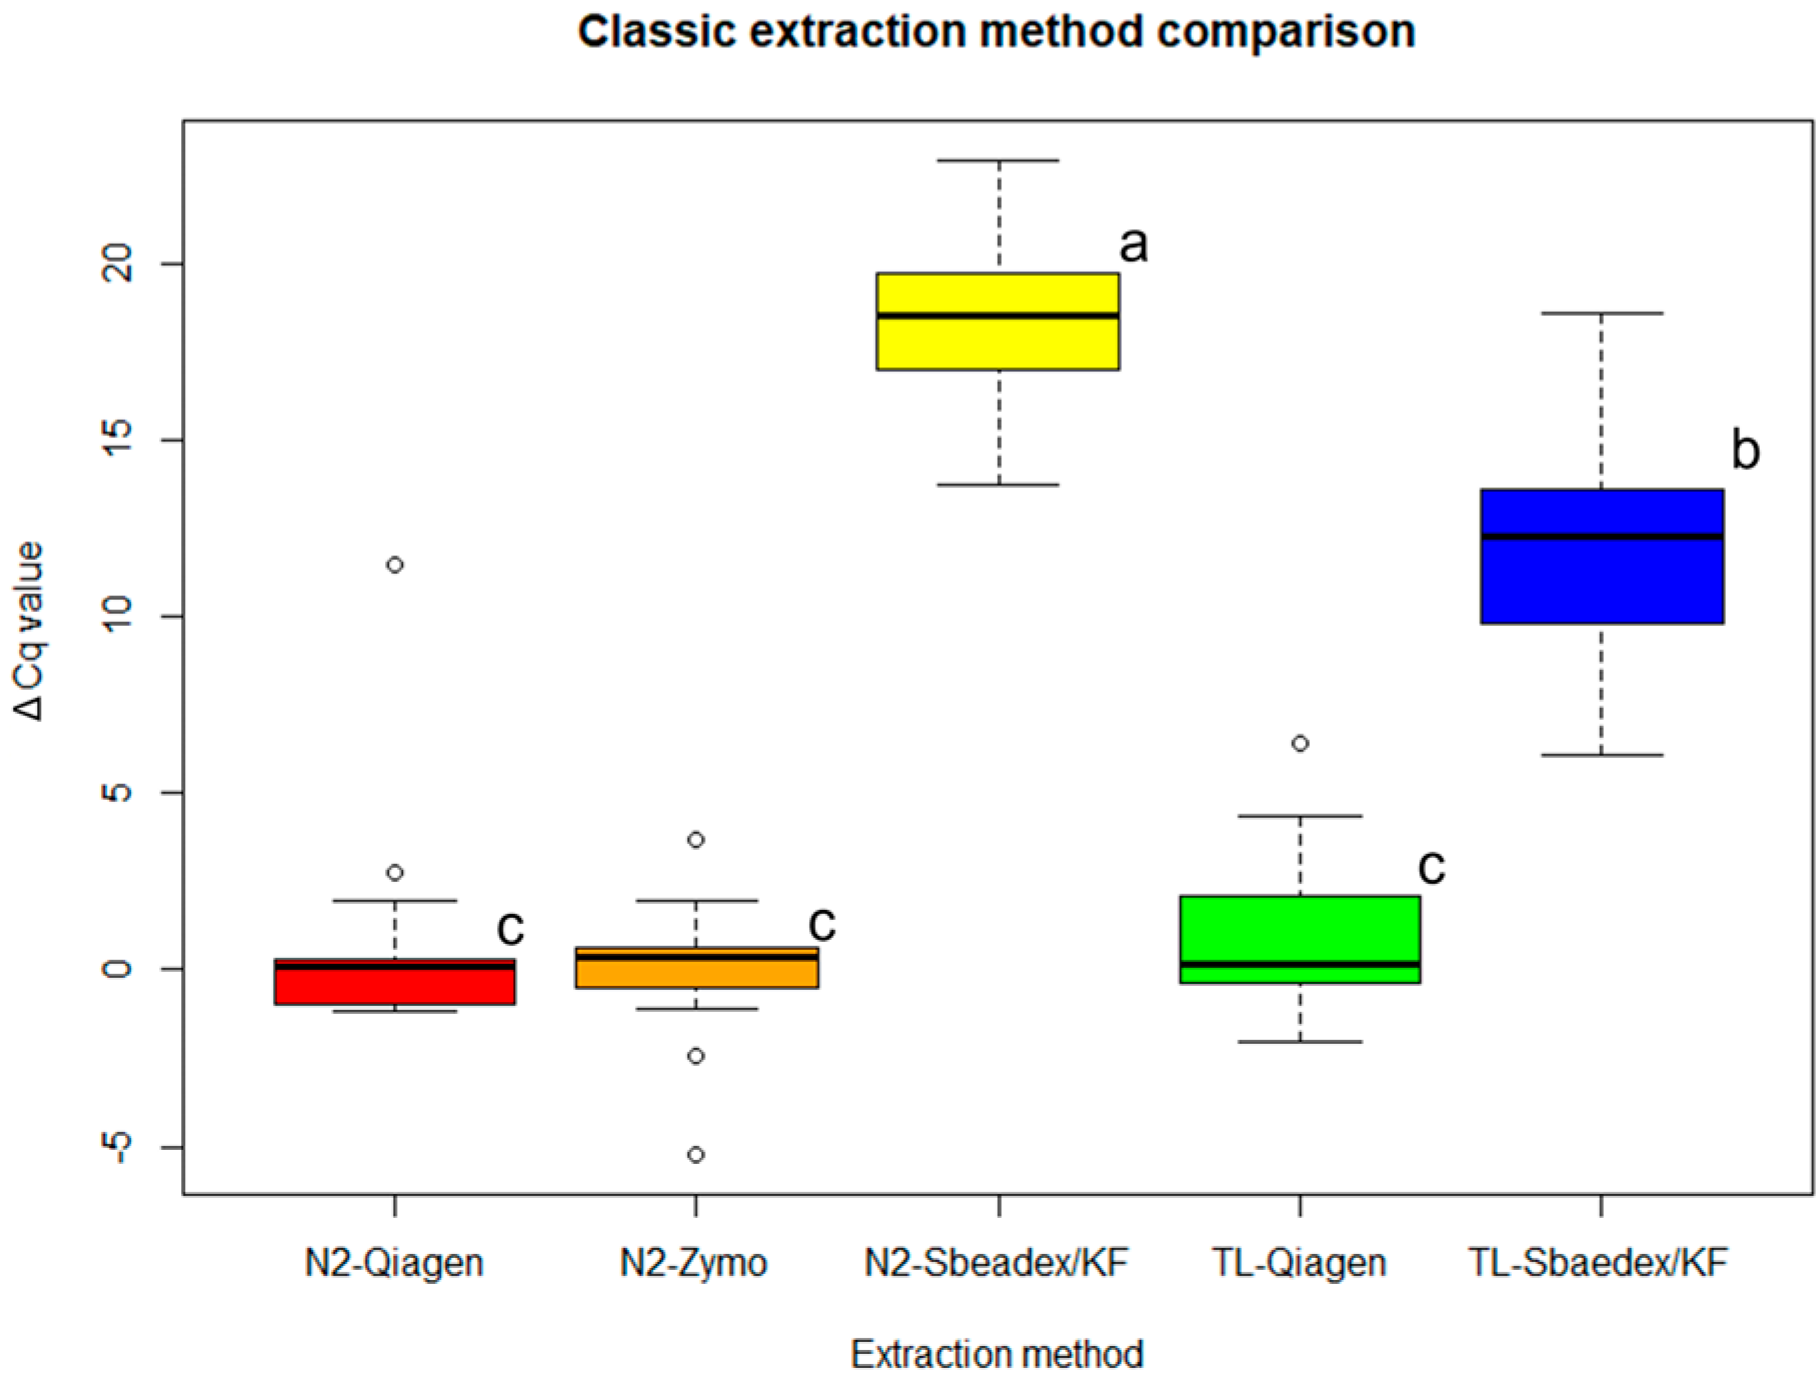
2.2.1. Classic Extraction Methods
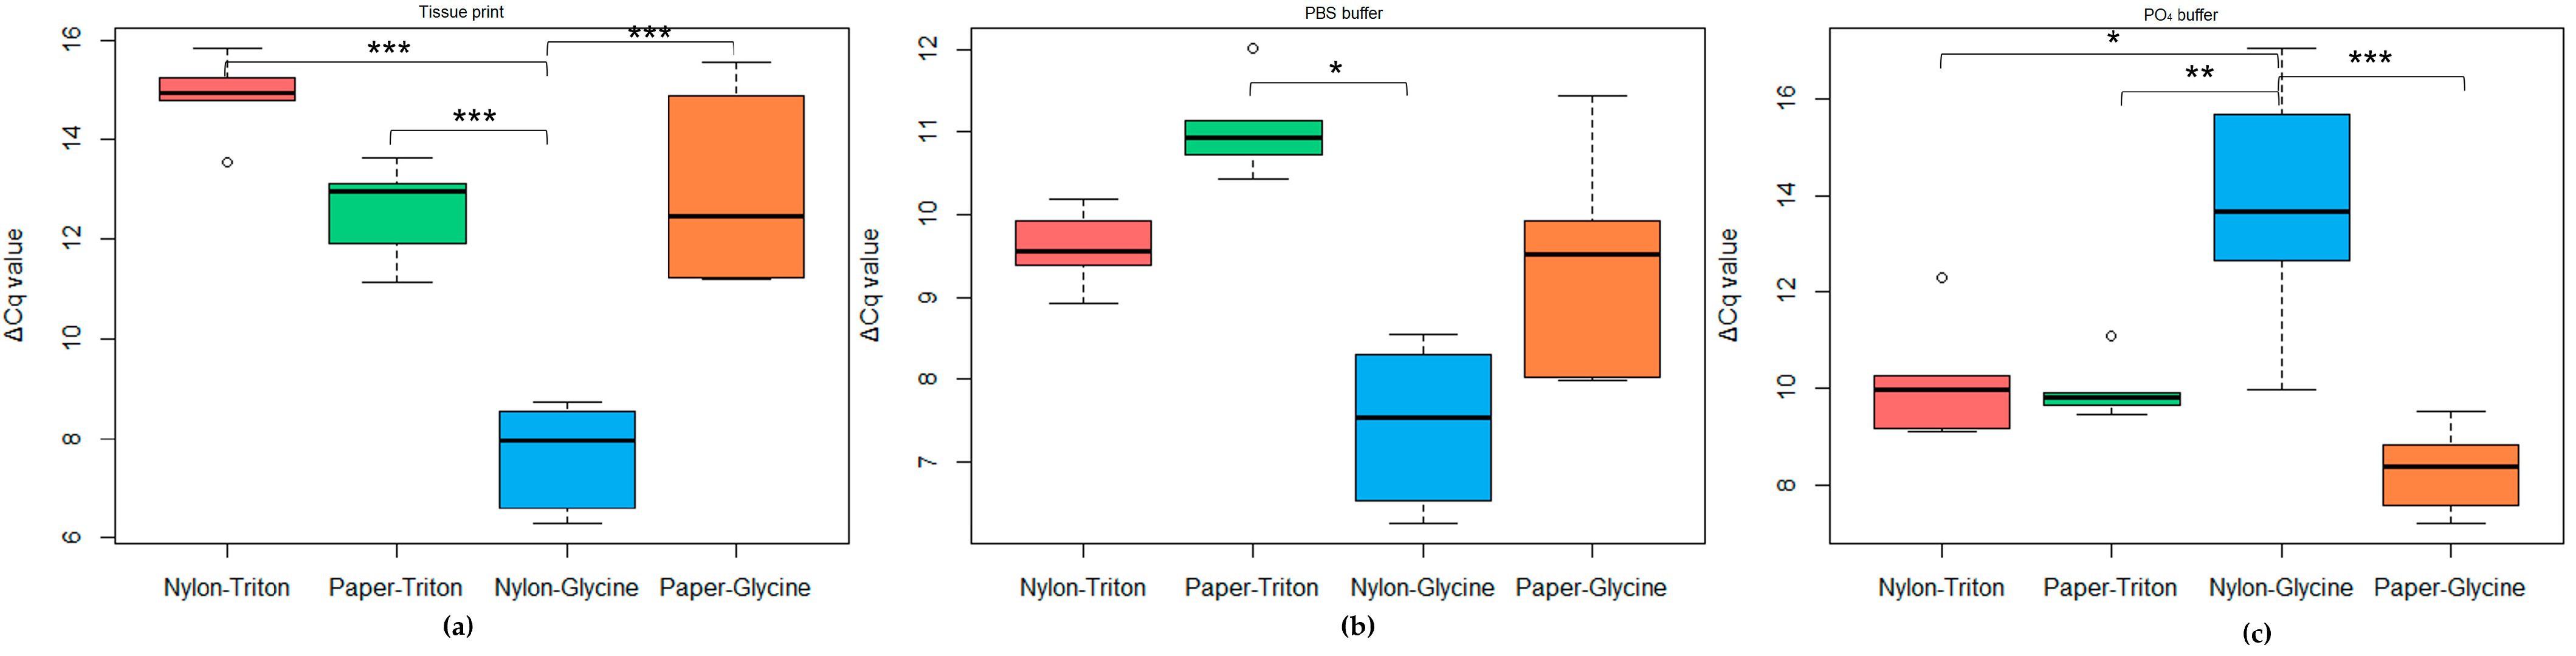
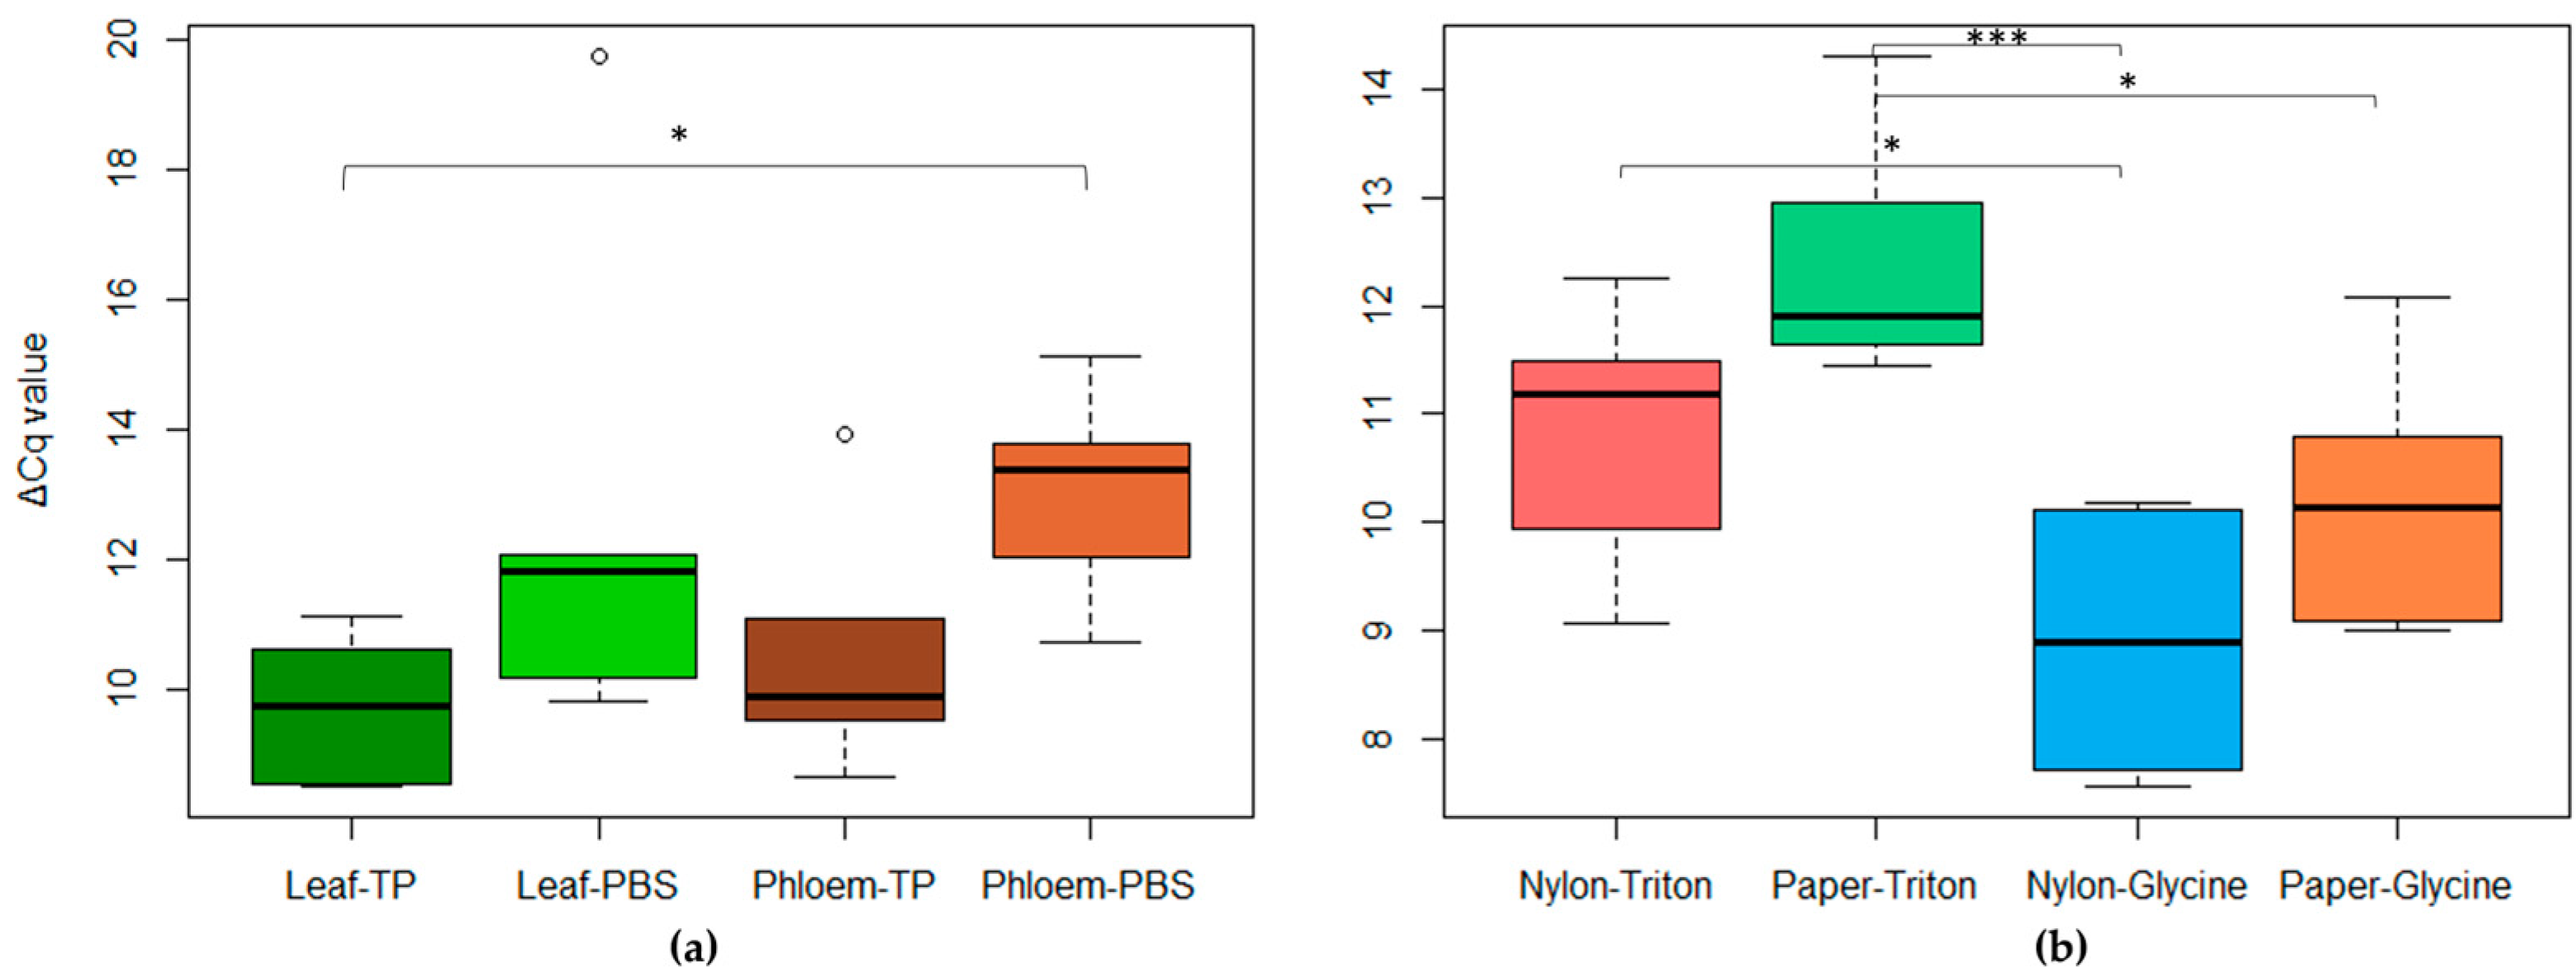
2.2.2. Rapid-Extraction Methods
2.3. Test Performance Study (TPS)
- Centro attività vivaistiche (CAV), Italy
- CREA—Centro di Ricerca Difesa e Certificazione (CREA-DC), Italy—Organizing Laboratory
- Dipartimento di Scienze Agrarie e Ambientali—Produzione, Territorio, Agroenergia, Università degli studi di Milano (UNIMI), Italy
- Flanders Research Institute for Agriculture, Fisheries and Food (ILVO), Belgium
- Instituto Valenciano de Investigaciones Agrarias (IVIA), Spain
3. Discussion
4. Materials and Methods
4.1. Sample Collection and TRNA Extraction
4.2. Duplex RT-qPCR: Development and Validation
4.3. Extraction Tests
- An amount of 0.1 g of fresh phloem tissue was added to 1 mL of lysis buffer [20] containing 2% of sodium metabisulfite and disrupted using Tissue Lyser (TL, Qiagen) at maximum speed (30 Hz) for 5 min (using three beads for a sample).
- An amount of 0.1 g of fresh phloem tissue was homogenized with a mortar and pestle in liquid nitrogen (N2) and lysed using 1 mL of lysis buffer [20] already added with 2% sodium metabisulfite.
- The tubes were then centrifuged and 1 mL of supernatant collected, added with 100 μL of 20% N-Lauroylsarcosine sodium salt solution and incubated for 5 min at 70 °C; then, the TRNA was extracted using:
- (a)
- The Quick-RNA Plant Kit, according to the manufacturer’s instructions;
- (b)
- The RNeasy Plant mini-kit, according to the manufacturer’s instructions;
- (c)
- The Sbeadex maxi-plant kit (Biosearch technologies, Hoddesdon, UK) in combination with the King Fisher (ThermoFisher) automation system, according to the manufacturers’ instructions.
4.4. Statistical Analysis
4.5. Test Performance Study
Author Contributions
Funding
Institutional Review Board Statement
Informed Consent Statement
Data Availability Statement
Acknowledgments
Conflicts of Interest
References
- Flores, R.; Navarro, B.; Delgado, S.; Hernández, C.; Xu, W.X.; Barba, M.; Hadidi, A.; di Serio, F. Peach Latent Mosaic Viroid in Infected Peach. In Viroids and Satellites; Academic Press: Cambridge, MA, USA, 2017. [Google Scholar]
- Barba, M.; Ragozzino, E.; Faggioli, F. Pollen Transmission of Peach Latent Mosaic Viroid. J. Plant Pathol. 2007, 89, 287–289. [Google Scholar]
- Ambrós, S.; Hernández, C.; Flores, R. Rapid Generation of Genetic Heterogeneity in Progenies from Individual CDNA Clones of Peach Latent Mosaic Viroid in Its Natural Host. J. Gen. Virol. 1999, 80, 2239–2252. [Google Scholar] [CrossRef] [PubMed]
- Serra, P.; Bertolini, E.; Martínez, M.C.; Cambra, M.; Flores, R. Interference between Variants of Peach Latent Mosaic Viroid Reveals Novel Features of Its Fitness Landscape: Implications for Detection. Sci. Rep. 2017, 7, 42825. [Google Scholar] [CrossRef] [PubMed]
- Loreti, S.; Faggioli, F.; Barba, M. A rapid extraction method to detect peach latent mosaic viroid by molecular hybridization. Acta Hortic. 1995, 386, 560–564. [Google Scholar] [CrossRef]
- Loreti, S.; Faggioli, F.; Cardoni, M.; Mordenti, G.; Babini, A.R.; Pollini, C.P.; Barba, M. Comparison of Different Diagnostic Methods for Detection of Peach Latent Mosaic Viroid. EPPO Bull. 1999, 29, 433–438. [Google Scholar] [CrossRef]
- Parisi, O.; Lepoivre, P.; Jijakli, M.H. Development of a Quick Quantitative Real-Time PCR for the in Vivo Detection and Quantification of Peach Latent Mosaic Viroid. Plant Dis. 2011, 95, 137–142. [Google Scholar] [CrossRef] [PubMed]
- Luigi, M.; Faggioli, F. Development of Quantitative Real-Time RT-PCR for the Detection and Quantification of Peach Latent Mosaic Viroid. Eur. J. Plant Pathol. 2011, 130, 109–116. [Google Scholar] [CrossRef]
- Boubourakas, I.N.; Fukuta, S.; Kyriakopoulou, P.E. Sensitive and Rapid Detection of Peach Latent Mosaic Viroid by the Reverse Transcription Loop-Mediated Isothermal Amplification. J. Virol. Methods 2009, 160, 63–68. [Google Scholar] [CrossRef] [PubMed]
- Valasek, M.A.; Repa, J.J. The Power of Real-Time PCR. Am. J. Physiol.-Adv. Physiol. Educ. 2005, 29, 151–159. [Google Scholar] [CrossRef] [PubMed]
- Luigi, M.; Faggioli, F. Protocollo Diagnostico per Peach Latent Mosaic Viroid. Petria 2017, 167–190. [Google Scholar]
- EPPO Standard. PM 7/98 (5) Specific Requirements for Laboratories Preparing Accreditation for a Plant Pest Diagnostic Activity. EPPO Bull. 2021, 51, 468–498. [Google Scholar] [CrossRef]
- Olmos, A.; Dasí, M.A.; Candresse, T.; Cambra, M. Print-Capture PCR: A Simple and Highly Sensitive Method for the Detection of Plum Pox Virus (PPV) in Plant Tissues. Nucleic Acids Res. 1996, 24, 2192–2193. [Google Scholar] [CrossRef] [PubMed]
- Bertolini, E.; Moreno, A.; Capote, N.; Olmos, A.; De Luis, A.; Vidal, E.; Pérez-Panadés, J.; Cambra, M. Quantitative Detection of Citrus Tristeza Virus in Plant Tissues and Single Aphids by Real-Time RT-PCR. Eur. J. Plant Pathol. 2008, 120, 177–188. [Google Scholar] [CrossRef]
- Wetzel, T.; Candresse, T.; Macquaire, G.; Ravelonandro, M.; Dunez, J. A Highly Sensitive Immunocapture Polymerase Chain Reaction Method for Plum Pox Potyvirus Detection. J. Virol. Methods 1992, 39, 27–37. [Google Scholar] [CrossRef] [PubMed]
- Osman, F.; Rowhani, A. Application of a Spotting Sample Preparation Technique for the Detection of Pathogens in Woody Plants by RT-PCR and Real-Time PCR (TaqMan). J. Virol. Methods 2006, 133, 130–136. [Google Scholar] [CrossRef] [PubMed]
- Massart, S.; Lebas, B.; Chabirand, A.; Chappé, A.-M.; Dreo, T.; Faggioli, F.; Harrison, C.; Macarthur, R.; Mehle, N.; Mezzalama, M.; et al. Guidelines for Improving Statistical Analyses of Validation Datasets for Plant Pest Diagnostic Tests. EPPO Bull. 2022, 52, 419–433. [Google Scholar] [CrossRef]
- EPPO Standard. PM 7/122 (1) Guidelines for the Organization of Interlaboratory Comparisons by Plant Pest Diagnostic Laboratories. EPPO Bull. 2014, 44, 390–399. [Google Scholar] [CrossRef]
- Langton, S.D.; Chevennement, R.; Nagelkerke, N.; Lombard, B. Analysing Collaborative Trials for Qualitative Microbiological Methods: Accordance and Concordance. Int. J. Food Microbiol. 2002, 79, 175–181. [Google Scholar] [CrossRef]
- MacKenzie, D.J.; McLean, M.A.; Mukerji, S.; Green, M. Improved RNA Extraction from Woody Plants for the Detection of Viral Pathogens by Reverse Transcription-Polymerase Chain Reaction. Plant Dis. 1997, 81, 222–226. [Google Scholar] [CrossRef]
- Rutledge, R.G. Mathematics of Quantitative Kinetic PCR and the Application of Standard Curves. Nucleic Acids Res. 2003, 31, e93. [Google Scholar] [CrossRef]
- R Development Core Team. R: A Language and Environment for Statistical Computing, Version 4.0.5; R Foundation for Statistical Computing: Vienna, Austria, 2021; Volume 55, ISBN 3-900051-07-0. Available online: https://www.R-Project.Org/ (accessed on 26 April 2023).


| Sample ID | Phytosanitary State | Matrix | Period of Sampling | GenBankAcc. No. | Host | Test Development | Analytical Sensitivity | Analytical Specificity | Repeatability/Reproducibility | Extraction Tests | TPS |
|---|---|---|---|---|---|---|---|---|---|---|---|
| 1 | PLMVd | P | A; S | ON513442 | P. persica | X | X | X | |||
| 2 | PLMVd | P, L | A; S | ON513443 | P. persica cv Opera | X | X | X | X | X | X |
| 22 | PLMVd | P, L | A; S | ON513444 | P. persica cv Rosa del West | X | X | X | X | ||
| 37 | PLMVd | P, L | A; S | ON513445 | P. persica cv Zaigadi Royal Jim® | X | X | ||||
| 43 | PLMVd | P, L | A; S | ON513446 | P. persica cv Zaisito Patty® | X | X | X | |||
| 42 | PLMVd | P, L | A; S | P. persica cv Nerid01206 Romagna sweet® | X | X | |||||
| 34 | PLMVd | P, L | A; S | P. persica cv Alma | X | X | X | ||||
| M54 * | PLMVd | P | S | P. persica cv Tardiva di San Vittorino | X | ||||||
| M56 * | PLMVd | P | S | P. persica cv Crasiomolo | X | ||||||
| M57 * | PLMVd | P | S | P. persica cv Crasiomolo | X | ||||||
| M58 * | PLMVd | P | S | P. persica cv Crasiomolo | X | ||||||
| M59 * | PLMVd | P | S | P. persica cv Reginella II | X | ||||||
| NT1 * | ACLSV | P | S | P. persica | X | ||||||
| NT2 * | ApMV | P | S | P. persica | X | ||||||
| NT3 * | ASGV/ASPV | P | S | Pomaceae | X | ||||||
| NT4 * | PDV | P | S | Prunus spp. | X | ||||||
| NT5 * | PNRSV | P, L | S | P. persica | X | X | |||||
| 6.3 | PPV strain D | P | S | GF305 | X | ||||||
| 7.3 | PPV strain M | P | S | GF305 | X | ||||||
| CMC D | HSVd | P | S | Citrus spp. | X | ||||||
| PPE42 | Healthy | P | A; S | P. persica | X | X | X | ||||
| PPE44 | Healthy | P | A; S | P. persica | X | X | |||||
| PPE60 | Healthy | P | A; S | P. persica | X | X | X | ||||
| PPE80 | Healthy | P | A; S | P. persica | X | X | X |
| Name | Sequence (5′-3′) | Position | Reference | Used in the Duplex |
|---|---|---|---|---|
| PLMVd-P | FAM-CTTCTGGAACCAAGCGG-BHQ1 | 165–181 | [8] | Yes |
| PLMVd-H | CTCGCAATGAGGTAAGGTG | 137–155 | No | |
| PLMVd-C | ACGTCGTAATCCAGTTTCTAC | 236–216 | No | |
| P3 | FAM-GGTACCGCCGTAGAAACTGGGTTACG-BHQ1 | 207–232 | [4] | Yes |
| RP2 | GGGACCGGGWTTGAATCCG | 261–246 | Yes (modified) | |
| FP2 | CAATGASGTAAGGTGGGACT | 141–160 | Yes |
| Phytosanitary State | Host | Result | |
|---|---|---|---|
| Inclusivity | PLMVd | P. persica (GF365) | Positive |
| PLMVd | P. persica cv Opera | Positive | |
| PLMVd | P. persica cv Rosa del West | Positive | |
| PLMVd | P. persica cv Alma | Positive | |
| PLMVd | P. persica cv Zaigadi Royal Jim® | Positive | |
| PLMVd | P. persica cv Nerid01206 Romagna Sweet® | Positive | |
| PLMVd | P. persica cv Zaisito Patty® | Positive | |
| PLMVd | P. persica cv Tardiva di San Vittorino | Positive | |
| PLMVd | P. persica cv Crasiomolo cl. B (Gialla spicca) | Positive | |
| PLMVd | P. persica cv Crasiomolo cl. C (Duracina) | Positive | |
| PLMVd | P. persica cv Crasiomolo cl. C (Duracina) | Positive | |
| PLMVd | P. persica cv Reginella II | Positive | |
| Exclusivity | ACLSV | P. persica | Negative |
| ApMV | P. persica | Negative | |
| ASGV/ASPV | Pomaceae | Negative | |
| PDV | Prunus spp. | Negative | |
| PNRSV | P. persica | Negative | |
| PPV strain D | GF305 | Negative | |
| PPV strain M | GF305 | Negative | |
| HSVd | Citrus spp. | Negative | |
| Healthy | P. persica | Negative | |
| Healthy | P. persica | Negative | |
| Healthy | P. persica | Negative | |
| Healthy | P. persica | Negative |
| Sample ID | Homogeneity | Stability | ||||||
|---|---|---|---|---|---|---|---|---|
| Set A | Set B | Set C | Set D | Set A | Set B | Set C | Set D | |
| PPE60 | >35 | >39 | >38 | >39 | >35 | >39 | >38 | >39 |
| PPE80 | >35 | >38 | >38 | NA | >35 | >39 | >38 | >37 |
| NT5 | >35 | >36 | >38 | >37.5 | >36 | >38 | >37 | >37 |
| 2 | 14.9 ± 0.9 | 28.9 ± 1.7 | 23.7 ± 1.9 | 24.9 ± 0.8 | 17.6 ± 0.6 | 32.4 ± 0.8 | 24.6 ± 0.6 | 25.3 ± 0.5 |
| 22 | 16.7 ± 1.2 | 29.9 ± 0.5 | 27.0 ± 2.4 | 29.7 ± 0.7 | 20.4 ± 1.9 | 31.8 ± 0.6 | 24.8 ± 0.7 | 28.7 ± 0.3 |
| 37 | 16.5 ± 1.1 | 28.3 ± 1.3 | 30.0 ± 0.7 | 30.9 ± 0.4 | 18.9 ± 1.0 | 30.9 ± 3.0 | 24.5 ± 0.1 | 27.8 ± 1.0 |
| LAB1 | LAB2 | LAB3 | LAB4 | LAB5 | |||||||
|---|---|---|---|---|---|---|---|---|---|---|---|
| Set A | PPE60 | Und | 34.34 | Und | 33.62 | Pos | 39.16 | Neg | 39.12 | Neg | 35.39 |
| PPE80 | Pos | 33.51 | Und | 34.17 | Pos | 38.46 | Neg | 39.06 | Neg | 35.29 | |
| NT5 | Pos | 32.45 | Neg | 34.25 | Neg | 40.00 | Neg | 40.00 | Neg | 34.81 | |
| 2 | Pos | 15.76 | Pos | 17.37 | Pos | 22.20 | Pos | 22.55 | Pos | 14.20 | |
| 22 | Pos | 24.81 | Pos | 18.41 | Pos | 20.22 | Pos | 27.30 | Pos | 15.87 | |
| 37 | Pos | 18.48 | Pos | 18.00 | Pos | 21.96 | Pos | 23.89 | Pos | 15.73 | |
| LAB1 | LAB2 | LAB3 | LAB4 | LAB5 | |||||||||||
|---|---|---|---|---|---|---|---|---|---|---|---|---|---|---|---|
| Sample/Set | B | C | D | B | C | D | B | C | D | B | C | D | B | C | D |
| PPE60 | Neg | Und | Neg | Neg | Neg | Neg | Neg | Neg | Neg | NT | Neg | Neg | Neg | Neg | Neg |
| PPE80 | Neg | Neg | Neg | Neg | Neg | Neg | Neg | Neg | Neg | NT | Neg | Neg | Neg | Neg | Neg |
| NT5 | Neg | Neg | Neg | Und | Neg | Neg | Neg | Neg | Neg | NT | Neg | Neg | Neg | Neg | Neg |
| 2 | Pos | Pos | Pos | Pos | Pos | Pos | Pos | Neg | Neg | NT | Pos | Pos | Pos | Pos | Pos |
| 22 | Pos | Pos | Pos | Pos | Pos | Pos | Pos | Neg | Neg | NT | Neg | Pos | Pos | Pos | Pos |
| 37 | Pos | Pos | Pos | Pos | Pos | Pos | Neg | Neg | Neg | NT | Pos | Pos | Pos | Pos | Pos |
| SET A | SET A* | SET B | SET C | SET D | ||
|---|---|---|---|---|---|---|
| Total data set | 5 | 5 | 4 | 4 | 4 | |
| Total data points | N | 30 | 30 | 24 | 24 | 24 |
| True positive | TP | 15 | 15 | 11 | 11 | 12 |
| True negative | TN | 8 | 15 | 11 | 11 | 12 |
| False positive | FP | 4 | 0 | 0 | 0 | 0 |
| False negative | FN | 0 | 0 | 1 | 1 | 0 |
| Concordant | TP+TN | 23 | 30 | 23 | 23 | 24 |
| Non concordant | FP+FN | 4 | 0 | 1 | 1 | 0 |
| Accuracy (%) | (TP+TN)/N | 77% | 100% | 96% | 96% | 100% |
| Diagnostic sensitivity (%) | TP/(TP+FN) | 100% | 100% | 92% | 92% | 100% |
| Diagnostic specificity (%) | TN/(TN+FP) | 67% | 100% | 100% | 100% | 100% |
| Reproducibility (%) | Langton et al. [19] | 75% | 100% | 88% | 91% | 100% |
Disclaimer/Publisher’s Note: The statements, opinions and data contained in all publications are solely those of the individual author(s) and contributor(s) and not of MDPI and/or the editor(s). MDPI and/or the editor(s) disclaim responsibility for any injury to people or property resulting from any ideas, methods, instructions or products referred to in the content. |
© 2023 by the authors. Licensee MDPI, Basel, Switzerland. This article is an open access article distributed under the terms and conditions of the Creative Commons Attribution (CC BY) license (https://creativecommons.org/licenses/by/4.0/).
Share and Cite
Luigi, M.; Taglienti, A.; Corrado, C.L.; Cardoni, M.; Botti, S.; Bissani, R.; Casati, P.; Passera, A.; Miotti, N.; De Jonghe, K.; et al. Development and Validation of a Duplex RT-qPCR for Detection of Peach Latent Mosaic Viroid and Comparison of Different Nucleic-Acid-Extraction Protocols. Plants 2023, 12, 1802. https://doi.org/10.3390/plants12091802
Luigi M, Taglienti A, Corrado CL, Cardoni M, Botti S, Bissani R, Casati P, Passera A, Miotti N, De Jonghe K, et al. Development and Validation of a Duplex RT-qPCR for Detection of Peach Latent Mosaic Viroid and Comparison of Different Nucleic-Acid-Extraction Protocols. Plants. 2023; 12(9):1802. https://doi.org/10.3390/plants12091802
Chicago/Turabian StyleLuigi, Marta, Anna Taglienti, Carla Libia Corrado, Marco Cardoni, Simona Botti, Rita Bissani, Paola Casati, Alessandro Passera, Niccolò Miotti, Kris De Jonghe, and et al. 2023. "Development and Validation of a Duplex RT-qPCR for Detection of Peach Latent Mosaic Viroid and Comparison of Different Nucleic-Acid-Extraction Protocols" Plants 12, no. 9: 1802. https://doi.org/10.3390/plants12091802
APA StyleLuigi, M., Taglienti, A., Corrado, C. L., Cardoni, M., Botti, S., Bissani, R., Casati, P., Passera, A., Miotti, N., De Jonghe, K., Everaert, E., Olmos, A., Ruiz-García, A. B., & Faggioli, F. (2023). Development and Validation of a Duplex RT-qPCR for Detection of Peach Latent Mosaic Viroid and Comparison of Different Nucleic-Acid-Extraction Protocols. Plants, 12(9), 1802. https://doi.org/10.3390/plants12091802