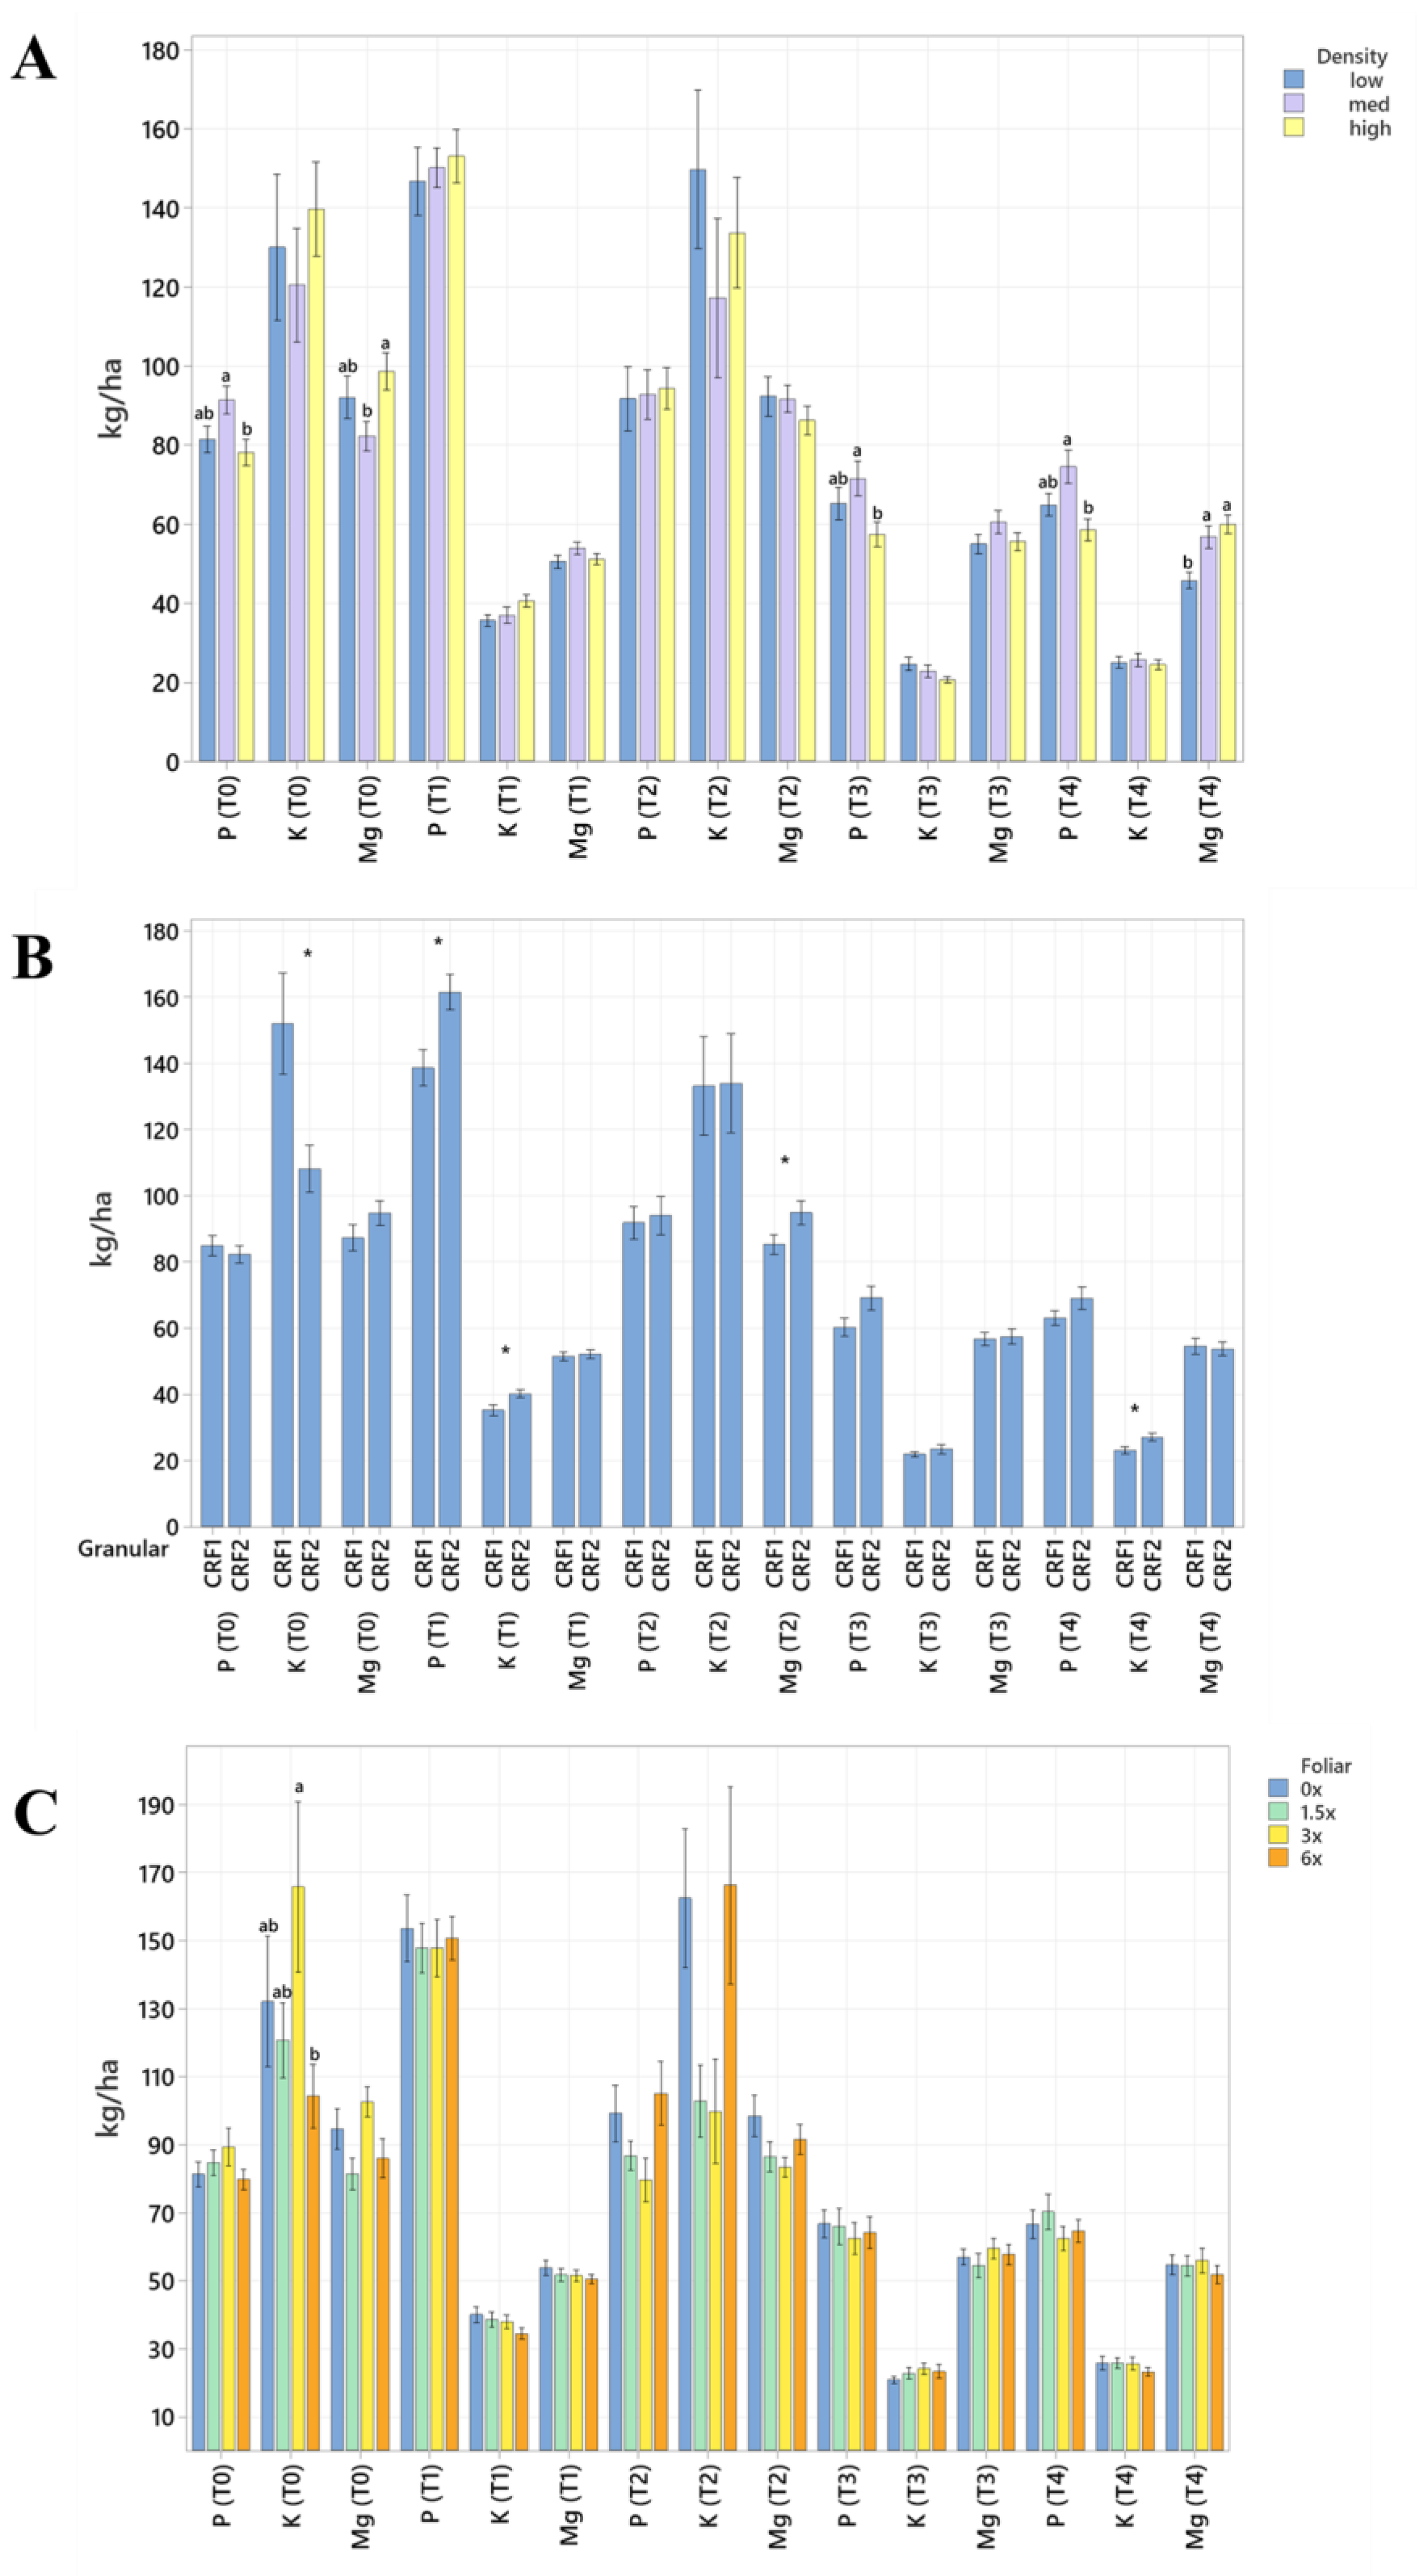
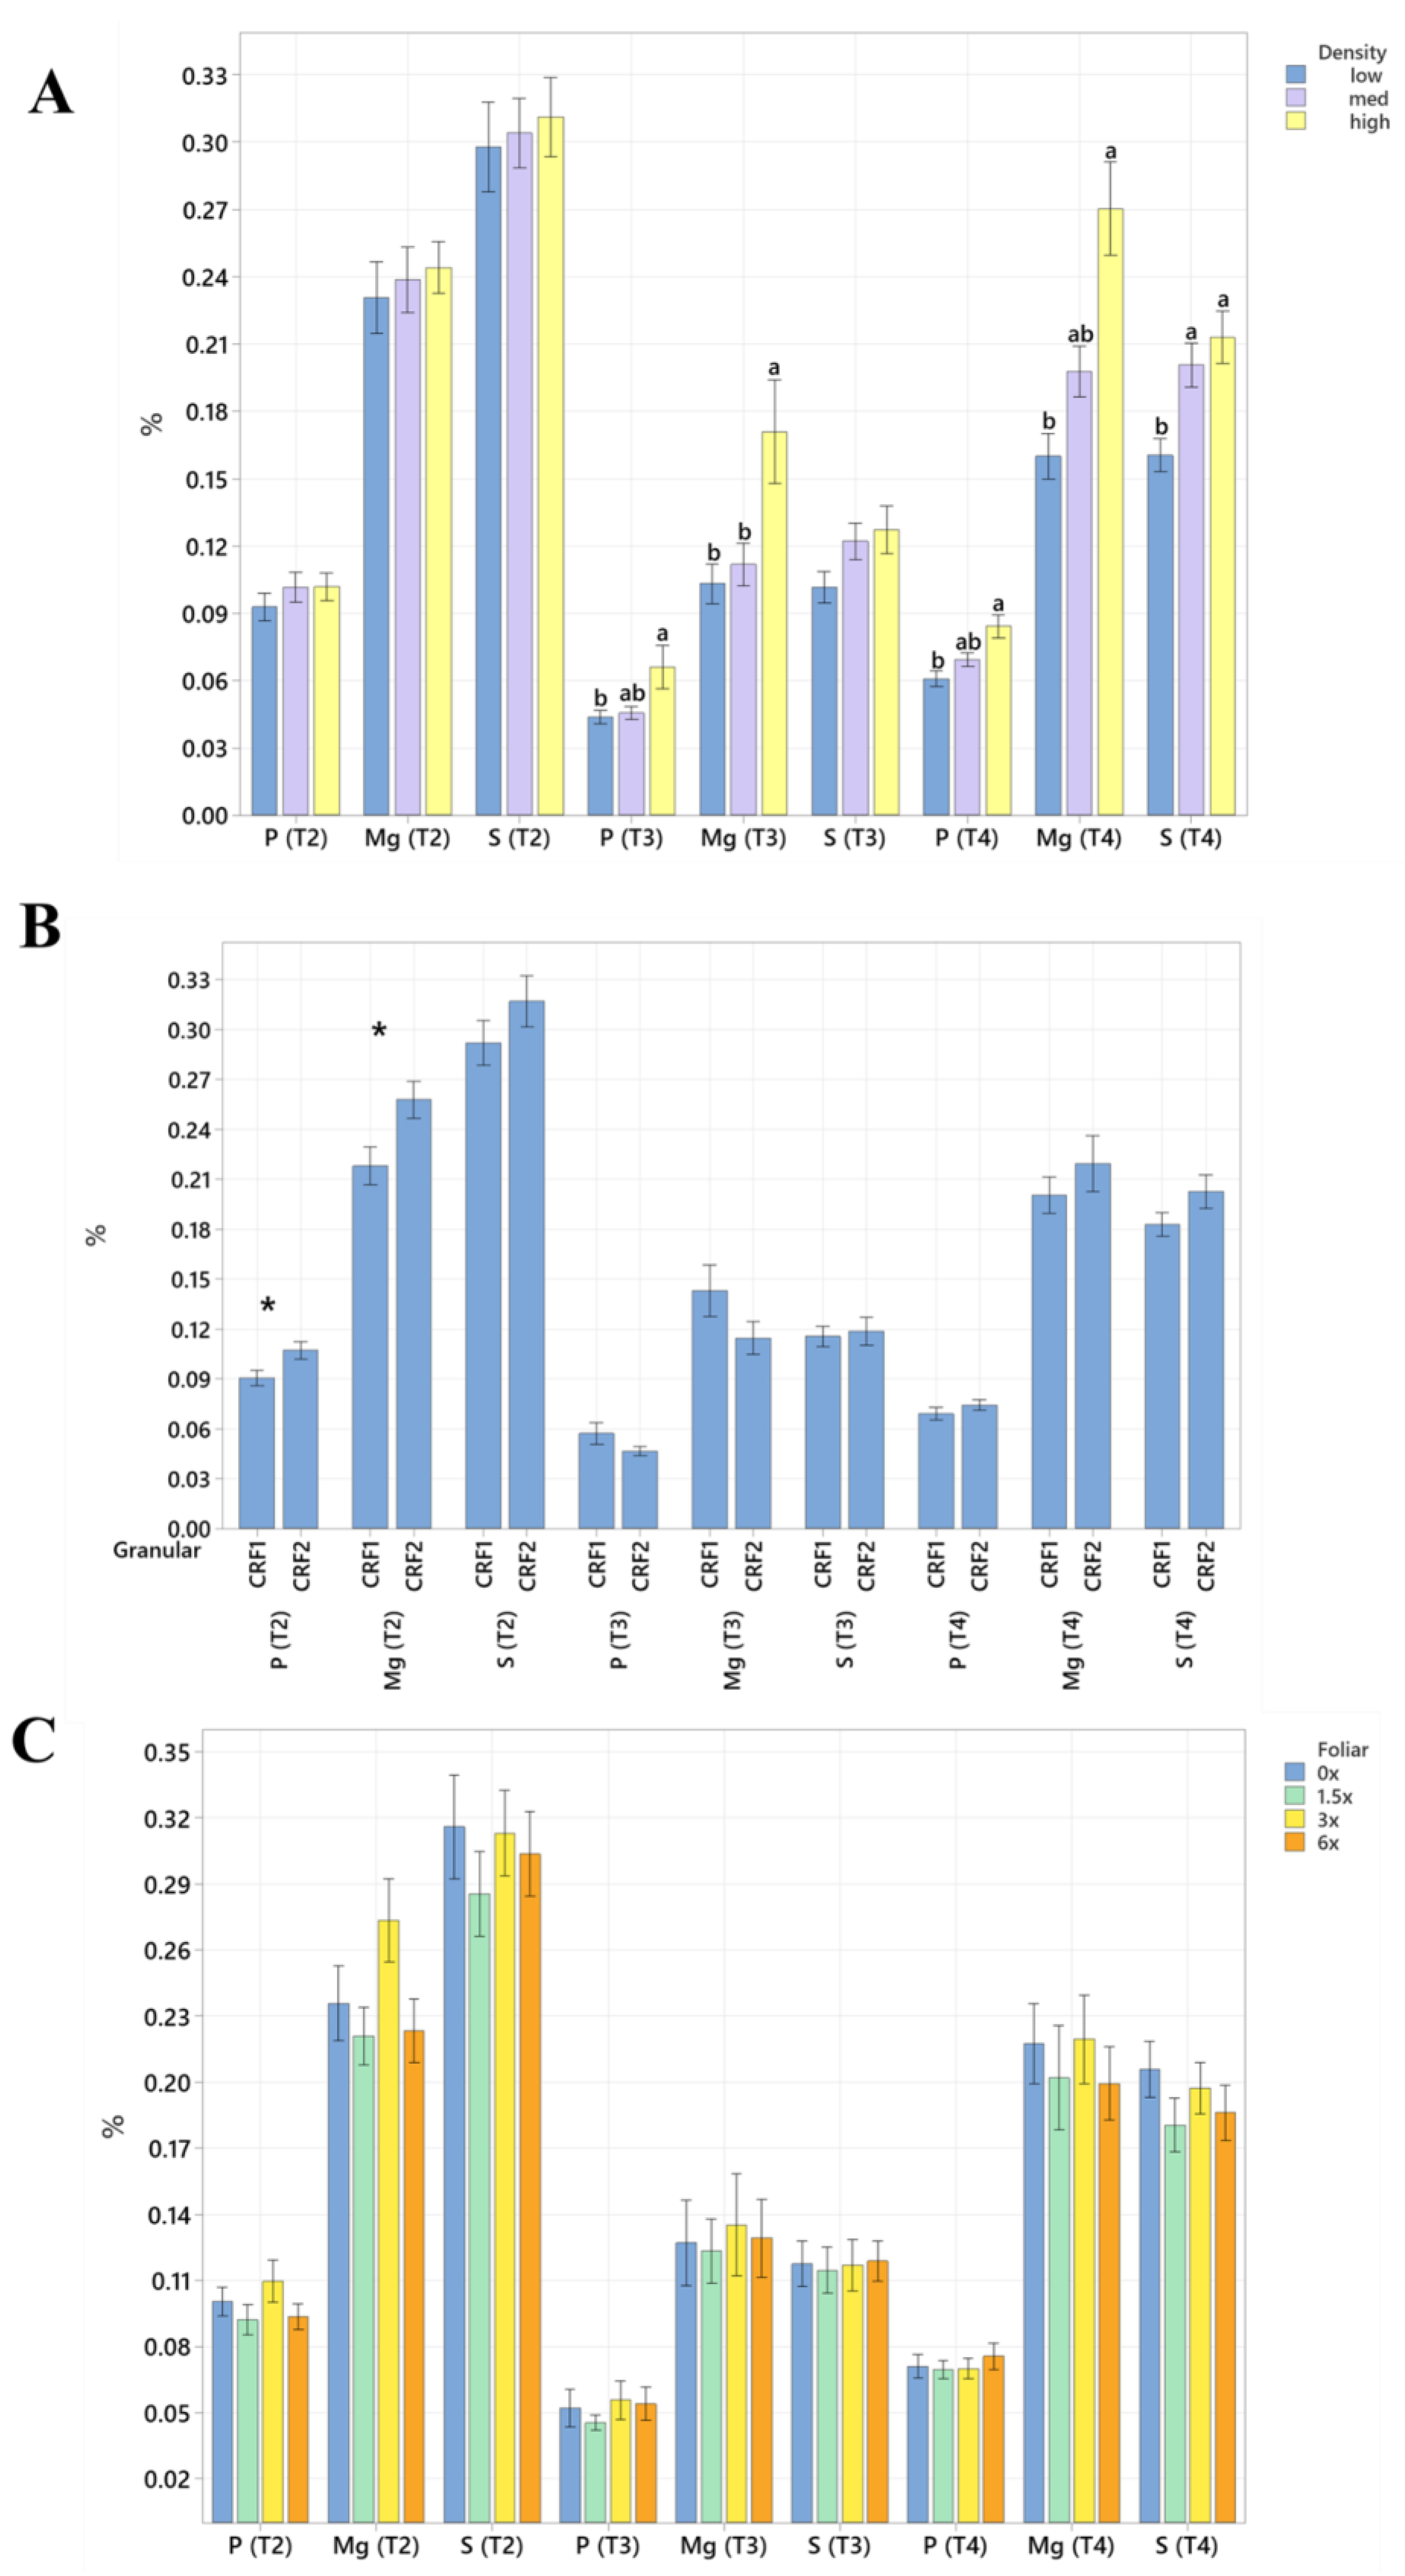
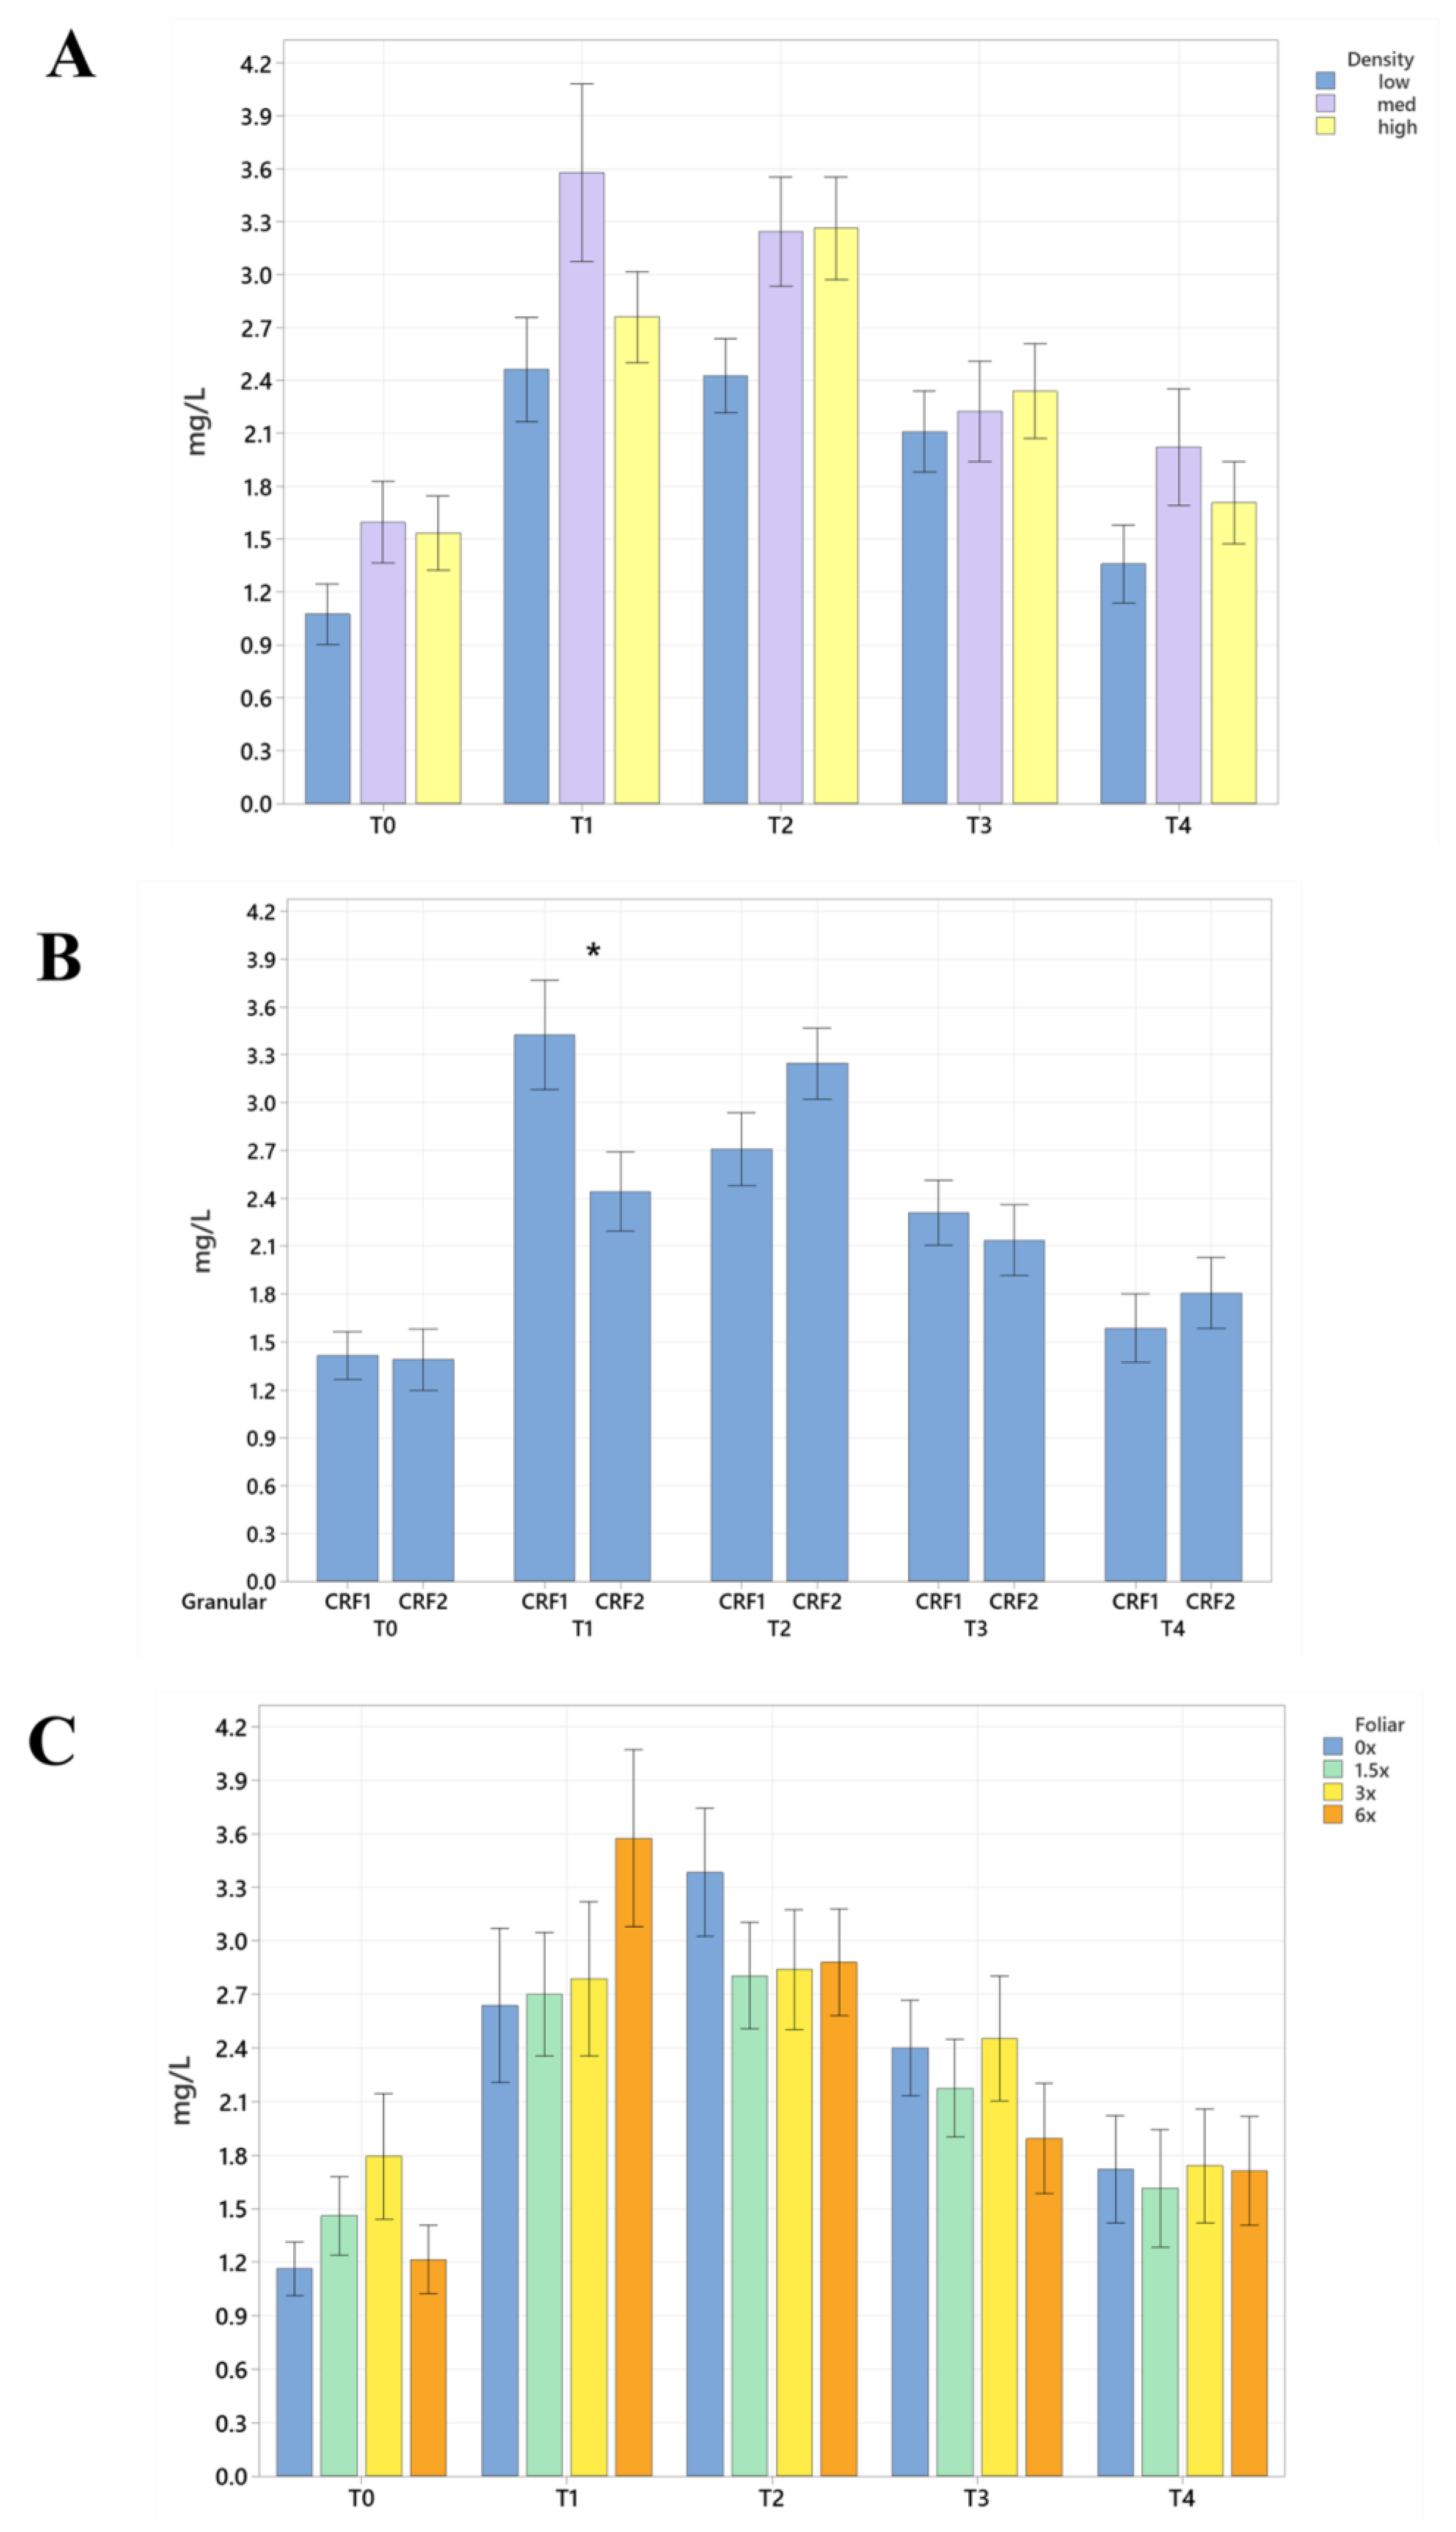
Figure 1.
Soil macronutrient concentrations of ‘Ray Ruby’ grapefruit grafted on ‘Kuharske’ citrange planted in flatwood soils located in Fort Pierce, FL, USA, in response to (A) planting density, (B) ground-applied fertilizer and (C) foliar fertilizer treatments during September 2020 (T0), January 2021 (T1), May 2021 (T2), September 2021 (T3) and January 2022 (T4). Bars are ± standard deviation of the mean. Treatments with * and different letters were considered to be significantly different (p < 0.05).
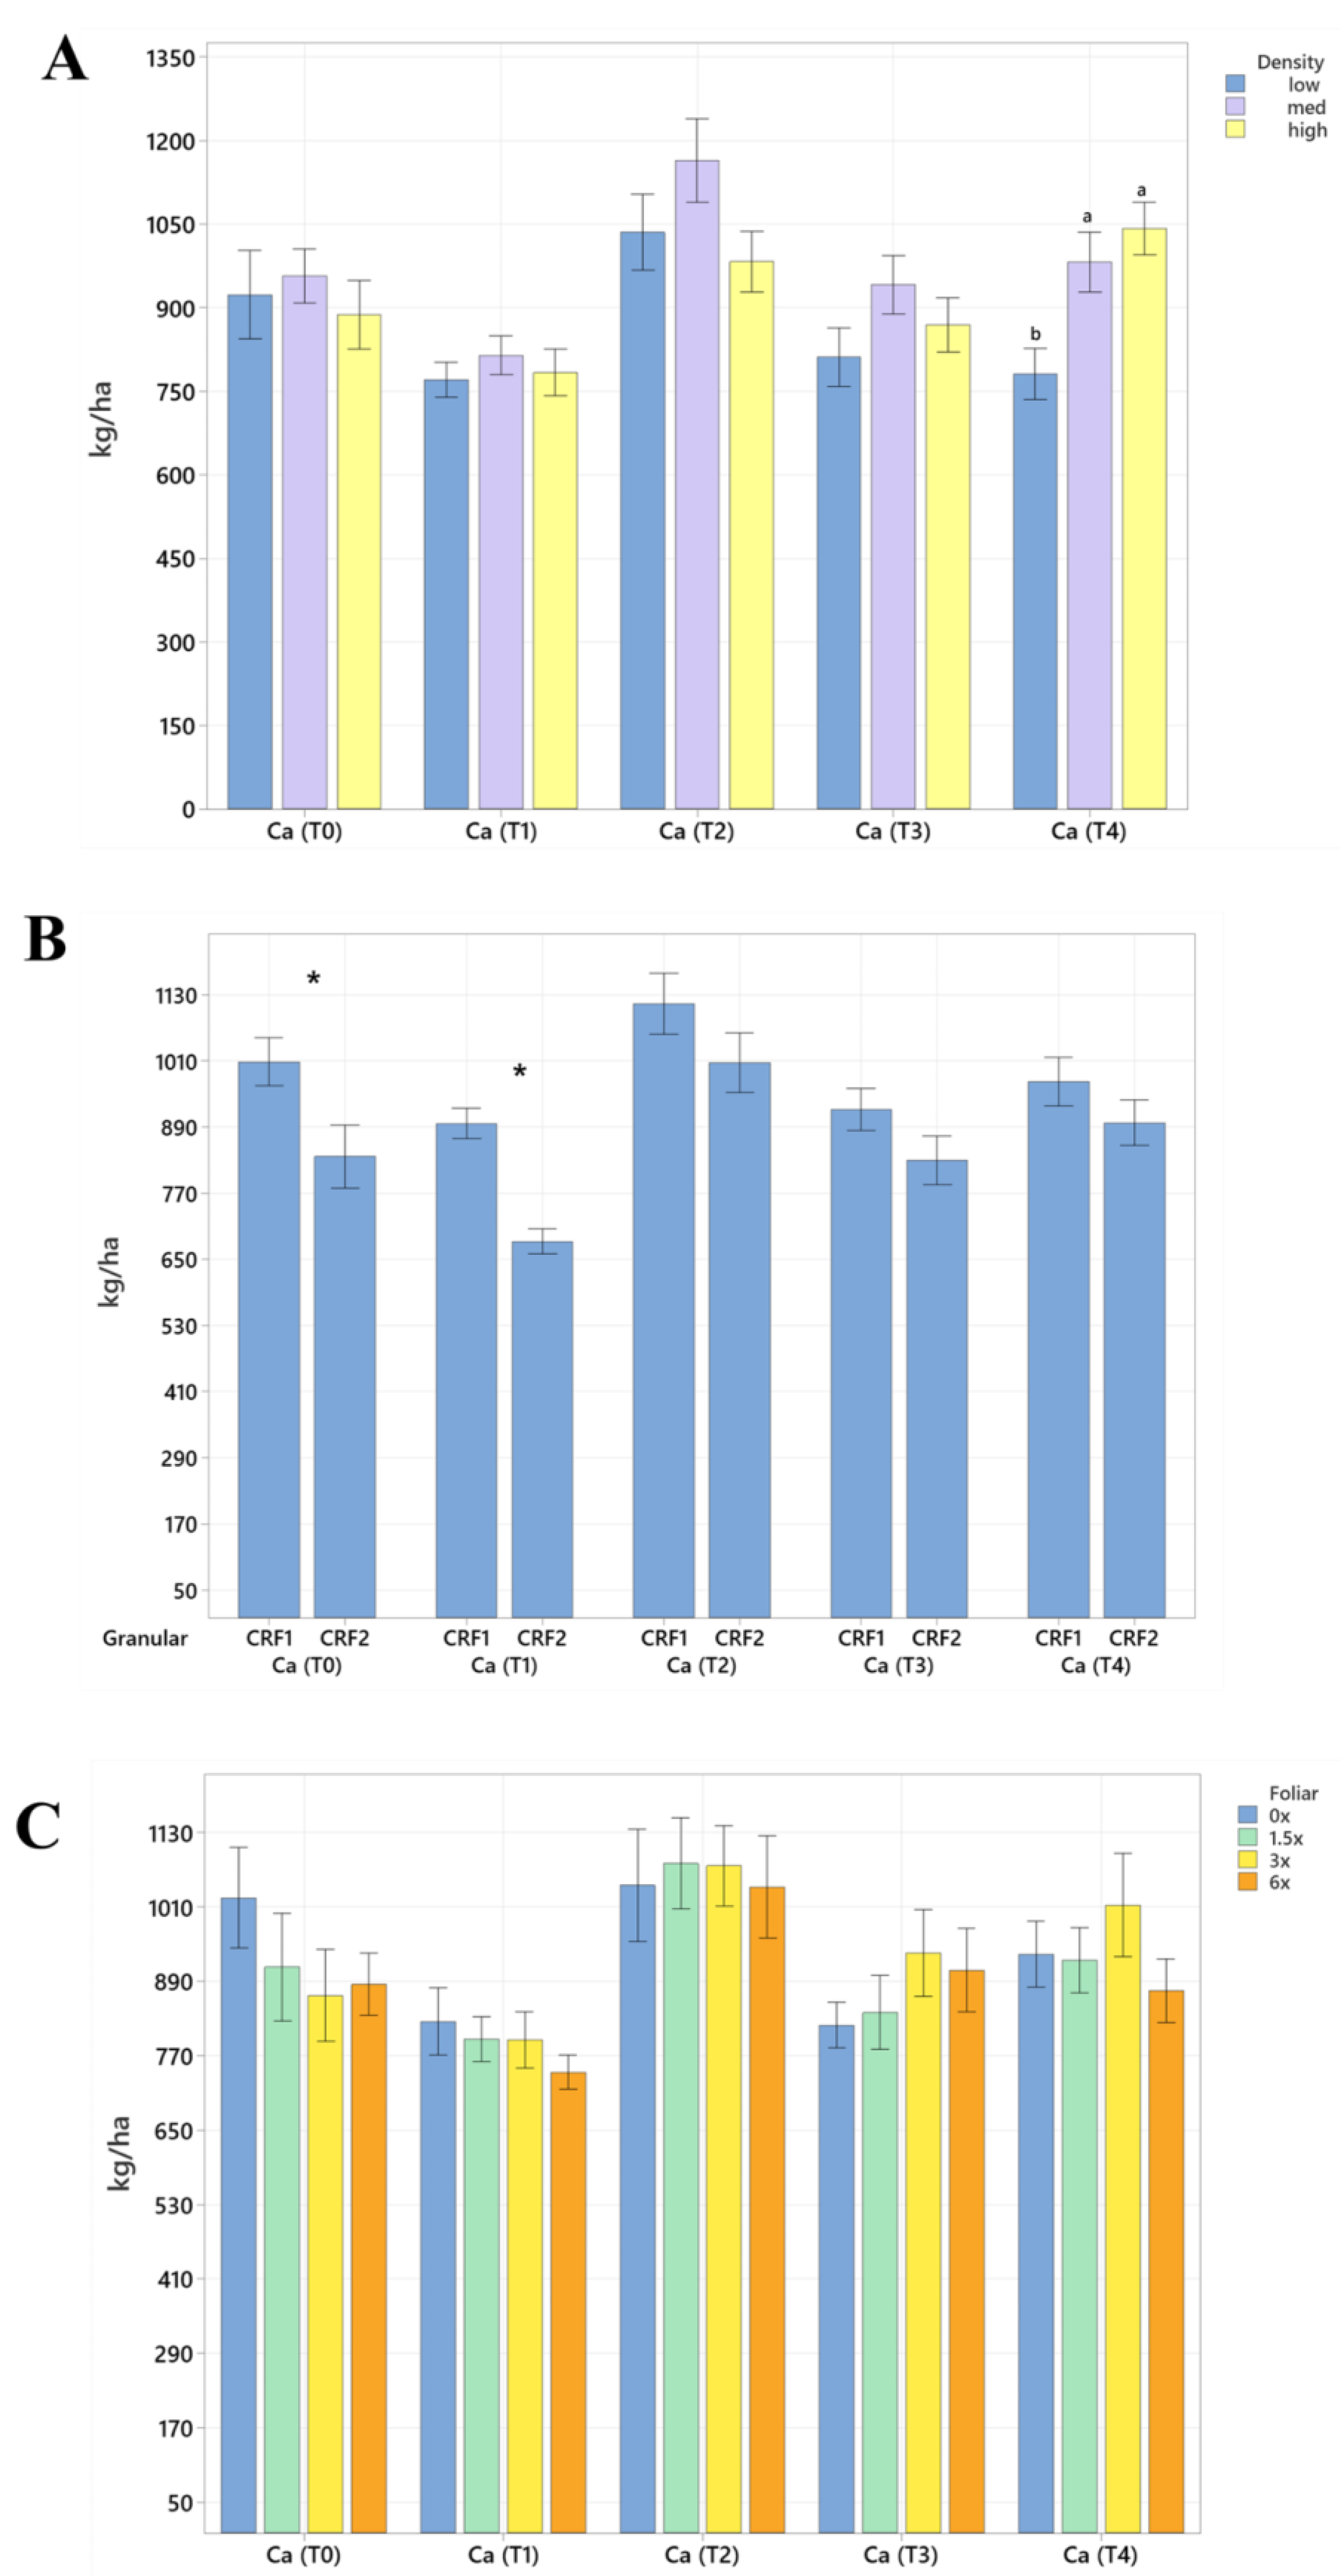
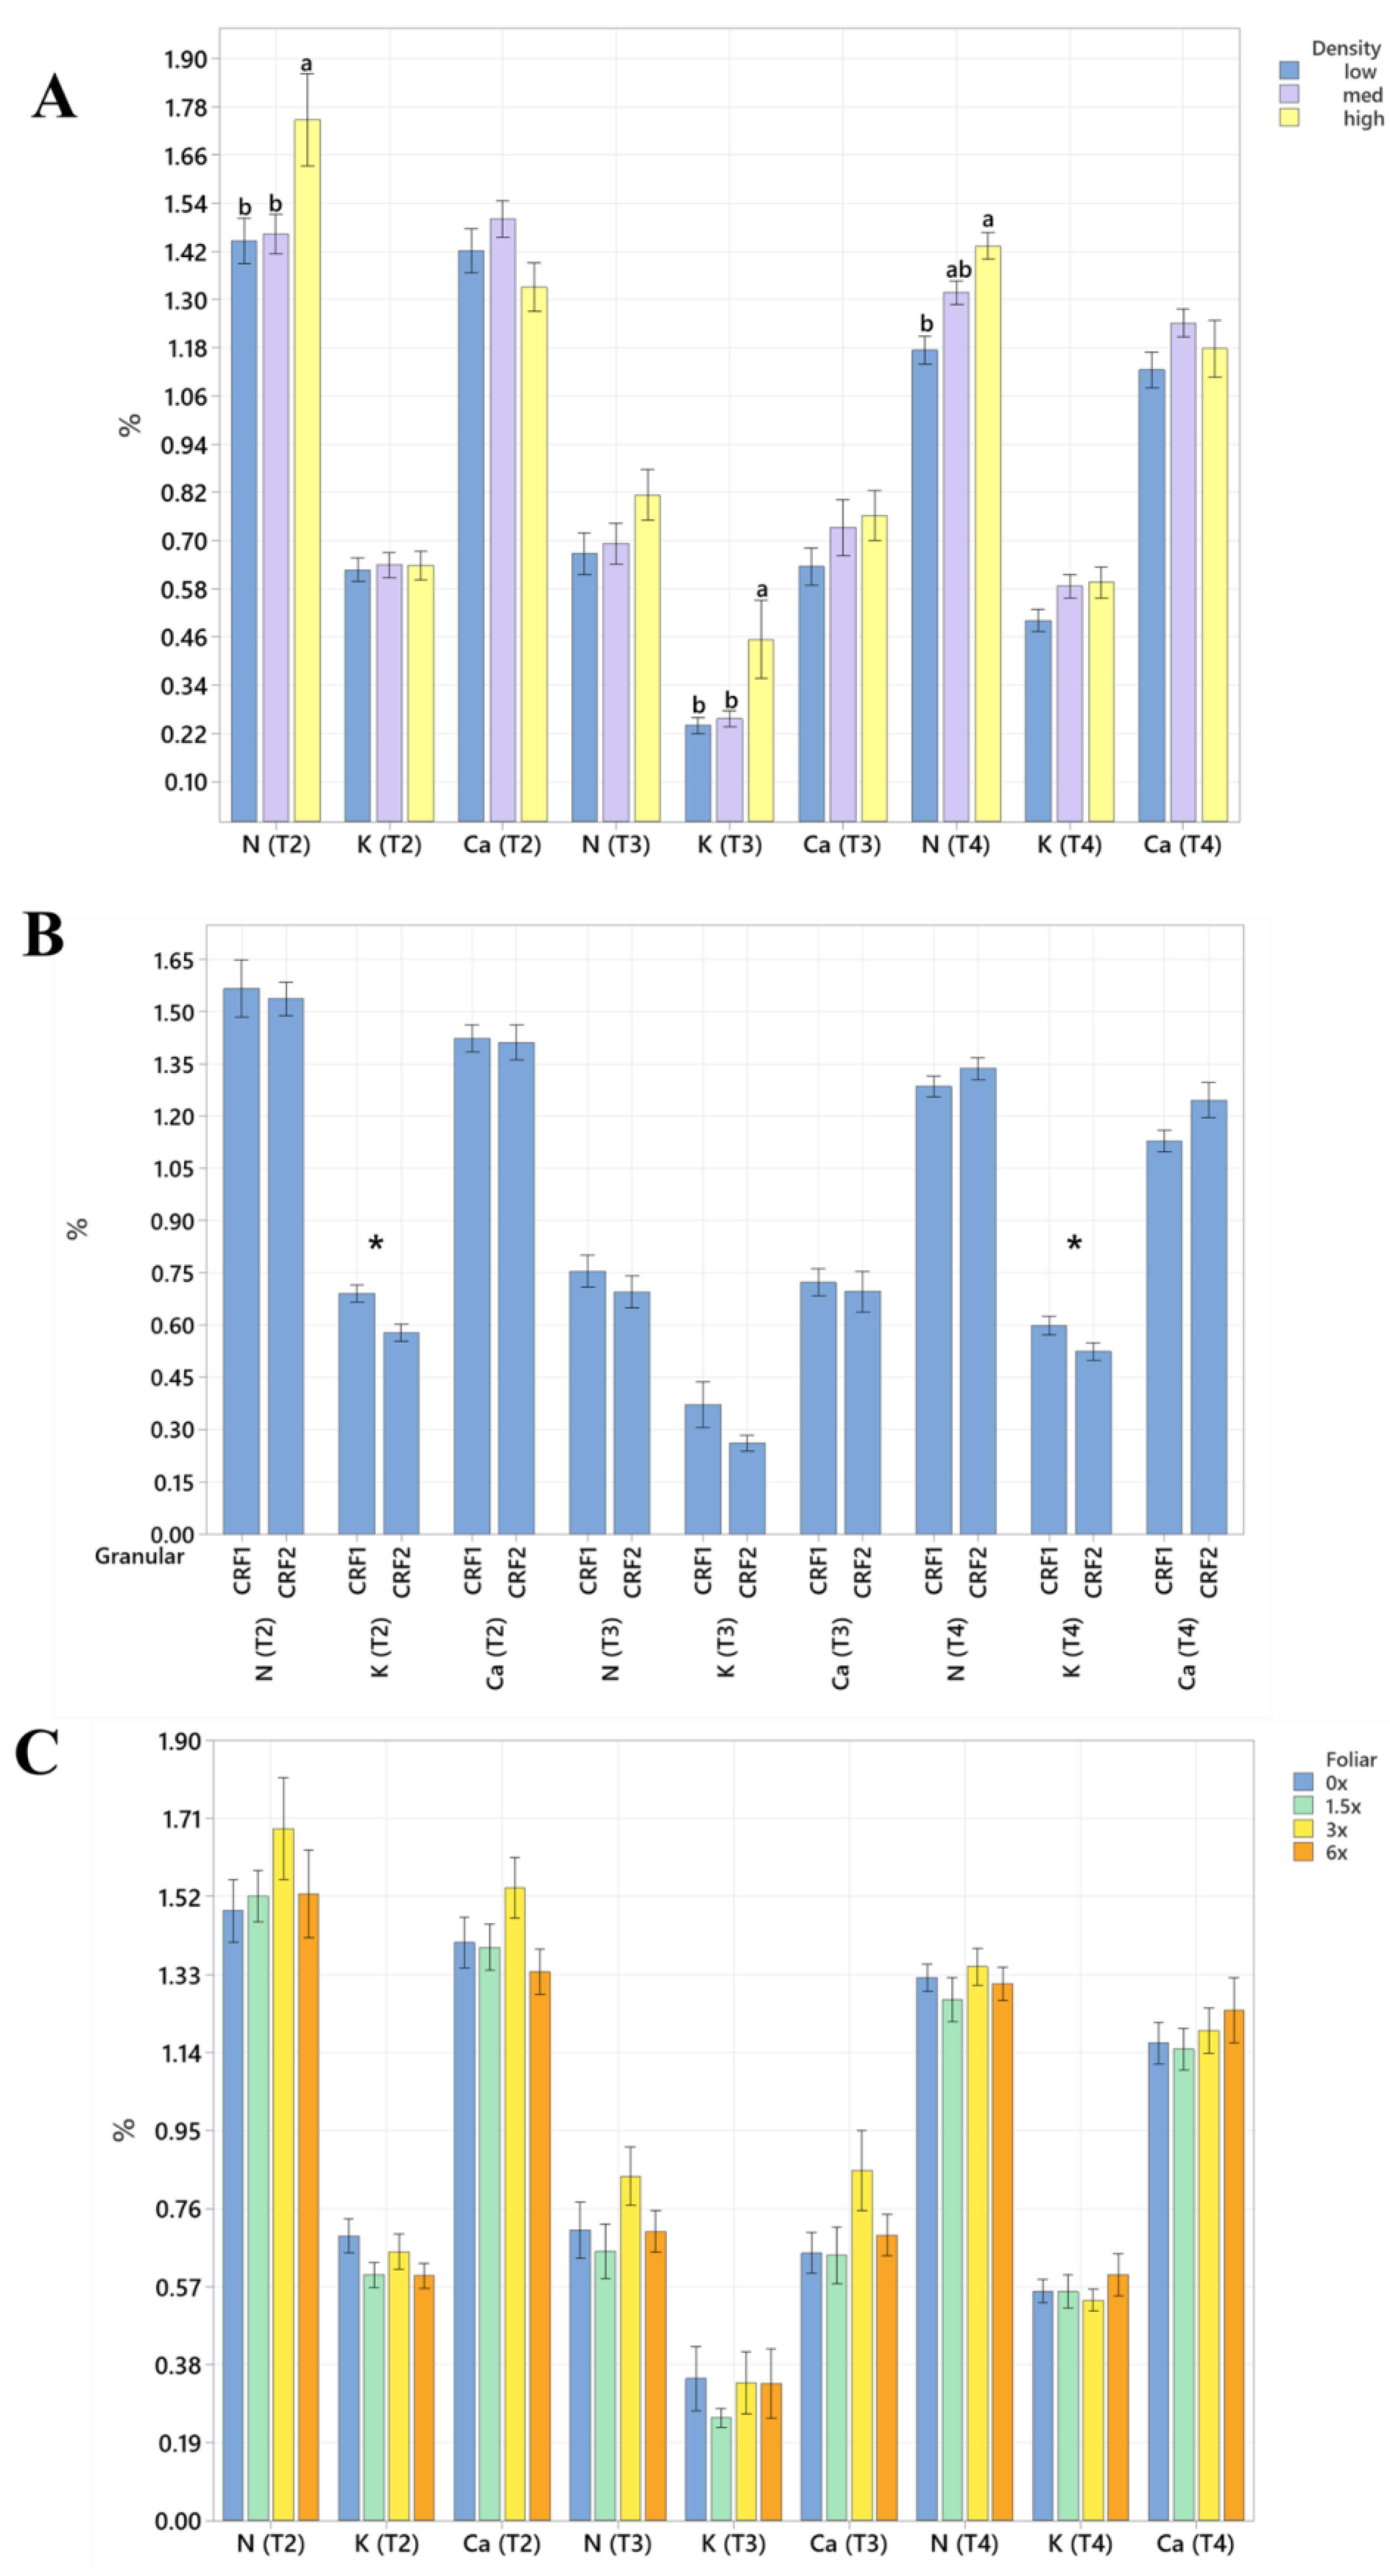
Figure 2.
Soil Ca concentrations of ‘Ray Ruby’ grapefruit grafted on ‘Kuharske’ citrange planted in flatwood soils located in Fort Pierce, FL, USA, in response to (A) planting density, (B) ground-applied fertilizer and (C) foliar fertilizer treatments during September 2020 (T0), January 2021 (T1), May 2021 (T2), September 2021 (T3) and January 2022 (T4). Bars are ± standard deviation of the mean. Treatments with * and different letters were considered to be significantly different (p < 0.05).
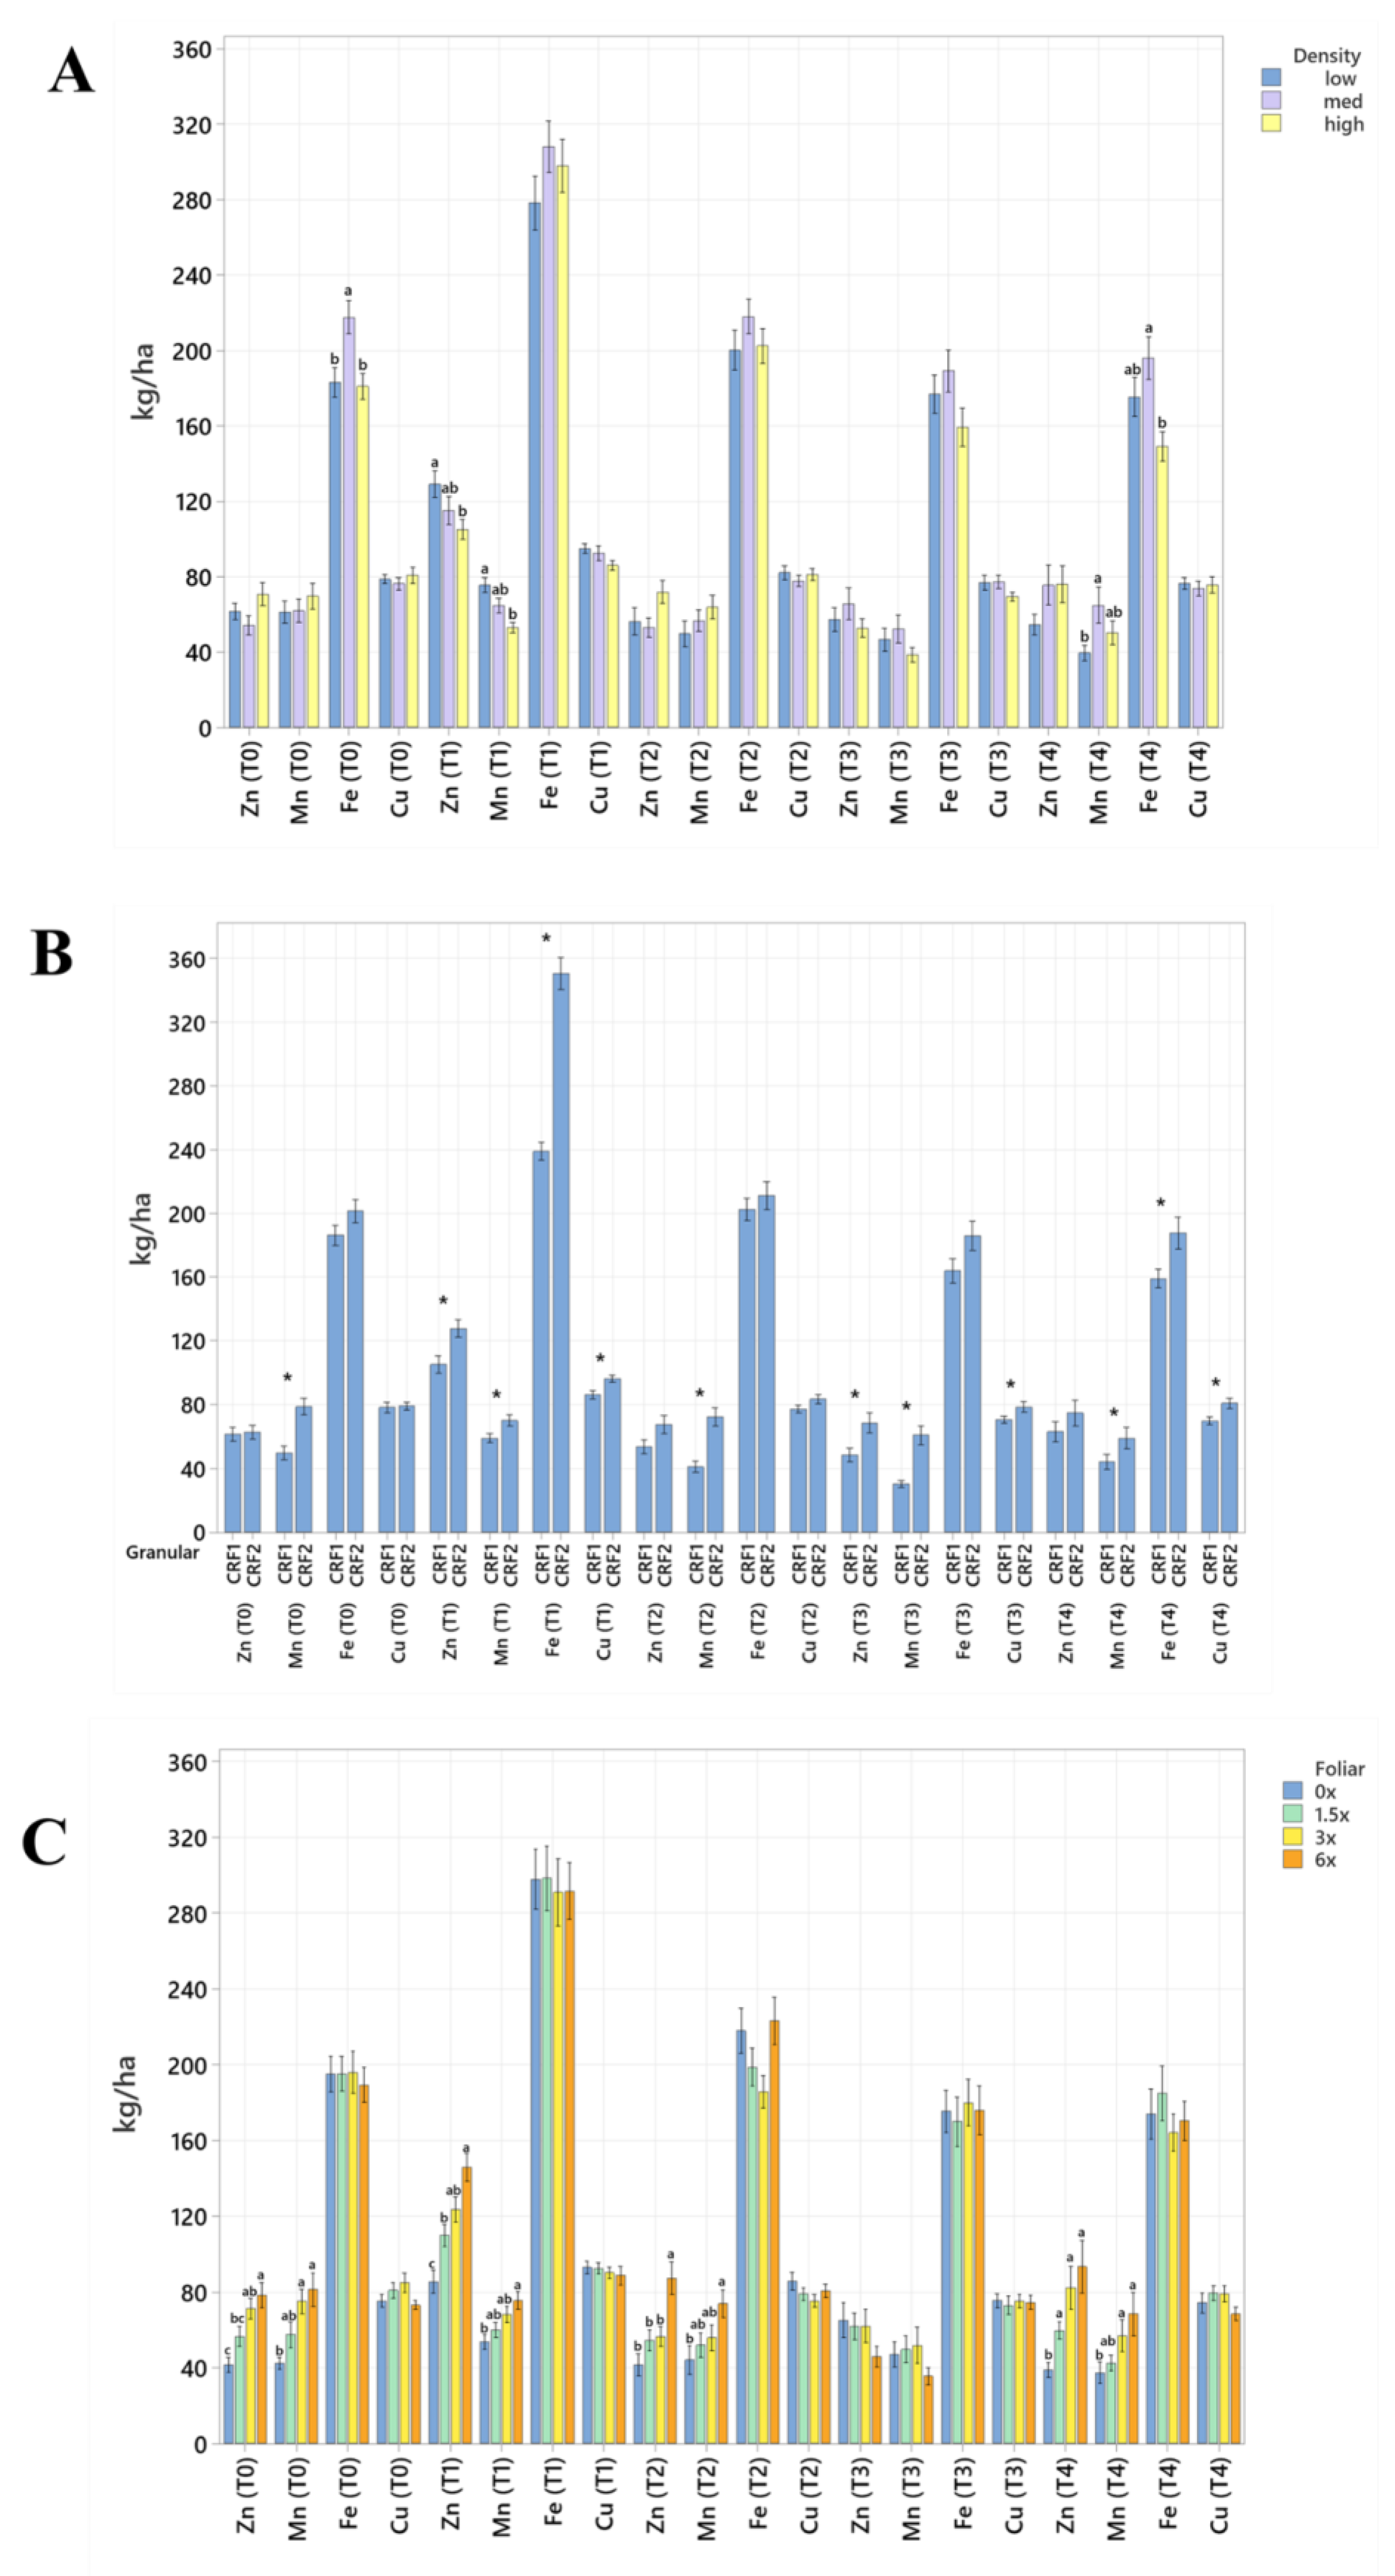
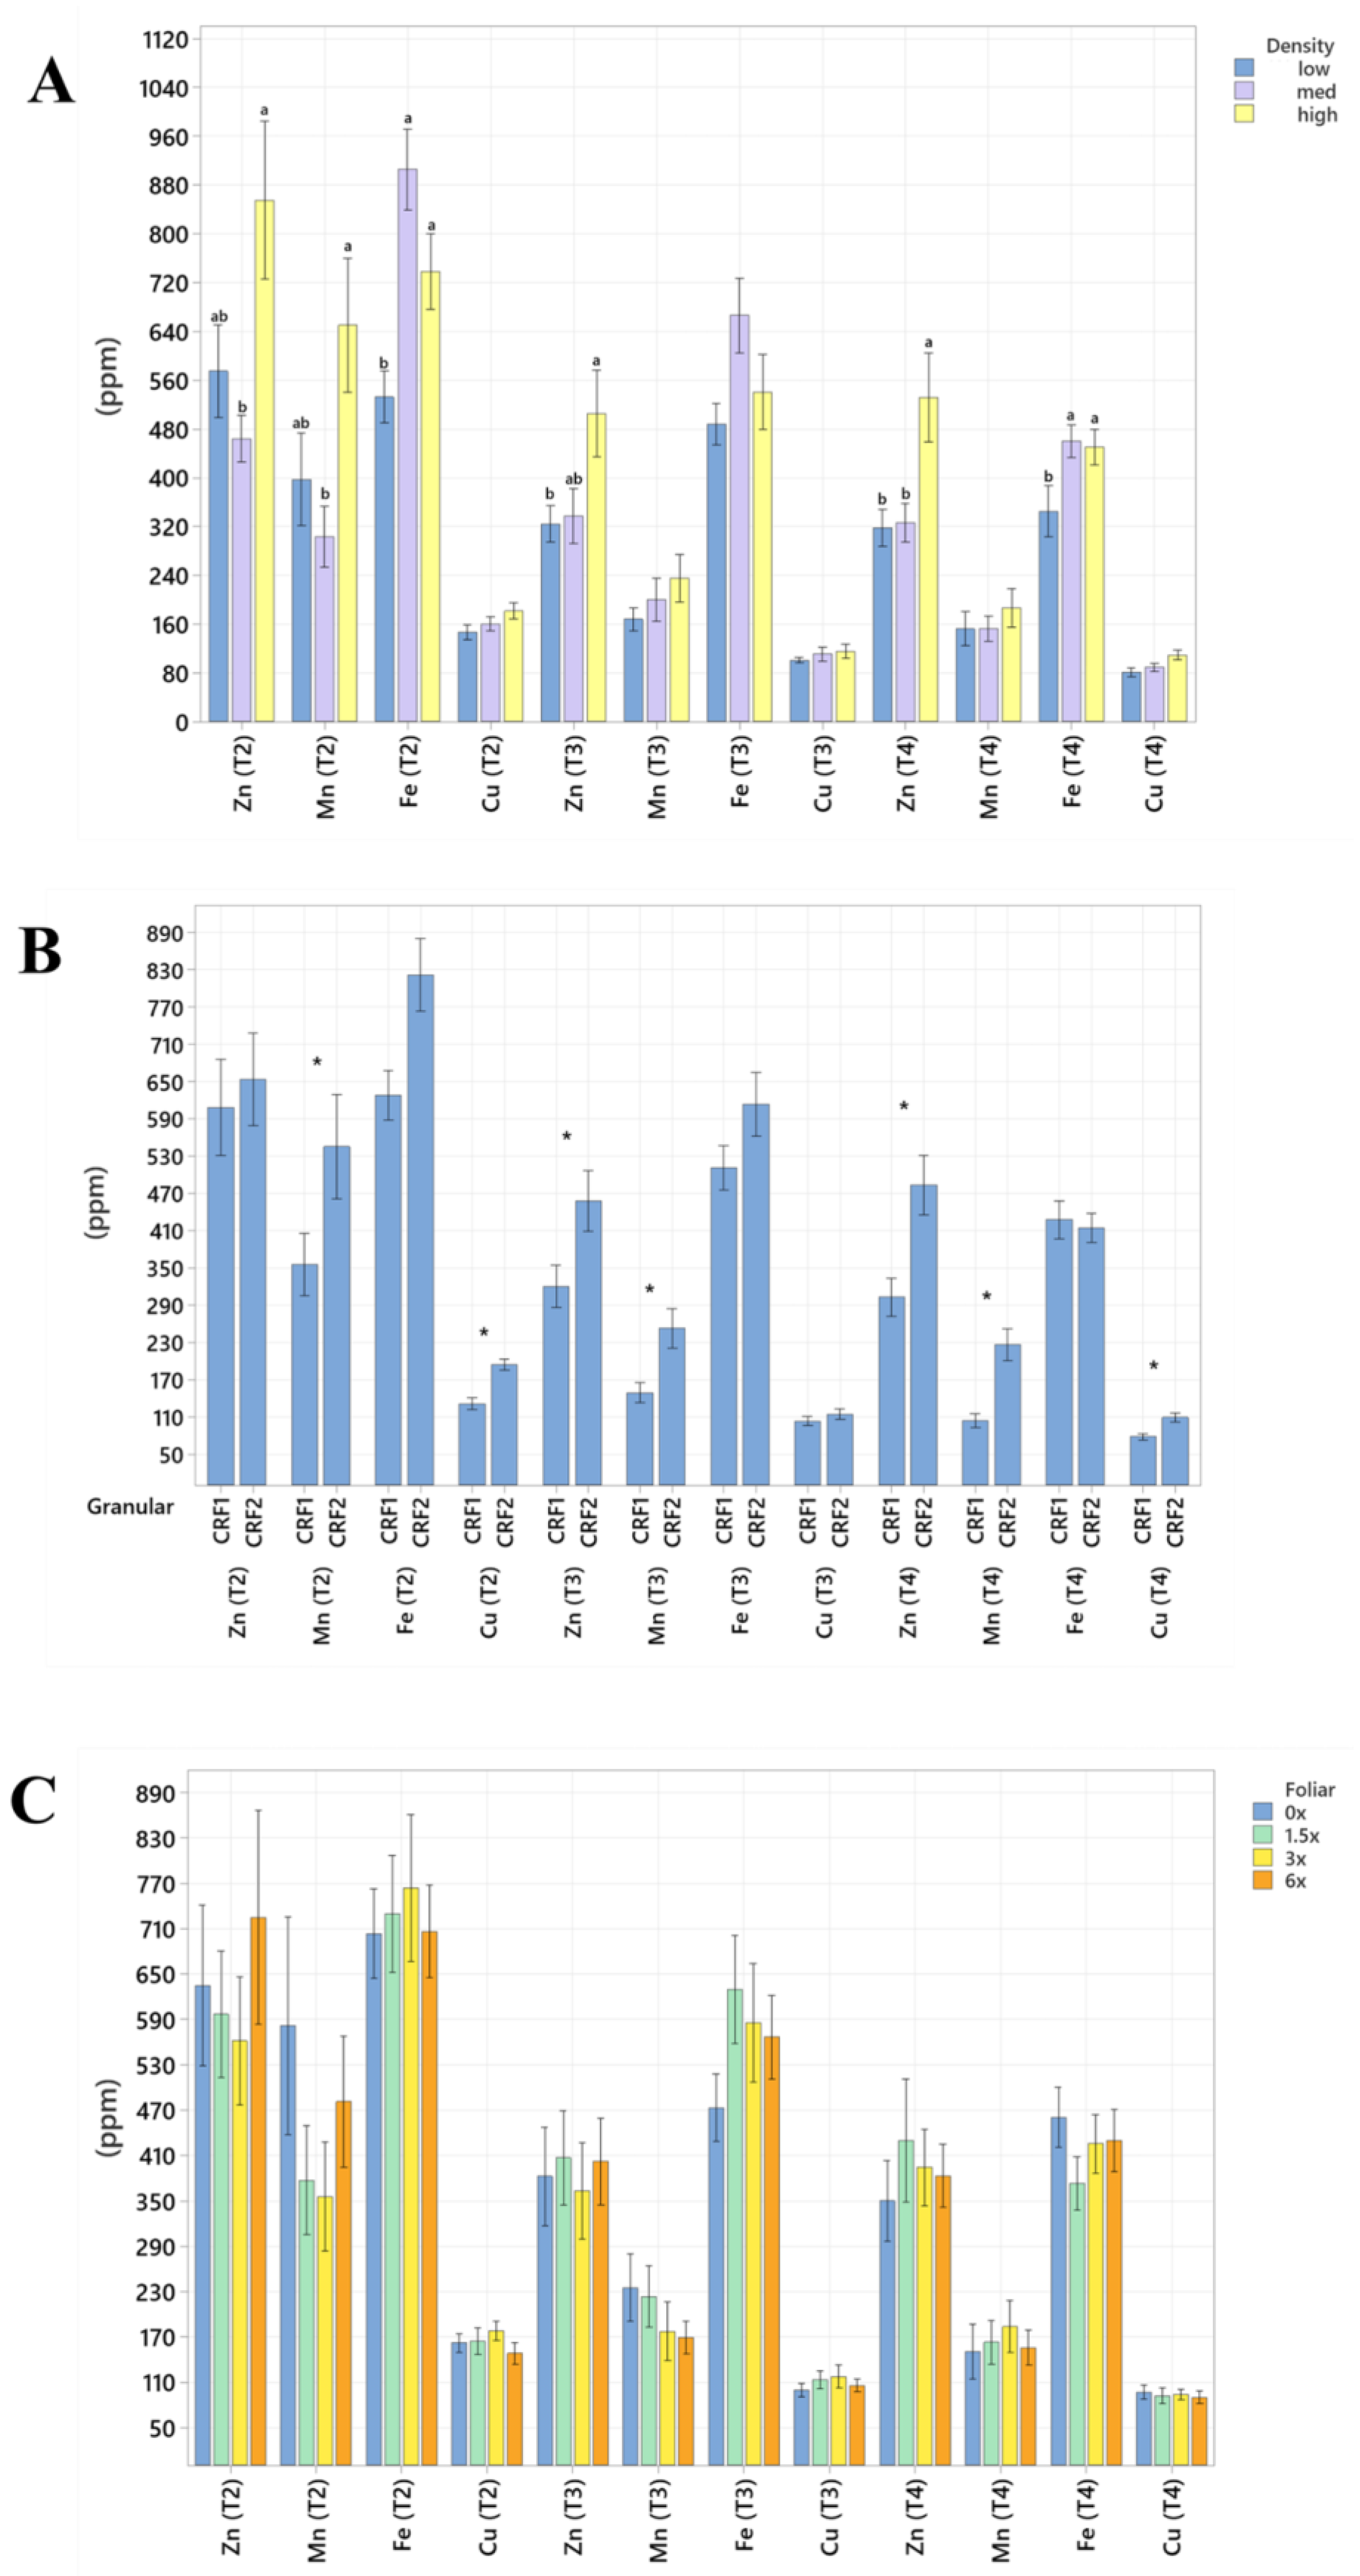
Figure 3.
Soil micronutrient concentrations of ‘Ray Ruby’ grapefruit grafted on ‘Kuharske’ citrange planted in flatwood soils located in Fort Pierce, FL, USA, in response to (A) planting density, (B) ground-applied fertilizer and (C) foliar fertilizer treatments during September 2020 (T0), January 2021 (T1), May 2021 (T2), September 2021 (T3) and January 2022 (T4). Bars are ± standard deviation of the mean. Treatments with * and different letters were considered to be significantly different (p < 0.05).
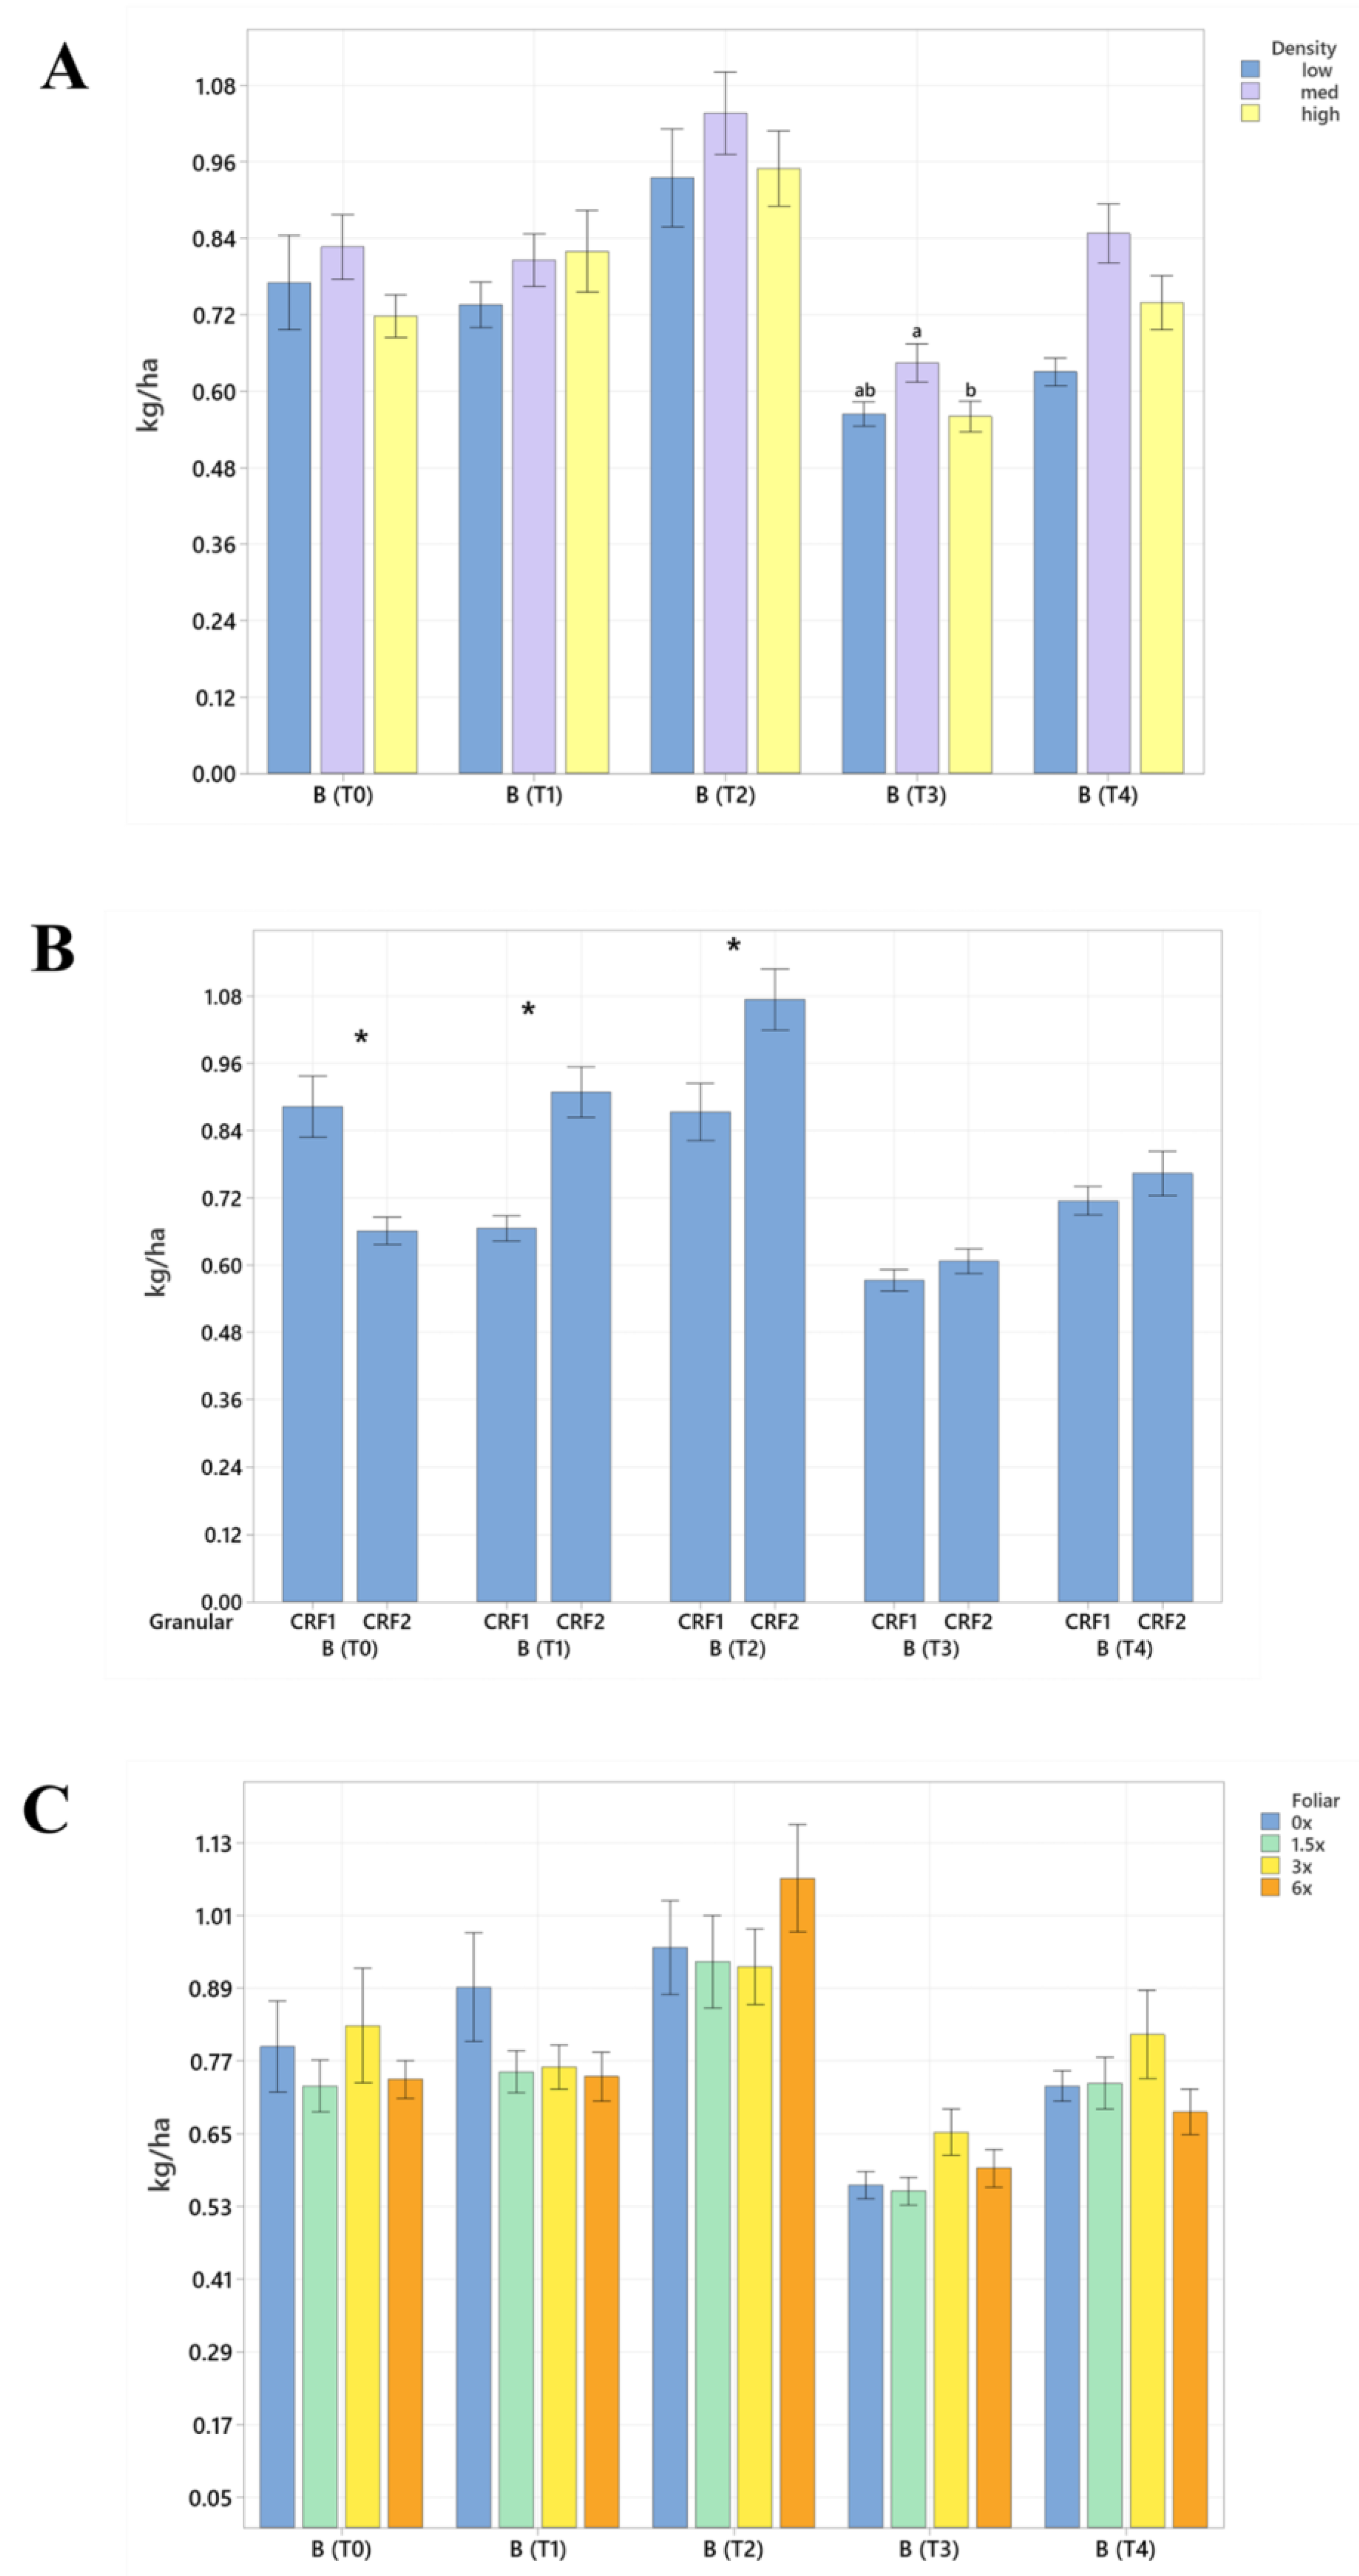
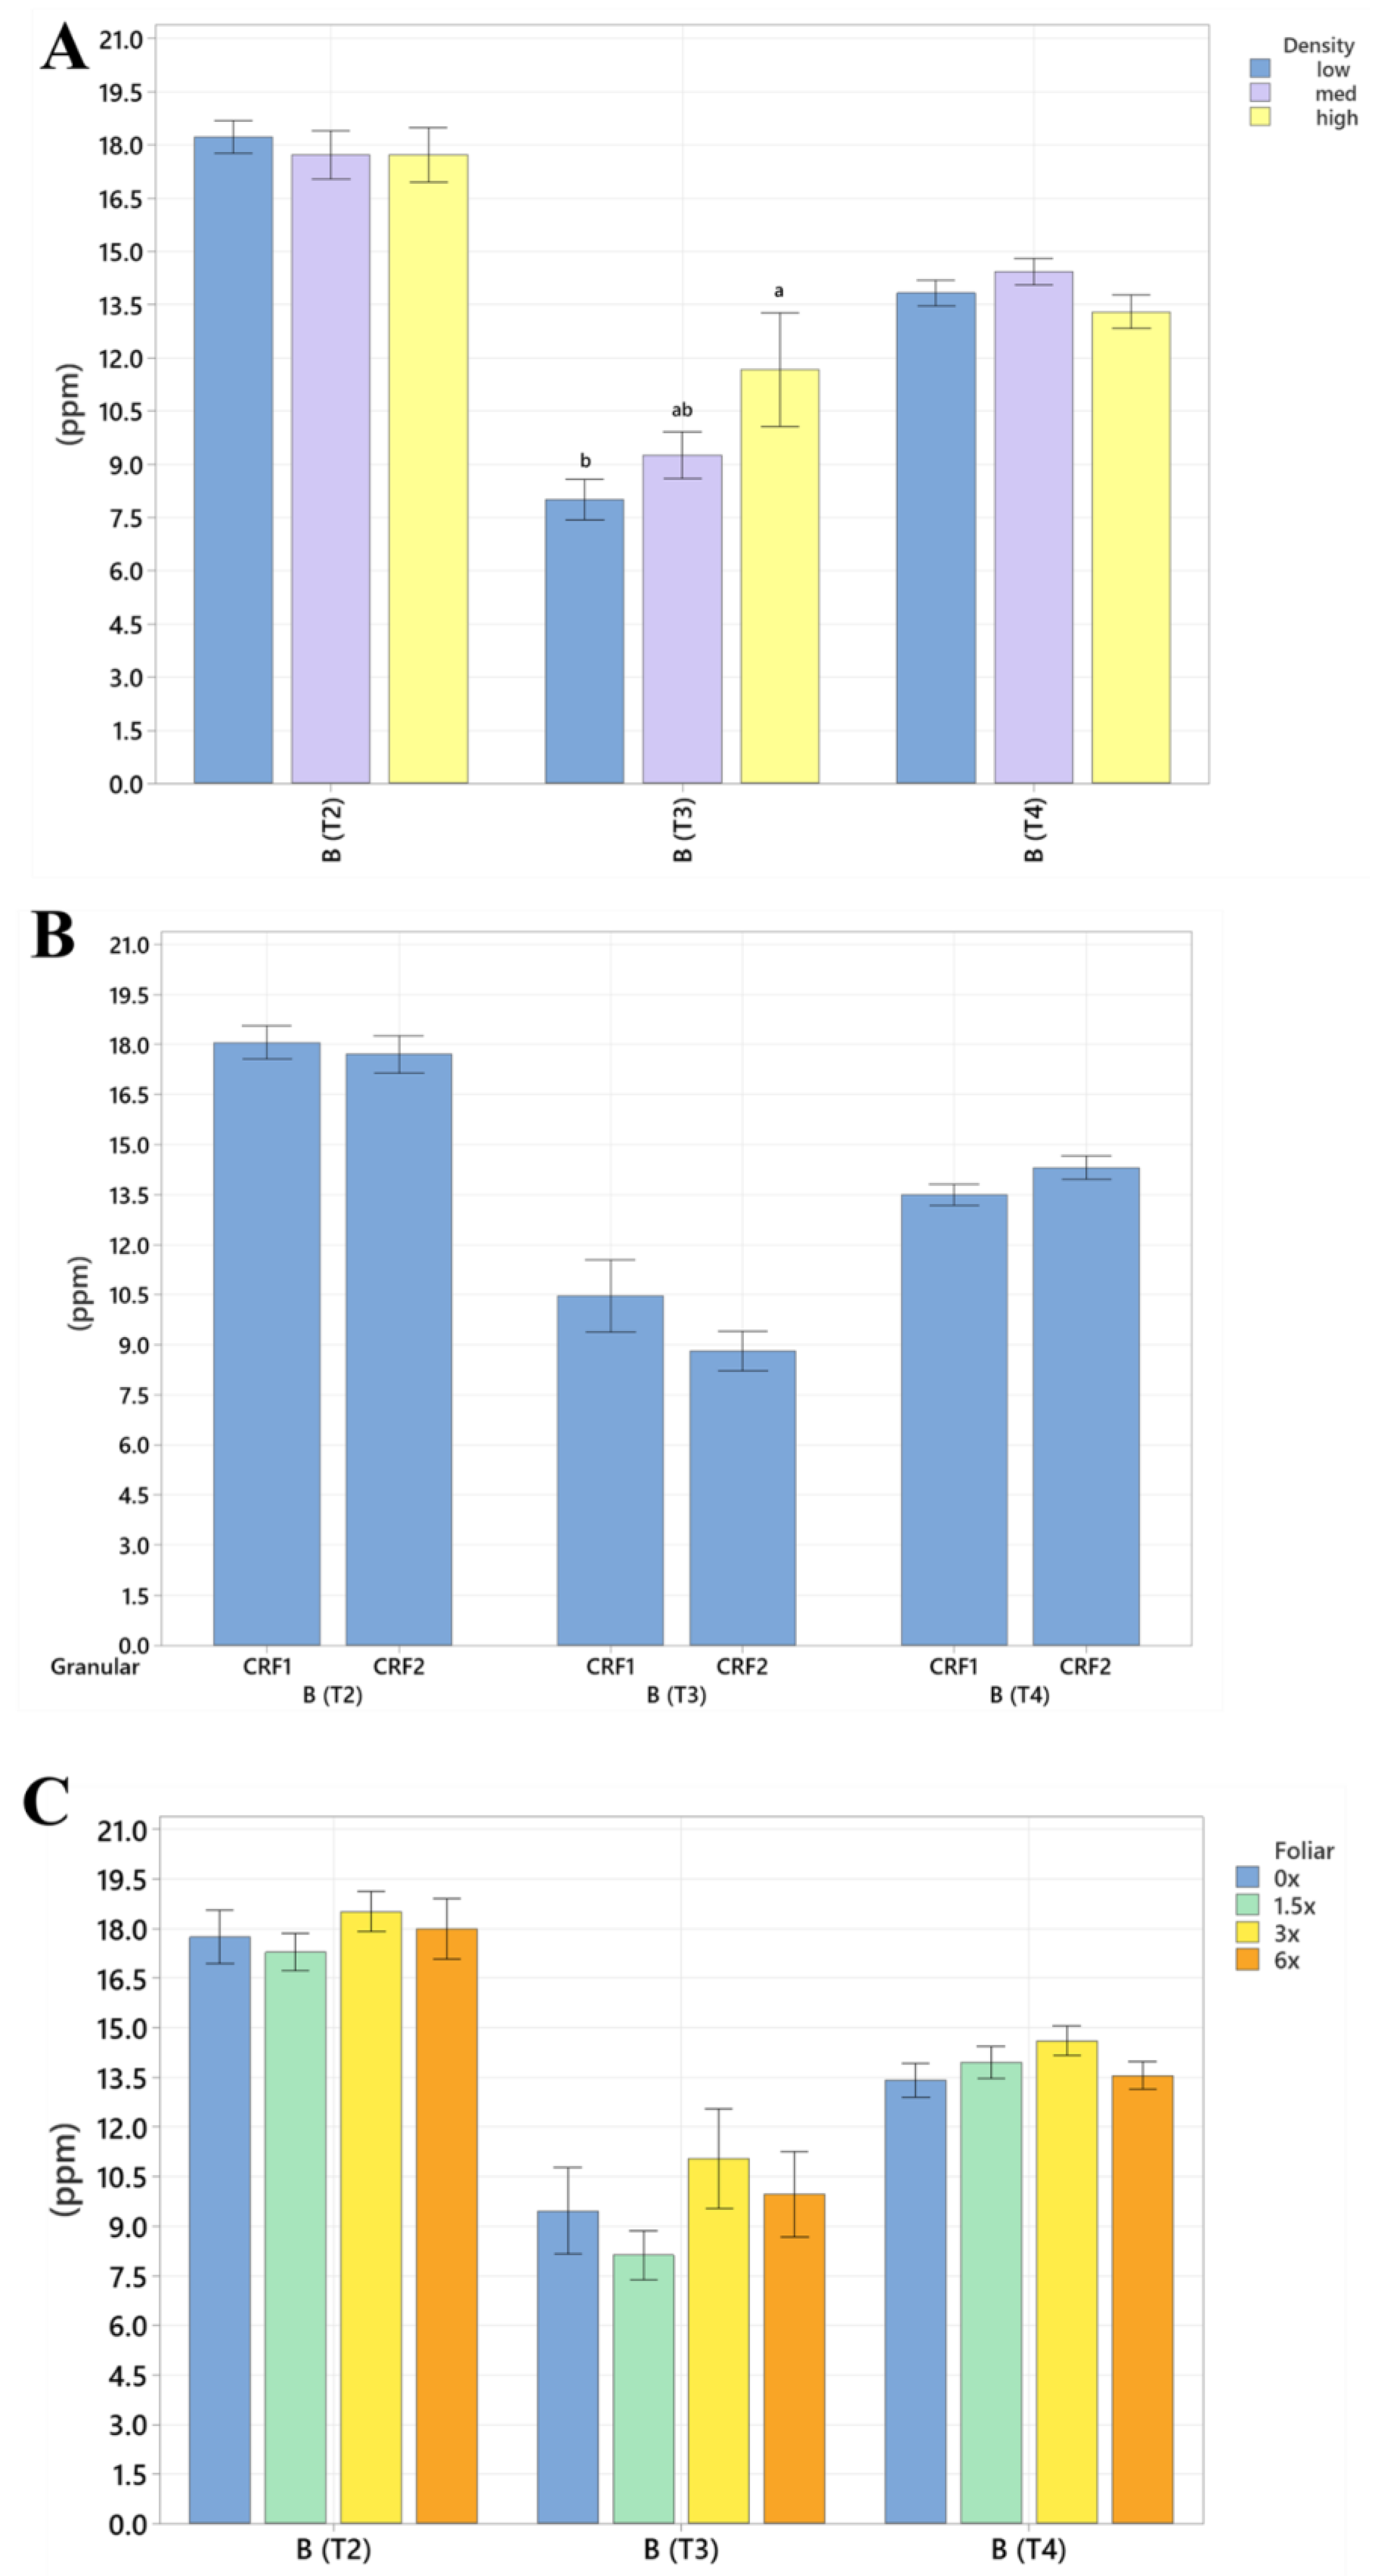
Figure 4.
Soil boron concentrations of ‘Ray Ruby’ grapefruit grafted on ‘Kuharske’ citrange planted in flatwood soils located in Fort Pierce, FL, USA, in response to (A) planting density, (B) ground-applied fertilizer and (C) foliar fertilizer treatments during September 2020 (T0), January 2021 (T1), May 2021 (T2), September 2021 (T3) and January 2022 (T4). Bars are ± standard deviation of the mean. Treatments with * and different letters were considered to be significantly different (p < 0.05).
Figure 5.
Root P, Mg and S concentrations of ‘Ray Ruby’ grapefruit grafted on ‘Kuharske’ citrange planted in flatwood soils located in Fort Pierce, FL, USA. Graphs indicate response to (A) planting density, (B) ground-applied fertilizer and (C) foliar fertilizer treatments during May 2021 (T2), September 2021 (T3) and January 2022 (T4). Bars are ± standard deviation of the mean. Treatments with * and different letters were considered to be significantly different (p < 0.05).
Figure 6.
Root N, K and Ca concentrations of ‘Ray Ruby’ grapefruit grafted on ‘Kuharske’ citrange planted in flatwood soils located in Fort Pierce, FL, USA. Graphs indicate response to (A) planting density, (B) ground-applied fertilizer and (C) foliar fertilizer treatments during May 2021 (T2), September 2021 (T3) and January 2022 (T4). Bars are ± standard deviation of the mean. Treatments with * and different letters were considered to be significantly different (p < 0.05).
Figure 7.
Root micronutrient concentrations of ‘Ray Ruby’ grapefruit grafted on ‘Kuharske’ citrange planted in flatwood soils located in Fort Pierce, FL, USA. Graphs indicate response to (A) planting density, (B) ground-applied fertilizer and (C) foliar fertilizer treatments during May 2021 (T2), September 2021 (T3) and January 2022 (T4). Bars are ± standard deviation of the mean, and treatments with * and different letters were considered to be significantly different (p < 0.05).
Figure 8.
Root B concentrations of ‘Ray Ruby’ grapefruit grafted on ‘Kuharske’ citrange planted in flatwood soils located in Fort Pierce, FL, USA. Graphs indicate response to (A) planting density, (B) ground-applied fertilizer and (C) foliar fertilizer treatments during May 2021 (T2), September 2021 (T3) and January 2022 (T4). Bars are ± standard deviation of the mean, and treatments with different letters were considered to be significantly different (p < 0.05).
Figure 9.
Root density of ‘Ray Ruby’ grapefruit grafted on ‘Kuharske’ citrange planted in flatwood soils located in Fort Pierce, FL, USA, in response to (A) planting density, (B) ground-applied fertilizer and (C) foliar fertilizer treatments during September 2020 (T0), January 2021 (T1), May 2021 (T2), September 2021 (T3) and January 2022 (T4). Bars are ± standard deviation of the mean, and treatments with * were considered to be significantly different (p < 0.05).
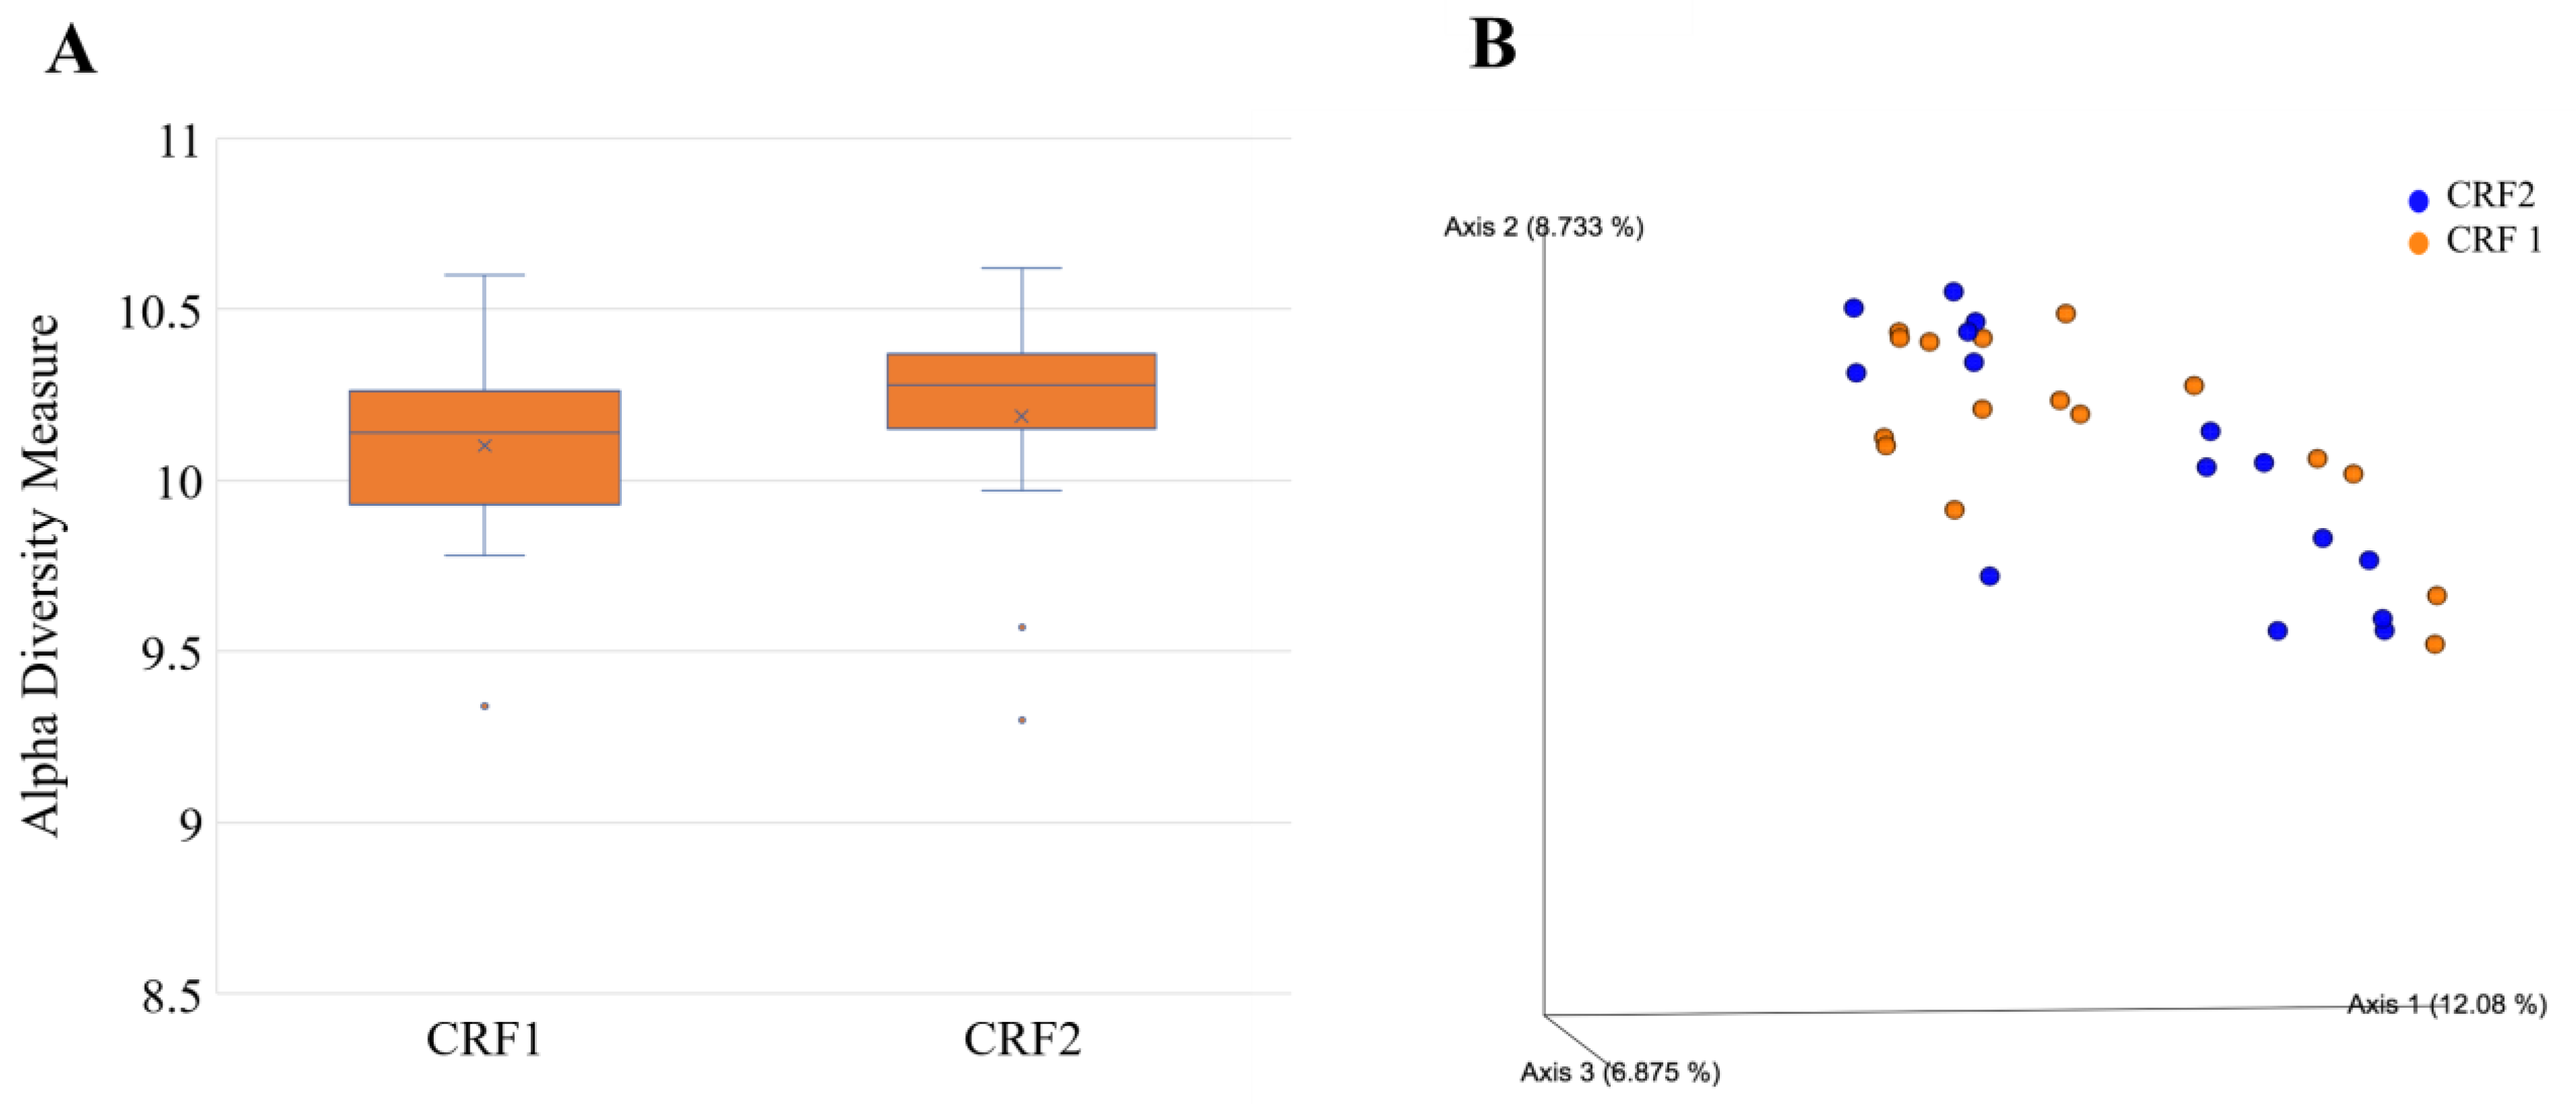
Figure 10.
Alpha (A) and beta diversity (B) in rhizosphere bacteria of ‘Ray Ruby’ grapefruit grafted on ‘Kuharske’ citrange planted in flatwood soils located in Fort Pierce, FL, USA, and grown with different ground-applied fertilizer treatments. Alpha diversity was measured using the Shannon index of rhizosphere bacteria among treatments. Plotted in Figure (A) are boxes (interquartile), the median (line within each box), the mean (× within each box), and whiskers (lowest and greatest values). Principal coordinates analysis (PCoA) based on the Bray–Curtis dissimilarity matrix of rhizosphere bacterial samples can be found in Figure (B), where colors indicate treatment and include CRF1 (orange) and CRF2 (blue).
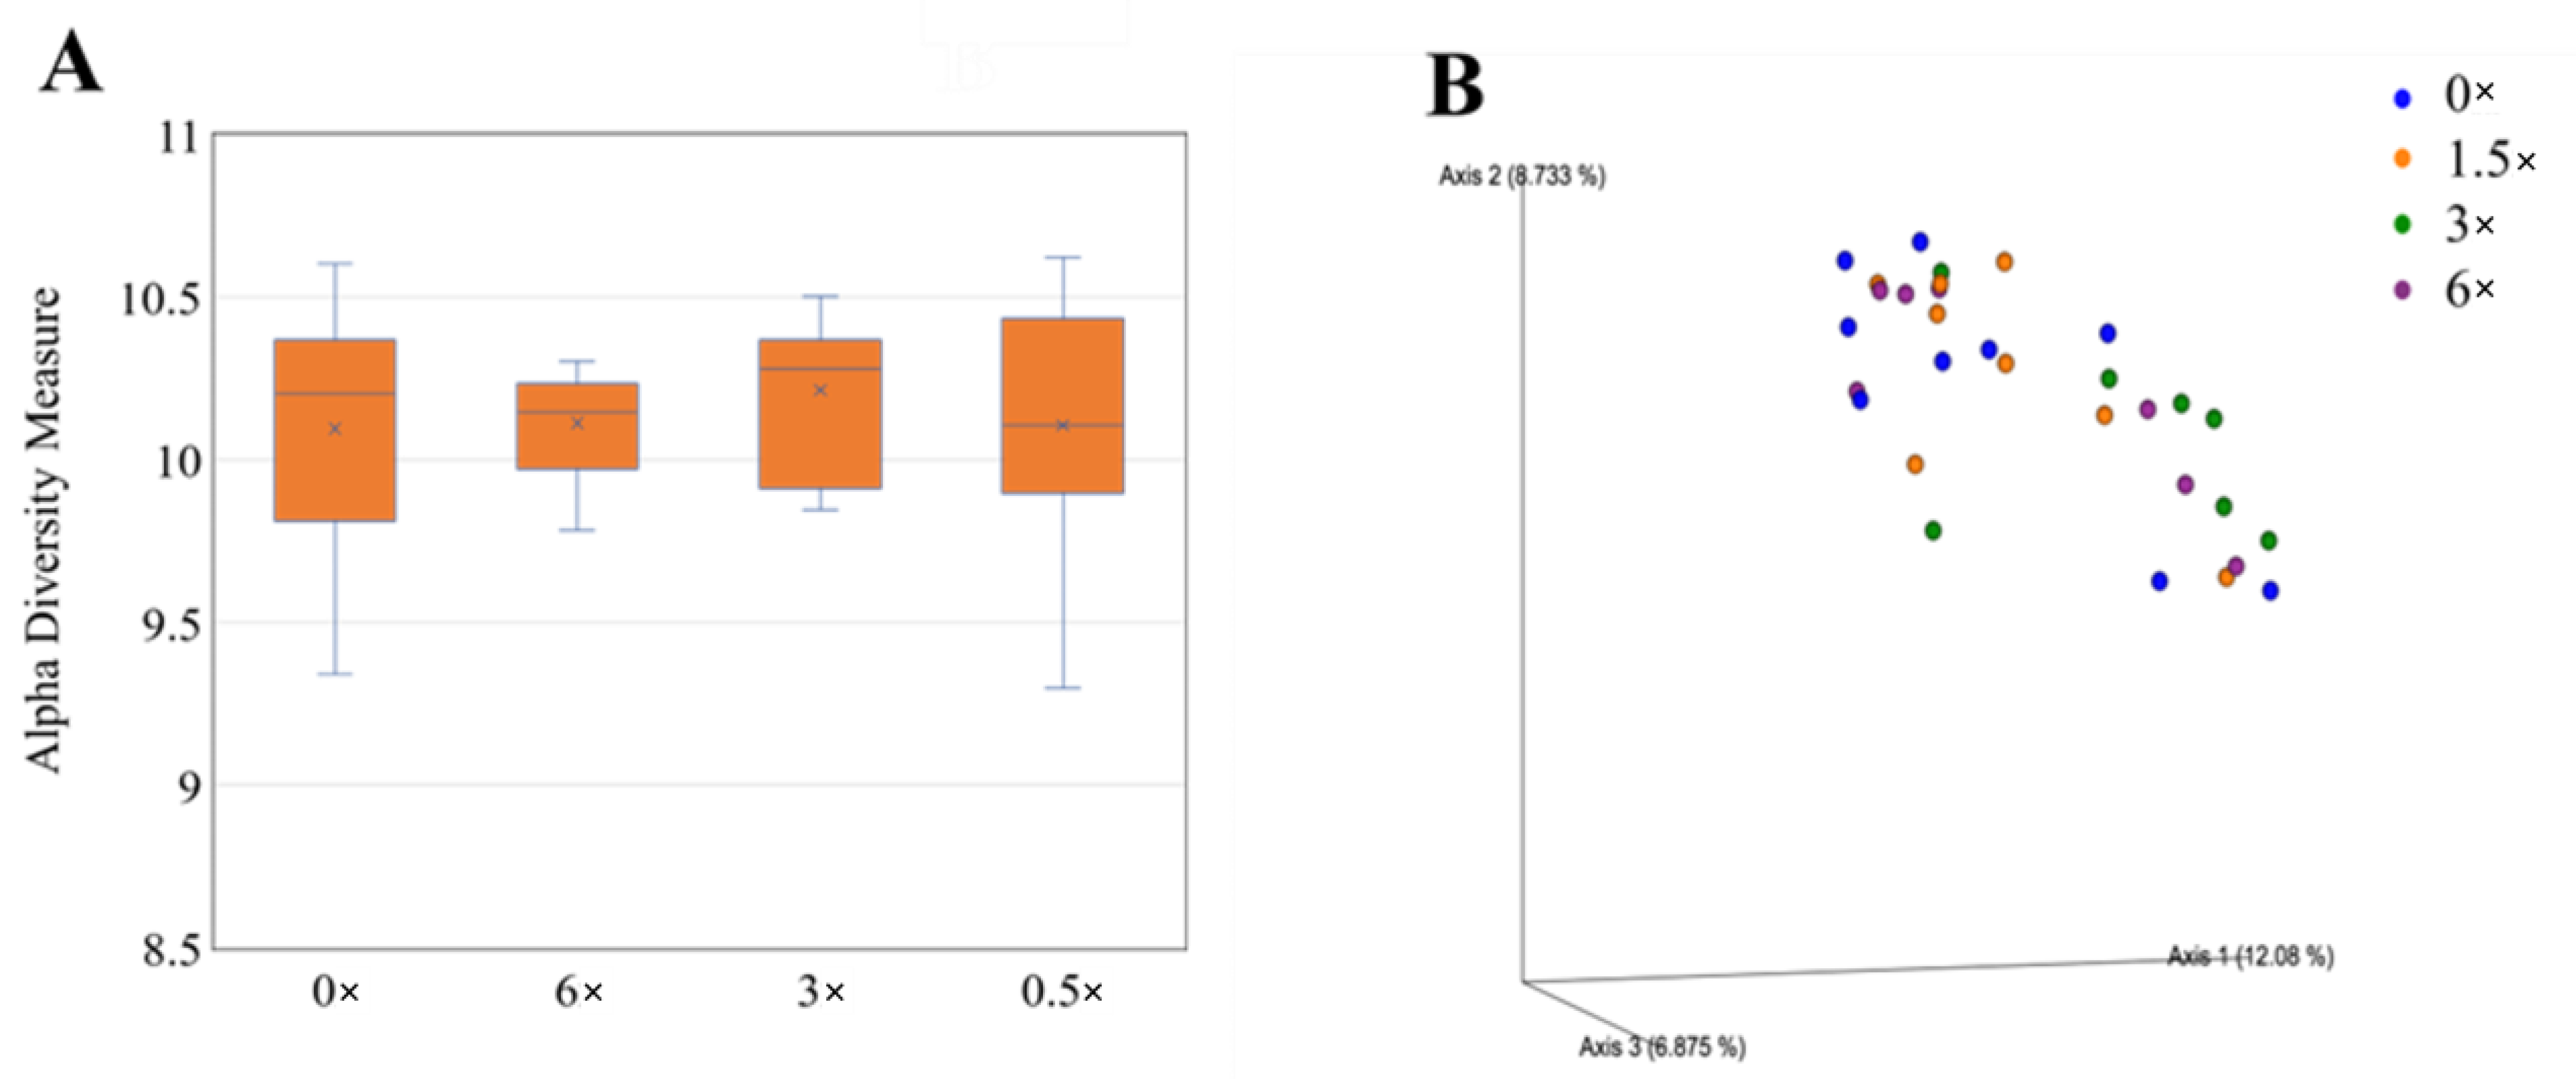
Figure 11.
Alpha (A) and beta diversity (B) in rhizosphere bacteria of ‘Ray Ruby’ grapefruit grafted on ‘Kuharske’ citrange planted in flatwood soils located in Fort Pierce, FL, USA, and treated with various doses of foliar fertilizer applications. Alpha diversity was measured using the Shannon index of rhizosphere bacteria among treatments. Plotted in Figure (A) are boxes (interquartile), the median (line within each box), the mean (× within each box), and whiskers (lowest and greatest values). Principal coordinates analysis (PCoA) based on the Bray–Curtis dissimilarity matrix of rhizosphere bacterial samples can be found in Figure (B), where colors indicate treatment and include 0× (blue), 1.5× (orange), 3× (green) and 6× (purple) the UF/IFAS recommended.
Table 1.
Corresponding p-values and r values (Pearson’s coefficient) of correlations examined between soil nutrient concentrations and planting density treatments from all time points of sampling, which include September 2020, January 2021, May 2021, September 2021 and January 2022.
Table 1.
Corresponding p-values and r values (Pearson’s coefficient) of correlations examined between soil nutrient concentrations and planting density treatments from all time points of sampling, which include September 2020, January 2021, May 2021, September 2021 and January 2022.
| Nutrient | r | p-Value |
|---|
| P | −0.05 | 0.4 |
| K | 0.03 | 0.25 |
| Mg | −0.01 | 0.98 |
| Ca | 0.12 | 0.006 |
| B | 0.08 | 0.08 |
| Zn | −0.06 | 0.18 |
| Mn | 0.06 | 0.9 |
| Fe | 0.12 | 0.08 |
| Cu | 0.01 | 0.79 |
Table 2.
Corresponding p-values and r values (Pearson’s coefficient) of correlations examined between soil nutrient concentrations and ground-applied CRF treatments from all time points of sampling, which include September 2020, January 2021, May 2021, September 2021 and January 2022.
Table 2.
Corresponding p-values and r values (Pearson’s coefficient) of correlations examined between soil nutrient concentrations and ground-applied CRF treatments from all time points of sampling, which include September 2020, January 2021, May 2021, September 2021 and January 2022.
| Nutrient | r | p-Value |
|---|
| K | −0.05 | 0.33 |
| P | 0.09 | 0.08 |
| Mg | 0.1 | 0.03 |
| Ca | −0.21 | 5.12 × 10⁻⁶ |
| B | 0.13 | 0.004 |
| Zn | 0.17 | 0.0002 |
| Mn | 0.4 | 2.20 × 10⁻¹⁶ |
| Fe | 0.23 | 3.17 × 10⁻⁷ |
| Cu | 0.17 | 0.0002 |
Table 3.
Corresponding p-values and r values (Pearson’s coefficient) of correlations examined between soil nutrient concentrations and foliar fertilizer treatments from all time points of sampling, which include September 2020, January 2021, May 2021, September 2021 and January 2022.
Table 3.
Corresponding p-values and r values (Pearson’s coefficient) of correlations examined between soil nutrient concentrations and foliar fertilizer treatments from all time points of sampling, which include September 2020, January 2021, May 2021, September 2021 and January 2022.
| Nutrient | r | p-Value |
|---|
| K | −0.03 | 0.94 |
| P | 0.01 | 0.98 |
| Mg | −0.03 | 0.39 |
| Ca | −0.02 | 0.65 |
| B | 0.02 | 0.56 |
| Zn | 0.29 | 9.76 × 10⁻¹¹ |
| Mn | 0.24 | 9.19 × 10⁻⁸ |
| Fe | −0.09 | 0.84 |
| Cu | −0.06 | 0.13 |
Table 4.
Total root length of ‘Ray Ruby’ grapefruit grafted on ‘Kuharske’ citrange planted in flatwood soils located in Fort Pierce, FL, USA, and treated with ground-applied fertilizer, foliar fertilizer and different planting densities from September 2020 to January 2022.
Table 4.
Total root length of ‘Ray Ruby’ grapefruit grafted on ‘Kuharske’ citrange planted in flatwood soils located in Fort Pierce, FL, USA, and treated with ground-applied fertilizer, foliar fertilizer and different planting densities from September 2020 to January 2022.
| Root Length (mm) | Sept. 2020 | Jan. 2021 | May 2021 | Sept. 2021 | Jan. 2022 |
|---|
| Ground-applied 1 | CRF1 | 489 ± 120 | 622.6 ± 161 | 653.7 ± 143 | 545.5 ± 112 | 706.0 ± 95 |
| CRF2 | 572 ± 90 | 432.9 ± 93 | 450.2 ± 103 | 509.0 ± 79 | 655.2 ± 111 |
| Foliar 2 | 0× | 504 ± 180 | 343.2 ± 143 | 539.3 ± 194 | 469.7 ± 118 | 617.5 ± 121 |
| 1.5× | 476 ± 101 | 431.0 ± 78 | 456.0 ± 100 | 405.8 ± 95 | 600.5 ± 124 |
| 3× | 401 ± 121 | 406.5 ± 131 | 329.8 ± 104 | 523.1 ± 155 | 685.1 ± 171 |
| 6× | 772 ± 194 | 1120.8 ± 318 | 994.8 ± 298 | 726.6 ± 171 | 817.8 ± 173 |
| Planting density 3 | High | 738 ± 128 | 651.6 ± 142 | 655.2 ± 183 | 729.2 ± 149 | 790.8 ± 156 |
| Low | 398 ± 144 | 529.0 ± 227 | 559.2 ± 194 | 382.3 ± 79 | 508.6 ± 68 |
| Medium | 402 ± 72 | 442.5 ± 176 | 593.5 ± 202 | 495.6 ± 113 | 747.8 ± 137 |
Table 5.
p-values obtained via a three-way ANOVA followed by Tukey’s post hoc test, corresponding to the total root length of ‘Ray Ruby’ grapefruit grafted on ‘Kuharske’ citrange planted in flatwood soils located in Fort Pierce, FL, USA, and treated with ground-applied fertilizer, foliar fertilizer and different planting densities from September 2020 to January 2022. Bold values were considered to be significantly different (p < 0.05).
Root Length
p Values | Sept. 2020 | Jan. 2021 | May 2021 | Sept. 2021 | Jan. 2022 |
|---|
| Ground-applied 1 | CRF1—CRF2 | 0.28 | 0.74 | 0.35 | 0.78 | 0.75 |
| Foliar 2 | 1.5×–0× | 0.84 | 0.44 | 0.90 | 0.98 | 0.99 |
| 3×–0× | 0.99 | 0.58 | 0.99 | 0.99 | 0.98 |
| 6×–0× | 0.28 | 0.98 | 0.99 | 0.52 | 0.76 |
| 3×–1.5× | 0.72 | 0.99 | 0.92 | 0.91 | 0.97 |
| 6×–1.5× | 0.72 | 0.71 | 0.85 | 0.32 | 0.73 |
| 6×–3× | 0.18 | 0.82 | 0.99 | 0.71 | 0.92 |
| Planting density 3 | Low—High | 0.04 | 0.77 | 0.93 | 0.06 | 0.27 |
| Med—High | 0.32 | 0.90 | 0.86 | 0.22 | 0.94 |
| Med—Low | 0.62 | 0.96 | 0.66 | 0.79 | 0.42 |
Table 6.
Total root volume of ‘Ray Ruby’ grapefruit grafted on ‘Kuharske’ citrange planted in flatwood soils located in Fort Pierce, FL, USA, and treated with ground-applied fertilizer, foliar fertilizer and different planting densities from September 2020 to January 2022.
Table 6.
Total root volume of ‘Ray Ruby’ grapefruit grafted on ‘Kuharske’ citrange planted in flatwood soils located in Fort Pierce, FL, USA, and treated with ground-applied fertilizer, foliar fertilizer and different planting densities from September 2020 to January 2022.
| Root Volume (mm3) | Sept. 2020 | Jan. 2021 | May 2021 | Sept. 2021 | Jan. 2022 |
|---|
| Ground-applied 1 | CRF1 | 491.8 ± 135 | 540.8 ± 117 | 467.1 ± 101 | 1139.7 ± 232 | 1949.4 ± 271 |
| CRF2 | 732.7 ± 329 | 439.1 ± 101 | 316.0 ± 73 | 1143.3 ± 170 | 1777.7 ± 285 |
| Foliar 2 | 0× | 430.9 ± 199 | 367.4 ± 131 | 386.1 ± 138 | 1044.9 ± 256 | 1691.2 ± 367 |
| 1.5× | 374.4 ± 110 | 344.8 ± 70 | 349.2 ± 75 | 908.5 ± 227 | 1647.4 ± 316 |
| 3× | 856.8 ± 512 | 607.2 ± 176 | 285.6 ± 99 | 1163.3 ± 336 | 1861.2 ± 443 |
| 6× | 692.7 ± 290 | 755.9 ± 98 | 672.0 ± 229 | 1479.3 ± 329 | 2225.4 ± 452 |
| Planting density 3 | High | 916.5 ± 435 | 637.0 ± 171 | 397.5 ± 102 | 1527.2 ± 312 | 2131.2 ± 438 |
| Low | 485.4 ± 210 | 456.4 ± 134 | 423.4 ± 150 | 835.7 ± 155 | 1409.2 ± 161 |
| Medium | 391.6 ± 119 | 389.4 ± 90 | 449.9 ± 136 | 1109.8 ± 249 | 2072.9 ± 371 |
Table 7.
p-values obtained via a three-way ANOVA followed by Tukey’s post hoc test, corresponding to the total root volume of ‘Ray Ruby’ grapefruit grafted on ‘Kuharske’ citrange planted in flatwood soils located in Fort Pierce, FL, USA, and treated with ground-applied fertilizer, foliar fertilizer and different planting densities from September 2020 to January 2022.
Root Volume
p Values | Sept. 2020 | Jan. 2021 | May 2021 | Sept. 2021 | Jan. 2022 |
|---|
| Ground-applied 1 | CRF1—CRF2 | 0.82 | 0.67 | 0.03 | 0.98 | 0.66 |
| Foliar 2 | 1.5×–0× | 0.92 | 0.69 | 0.65 | 0.99 | 0.99 |
| 3×–0× | 0.92 | 0.29 | 0.88 | 0.99 | 0.99 |
| 6×–0× | 0.77 | 0.99 | 0.97 | 0.69 | 0.78 |
| 3×–1.5× | 0.99 | 0.83 | 0.98 | 0.92 | 0.97 |
| 6×–1.5× | 0.99 | 0.62 | 0.86 | 0.49 | 0.72 |
| 6×–3× | 0.98 | 0.26 | 0.98 | 0.86 | 0.92 |
| Planting density 3 | Low—High | 0.22 | 0.79 | 0.63 | 0.09 | 0.29 |
| Med—High | 0.35 | 0.97 | 0.98 | 0.35 | 0.97 |
| Med—Low | 0.97 | 0.69 | 0.51 | 0.73 | 0.38 |
Table 8.
Total root area of ‘Ray Ruby’ grapefruit grafted on ‘Kuharske’ citrange planted in flatwood soils located in Fort Pierce, FL, USA, and treated with ground-applied fertilizer, foliar fertilizer and different planting densities from September 2020 to January 2022.
Table 8.
Total root area of ‘Ray Ruby’ grapefruit grafted on ‘Kuharske’ citrange planted in flatwood soils located in Fort Pierce, FL, USA, and treated with ground-applied fertilizer, foliar fertilizer and different planting densities from September 2020 to January 2022.
| Root Area (mm2) | Sept. 2020 | Jan. 2021 | May 2021 | Sept. 2021 | Jan. 2022 |
|---|
| Ground-applied 1 | CRF1 | 1598.3 ± 428 | 1463.1 ± 328 | 1869.0 ± 420 | 2763.6 ± 566 | 4111.4 ± 576 |
| CRF2 | 1837.3 ± 498 | 1452.4 ± 312 | 1308.2 ± 301 | 2664.3 ± 402 | 3773.9 ± 621 |
| Foliar 2 | 0× | 1392.9 ± 499 | 1199.5 ± 457 | 1580.4 ± 556 | 2440.6 ± 605 | 3540.3 ± 771 |
| 1.5× | 1240.9 ± 330 | 1173.8 ± 247 | 1392.2 ± 300 | 2126.1 ± 512 | 3485.3 ± 693 |
| 3× | 1770.8 ± 733 | 1586.1 ± 427 | 1057.7 ± 354 | 2733.5 ± 799 | 3962.2 ± 963 |
| 6× | 2388.7 ± 825 | 2202.7 ± 319 | 2771.5 ± 973 | 3633.9 ± 831 | 4722.7 ± 974 |
| Planting density 3 | High | 2425.8 ± 668 | 2144.6 ± 532 | 1644.4 ± 464 | 3687.8 ± 754 | 4556.2 ± 949 |
| Low | 1433.9 ± 575 | 1208.7 ± 252 | 1686.7 ± 593 | 1977.3 ± 383 | 2962.8 ± 363 |
| Medium | 1205.9 ± 260 | 1039.3 ± 221 | 1800.6 ± 578 | 2598.5 ± 587 | 4364.4 ± 787 |
Table 9.
p-values obtained via a three-way ANOVA followed by Tukey’s post hoc test, corresponding to the total root area of ‘Ray Ruby’ grapefruit grafted on ‘Kuharske’ citrange planted in flatwood soils located in Fort Pierce, FL, USA, and treated with ground-applied fertilizer, foliar fertilizer and different planting densities from September 2020 to January 2022. Bold values were considered to be significantly different (p < 0.05).
Root Area
p Values | Sept. 2020 | Jan. 2021 | May 2021 | Sept. 2021 | Jan. 2022 |
|---|
| Ground-applied 1 | CRF1—CRF2 | 0.71 | 0.38 | 0.03 | 0.88 | 0.69 |
| Foliar 2 | 1.5×–0× | 0.94 | 0.37 | 0.73 | 0.98 | 0.99 |
| 3×–0× | 0.98 | 0.16 | 0.93 | 0.98 | 0.98 |
| 6×–0× | 0.52 | 0.99 | 0.99 | 0.59 | 0.77 |
| 3×–1.5× | 0.99 | 0.89 | 0.98 | 0.91 | 0.97 |
| 6×–1.5× | 0.86 | 0.30 | 0.83 | 0.40 | 0.72 |
| 6×–3× | 0.67 | 0.14 | 0.97 | 0.79 | 0.92 |
| Planting density 3 | Low—High | 0.13 | 0.93 | 0.81 | 0.08 | 0.28 |
| Med—High | 0.36 | 0.74 | 0.88 | 0.28 | 0.95 |
| Med—Low | 0.85 | 0.53 | 0.53 | 0.76 | 0.39 |
Table 10.
Details about treatment factors and arrangements for experimental design.
Table 10.
Details about treatment factors and arrangements for experimental design.
| Experimental Design | Factor and Level |
|---|
|
Main plot
| CRF application in the soil12-3-14 + micronutrients at 1× UF/IFAS recommendation 12-3-14 + 2× Mg + micronutrients (3× UF/IFAS B, Fe, Mn and Zn)
|
|
Subplot
| Three plant densitiesSingle-row low density (SR/LD): 300 trees per ha Single-row high density (SR/HD): 440 trees per ha Double-row high density (DR/HD): 975 trees per ha
|
|
Sub-subplot
| Four foliar treatmentsNo supplemental nutrients applied (0×) 1.5 times the recommended doses of B, Mn and Zn 1 (1.5×) 3.0 times the recommended doses of B, Mn and Zn 1 (3.0×) 6.0 times the recommended doses of B, Mn and Zn 1 (6.0×)
|
Table 11.
Controlled-release fertilizer formula.
Table 11.
Controlled-release fertilizer formula.
| | 12-3-14 + Micronutrient at 1× UF/IFAS Recommendation | 12-3-14 +2 × Mg + Micronutrients (3× UF/IFAS B, Fe, Mn and Zn) |
|---|
| Nutrient (%) | Amount (kg ha−1) | Nutrient (%) | Amount (kg ha−1) |
|---|
|
N
| 12 | 180 | 12 | 180 |
|
P2O5 | 3 | 45 | 3 | 45 |
|
K2O
| 14 | 209 | 14 | 209 |
|
Ca
| 1 | 15 | 1 | 15 |
|
Mg
| 1.2 | 18 | 2.4 | 36 |
|
S
| 13 | 194 | 15 | 228 |
|
B
| 0.1 | 0.7 | 0.1 | 1.7 |
|
Cu
| 0 | 0.6 | 0.1 | 1.5 |
|
Fe
| 0.4 | 5.9 | 1 | 15 |
|
Mn
| 0.6 | 8.4 | 1.4 | 21 |
|
Mo
| 0 | 0 | 0 | 0.2 |
|
Zn
| 0.4 | 5.9 | 1 | 15 |


 ,
, 


