Article

Compost and Phosphorus/Potassium-Solubilizing Fungus Effectively Boosted Quinoa’s Physio-Biochemical Traits, Nutrient Acquisition, Soil Microbial Community, and Yield and Quality in Normal and Calcareous Soils

by
Samah M. Youssef
1,
Ahmed Shaaban
2,*,
Abdelsattar Abdelkhalik
1,
Ahmed R. Abd El Tawwab
3,
Laila R. Abd Al Halim
4,
Laila A. Rabee
5,
Khairiah Mubarak Alwutayd
6,
Reda M. M. Ahmed
3,
Rahaf Alwutayd
7 and
Khaulood A. Hemida
8
1
Horticulture Department, Faculty of Agriculture, Fayoum University, Fayoum 63514, Egypt
2
Agronomy Department, Faculty of Agriculture, Fayoum University, Fayoum 63514, Egypt
3
Soil and Water Department, Faculty of Agriculture, Fayoum University, Fayoum 63514, Egypt
4
Agricultural Microbiology Department, Faculty of Agriculture, Fayoum University, Fayoum 63514, Egypt
5
Department of Food Science and Technology, Faculty of Agriculture, Fayoum University, Fayoum 63514, Egypt
6
Department of Biology, College of Science, Princess Nourah bint Abdulrahman University, Riyadh 11671, Saudi Arabia
7
Department of Information Technology, College of Computer and Information Science, Princess Nourah bint Abdulrahman University, Riyadh 11671, Saudi Arabia
8
Botany Department, Faculty of Science, Fayoum University, Fayoum 63514, Egypt
*
Author to whom correspondence should be addressed.
Plants 2023, 12(17), 3071; https://doi.org/10.3390/plants12173071
Submission received: 19 July 2023 / Revised: 12 August 2023 / Accepted: 23 August 2023 / Published: 27 August 2023
(This article belongs to the Special Issue Soil-Beneficial Microorganisms and Plant Growth)

Abstract

:
Calcareous soil had sufficient phosphorus and potassium (PK) in different forms due to the high contents of PK-bearing minerals; however, the available PK state was reduced due to its PK-fixation capacity. Compost, coupled with high PK solubilization capacity microbes, is a sustainable solution for bioorganic fertilization of plants grown in calcareous soil. A 2-year field experiment was conducted to investigate the effect of compost (20 t ha−1) with Aspergillus niger through soil drenching (C-AN) along with partial substitution of PK fertilization on quinoa performance in normal and calcareous soils. Treatments included PK100% (72 kg P2O5 ha−1 + 60 kg K2O ha−1 as conventional rate), PK100%+C-AN, PK75%+C-AN, PK50%+C-AN, PK25%+C-AN, and only C-AN in normal and calcareous soils. Results showed that C-AN and reduced PK fertilization (up to 75 or 50%) increased photosynthetic pigments and promoted nutrient acquisition in quinoa grown in calcareous soil. Reduced PK fertilization to 75 or 50% plus C-AN in calcareous soil increased osmoprotectants, nonenzymatic antioxidants, and DPPH scavenging activity of quinoa’s leaves compared to the PK0%+C-AN treatment. The integrative application of high PK levels and C-AN enhanced the quinoa’s seed nutritional quality (i.e., lipids, carbohydrates, mineral contents, total phenolics, total flavonoids, half maximal inhibitory concentration, and antiradical power) in calcareous soil. At reduced PK fertilization (up to 75 or 50%), application of compost with Aspergillus niger through soil drenching increased plant dry weight by 38.7 or 53.2%, hectoliter weight by 3.0 or 2.4%, seed yield by 49.1 or 39.5%, and biological yield by 43.4 or 33.6%, respectively, compared to PK0%+C-AN in calcareous soil. The highest P-solubilizing microorganism’s population was found at PK0%+C-AN in calcareous soil, while the highest Azotobacter sp. population was observed under high PK levels + C-AN in normal soil. Our study recommends that compost with Aspergillus niger as a bioorganic fertilization treatment can partially substitute PK fertilization and boost quinoa’s tolerance to salt calcareous-affected soil.

1. Introduction

Areas with arid and semiarid climates often have soils that are considered calcareous, which pose a problem for crop production. These soils are estimated to account for more than a third of the Earth’s land surface [1]. Calcareous soil contains large quantity of calcium carbonate (CaCO3) exceeds 14–17% as total CaCO3 or 4–7% as active CaCO3 [2]. This substantial proportion of CaCO3, regardless of its form, alters soil’s different properties and hence limits its cropping range and productivity. However, crusting, the composition of a hard, cemented layer of CaCO3 particles on soil surface, is the major problem of calcareous soils. Soil crust affects soil properties by retarding seed germination and slowing down root development [3], resulting in poor infiltration and accelerating surface runoff [4,5]. Calcareous soil additionally has pH values of soil paste ranging from 7.4 to 9.2 [6,7], low organic matter content (<0.4%), and mostly decreases with depth [8]. High CaCO3 of calcareous soil fixes the nutrient availability (e.g., Zn+2, Fe+2, Mn+2, B, Mg+2, P, K+, and N) affecting plant performance [9]. Thus, applying an integrated management package is essential to enhance calcareous soil quality and achieve sustainable productivity [1].
Plants need phosphorus (P) as the second most essential macronutrient. However, many soils have low amounts of phosphate that plants can use, even if they have high amounts of total P [10,11]. Increased pH and CaCO3 levels lead to direct and/or indirect nutrient immobilization. Higher pH boosts the transformation of P into insoluble forms [12], consequently reducing P availability and P use efficiency [13], which strongly impacts soil productivity. Microorganisms that can make insoluble P soluble can act as biofertilizers to use the P stored in soils and increase the amount of soluble P [14]. Inoculation of fungi that can solubilize phosphate can improve plant growth and P uptake, as shown in pot experiments [15] and field trials [16]. Some Aspergillus species have already been described for their P solubilization ability and potential use as soil P solubilizers from different sources (i.e., rock phosphate, aluminum phosphate, tricalcium phosphate, etc.), thus supplying available P and enhancing plant growth [17,18]. Additionally, the United States Food and Drug Administration generally regards the 19 Aspergillus species in the section Nigri, which includes A. niger [19], as safe.
Potassium (K) is the key essential macronutrient for biological growth and development [20]. However, plants take up K from the soil solution as K ions, and the quantities of soluble K in soil are usually very low, while most of the K in soil are rocks, minerals, and other deposits that are not soluble [21,22]. Despite these sources making up the largest pools of K in soil, under suitable conditions, they can be dissolved and become accessible for plants. Calcareous soils, however, have minor content (<150 mg kg−1 soil) of available K, reflecting their deficiency [21]. Microorganisms are vital in the natural K cycle [23,24]. Some fungal strains possess the capacity to dissolve rock potassium and potassium aluminum silicate [25]. Filamentous fungal species, especially those from Aspergillus and Penicillium, produce large amounts of organic acids and have a key role in the K cycle by dissolving insoluble substrates containing K [26,27]. These findings support the use of K-dissolving fungi to dissolve native K minerals in the soil in an environmentally friendly and more sustainable approach [28]. Furthermore, microorganisms including many K-dissolving fungi can enhance plant growth by secreting phytohormones such as indole-3-acetic acid (IAA) [29]. Therefore, the interaction between applied P or K fertilizers and soil minerals results in low nutrient use efficiency [30].
However, to meet plant nutrient requirements in calcareous soils, huge quantities of mineral fertilizers must be used, creating an economic and environmental risk [31]. However, to achieve sustainability of arable lands and to replenish the productivity of such degraded soils, it is critical to adopt ecofriendly and cost-effective solutions for the efficient exploitation of P and K fertilizers. Aspergillus niger is a multipurpose fungus involved in the solubilization of K and P [32] as well as the stimulation of phytohormone biosynthesis [33,34]. Application of A. niger exhibited improvements in soil quality, microbial community, and lettuce yield in barrier soil [35]. A. niger can dissolve many elements such as P, K+, Ca2+, and other elements present in rocks and minerals, releasing them in a form that is easily absorbed by plants. In addition, A. niger was found to be synthesized in plant growth-promoting and growth-protecting molecules such as sesquiterpenes (β-caryophyllene), IAA, and gibberellins, as well as 2-carboxymethyl-3-hexyl-maleic anhydride and 2-methylene-3-hexyl-butanedioic acid [34].
Adding compost with nutrient-solubilizing fungi have a positive effect on soil properties and the availability of nutrients (especially P and K) to plants under calcareous soil conditions. Compost application on calcareous soil has been described to improve soil physicochemical properties and intensifies microbial population and its activity [2,36]. It has also been reported that compost raises soil nutrient availability through decreasing soil pH, maintains soil health and fertility, and increases crop yields [37,38]. Recently, using microorganisms with compost as a bioorganic fertilizer outperformed conventional compost, which eventually boosted crop yield. Furthermore, microorganism-enriched compost has increased the soil nutrient availability compared with the unenriched compost [39]. When nutrient-solubilizing microorganisms are added or inoculated with compost, the enhanced bio-input obtained offers extra long-term benefits when it is applied to the soil [40]. Therefore, combining application of bioorganic fertilizer (herein; A. niger with compost) and reduced chemical fertilization promises to reduce the use of mineral K and P fertilizers in an ecofriendly and more sustainable manner.
Quinoa (Chenopodium quinoa Willd.) is a herbaceous, pseudo-cereal C3 tetraploid halophyte crop belonging to the Chenopodiaceae family [41,42]. Quinoa grain production has high economic value due to its composition of protein, oil, essential amino acids, carbohydrates, fatty acids, vitamins, and minerals. With protein ranges between 11 and 19%, it plays a vital role in boosting the immune system, thus fighting various diseases [43,44]. The whole quinoa plant can be used as livestock feed, and the leaves can be eaten as leafy vegetables as a source of nutrients. Despite quinoa’s ability to grow under harsh conditions [45,46], it is not well known whether or not quinoa can grow effectively in calcareous soil.
Although many studies have been conducted on compost supplanted with nutrient-solubilizing microbes, scarce literature is found investigating the influence of compost with P- and/or K-solubilizing fungi (e.g., A. niger) with different PK levels on agronomic, physio-biochemical attributes, and seed quality of quinoa seeded in calcareous soil. This study hypothesized that inoculation of compost with nutrient-solubilizing fungus would improve quinoa growth and yield under calcareous soil conditions by boosting nutrient acquisition, osmoprotectants, and antioxidants. It is also expected that integrative application of PK-solubilizing A. niger could partially substitute PK chemical fertilizer. Therefore, the current study aimed at investigating the impact of co-application of compost with P- and K-solubilizing fungus under different mineral PK levels on photosynthetic pigments, osmolyte and antioxidant accumulation, nutrient acquisition, growth, seed yield, and the nutritional quality of quinoa under normal and calcareous soil conditions.

2. Results

2.1. Photosynthetic Pigments

The illustrated data in Table S5 reveal that the leaf chlorophylls, carotenoids, and total photosynthetic pigments were similar during both growing seasons. Regarding the soil type effect, data exhibited that the plants grown in calcareous soil recorded lower contents of leaf chlorophyll a, chlorophyll b, total chlorophylls, carotenoids, and total photosynthetic pigments than those grown in normal soil. Regarding the co-applied PK+C-AN effect, there was an increase in the aforementioned photosynthetic parameters when increasing the level of PK plus C-AN, highlighting that the highest values were obtained under PK100%+C-AN, while the lowest values were obtained under PK0%+C-AN. In the case of soil type and PK+C-AN interaction (Table 1), application of PK100%+C-AN to quinoa plants grown in normal soil resulted in the highest values of chlorophyll a, total chlorophylls, carotenoids, and total photosynthetic pigments, whereas the application of PK0%+C-AN to plants grown in calcareous soil resulted in the lowest values. However, application of A. niger with compost and reduced PK fertilization (75 or 50% of PK) and reversed the negative impacts of calcareous soil on quinoa plants by increasing chlorophyll a by 24.8 or 17.4%, total chlorophylls by 25.1 or 17.1%, carotenoids by 26.5 or 14.5%, and total photosynthetic pigments by 25.4 or 16.7% compared to the plants treated with PK0%+C-AN. They also recorded similar or higher values to the quinoa plants treated only with full PK fertilization (PK100%) in normal soil (Table 1).

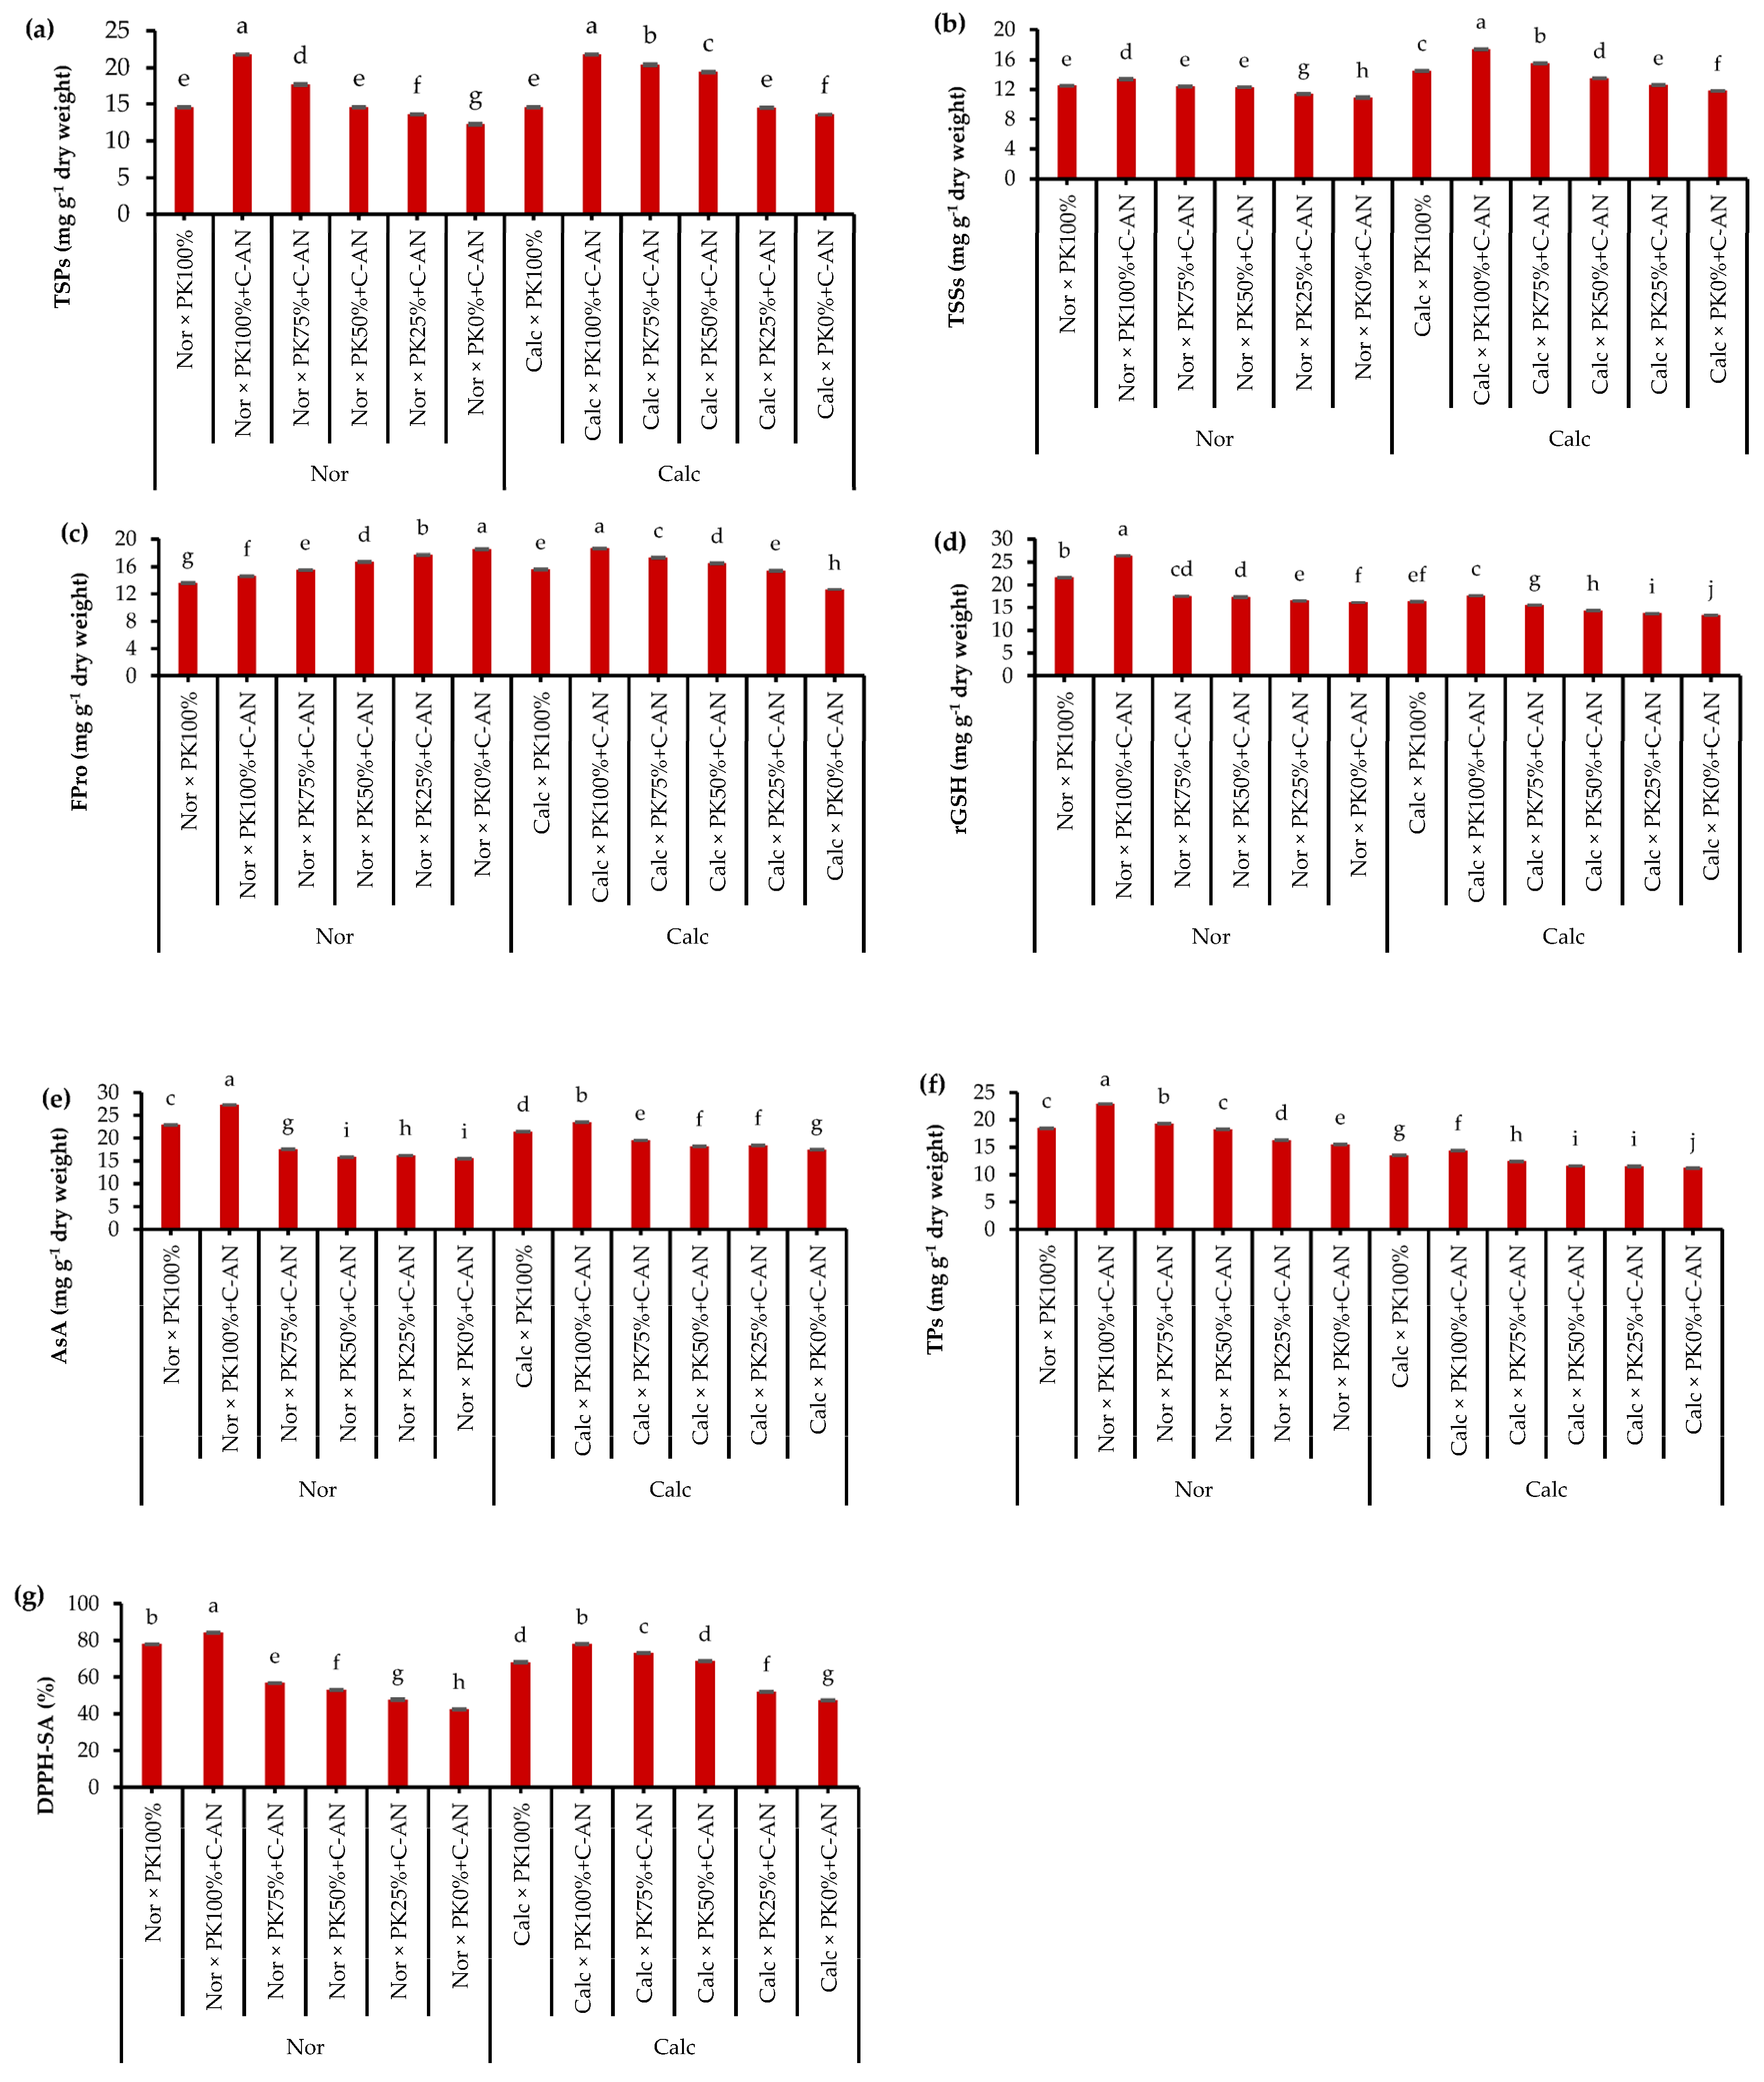
2.2. Total Soluble Proteins, Osmoregulatory Compounds, and Nonenzyme Antioxidants

In both seasons, the total soluble proteins, total soluble sugars, proline, reduced glutathione (rGSH), ascorbic acid (AsA), total phenolics, and total antioxidant activity in quinoa leaves were at similar levels (Table S6). As for soil type, quinoa plants grown under calcareous soil had higher concentrations of total soluble proteins, total soluble sugars, AsA, and total antioxidant activity compared to those grown under normal soil that had higher rGSH and total phenolics contents. With respect to the PK+C-AN effect, it was observed that there is a general trend of increasing the contents of total soluble proteins, total soluble sugars, proline, rGSH, AsA, total phenolics, and total antioxidant activity in line with increasing the PK level when fortified with the C-AN (Figure 1). In this regard, the highest and the lowest values of the abovementioned biochemical attributes corresponded with the PK100%+C-AN and PK0%+C-AN treatments, respectively. Application of PK plus C-AN generated a stimulatory action on the quinoa plant cultivated in calcareous soil. Contextually, highlighting that PK75%+C-AN- or PK50%+C-AN-treated calcareous soil showed higher total soluble proteins (50.0 or 42.6%), total soluble sugars (31.4 or 14.4%), proline (37.3 or 31.0%), rGSH (16.5 or 7.5%), AsA (11.4 or 4.0%), total phenolics (10.0 or 36%), and total antioxidant activity (54.2 or 44.7%), respectively, compared to the PK0%+C-AN treatment. Additionally, at reduced PK fertilization (75 or 50%), compost with A. niger increased osmoprotectants and antioxidants more than those recorded under full PK fertilization without C-AN application in calcareous soil (Figure 1).

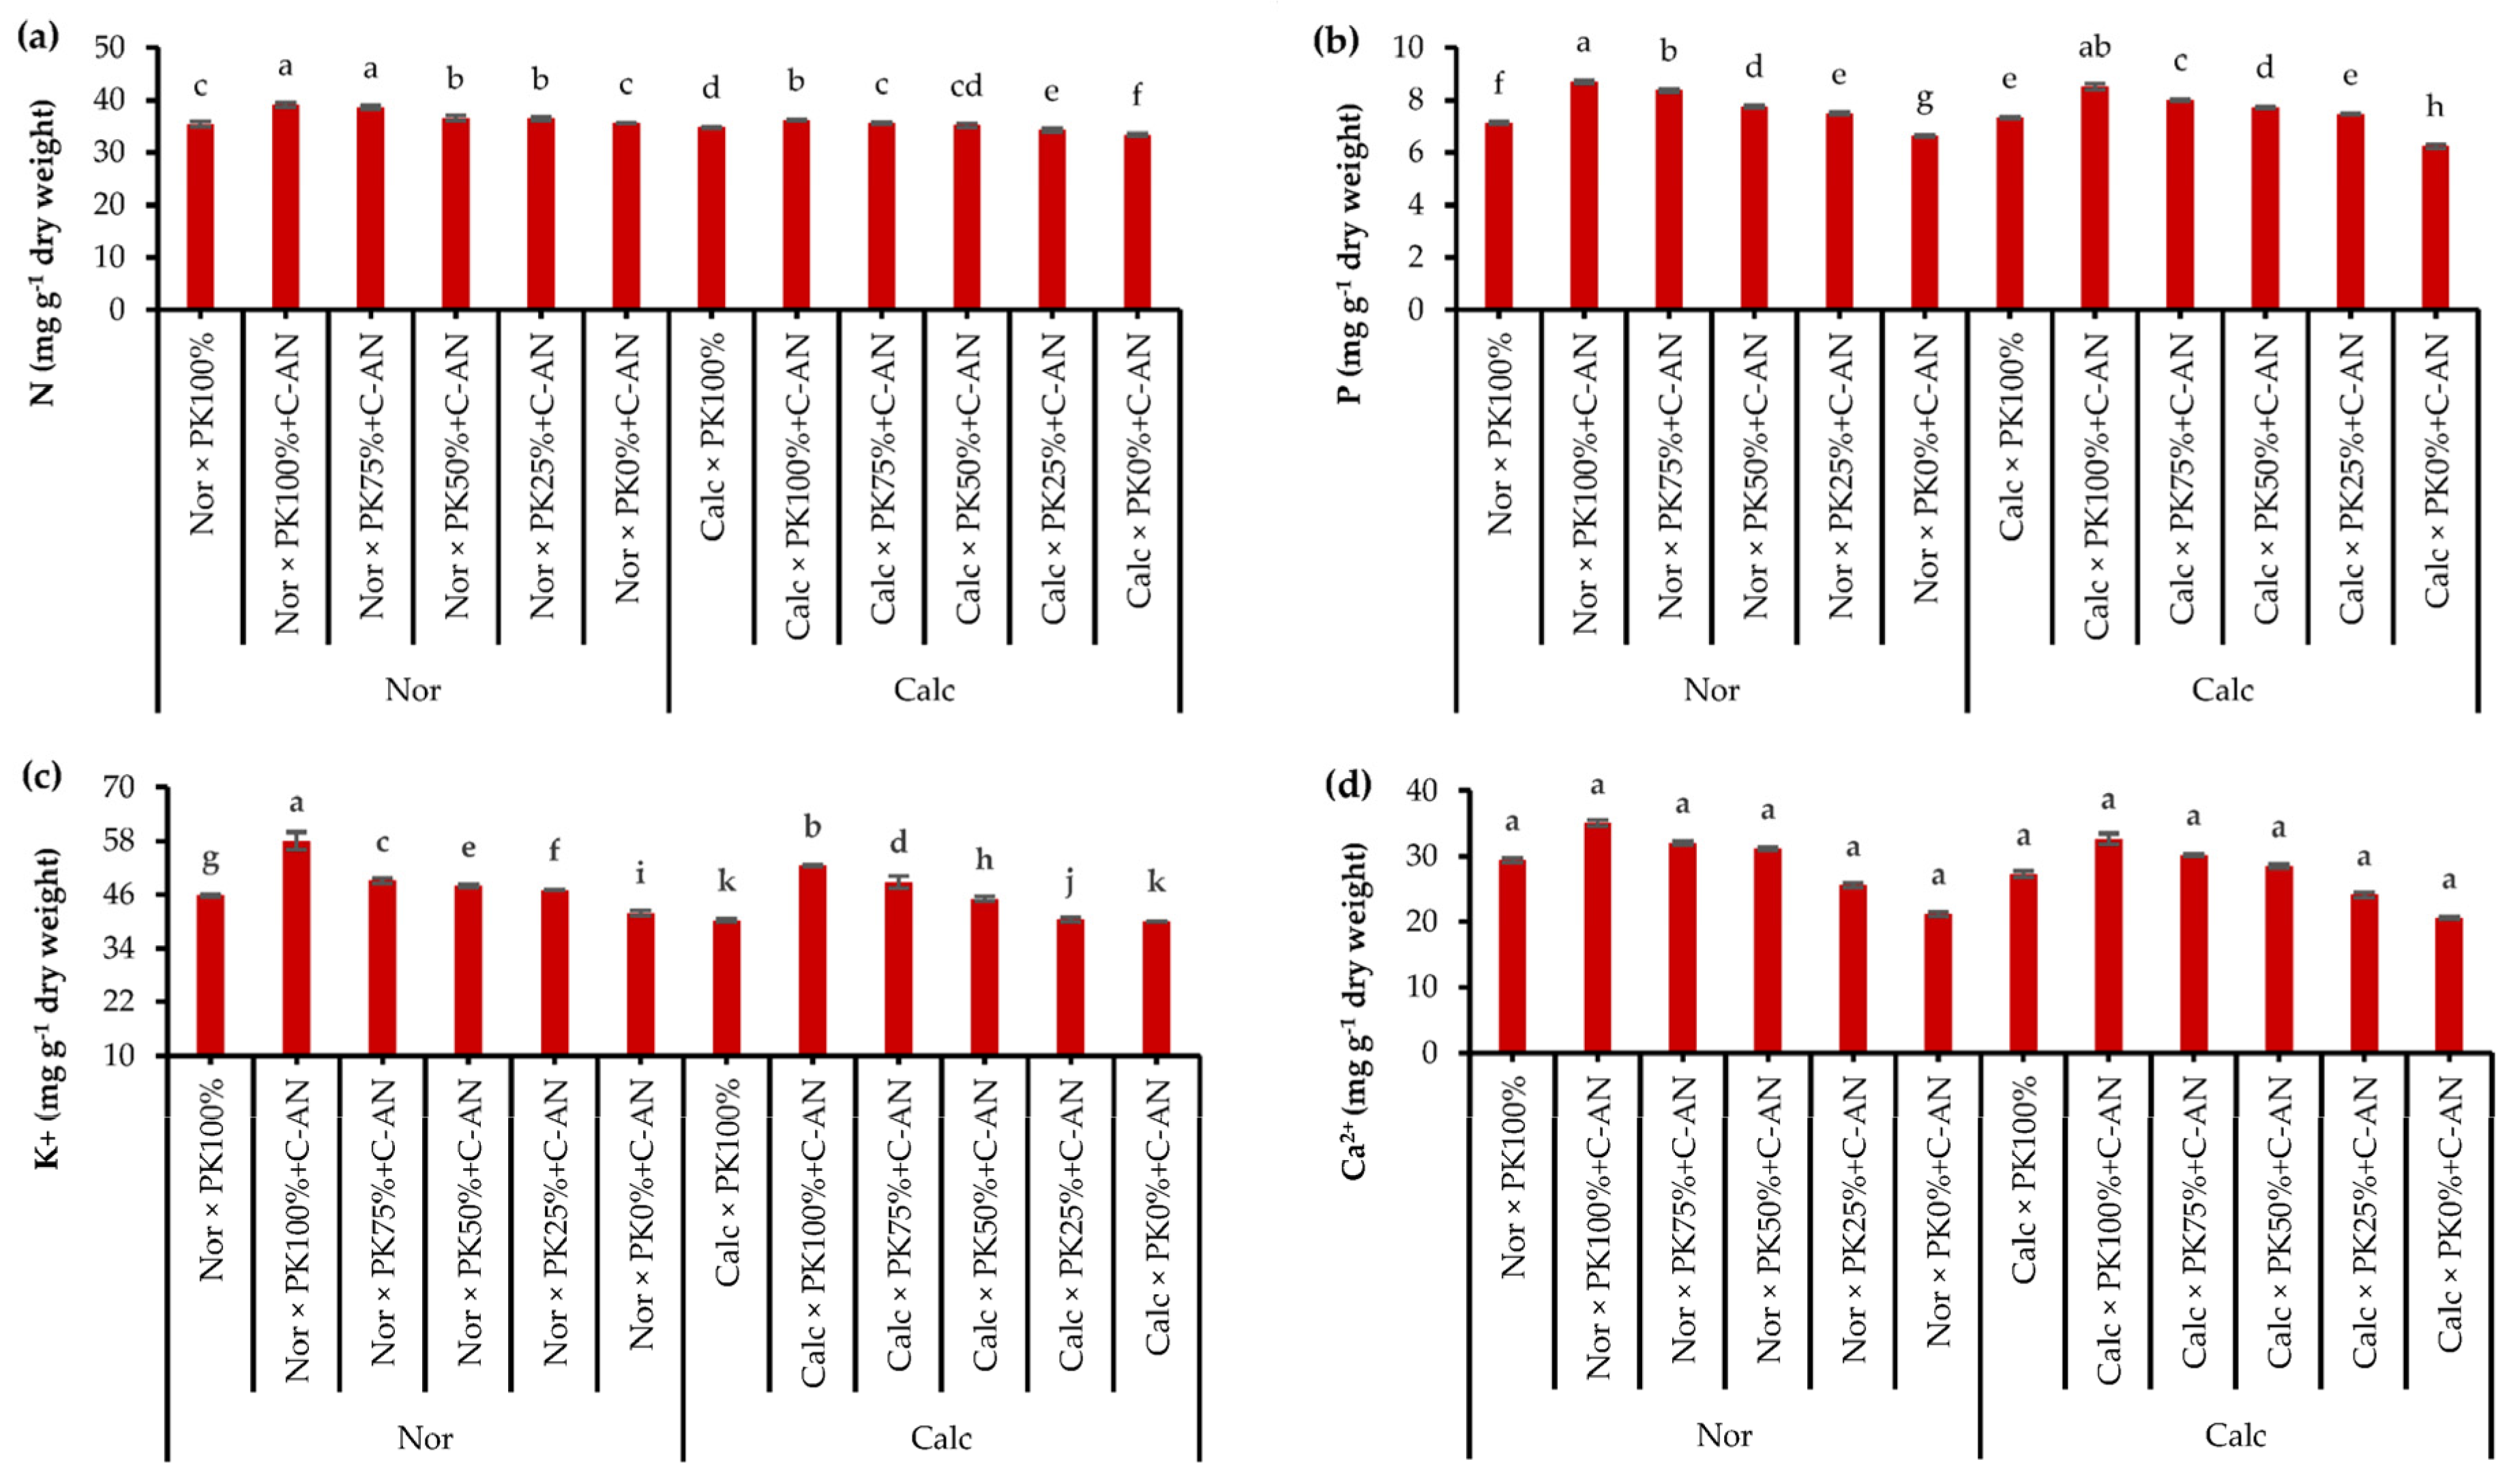
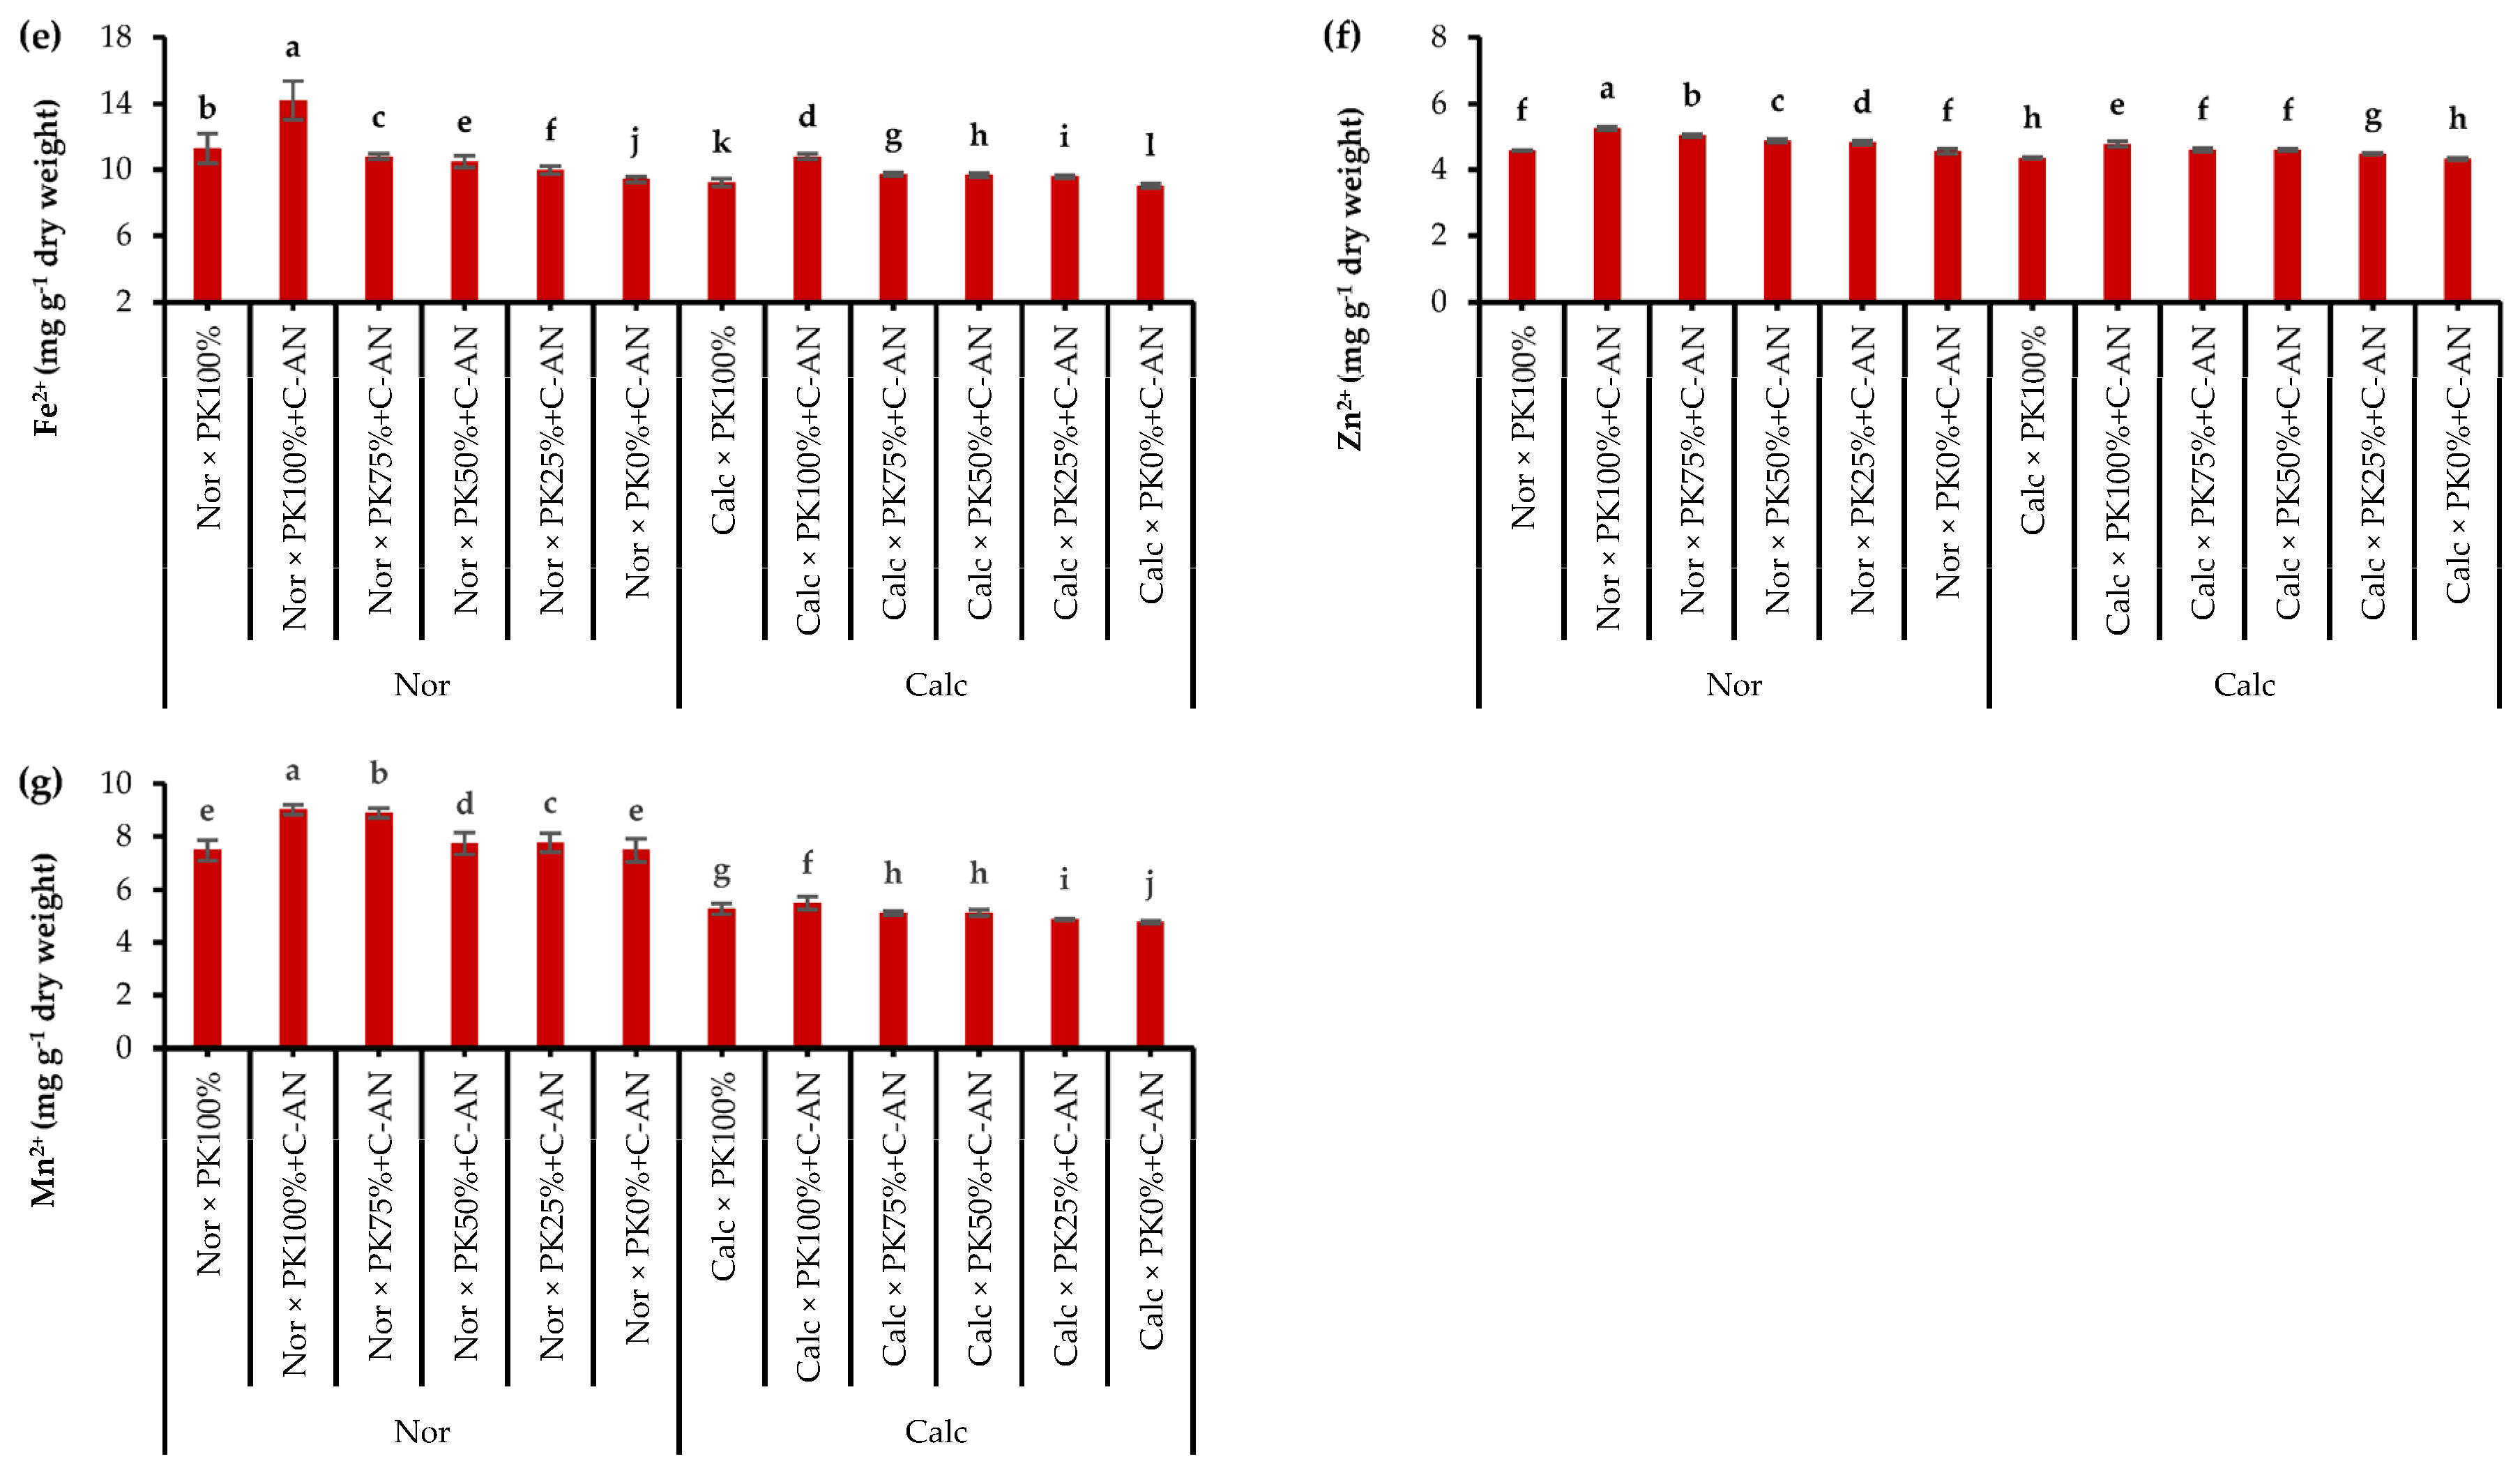
2.3. Quinoa Leaf Nutrient Contents

Data of quinoa leaf macro- and micronutrient analysis in response to growing season, soil type, PK+C-AN application, and soil type and PK+C-AN interaction are illustrated in Table S7. The N, K+, and Fe2+ acquisitions in quinoa were higher in the SI season, while the Mn2+ was higher in the quinoa plant grown during SII. The contents of N, P, K+, Ca2+, Fe2+, Zn2+, and Mn2+ were higher in quinoa leaves grown in normal soil than in calcareous soil. Regarding the PK+C-AN level, a significant increase in macro- and micronutrient acquisition was observed, corresponding to an increase in the PK level plus C-AN. As for soil type and PK+C-AN level interaction, adding PK100%+C-AN under normal soil resulted in the maximum nutrient acquisition, while adding PK0%+C-AN under calcareous soil achieved the lowest values of nutrient acquisition. Calcareous soil treated with PK75%+C-AN or PK50%+C-AN increased the contents of N by 6.6 or 5.4%, P by 28.5 or 23.7%, K+ by 22.0 or 12.5%, Ca2+ by 46.6 or 38.3%, Fe2+ by 7.8 or 7.1%, Zn2+ by 6.5 or 6.2%, and Mn2+ by 7.1 or 7.2% compared to the PK0%+C-AN treatment, and also recorded higher values than the PK100% treatment (Figure 2).

2.4. Seed Quality

In the case of soil type effect, seeds of quinoa plant grown in normal soil had higher protein, fiber, total phenolic compounds, total flavonoid compounds, and half maximal inhibitory concentration whereas those grown in calcareous soil recorded higher ash, lipid, water-soluble carbohydrates, and antiradical power (Tables S8 and S9). As for PK+C-AN level, the highest seed protein, ash, fiber, and water-soluble carbohydrates corresponded to the PK25%+C-AN, PK100%+C-AN, PK0%+C-AN, and PK100% treatment, respectively, while the seed lipid content was not varied by the PK+C-AN level. Additionally, the total phenolic compounds, total flavonoid compounds, and half maximal inhibitory concentration were significantly increased with increasing PK+C-AN level.
As for soil type and PK+C-AN level interaction, the seeds of quinoa plant grown in normal soil and treated with PK100%+C-AN had the highest protein content, while the highest ash contents were observed from the seeds obtained from the plant treated with PK100%+C-AN under calcareous soil. The maximum seed lipid and fiber content corresponded to the plant treated with PK25%+C-AN and PK0%+C-AN under normal soil as well as the greatest amount of water-soluble carbohydrates (Table 2). The highest values of total phenolic compounds, total flavonoid compounds, and half maximal inhibitory concentration were obtained under normal soil × PK100%+C-AN treatment while the highest value of antiradical power was obtained under calcareous soil × PK100%+C-AN treatment (Table 3). In comparison to the PK0%+C-AN treatment, quinoa plants grown under calcareous soil treated with PK75%+C-AN or PK50%+C-AN generated positive results such as increased total phenolic compounds, total flavonoid compounds, half maximal inhibitory concentration, and antiradical power by 32.6 or 34.4%, 64.4 or 37.0%, 40.6 or 34.4%, and 36.1 or 27.3%, respectively (Table 3).
Calcareous soil had a negative impact on the mineral contents of quinoa seeds, given that the P, K+, Ca2+, Mg2+, Na+, Fe2+, and Zn2+ levels significantly decreased compared to quinoa grown in normal soil. Regardless of soil type, increasing the level of PK+C-AN significantly increased seed’s mineral content (Table S10). Under calcareous soil, application of high PK+C-AN levels mediated ameliorating impact on quinoa plant (Table 4). Additionally, the PK75%+C-AN or PK50%+C-AN treatments, under calcareous soil conditions, significantly (except for Ca2+) increased the aforementioned seed mineral content by 82.6 or 73.9%, 22.3 or 12.3%, 50.5 or 47.6%, 21.2 or 13.6%, 62.5 or 50.0%, and 19.5 or 17.1%, respectively, compared to the PK0%+C-AN treatment (Table 4).

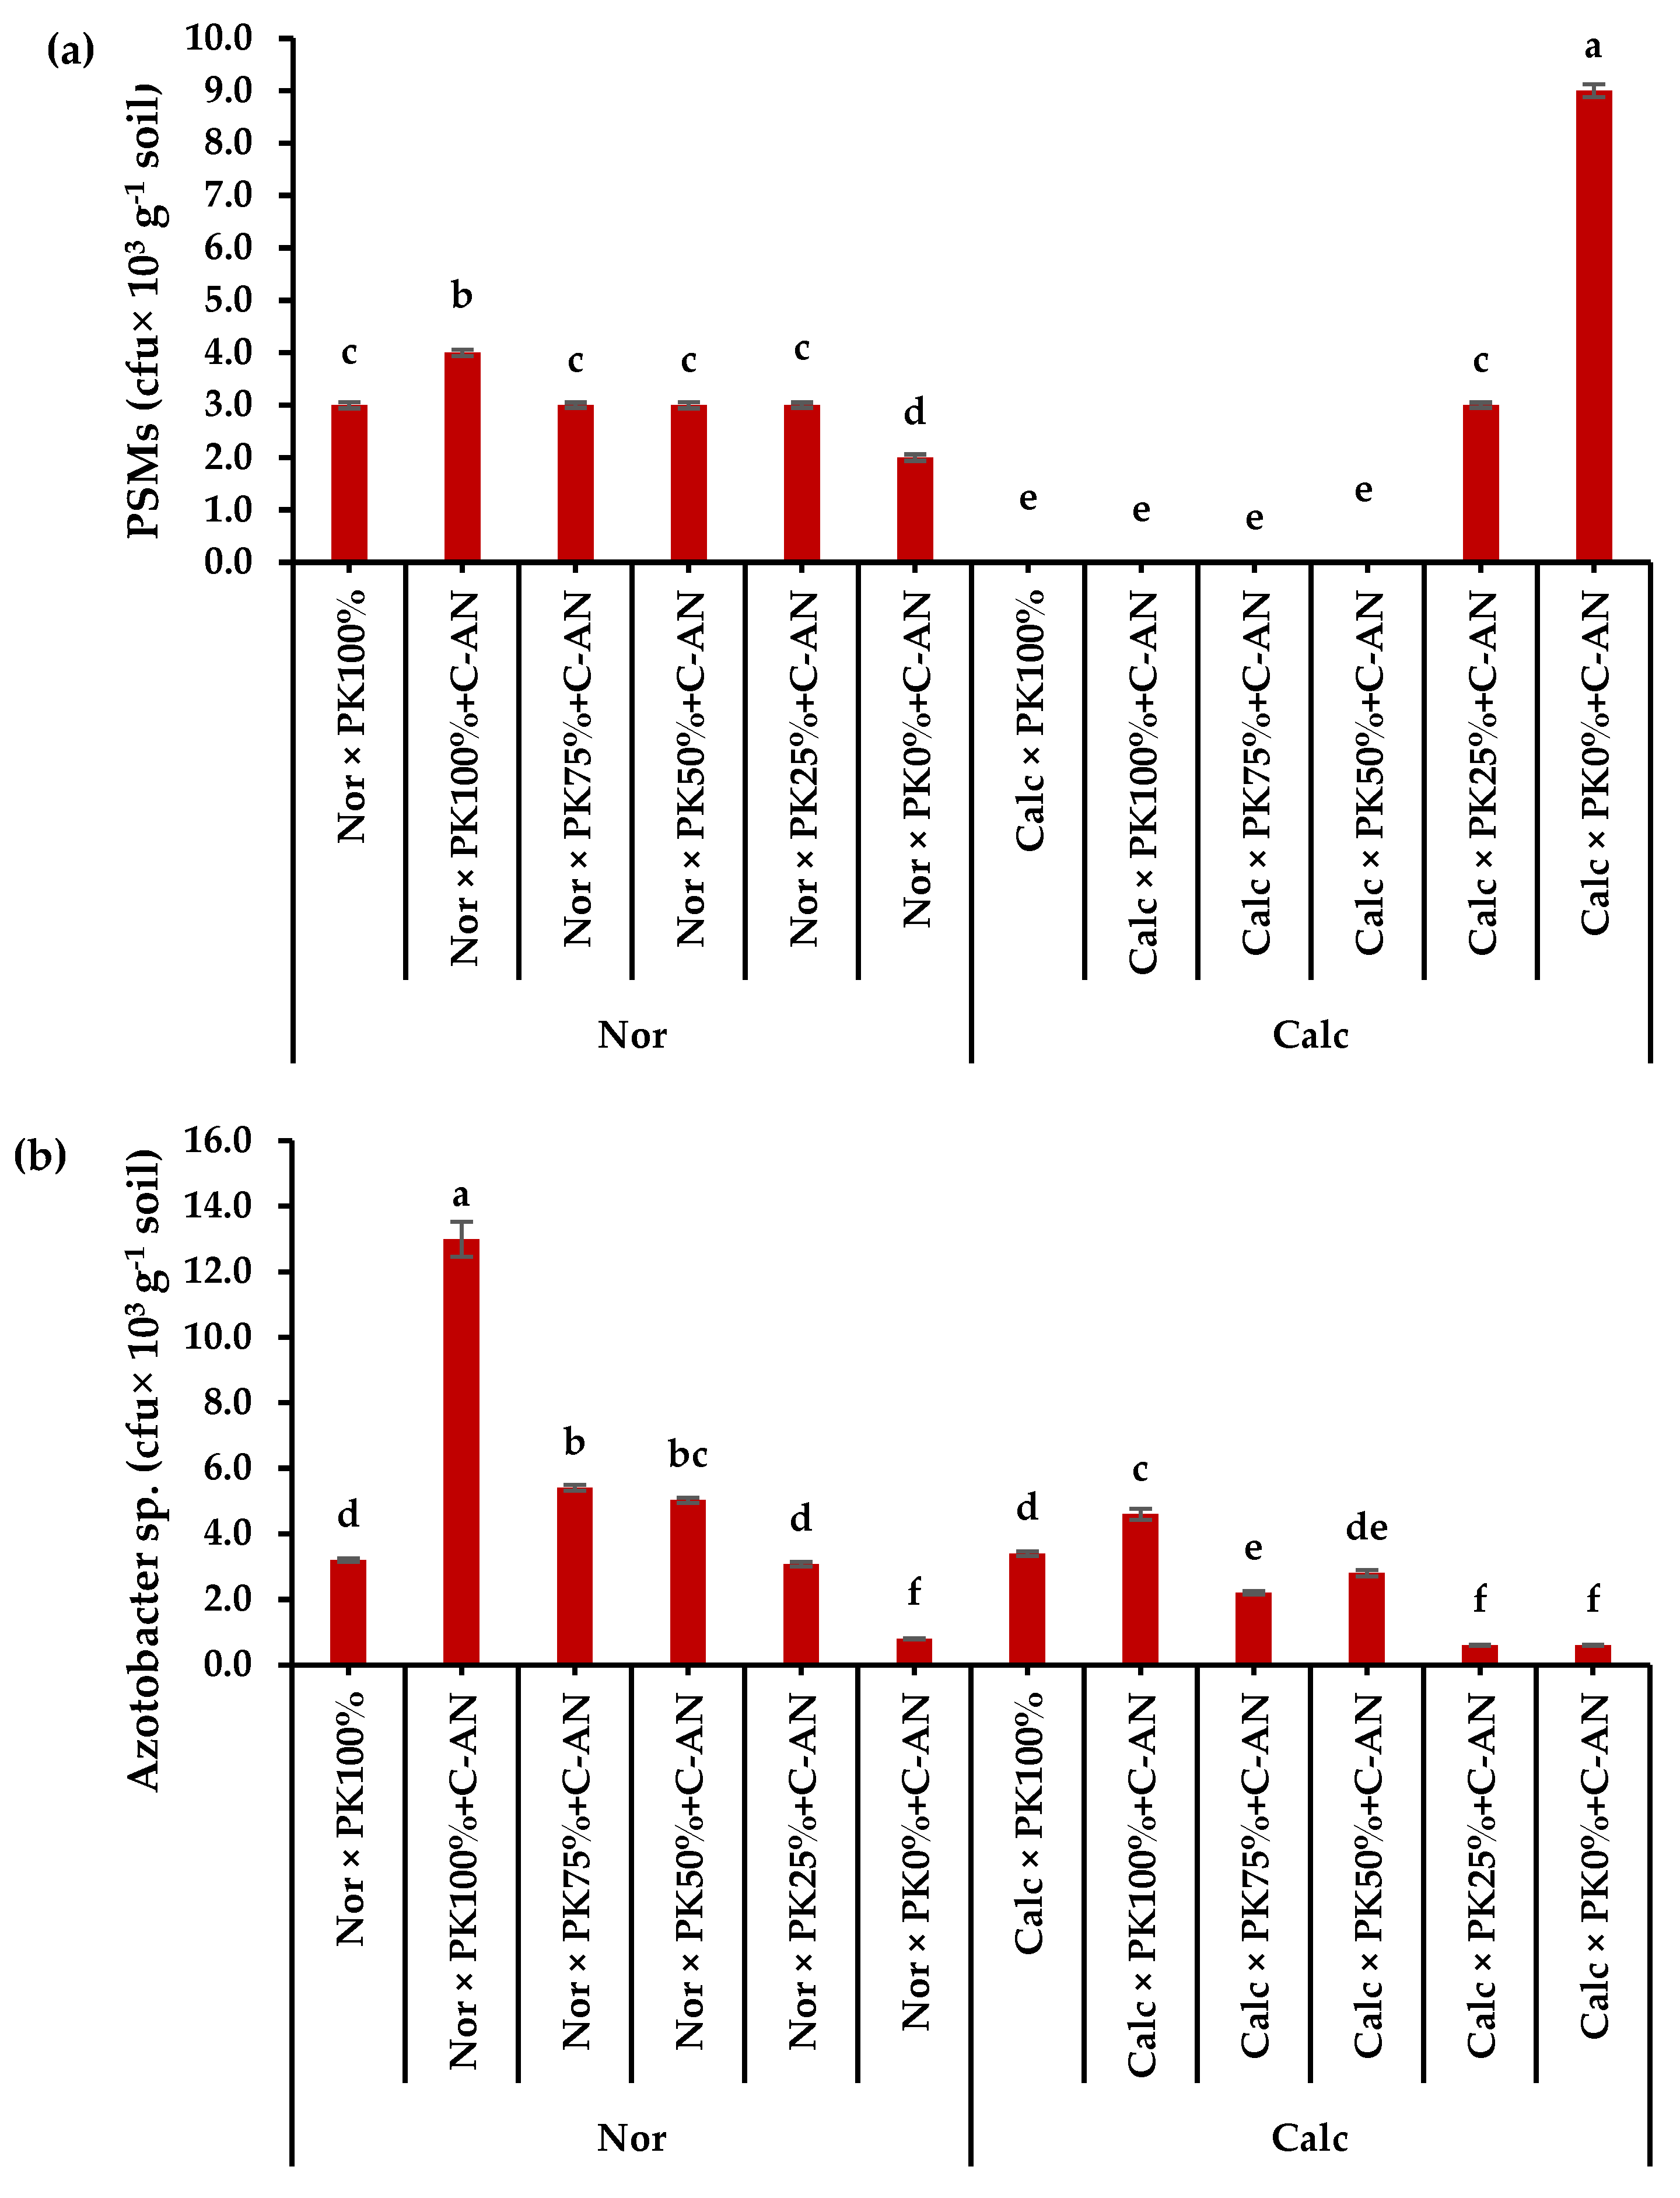
2.5. Microbial Community

The total population of phosphate-solubilizing microorganisms and Azotobacter sp. in the rhizosphere soil of quinoa were higher in normal soil than in calcareous soil (Table S11). The highest phosphate-solubilizing microorganisms corresponded to the PK0%+C-AN level, while the highest Azotobacter sp. quantity was observed in PK100%+C-AN (Table S11). A significant interaction was observed when adding PK+C-AN in both soil types. The highest phosphate-solubilizing microorganisms were found in calcareous soil at PK0%+C-AN levels, whereas higher PK+C-AN levels did not produce any activity, compared to when applied in normal soil. The highest Azotobacter sp. population was observed under PK100%+C-AN followed by PK75%+C-AN then PK50%+C-AN in normal soil (Figure 3).

2.6. Quinoa’s Growth, Yield and Yield-Related Attributes, and Harvest Index

Calcareous soil significantly decreased quinoa plant height, hectoliter weight, seed yield, and biological yield, but resulted in higher HI in comparison to plant grown under normal plant (Table S11). Statistical analysis showed significant increase in the plant height, hectoliter weight, seed yield, and biological yield when increasing the PK+C-AN level. The HI was lower in the PK25%+C-AN treatment, while the other levels recorded similar results (Table S11). There were significant differences in the plant height, plant dry weight, hectoliter weight, seed yield, and biological yield between PK+C-AN levels under calcareous and normal soil (Table 5). The application of PK100%+C-AN in normal soil and PK0%+C-AN in calcareous soil yielded the highest and lowest values of all growth and yield parameters, respectively. At reduced PK fertilization, co-application of A. niger and compost in calcareous soil generated positive results, with similar or higher recorded values to the PK100% in normal soil. Also, they increased plant height by 11.7 or 10.5%, hectoliter weight by 3.0 or 2.4%, seed yield by 49.1 or 39.5%, and biological yield by 43.4 or 33.6%, respectively, compared to the application of PK0%+C-AN in calcareous soil (Table 5).

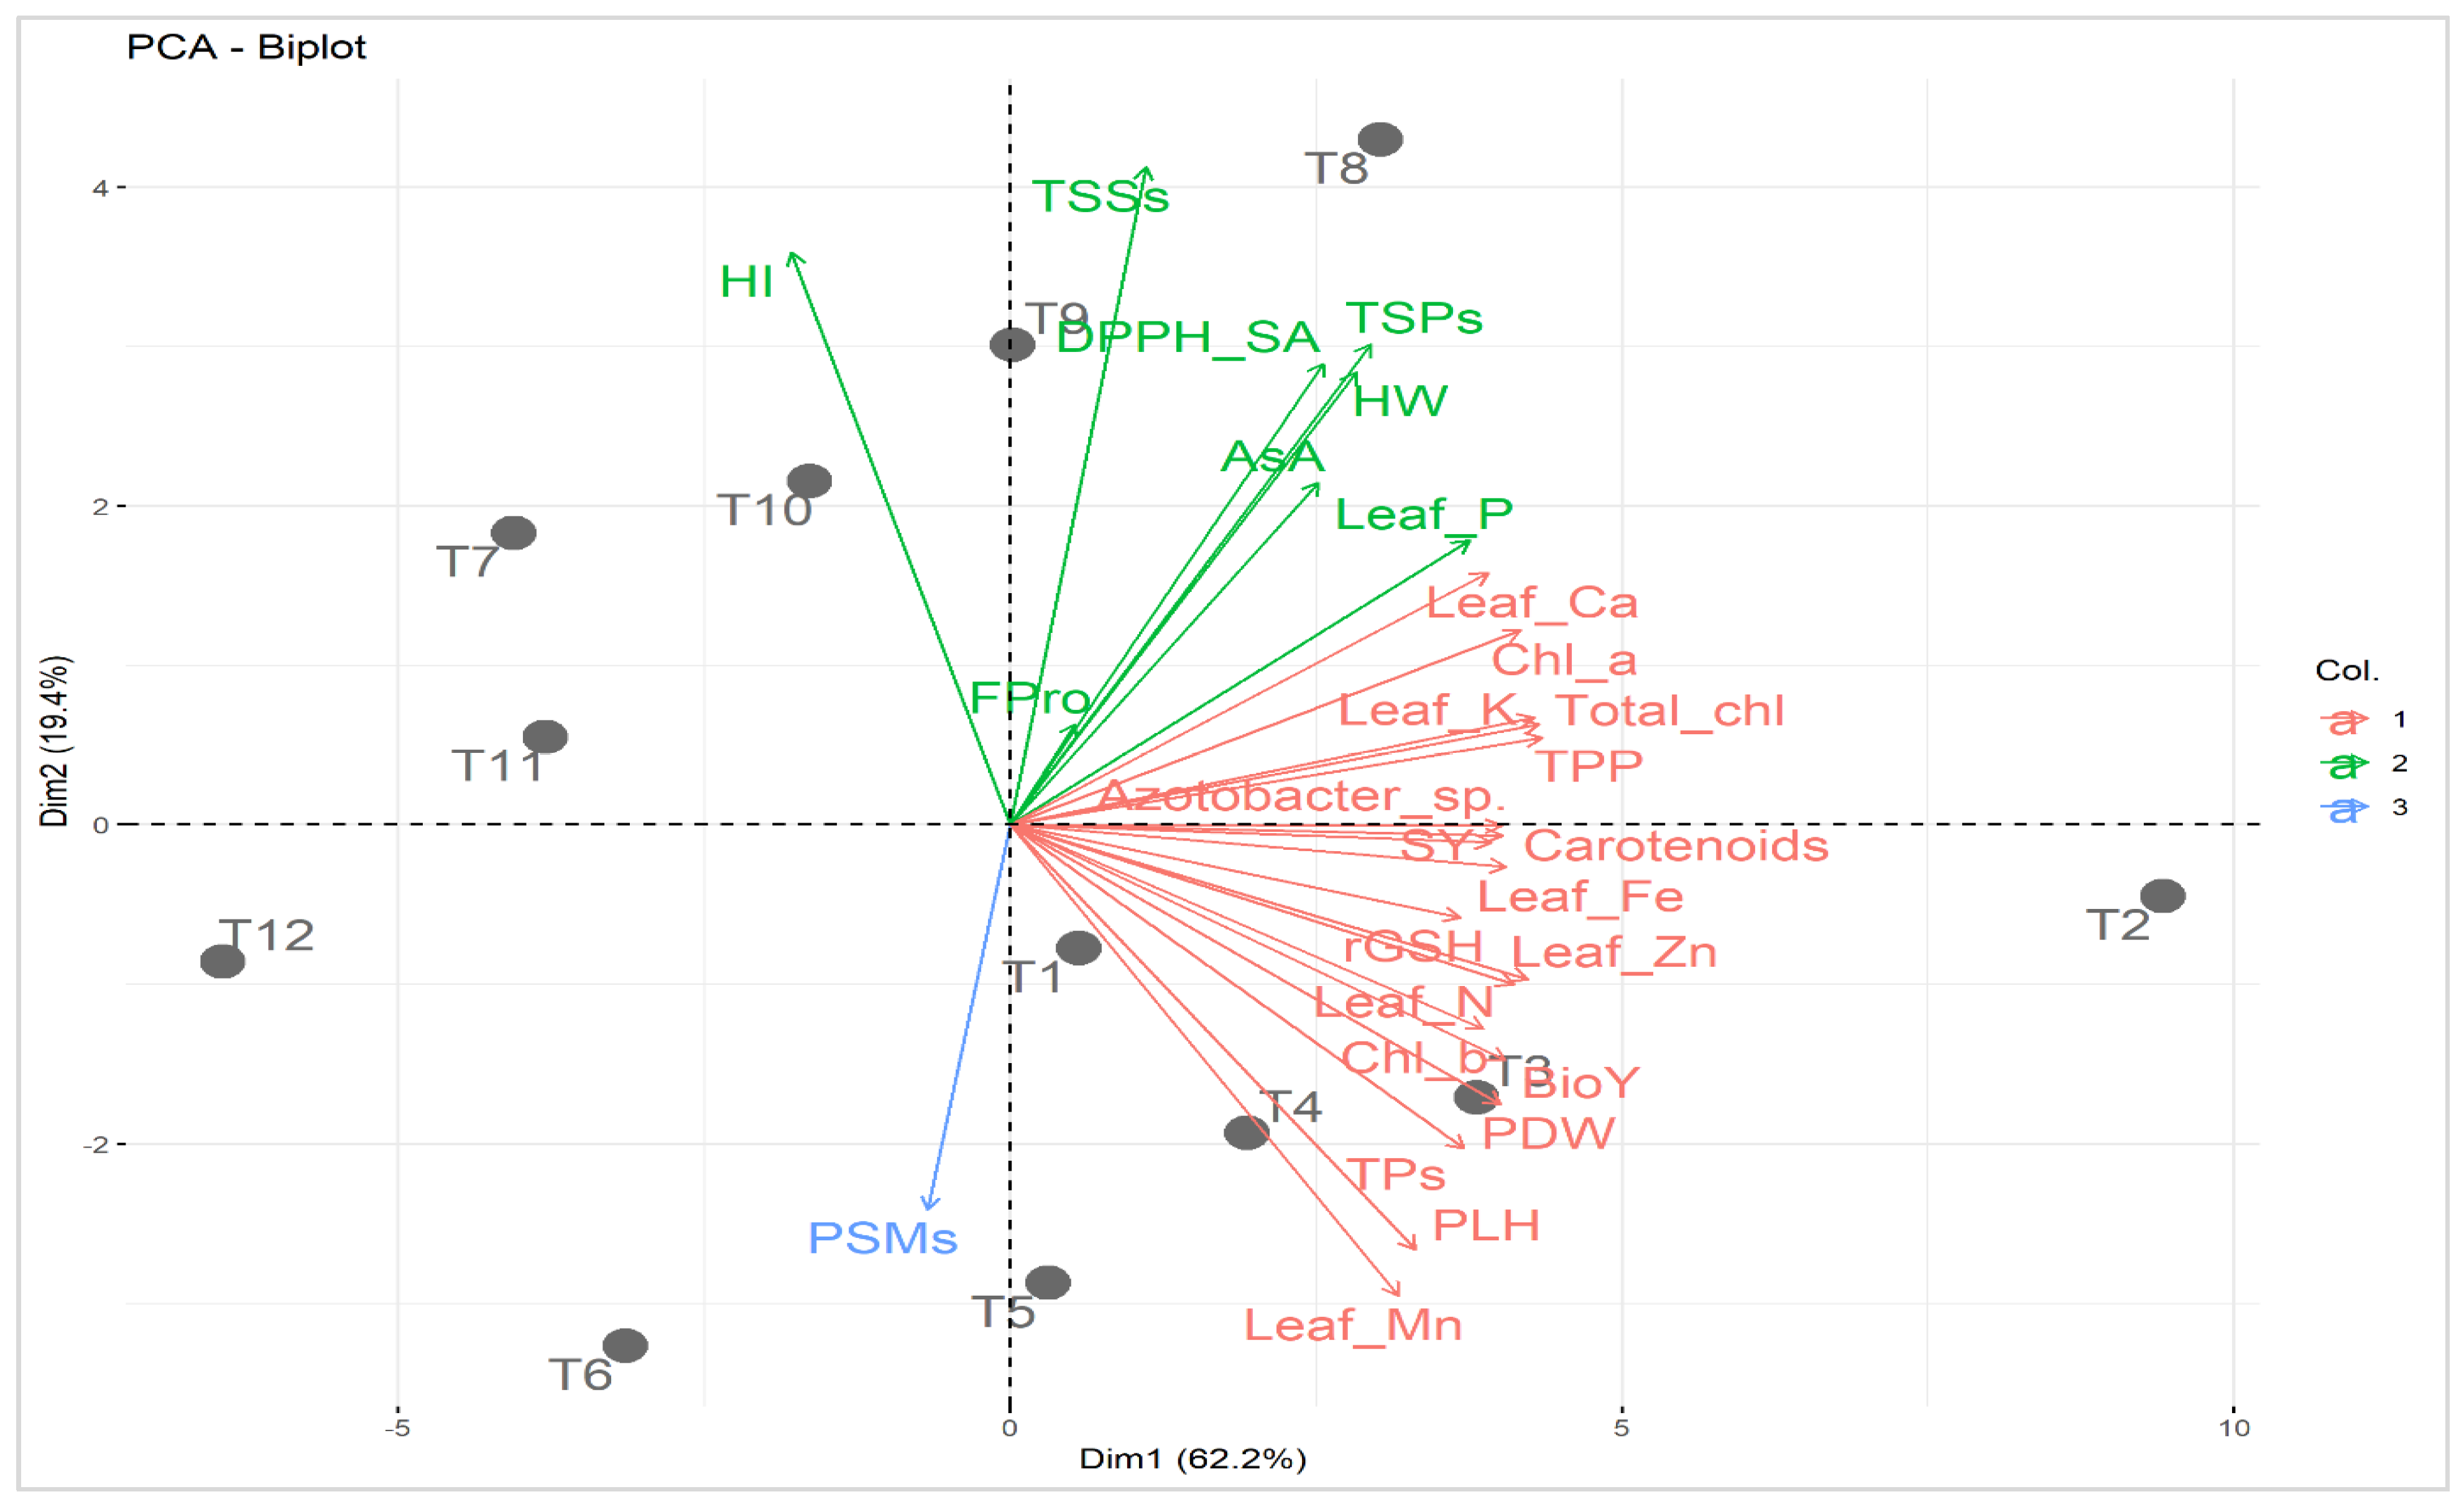
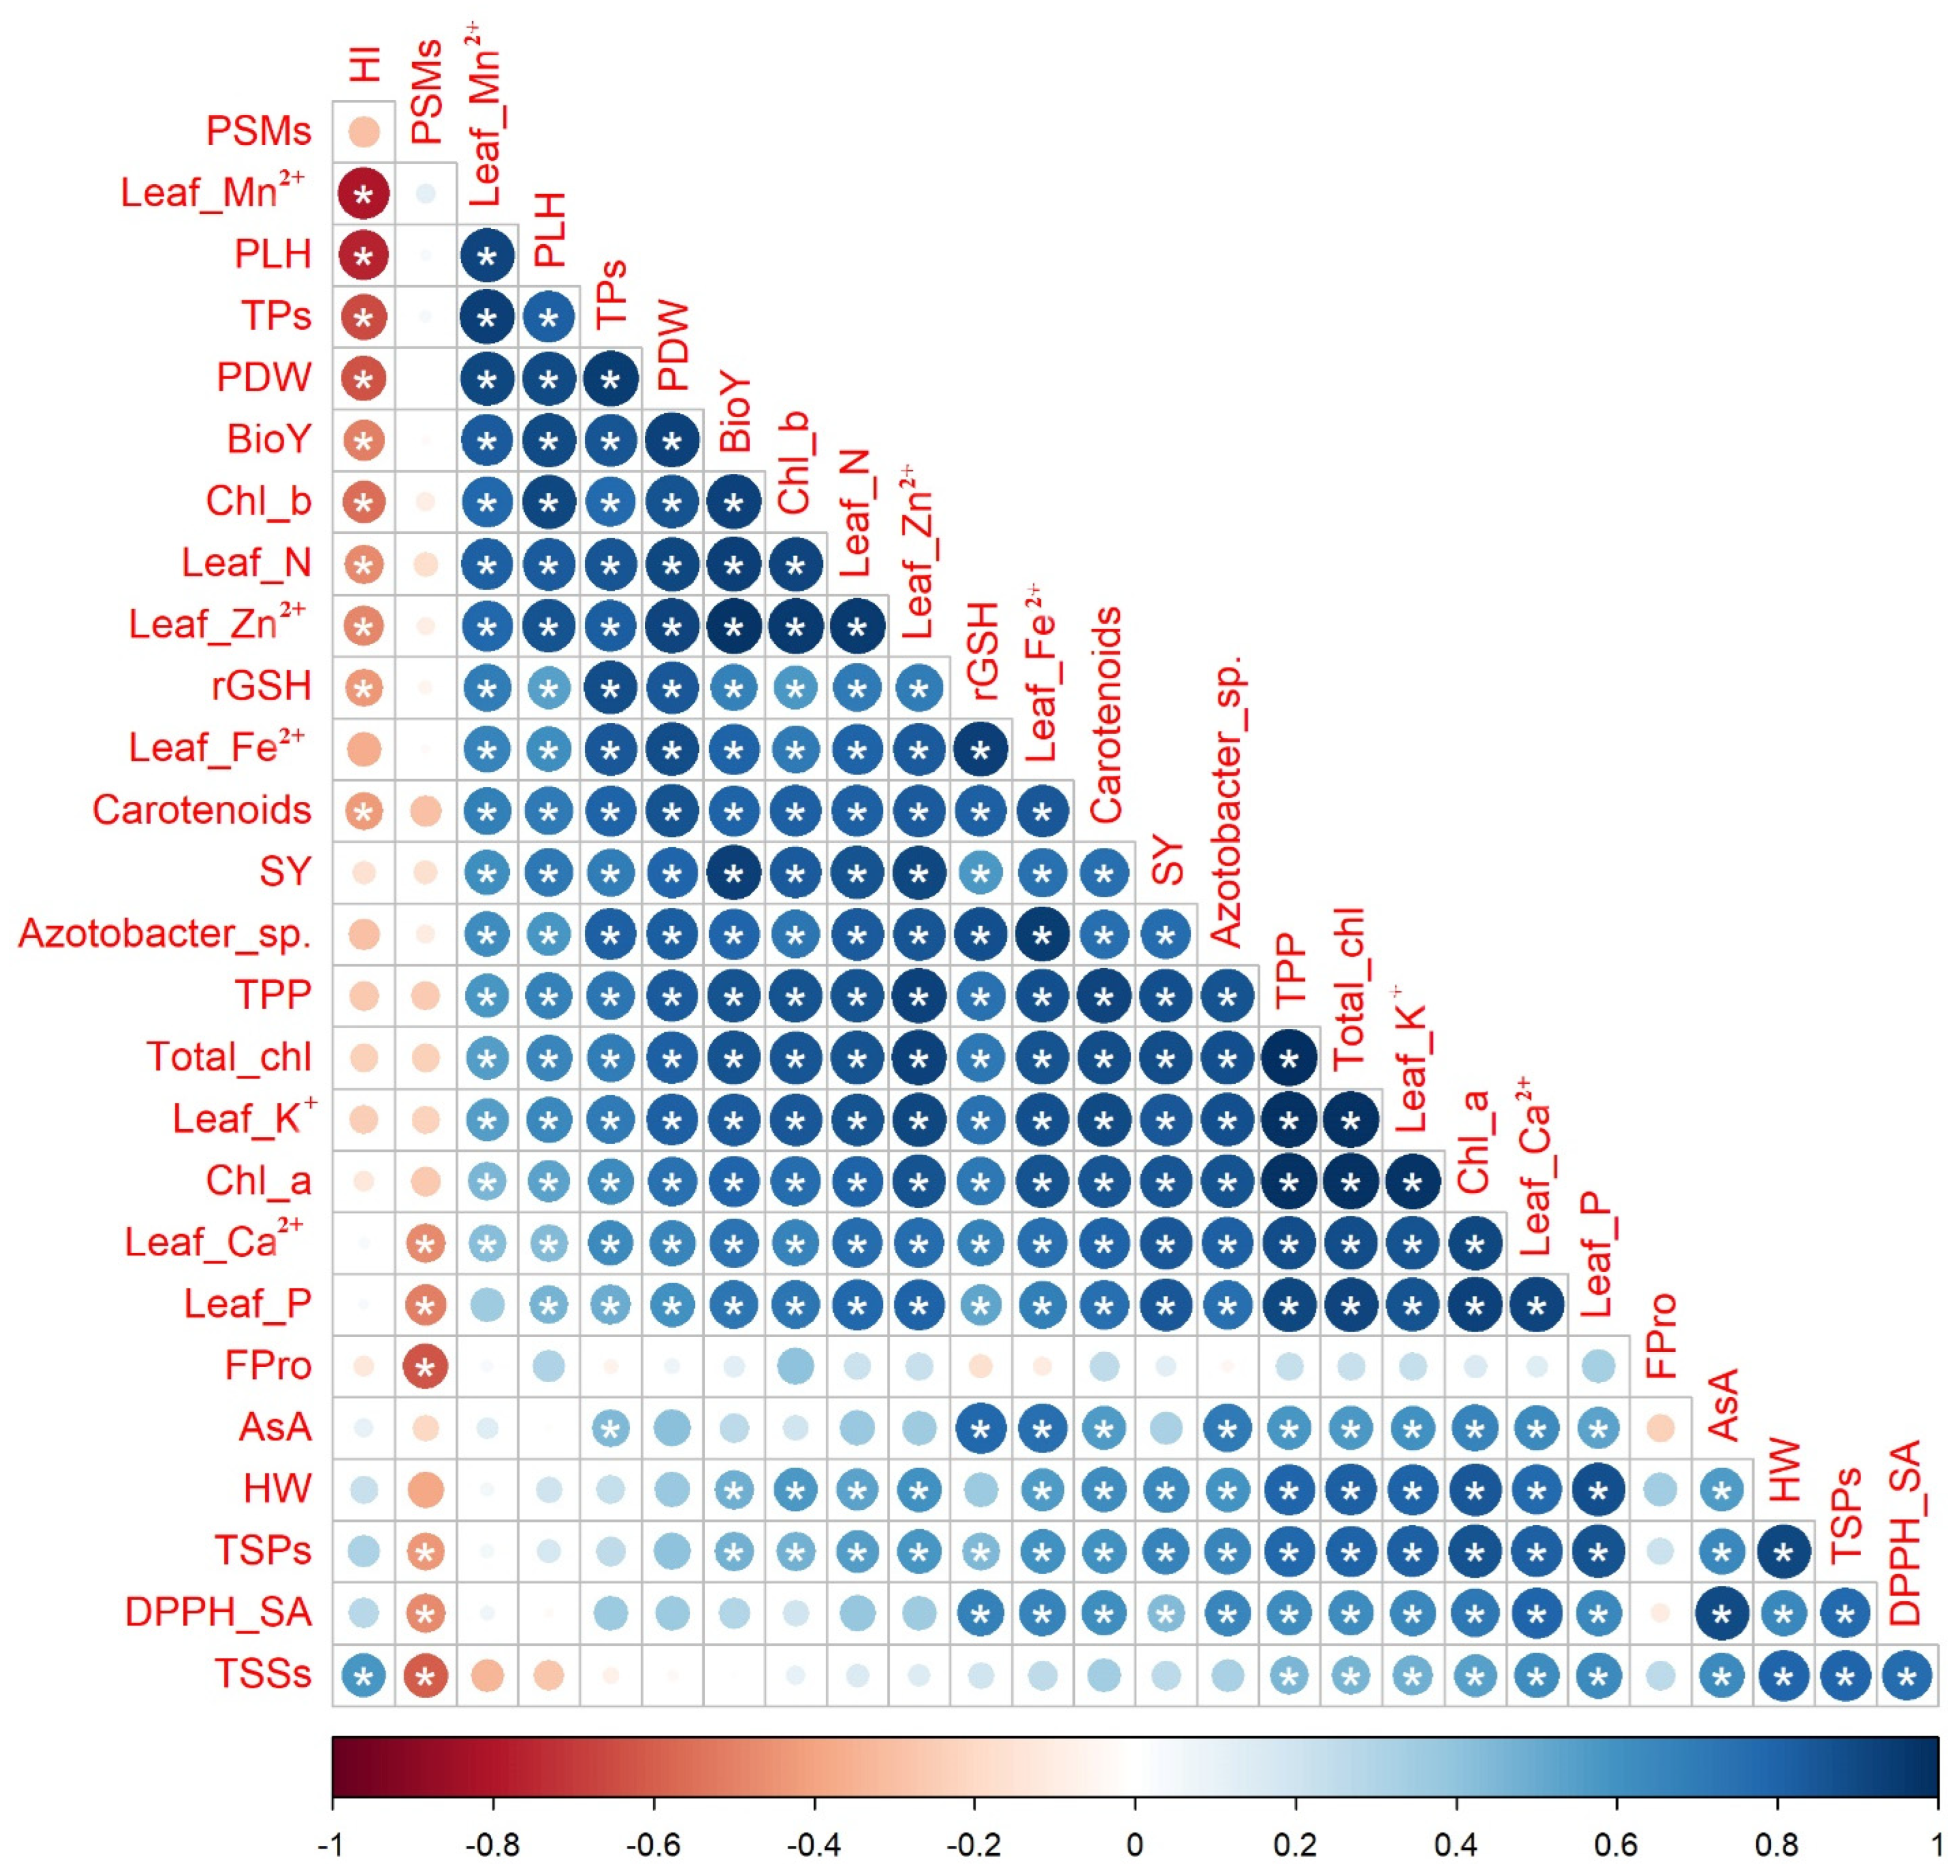
2.7. Relationship among Applied Treatments and Studied Attributes

Principal component analysis was carried out to study the relationship between applied treatments and studied attributes (Figure 4). The first two principal components described 81.6% of the variability. The PC1 displayed 62.2% of the variation and was correlated to soil type (i.e., normal and calcareous; Figure 4). The PC1 divided the applied treatments based on soil type into two groups; treatments in the normal soil were located on the positive side while those of Calc soil were situated on the negative side. On the other hand, PC2 exhibited 19.4% of the variation and was related to mineral PK fertilization combined with C-AN at both soil types. Treatments of mineral PK fertilization combined with C-AN in normal soil were located at the bottom part of PC2 while those of Calc soil were located at the top. The increase in mineral PK fertilization from 0 to 100% corresponded with PC2 from the bottom to the top at both sections of soil type. The best treatments were assigned for T8 (PK100%+C-AN) followed by T9 (PK75%+C-AN) in calcareous soil and T2 (Nor+PK100%+C-AN) followed by T3 (PK75%+C-AN) in normal soil. The adjacent vectors of studied characters reflected a positive correlation with each other. Quinoa seed yield and its related-attributes (e.g., PLH, PDW, HW, and BioY) displayed a strong relationship with photosynthetic pigments (e.g., chl a, chl b, total chl, carotenoids, TPP), leaf nutrients (e.g., N, P, K+, Ca2+, Fe2+, Zn2+, and Mn2+), and bacterial (e.g., PSMs and Azotobacter sp.) count in soil. Otherwise, seed yield and its related attributes exhibited a negative correlation with osmoprotectants and nonenzymatic antioxidants (e.g., TSPs, TSSs, FPro, rGSH, AsA, and TPs), as well as DPPH-SA.
The Pearson correlation coefficients, which are displayed in the correlogram found in Figure 5, were calculated to find out the level of association among selected attributes of quinoa plants based on the data obtained from the interaction of soil type and bio-organo-mineral treatments as averaged over both seasons. Significant, whether positive or negative with a p-value ≤ 0.05, or nonsignificant correlations were noticed between SY and each of the other chosen quinoa crop attributes. The SY had significant (p ≤ 0.05) positive correlations with each of the photosynthetic pigments (e.g., Chl a, Chl b, total chl, carotenoids, and TPP), osmoprotectants and nonenzymatic antioxidants (e.g., TSPs, rGSH, and TPs), leaf nutrients (e.g., N, P, K+, Ca2+, Fe2+, Zn2+, and Mn2+), soil Azotobacter sp. population count, and seed yield-related attributes (e.g., PLH, PDW, HW, and BioY), while being nonsignificantly negatively correlated with HI.

3. Discussion

Calcareous soils are commonly found in arid areas with hot weather, drought, and low precipitation [2,47]. This soil is characterized by poor hydro- and physicochemical properties [48,49], as well as low P and K availability [2]; therefore, microorganisms, particularly bacteria and fungi, help to chelate, acidify, and process P and K into soluble forms [50,51,52]. Hence, the application of compost supplemented with A. niger as a bio-organic fertilizer and reduced chemical fertilizers could be an important approach for sustainable agriculture development [53].
In the present study, quinoa plants were cultivated in calcareous soil, leading to physio-biochemical abnormalities. Quinoa plants responded to the stress induced by calcareous soil by reducing their photosynthesis pigments and biochemical traits (Tables S5 and S6), nutrient acquisition (Table S7), and, consequently, dry biomass and seed yield (Table S11). Similar observations have also been reported in sunflower plants grown in calcareous soil [54]. Moreover, the incorporation of bioorganic fertilizer into soil has been widely used to improve its hydrological, physicochemical, and biota properties, as well as nutrients’ availability and crop productivity [55,56]. In this experiment, A. niger was inoculated with compost, which has the ability to secrete tartaric acid, oxalic acid, and citric acid as well as dissolve elements in rocks and minerals, releasing the elements in a form that plants can easily absorb [57].
Our results revealed that the co-application of compost with A. niger as a bioorganic fertilizer product proportionally saved mineral P and K fertilizers and mitigated the harmful effect of calcareous soil on quinoa plants. In this context, combined A. niger with compost and reduced chemical fertilizer (75 or 50% of PK) achieved yields equivalent or superior to those obtained using full PK fertilizers without bioorganic fertilizers. Our findings were confirmed by those reported by Qaswar et al. [58], who found that application of organic amendments (e.g., wheat straw or swine manure) partially substituted NPK chemical fertilizers and improved soil quality and rice grain yield.
Under calcareous soil, increasing the PK rate plus C-AN enhanced the photosynthetic pigments. Although, the integrative application of A. niger and compost with reduced PK fertilization up to 25 or 50% (PK75%+C-AN or PK50%+C-AN) promoted the photosynthetic pigment contents compared to the application of sole full PK synthesized form. Bioorganic compost was found to improve root growth via secretion of auxins by microorganisms [31], along with the compost’s promotion of water holding capacity [48], which increases water absorption for higher chlorophyll biosynthesis [59]. Furthermore, increased chlorophyll and carotenoid content may be related to increased nutrient acquisition (Figure 2 and Table S7) in response to the co-application of compost with A. niger and higher PK fertilization.
It is clear that compost with microorganisms (in this case A. niger) can increase release elements in the soil and promote nutrient availability for plants in calcareous soil [60]. This was more evident in calcareous soil-treated C-AN, which increased the amount of osmoprotectants (Fpro, TSSs, and TSPs), nonenzymatic antioxidants (rGSH and AsA), and DPPH-scavenging activity (Figure 1 and Table S6). In this study, reduced PK fertilizers (75 or 50%) coupled with C-AN enhanced the accumulation of TSPs, FPro, and TSSs compared to full PK fertilization (PK100%) without C-AN in calcareous soil (Figure 1). These osmolytes are involved in maintaining cell turgor for osmotic adjustment, facilitating water and nutrient uptake, and thus stimulating the biosynthesis of photosynthetic pigments [61,62,63,64]. Moreover, accumulation of such compatible solutes together with nonenzymatic antioxidants (e.g., AsA, rGSH, and total phenolics; Figure 1) aids in stabilizing proteins, cellular membrane structure, and mitigating oxidative damage under stress conditions [49,65,66], consequently reflected in the increased yield and quality of quinoa. The AsA, rGSH, TPs, proline, and carotenoids are effective ROS scavengers that can protect stressed quinoa plant tissues under abiotic stress [67,68], and in this experiment, all increased in line with increasing PK levels when integrated with compost with A. niger (Tables S5 and S6). Furthermore, quinoa plants cultivated in calcareous soil treated with PK (particularly at higher levels) and C-AN displayed greater total antioxidant activity (68.6-77.9%) compared to those fertilized only with PK100%. The total antioxidant activity was analyzed as DPPH radical scavenging, which is broadly applied to screen antioxidant activity for the inhibition of lipid peroxidation [69].
Integrative compost with A. niger and higher PK fertilization enhanced the macro- and micronutrient acquisition in quinoa plant leaves under calcareous soil (Figure 2). In this respect, increasing nutrient acquisition may be linked to the impact of application of bioorganic fertilizers on soil pH, soil biota, and organic matter, boosting the breakdown and availability of macro- and micronutrients for plant uptake [70,71]. Integrative application of phosphate-solubilizing microorganisms with poultry manure was found to raise nutrient availability (i.e., Ca and P) in the calcareous soil [72]. After the addition of A. niger fermentation broth, the soil’s pH value decreased, and the soil’s effective P, exchangeable Ca2+, Mg2+, and effective Fe2+, Cu2+, and Zn2+ were efficiently liberated in the low pH condition, leading to an increase in the amount of nutrient elements present in the soil [58]. Partial exchange of mineral fertilization with organic fertilizers provides more macro- and micronutrient availability, resulting in stimulated photosynthetic capacity, growth, and yield of the common bean plant [73].
The improvements in nutrient acquisition by the integrative high PK level and C-AN were simultaneously associated with higher nutritive contents of quinoa seeds under calcareous soil, given the increased crude protein, crude lipid, carbohydrate (Table 2), and mineral contents (Table 4) of quinoa seeds. Moreover, the combination of A. niger with compost and reduced PK fertilization up to 75% enhanced the total phenolic compounds, total flavonoid compounds, half maximal inhibitory concentration, and antiradical power of quinoa seeds produced in calcareous soil (Table 3). Half maximal inhibitory concentration denotes the amount of a particular inhibitor that is needed to reduce a certain biological activity by 50%; thus, the higher the half maximal inhibitory concentration value, the less potent the inhibitor [74]. Additionally, the antiradical potential provides insights into lipid peroxidation and oxidative processes [75]. Therefore, our results indicated that the co-application of compost with A. niger plus reduced PK fertilization could enhance the chemical composition and antioxidant capacity of quinoa seeds grown in calcareous soil. Our findings are in harmony with the results reported by Youssef and Farag [76], and Yang et al. [77].
In the current research, the phosphate-solubilizing microorganism population increased in calcareous soil treated with C-AN without PK fertilization, while the Azotobacter sp. population increased in normal soil treated with high levels of PK fertilization plus C-AN (Figure 3a and b). Long-term NPK mineral fertilization decreased the community of phosphate-solubilizing microorganisms compared to long-term manure fertilization, which increased total carbon and N, regulated the soil pH, and provided favorable conditions for microorganisms [48,78].
In the present study, at reduced PK fertilization levels (50 or 75%), compost with inoculated A. niger notably increased the dry biomass accumulation, seed yield, and biological yield of quinoa plants compared to those only fertilized with mineral PK in calcareous soil (Table 5). These outcomes might be explained by an increase in osmolytes and antioxidant accumulation (Figure 1), nutrient acquisition (Figure 2), leading to an increase in photosynthetic pigments. In this context, our results agree with those reported by Qaswar et al. [58] on rice and Mohamed et al. [73] on common bean. Coupling poultry manure or farmyard manure with phosphate-solubilizing microbes elevated the maize shoot and root biomass over sole mineral source [79].
The current study demonstrated the efficacy of bioorganic fertilizers (in this case, A. niger with compost) as a valuable strategy for enhancing the performance and nutritive content of quinoa plants grown in calcareous soil. Therefore, in the future, growers can reduce P and K chemical fertilization up to 25–50% along with the application of bioorganic fertilizer for maintaining or even increasing quinoa yield in calcareous soil.

4. Materials and Methods

4.1. Experimental Location and Climatic Conditions

The current study was carried out at the Agriculture Faculty’s Research Farm, Fayoum province, Egypt (29°02′ and 29°35′ N latitudes and 30°23′ and 31°05′ E longitudes) during the 2021/22 and 2022/23 cropping seasons. Based on the aridity index [80], the region has a semiarid Mediterranean climate characterized by wet winters and arid summers. The main agrometeorological data recorded during the quinoa growing seasons (November–May) in 2021/22 and 2022/23 are presented in Figure S1. Based on their basic properties for 0–0.3 m depth (Table 6), determined according to the methodology described by Klute and Dirksen [81] and Page et al. [82], two different soils at the experimental sites were selected to conduct this experiment. The first is normal (i.e., noncalcareous) sandy loam and the other is calcareous sandy loam (˃15% CaCO3 content), which are referred to hereafter as normal and calcareous, respectively.

4.2. Fungi Isolation and Assessment of Its Phosphate and Potassium Solubilizing Ability

Fifteen fungal isolates were obtained from soil samples randomly collected from normal and calcareous agricultural soils in Fayoum Governorate, Egypt using potato dextrose agar (PDA) media. Morphologically distinct fungal colonies on the plates were chosen, purified through repeated culturing, relocated to a new PDA slant, and incubated at 4 °C.
Screening for phosphate and potassium solubilizing activity of all fungal isolates was carried out by allowing the fungi to grow on fresh Pikovskaya and Aleksandrov selective agar media, respectively, for 7 to 10 days at a temperature of 25 °C. The formation of a transparent halo zone surrounding the fungal colonies is indicated their ability to solubilize tri-calcium phosphate and potassium aluminum silicate, respectively [83,84]. Out of the 15 fungal isolates, the most promising phosphate and potassium solubilizing fungal isolate was selected based on its higher ability to solubilize phosphate and potassium, expressed as the solubilization index. The phosphate solubilization index (P-SI) was determined using the method of Premono et al. [85] and Elias et al. [86] as follows: P-SI = (colony + halo zone diameter)/colony diameter, while the potassium solubilization index was calculated via Khandeparkar’s selection ratio (KSR) according to Prajapati and Modi [87] as follows: KSR = diameter of clearance zone/diameter of fungus colony growth.

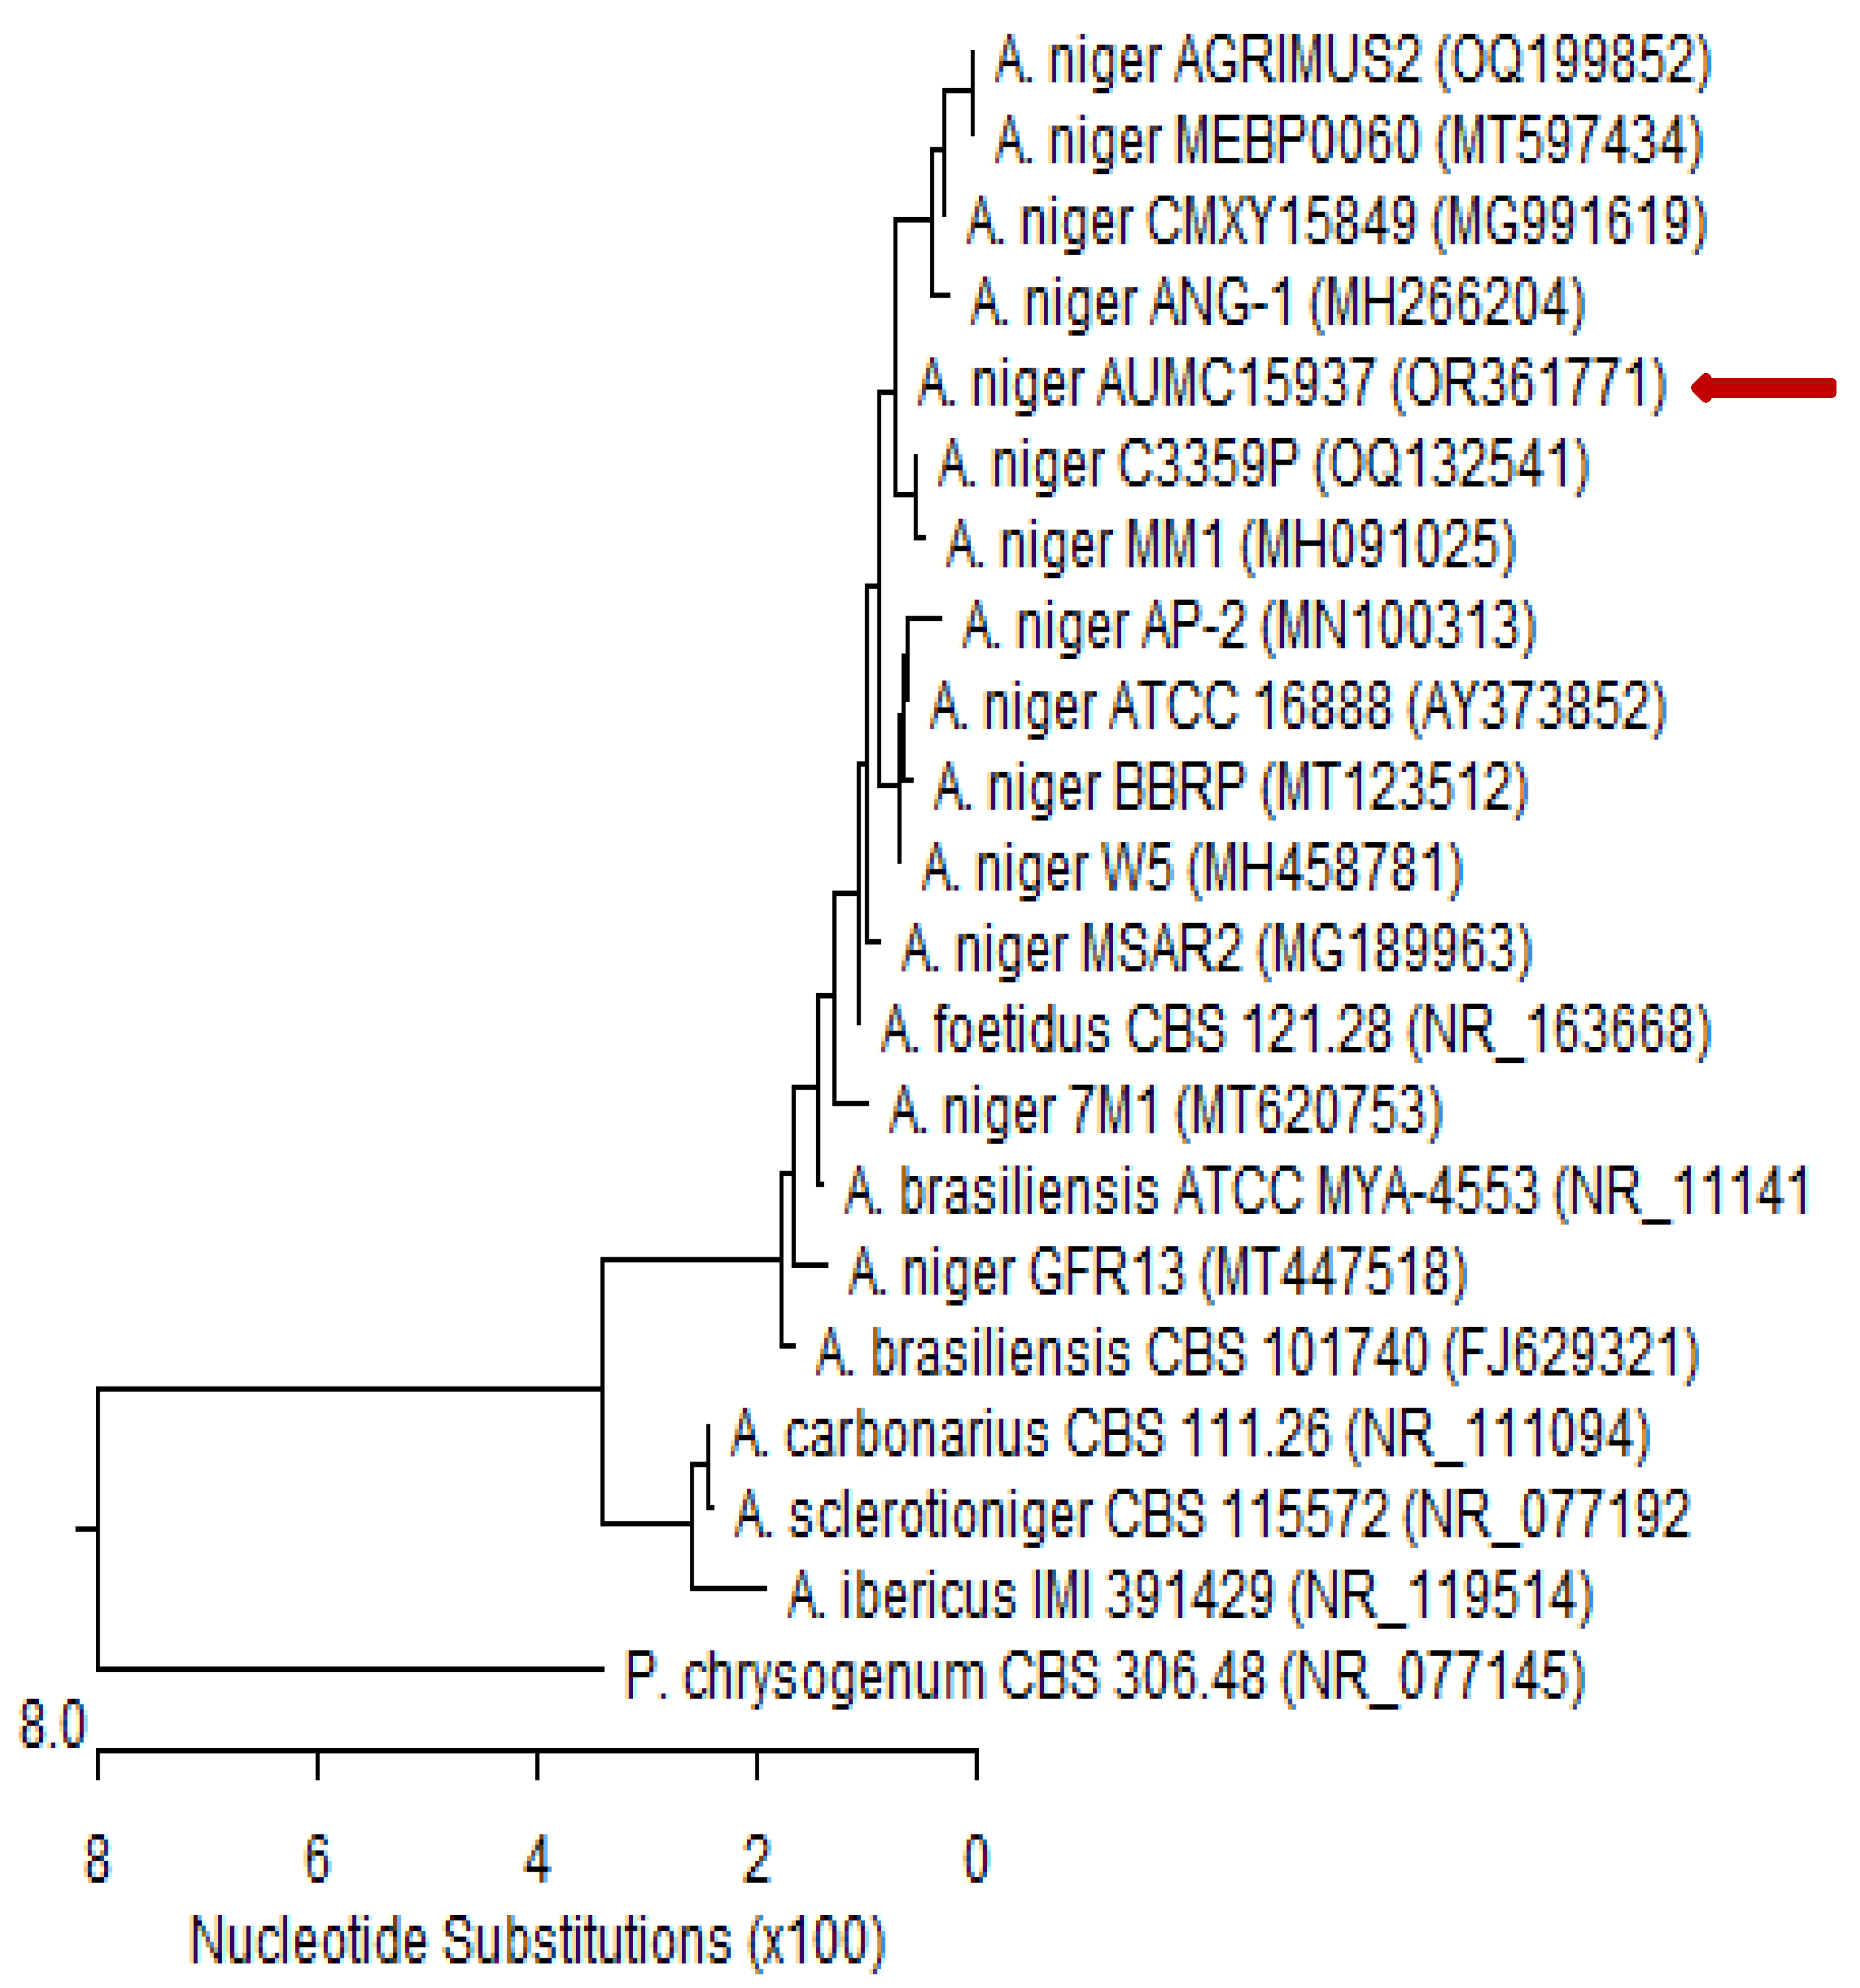
4.3. Molecular Identification of the Tested Fungal Isolate

The fungal isolate was cultured in sterile Petri plates containing 20 mL of autoclaved Czapek’s yeast extract agar (CYA) and incubated at 28 °C for 5 days [88]. Patho-gene-spin DNA/RNA extraction kit (iNtRON Biotechnology Company, Sungnam, Korea) was used to extract DNA at the Molecular Biology Research Unit, Assiut University, Egypt. The extracted DNA was kept in a 1.5 mL autoclaved Eppendorf tube prior to shipping to SolGent Company, Daejeon, Republic of Korea, for polymerase chain reaction (PCR) and rRNA gene sequencing. The PCR was performed using forward 5′-TCCGTAGGTGAACCTGCGG-3′ (ITS1) and reverse 5′-TCCTCCGCTTATTGATATGC-3′ (ITS4) primers, which were incorporated into the reaction mixture. The purified PCR product was sequenced with the same primers with the addition of ddNTPs in the reaction mixture [89,90]. The Basic Local Alignment Search Tool (BLAST) available on the National Centre for Biotechnology Information (NCBI) database was used to analyze the acquired sequences. The phylogenetic sequence tree (Figure 6) was constructed using MegAlign software version 5.05 (DNA Star, Madison, WI, USA) according to Tamura et al. [91]. Based on ITS sequences of rDNA, the genomic sequence of our isolate was deposited in the NCBI GenBank database.

4.4. Preparation of Aspergillus niger Inoculum

Liquid formulations of A. niger were prepared by growing the fungus in potato dextrose broth. Spore suspension was obtained by mixing vigorously, which was measured using direct microscopic counting with a hemocytometer [92]. The fungal spore suspension used as inoculum was adjusted at a 107-spore mL−1 concentration.

4.5. Compost Preparation

Compost was prepared following the entire procedure described by Idrovo-Novillo et al. [93] with a slight modification using whole plants as raw material instead of plant shoots. Twenty-five kg of Pelargonium graveolens waste material was well mixed with rice straw bulking material (0.5 kg) to provide some free air pores within the composted material required to maintain the aerobic conditions and potassium humate (0.5 kg) in addition to cattle dung (12 kg) and green Trifolium alexandrinum L. plants (12 kg) as a source of N element. All these components were well blended, which composed the compost to a respective extent of 50, 0.5, 0.5, 24, and 24%, respectively. The components were then composted in a pilot plant using a turning-pile technique in a pile measuring 20 m in length, 2.5 m in width, and 1.5 m in height. The composting mixture pile was turned over three times a month during the bio-oxidation stage using a front-end-loader tractor and regularly sprinkled with water to maintain about 60% (v/w) moisture level. The composting process lasted from mid-April to mid-July, up to the combined maturation of all compost materials. The physicochemical properties of the prepared compost used in this experiment are presented in Table 7.

4.6. Treatments, Experimental Design, and Agronomic Management

The experimental treatments were laid out in the field as a completely randomized block design (CRBD) replicated thrice. Six treatments were applied in both normal and calcareous soils, for a total of twelve treatments. The treatments applied in this experiment are bio-organo-mineral applications as follows: (1) PK100%: the soil received the conventional full recommended dose (FRD) of mineral phosphorus (P) and potassium (K) fertilizers; (2) PK100%+C-AN: the soil received PK100% + compost at a rate of 20 t ha−1 + PK-solubilizing A. niger; (3) PK75%+C-AN: the soil received 75% out of conventional FRD of mineral P and K fertilizers + compost at a rate of 20 t ha−1 + PK-solubilizing A. niger; (4) PK50%+C-AN: the soil received 50% out of conventional FRD of mineral P and K fertilizers + compost at a rate of 20 t ha−1 + PK-solubilizing A. niger; (5) PK25%+C-AN: the soil received 25% out of conventional FRD of mineral P and K fertilizers + compost at a rate of 20 t ha−1 + PK-solubilizing A. niger; (6) PK0%+C-AN: neither mineral P nor mineral K fertilizer was added to the tested soil but it only received compost at a rate of 20 t ha−1+ PK-solubilizing A. niger. For the P fertilizer, the FRD (72 kg P2O5 ha−1) was added basely as calcium superphosphate (12% P2O5) at planting. For the K fertilizer, the FRD (60 kg K2O ha−1) as potassium sulfate (48% K2O) was applied with 2/3 as a basal dose at planting, and the remaining 1/3 was topdressed at the initiation stage of the main panicle. For the nitrogen (N) fertilizer, 60 kg N ha−1 in the form of ammonium nitrate (33.5 N) was added in three equal splits (1/3 at planting and the remaining 2/3 in two additions, 1/3 for each, during the vegetative growth stage before the beginning of panicle emergence). The compost, as an organic amendment, with a rate of 20 t ha−1 (local recommendation rate), was thoroughly incorporated and uniformly mixed into the soil (20 cm depth) a week before the sowing for all treated plots using a manual harrow. The root rhizosphere zone of quinoa for each plant hole was drenched twice with 50 mL (25 mL for each time) of freshly prepared A. niger spore suspension (107 spores mL−1) at sowing time and after 21 days from sowing (DFS).
The quinoa (Chenopodium quinoa Willd) cultivar Misr-1 (kindly provided by Crops Research Institute, Ministry of Agriculture and Land Reclamation, Egypt) was chosen for this experiment because it grows promptly and produces great productivity. The sowing dates of quinoa seeds in this experiment were 23 November 2021 (cropping season 2021/22) and 28 November 2022 (cropping season 2022/23) and the harvested dates were 31 March 2022 and 6 April 2023, respectively. About 4–6 quinoa seeds were sown on one side of the ridges at a depth of 1–2 cm in holes 0.2 m apart, which thinned later into two healthy and uniform seedlings per plant hole. The quinoa thinning process was performed at BBCH 12 stage (four true leaves) according to the scale of Sosa-Zuniga et al. [94] guided by the Biologische Bundesanstalt, Bundessortenamt und CHemische Industrie (BBCH) coding scale proposed by Meier et al. [95]. The net area of each experimental plot was 18 m2 (3.6 m × 5 m) and included six ridges, 0.6 m wide, 5 m long, and 0.15 m in height. In this experiment, a surface flood irrigation system with fresh irrigation water having an electrical conductivity of 1.58 dS m−1, on average over both seasons, was used to regular irrigate quinoa plants on a needed basis. Following the Egyptian Agricultural Research Center’s recommendations, the proper agronomic practices for local commercial quinoa crop production were performed as needed.

4.7. Sampling and Measurements

At flowering initiation (BBCH 59/60) stage, according to Sosa-Zuniga et al. [94] and Meier et al. [95], thirty-six fully expanded young leaves were collected randomly from 18 plants from each treatment (6 plants per replicate) for the subsequent physio-biochemical analyses.

4.7.1. Photosynthetic Pigment Assay

The chlorophyll a (Chl a) and chlorophyll b (Chl b), and total carotenoid content of quinoa leaves were extracted and quantified using the N, N-dimethyl formamide (DMF) solvent following the protocol of Lichtenthaler and Buschmann [96]. Three leaf discs with an area of 58.91 mm2 were submerged in 2 mL DMF (99.8% purity) solvent (Sigma-Aldrich, St. Louis, MO, USA) and stored for 24 h at 4 °C in a dark place. The supernatant after that was separated and its absorbance was read spectrophotometrically at 664, 647, and 480 nm wavelengths for quantification of Chl a, Chl b, and carotenoid contents, respectively, using a double-beam VWR 6300 UV–Vis spectrophotometer (Palo Alto, CA, USA). The total chlorophyll (Total chl; mg cm−2) content was computed by adding Chl a to Chl b [97], while total photosynthetic pigment (TPP; mg cm−2) was calculated by totalizing the Chl a, Chl b, and carotenoid contents.

4.7.2. Osmoprotectants, Nonenzymatic Antioxidants, and 2,2-diphenyl-1-picrylhydrazyl-Scavenging Activity (DPPH-SA)

Total soluble proteins (TSPs) as mg g−1 dry weight (DW) of quinoa leaf tissues was measured following the Lowry–Folin method [98]. Total soluble sugars (TSSs; mg g−1 DW) content was measured spectrophotometrically following the anthrone sulfuric acid method described by Fales [99] and Schlegel [100]. Free proline (FPro; mg g−1 DW) content was measured following the acidic ninhydrin colorimetry method described by Ábrahám et al. [101] using toluene as a blank solution and L-proline in plotting the standard curve. The reduced glutathione (rGSH; mg g−1 DW) content was quantified based on GSH oxidation using Ellman’s reagent (i.e., 5,5′-dithiobis-2-nitrobenzoic acid) according to Anderson’s [102] method. The rGSH concentrations in the samples were then computed using a standard calibration curve obtained from a series of pure GSH concentrations (Merck, Darmstadt, Germany). Ascorbic acid (AsA; mg g−1 DW) was extracted and assessed spectrophotometrically at 760 nm as per Jagota and Dani [103] using a Trichloroacetic acid (5% by volume) solution and a Folin–Ciocalteu reagent solution diluted 10-fold (1:10 v:v). A standard calibration curve using pure AsA was used to determine the AsA content in the samples. Total phenolics (TPs; mg g−1 DW) were extracted from dried quinoa leaves in 70% ethanol (v/v) at 40 °C overnight and quantified as per the colorimetric method adopted by Sauvesty et al. [104], and the TPs concentrations in the samples were computed using a pyrogallol standard calibration curve. The DPPH-SA (%), which is commonly employed to reflect the overall free radical scavenging capacity of nonenzyme antioxidants, was assessed following a modified version of the procedure given by Abe et al. [105].

4.7.3. Determination of Macro- and Micronutrient Contents in Quinoa’s Leaf and Seed

After drying and ground into a fine powdering, the quinoa’s leaf and seed samples were wet digested in concentrated H2SO4 mixed with HClO4 (3:1, v/v, respectively) by heating up to 280 °C until the plant material was colorless to determine their content of nutrient elements. The total N content (mg g−1 DW) of leaf was determined following the Kjeldahl procedure [106], using Gerhardt’s micro Kjeldahl apparatus. The total P content in leaf (mg g−1 DW) or in seed (g 100−1 g DW) was determined following the molybdenum-reduced molybdophosphoric blue colorimetric procedure [107]. The total content of cationic and trace elements (i.e., potassium—K+; sodium—Na+; magnesium—Mg2+; calcium—Ca2+; iron—Fe2+;zinc—Zn2+; or manganese—Mn2+) in quinoa leaves (mg g−1 DW) or seeds (g 100−1 g DW) was determined [108] using flame atomic absorption spectroscopy (Spectra-55 AA, Agilent Technologies, CA, USA).

4.7.4. Quinoa Seed’s Proximate Chemical Composition

Following the Association of Official Analytical Chemists (AOAC) standard methodologies [109], the proximate chemical composition of raw seeds of quinoa was determined. The moisture content in a 5 g crushed seed sample of quinoa was assessed using the AOAC 934.01 method with an electric oven at 105 °C until constant weight. The ash content (incineration in muffle furnace at 550 °C until constant weight), lipids (extraction with Merck petroleum ether has b.p. 40–60 °C using Soxhlet extractor for 6 h), and crude protein (Kjeldahl digestion with the factor of 6.25 for conversion of the total N content to protein) were determined according to the AOAC methods of 923.03, 920.39C, and 979.09A, respectively. Total dietary fiber content was measured using the AOAC 978.10 method. The following formula was used to compute the carbohydrates percentage: carbohydrates (%) = 100 − moisture (%) + ash (%) + protein (%) + lipids (%) + dietary fiber (%).

4.7.5. Quinoa Seed’s Phytochemical and Antioxidant Activity

For quinoa seed extract preparation, a crushed seed sample with mass around 10 g was homogenized with 50 mL 80% ethanol. The mixture was placed in agitation overnight at 160 rpm in a shaker. Then, the homogenate was filtered, and the supernatant was removed. Total phenolic content (TPC) was determined using Folin–Ciocalteu’s reagent as outlined by Singleton et al. [110]. The liquid extract was diluted and mixed with Folin–Ciocalteu’s reagent and 20% aqueous Na2CO3 solution, then incubated in the dark for 1 h at room temperature (25 °C). After incubation, the absorbance of the mixture was measured at 765 nm using a spectronic 2000 spectrophotometer. The TPC was expressed as mg gallic acid equivalent per 100 g on a dry weight basis. For total flavonoid content (TFC) determination, briefly, one ml aliquot of extract was mixed with one ml 10% aqueous AlCl3 solution. The mixture was incubated in the dark for 1 h at room temperature (25 °C). Absorbance of the final mixture was determined at 510 nm against a blank reaction. The TFC was expressed as mg quercetin equivalent per 100 g on a dry weight basis.
For assaying the total DPPH-SA, four aliquots (25, 50, 75, and 100 μL) of extract were added to 3.9 mL of methanolic solution of DPPH radical. The mixture was agitated and then kept in the absence of light for 30 min and the absorbance was determined at 517 nm using a spectronic 2000 spectrophotometer. The total DPPH-SA was calculated according to the following equation [111]: Total DPPH-SA (%) = [(Absblank − Abssample)/Absblank] × 100; where Absblank = absorbance of DPPH radical + methanol at 0 min and Abssample = absorbance of DPPH radical + sample at 30 min.
The concentration of extract that corresponding to a 50% inhibition of DPPH radical, which is expressed as the half maximal inhibitory concentration (IC50), was obtained from the graph plotted between the inhibition percentages and the extract concentrations [112]. The antiradical power (ARP) was determined as the efficient concentration IC50’s reciprocal value and calculated as follows: 1/IC50.

4.7.6. Soil Microbial Evaluation

At the initial and end of the experiment, soil samples of the rhizosphere zone at 0–20 cm depth of each experimental plot from the normal and calcareous soils, totaling thirty-six samples, were collected using a soil auger of 5 cm diameter. Each sample was 10-fold serially diluted up to 10−5 dilutions and the counts of the phosphorus-solubilizing microorganisms (PSMs) and Azotobacter bacteria were determined, expressed as colony-forming units per gram soil (cfu g−1 soil). The count of PSMs was determined by allowing microorganisms in the soil samples to grow on Pikovskaya’s selective media for 7 to 10 days at a temperature of 25 °C. Colonies rounded by clear halo zone were detected and the number of cfu g−1 soil was counted. Serial dilution pour plate technique was used to count Azotobacter sp. using Ashby’s N-free agar medium containing 0.5 g K2HPO4, 0.2 g MgSO4, 0.2 g NaCl, 5 g CaCO3, 10 g sucrose, 12 g agar, 1000 mL distilled H2O, and traces of manganese, iron, and molybdenum elements. The number of Azotobacter sp. as a cfu g−1 soil was counted after the formation of medium–large, moist colonies during the incubation for 48–72 h at a temperature of 28 °C.

4.7.7. Quinoa’s Growth, Yield and Yield-Related Attributes, and Harvest Index

At the seed ripening (BBCH 89/90) stage, ten individual quinoa plants were randomly sampled from each experimental plot. These individual plants were utilized to measure plant height (in cm) from the base of the main shoot to the tip of uppermost shoot using a meter scale and plant dry weight (in g) by oven-drying at 70 ± 3 °C to constant weight for dry matter estimation. All the quinoa plants from a 12 m2 area representing the four central ridges of each experimental plot to avoid edge effects were harvested, sun-dried for three days at the field, and weighed for biological yield (in t ha−1) estimation. Quinoa seeds were threshed, cleansed, and weighed to quantify the seed yield (in t ha−1). For moisture determination, a 150 g representative seed sample was oven-dried at 105 °C for 24 h until a constant weight was attained and then weighed once more to determine the adjusted seed yield based on 12% moisture. Seed harvest index (HI) percentage was calculated as the following equation: HI (%) = [seed yield (t ha−1) based on 12% moisture/biological yield (t ha−1)] × 100. The hectoliter weight of quinoa seeds expressed as kg hL−1 was determined by placing the seeds in a 250 mL cylindrical vessel and weighed, and the weight was multiplied by four hundred to obtain the kg weight of seeds per 100 L.

4.8. Statistical Analysis

Microsoft Excel® 2016 spreadsheet was utilized to compute means ± 1 standard error (SE) and data visualization. The normality assumption for all obtained data in each season was verified using the Shapiro–Wilk numerical normality test. Data that had a normal distribution were statistically analyzed using a two-way analysis of variance (ANOVA) followed by Duncan’s test (p ≤ 0.05 * or p ≤ 0.01 **). Before performing the combined ANOVA [113], a homogeneity test of the two-season error variances of all variables was assessed. The outputs of the homogeneity test for all measurements exhibited statistical validity to perform further combined ANOVA (Tables S1–S4), using 11th edition Genstat software (VSN International Ltd., Oxford, UK) as per Casella [114]. The soil type, bio-organo-mineral treatments, and their interaction were considered fixed factors, while replications, cropping seasons, and their interaction were considered random factors. The PCA biplot and Pearson’s correlogram among the selected variables were performed by using the statistical R (version 4.0.2) software package.

5. Conclusions

It can be concluded that co-application of compost with Aspergillus niger could help to reduce phosphorus and potassium mineral fertilization to a notable extent without limiting yield as well as mitigate the deleterious influence of calcareous soil on quinoa plants. Furthermore, the combined use of Aspergillus niger and compost with reduced phosphorus and potassium fertilization resulted in elevated osmolytes and antioxidant accumulation, and nutrient acquisition, subsequently promoting the chlorophylls and carotenoid contents, as well as increasing seed yield and quality of quinoa plants grown in calcareous soil conditions. In calcareous soil, the application of bioorganic fertilizer enhanced the population of P-solubilizing microorganisms, whereas in normal soil, PK mineral fertilization with bioorganic fertilizers increased the Azotobacter sp. population. Future research should focus on employing direct measures of enzyme activity related to phosphorus/potassium solubilization since this will provide a deep understanding of different pathways connected to the beneficial effects of Aspergillus niger inoculation.

Supplementary Materials

The following supporting information can be downloaded at: https://www.mdpi.com/article/10.3390/plants12173071/s1.

Author Contributions

Conceptualization, A.S., S.M.Y., A.R.A.E.T., L.R.A.A.H., K.M.A. and K.A.H.; methodology, A.S., A.R.A.E.T., S.M.Y., L.R.A.A.H., L.A.R., K.A.H. and A.A.; software, A.S., S.M.Y., A.R.A.E.T., R.M.M.A., R.A. and K.A.H.; validation, A.S., A.R.A.E.T., S.M.Y., L.R.A.A.H., R.A., K.M.A. and A.A.; formal analysis, A.S., S.M.Y. and R.A.; investigation, A.S., S.M.Y., A.R.A.E.T. and L.R.A.A.H.; resources, A.S., A.R.A.E.T., S.M.Y., L.R.A.A.H., L.A.R., K.M.A. and K.A.H.; data curation, A.S., S.M.Y., L.R.A.A.H., A.A., R.A. and K.A.H.; writing—original draft preparation, A.S., A.A., L.R.A.A.H., R.M.M.A., L.A.R. and S.M.Y.; writing—review and editing, A.S., A.A., L.R.A.A.H., R.M.M.A., L.A.R., K.M.A., S.M.Y. and R.A.; visualization, A.S., S.M.Y., R.A. and A.A.; supervision, A.S., S.M.Y. and A.A.; project administration, A.S., A.R.A.E.T., S.M.Y., L.R.A.A.H. and A.A.; funding acquisition, A.S., S.M.Y., A.R.A.E.T., L.R.A.A.H., K.M.A., R.A. and K.A.H. All authors have read and agreed to the published version of the manuscript.

Funding

This work was supported by Princess Nourah bint Abdulrahman University Researchers Supporting Project (PNURSP2023R402), Princess Nourah bint Abdulrahman University, Riyadh, Saudi Arabia.

Data Availability Statement

The datasets used and/or analyzed during the current study are available from the corresponding author on reasonable request.

Acknowledgments

The authors wish to extend their sincere appreciation to Fayoum University, Faculty of Agriculture, Fayoum, Egypt, for providing all the necessary experimental facilities and Princess Nourah bint Abdulrahman University Researchers Supporting Project (PNURSP2023R402), Princess Nourah bint Abdulrahman University, Riyadh, Saudi Arabia.

Conflicts of Interest

The authors declare no conflict of interest.

References

  1. Wassif, M.M.; Wassif, O.M. Sustainable soil management to mitigate soil erosion hazards in Egypt. In Management and Development of Agricultural and Natural Resources in Egypt’s Desert; Springer: Cham, Switzerland, 2021; pp. 163–211. [Google Scholar]
  2. Alghamdi, S.A.; Alharby, H.F.; Abdelfattah, M.A.; Mohamed, I.A.; Hakeem, K.R.; Rady, M.M.; Shaaban, A. Spirulina platensis-inoculated humified compost boosts rhizosphere soil hydro-physico-chemical properties and Atriplex nummularia forage yield and quality in an arid saline calcareous soil. J. Soil Sci. Plant Nutr. 2023, 23, 2215–2236. [Google Scholar] [CrossRef]
  3. Beheshti, M.; Alikhani, H.A.; Pourbabaee, A.A.; Etesami, H.; Rahmani, H.A.; Noroozi, M. Enriching periphyton with phosphate-solubilizing microorganisms improves the growth and concentration of phosphorus and micronutrients of rice plant in calcareous paddy soil. Rhizosphere 2022, 24, 100590. [Google Scholar] [CrossRef]
  4. Mirzaee, S.; Ghorbani-Dashtaki, S. Deriving and evaluating hydraulics and detachment models of rill erosion for some calcareous soils. Catena 2018, 164, 107–115. [Google Scholar] [CrossRef]
  5. Souei, A.; Zouaghi, T. Using statistical models and GIS to delimit the groundwater recharge potential areas and to estimate the infiltration rate: A case study of Nadhour-Sisseb-El Alem Basin, Tunisia. J. Arid Land 2021, 13, 1122–1141. [Google Scholar] [CrossRef]
  6. Barka, H.A.F.; Benzaghta, M.A.; Kasheem, A.M. Effect of different organic matters on chemical properties of calcareous soil. Sirte Univ. Sci. J. 2018, 8, 101–110. [Google Scholar]
  7. Taalab, A.S.; Ageeb, G.W.; Siam, H.S.; Mahmoud, S.A. Some characteristics of calcareous soils. A review. Middle East J. 2019, 8, 96–105. [Google Scholar]
  8. FAO. FAO Soils Portal: Management of Calcareous Soils. 2016. Available online: http://www.fao.org/soils-portal/soil-management/managementof-some-problem-soils/calcareous-soils/ar/ (accessed on 1 April 2023).
  9. Mekdad, A.A.A.; El-Sherif, A.M.A.; Rady, M.M.; Shaaban, A. Culture management and application of humic acid in favor of Helianthus annuus L. oil yield and nutritional homeostasis in a dry environment. J. Soil Sci. Plant Nutr. 2022, 22, 71–86. [Google Scholar] [CrossRef]
  10. Mahidi, S.S.; Hassan, G.I.; Hussain, A.; Rasool, F. Phosphorus availability issue-Its fixation and role of phosphate solubilizing bacteria in phosphate solubilization-Case study. Res. J. Agric. Sci. 2011, 2, 174–179. [Google Scholar]
  11. Shaaban, A.; El-Mageed, T.A.A.; El-Momen, W.R.A.; Saudy, H.S.; Al-Elwany, O.A.A.I. The integrated application of phosphorous and zinc affects the physiological status, yield and quality of canola grown in phosphorus-suffered deficiency saline soil. In Gesunde Pflanzen; Springer: Berlin/Heidelberg, Germany, 2023. [Google Scholar] [CrossRef]
  12. Zakirullah, M.; Khalil, S. Timing and rate of phosphorus application influence maize phenology, yield and profitability in Northwest Pakistan. Int. J. Plant Prod. 2012, 4, 281–292. [Google Scholar]
  13. Naeem, A.; Akhtar, M.; Ahmad, W. Optimizing available phosphorus in calcareous soils fertilized with diammonium phosphate and phosphoric acid using Freundlich adsorption isotherm. Sci. World J. 2013, 2013, 680257. [Google Scholar] [CrossRef]
  14. Rawat, P.; Das, S.; Shankhdhar, D.; Shankhdhar, S.C. Phosphate-solubilizing microorganisms: Mechanism and their role in phosphate solubilization and uptake. J. Soil Sci. Plant Nutr. 2021, 21, 49–68. [Google Scholar] [CrossRef]
  15. Hussain, S.; Sharif, M.; Ahmad, W. Selection of efficient phosphorus solubilizing bacteria strains and mycorrhizea for enhanced cereal growth, root microbe status and N and P uptake in alkaline calcareous soil. Soil Sci. Plant Nutr. 2021, 67, 259–268. [Google Scholar] [CrossRef]
  16. Wahid, F.; Fahad, S.; Danish, S.; Adnan, M.; Yue, Z.; Saud, S.; Siddiqui, M.H.; Brtnicky, M.; Hammerschmiedt, T.; Datta, R. Sustainable management with mycorrhizae and phosphate solubilizing bacteria for enhanced phosphorus uptake in calcareous soils. Agriculture 2020, 10, 334. [Google Scholar] [CrossRef]
  17. Li, Z.; Bai, T.; Dai, L.; Wang, F.; Tao, J.; Meng, S.; Hu, Y.; Wang, S.; Hu, S. A study of organic acid production in contrasts between two phosphate solubilizing fungi: Penicillium oxalicum and Aspergillus niger. Sci. Rep. 2016, 6, 25313. [Google Scholar] [CrossRef] [PubMed]
  18. Tian, D.; Xia, J.; Zhou, N.; Xu, M.; Li, X.; Zhang, L.; Du, S.; Gao, H. The utilization of phosphogypsum as a sustainable phosphate-based fertilizer by Aspergillus niger. Agronomy 2022, 12, 646. [Google Scholar] [CrossRef]
  19. Naeem, U.; Afzaal, M.; Qazi, A.; Yasar, A.; Mahfooz, Y.; Naz, A.U.; Awan, H. Investigating the effect of Aspergillus niger inoculated press mud (biofertilizer) on the potential of enhancing maize (Zea mays L.) yield, potassium use efficiency and potassium agronomic efficiency. Cereal Res. Commun. 2022, 50, 157–170. [Google Scholar] [CrossRef]
  20. Abd El-Mageed, T.A.; Mekdad, A.A.A.; Rady, M.O.A.; Abdelbaky, A.S.; Saudy, H.S.; Shaaban, A. Physio-biochemical and agronomic changes of two sugar beet cultivars grown in saline soil as influenced by potassium fertilizer. J. Soil Sci. Plant Nutr. 2022, 22, 3636–3654. [Google Scholar] [CrossRef]
  21. Attia, M.M. Status of potassium in some calcareous soils of Egypt and factors affecting its forms. Ann. Agric. Sci. Moshtohor. 2019, 57, 177–184. [Google Scholar] [CrossRef]
  22. Basak, B.B.; Maity, A.; Ray, P.; Biswas, D.R.; Roy, S. Potassium supply in agriculture through biological potassium fertilizer: A promising and sustainable option for developing countries. Arch. Agron. Soil Sci. 2022, 68, 101–114. [Google Scholar] [CrossRef]
  23. Sattar, A.; Naveed, M.; Ali, M.; Zahir, Z.A.; Nadeem, S.M.; Yaseen, M.; Meena, V.S.; Farooq, M.; Singh, R.; Rahman, M.; et al. Perspectives of potassium solubilizing microbes in sustainable food production system: A review. Appl. Soil Ecol. 2019, 133, 146–159. [Google Scholar] [CrossRef]
  24. Kour, D.; Rana, K.L.; Yadav, A.N.; Yadav, N.; Kumar, M.; Kumar, V.; Vyas, P.; Dhaliwal, H.S.; Saxena, A.K. Microbial biofertilizers: Bioresources and eco-friendly technologies for agricultural and environmental sustainability. Biocatal. Agric. Biotechnol. 2020, 23, 101487. [Google Scholar] [CrossRef]
  25. Lian, B.; Wang, B.; Pan, M.; Liu, C.Q.; Teng, H.H. Microbial release of potassium from K-bearing minerals by thermophilic fungus Aspergillus fumigatus. Geochim. Cosmochim. Acta 2008, 72, 87–98. [Google Scholar] [CrossRef]
  26. Meena, V.S.; Maurya, B.R.; Verma, J.P. Does a rhizospheric microorganism enhance K+ availability in agricultural soils? Microbiol. Res. 2014, 169, 337–347. [Google Scholar] [CrossRef]
  27. Pinzari, F.; Cuadros, J.; Jungblut, A.D.; Najorka, J.; Humphreys-Williams, E. Fungal strategies of potassium extraction from silicates of different resistance as manifested in differential weathering and gene expression. Geochim. Cosmochim. Acta 2022, 316, 168–200. [Google Scholar] [CrossRef]
  28. Zhang, C.; Kong, F. Isolation and identification of potassium-solubilizing bacteria from tobacco rhizospheric soil and their effect on tobacco plants. Appl. Soil Ecol. 2014, 82, 18–25. [Google Scholar] [CrossRef]
  29. Qiang, X.; Ding, J.; Lin, W.; Li, Q.; Xu, C.; Zheng, Q.; Li, Y. Alleviation of the detrimental effect of water deficit on wheat (Triticum aestivum L.) growth by an indole acetic acid-producing endophytic fungus. Plant Soil 2019, 439, 373–391. [Google Scholar] [CrossRef]
  30. Sun, J.; Xu, G.; Shao, H.; Xu, S. Potential retention and release capacity of phosphorus in the newly formed wetland soils from the Yellow River Delta, China. Clean–Soil Air Water 2012, 40, 1131–1136. [Google Scholar] [CrossRef]
  31. Wang, L.; Liu, L.; Zheng, B. Eutrophication development and its key regulating factors in a water-supply reservoir in North China. J. Environ. Sci. 2013, 25, 962–970. [Google Scholar] [CrossRef] [PubMed]
  32. Mundim, G.d.S.M.; Maciel, G.M.; Mendes, G.d.O. Aspergillus niger as a biological input for improving vegetable seedling production. Microorganisms 2022, 10, 674. [Google Scholar] [CrossRef]
  33. Cihangir, N. Stimulation of the gibberellic acid synthesis by Aspergillus niger in submerged culture using a precursor. World J. Microbiol. Biotechnol. 2002, 18, 727–729. [Google Scholar] [CrossRef]
  34. Hung, R.; Lee Rutgers, S. Applications of Aspergillus in Plant Growth Promotion, New and Future Developments in Microbial Biotechnology and Bioengineering: Aspergillus System Properties and Applications; Elsevier: Amsterdam, The Netherlands, 2016. [Google Scholar]
  35. Ni, H.; Wu, Y.; Zong, R.; Ren, S.; Pan, D.; Yu, L.; Li, J.; Qu, Z.; Wang, Q.; Zhao, G.; et al. Combination of Aspergillus niger MJ1 with Pseudomonas stutzeri DSM4166 or mutant Pseudomonas fluorescens CHA0-nif improved crop quality, soil properties, and microbial communities in barrier soil. Front. Microbiol. 2023, 1–14. [Google Scholar] [CrossRef] [PubMed]
  36. Luo, T.; Min, T.; Ru, S.; Li, J. Response of cotton root growth and rhizosphere soil bacterial communities to the application of acid compost tea in calcareous soil. Appl. Soil Ecol. 2022, 177, 104523. [Google Scholar] [CrossRef]
  37. Aboukila, E.F.; Nassar, I.N.; Rashad, M.; Hafez, M.; Norton, J.B. Reclamation of calcareous soil and improvement of squash growth using brewer’s spent grain and compost. J. Saudi Soc. Agric. Sci. 2018, 17, 390–397. [Google Scholar]
  38. Luo, T.; Zhu, Y.; Lu, W.; Chen, L.; Min, T.; Li, J.; Wei, C. Acidic compost tea enhances phosphorus availability and cotton yield in calcareous soils by decreasing soil pH. Acta Agric. Scand. Sect. B-Soil Plant Sci. 2021, 71, 657–666. [Google Scholar] [CrossRef]
  39. Estrada-Bonilla, G.A.; Durrer, A.; Cardoso, E.J. Use of compost and phosphate-solubilizing bacteria affect sugarcane mineral nutrition, phosphorus availability, and the soil bacterial community. Appl. Soil Ecol. 2021, 157, 103760. [Google Scholar] [CrossRef]
  40. Sánchez, Ó.J.; Ospina, D.A.; Montoya, S. Compost supplementation with nutrients and microorganisms in composting process. Waste Manag. 2017, 69, 136–153. [Google Scholar] [CrossRef] [PubMed]
  41. Kiani-Pouya, A.; Roessner, U.; Jayasinghe, N.S.; Lutz, A.; Rupasinghe, T.; Bazihizina, N.; Bohm, J.; Alharbi, S.; Hedrich, R.; Shabala, S. Epidermal bladder cells confer salinity stress tolerance in the halophyte quinoa and Atriplex species. Plant Cell Environ. 2017, 40, 1900–1915. [Google Scholar] [CrossRef] [PubMed]
  42. Ahmadi, S.H.; Solgi, S.; Sepaskhah, A.R. Quinoa: A super or pseudo-super crop? Evidences from evapotranspiration, root growth, crop coefficients, and water productivity in a hot and semi-arid area under three planting densities. Agric. Water Manag. 2019, 225, 105784. [Google Scholar] [CrossRef]
  43. Rizzello, C.G.; Tagliazucchi, D.; Babini, E.; Rutella, G.S.; Saa, D.L.T.; Gianotti, A. Bioactive peptides from vegetable food matrices: Research trends and novel biotechnologies for synthesis and recovery. J. Funct. Foods 2016, 27, 549–569. [Google Scholar] [CrossRef]
  44. Adel, H. Towards expanding quinoa cultivation in Egypt: The effect of compost and vermicompost on quinoa pests, natural enemies and yield under field conditions. Agric. Sci. 2020, 11, 191–209. [Google Scholar] [CrossRef]
  45. Bazile, D.; Bertero, H.D.; Nieto, C. State of the Art Report on Quinoa Around the World in 2013; FAO&CIRAD: Roma, Italy, 2015. [Google Scholar]
  46. Hinojosa, L.; Gonz’alez, J.A.; Barrios-Masias, F.H.; Fuentes, F.; Murphy, K.M. Quinoa abiotic stress responses: A review. Plants 2018, 7, 106. [Google Scholar] [CrossRef]
  47. Semida, W.M.; Abdelkhalik, A.; Rady, M.O.A.; Marey, R.A.; Abd El-Mageed, T.A. Exogenously applied proline enhances growth and productivity of drought stressed onion by improving photosynthetic efficiency, water use efficiency and up-regulating osmoprotectants. Sci. Hortic. 2020, 272, 109580. [Google Scholar] [CrossRef]
  48. Abd El-Mageed, T.A.; Abdelkhalik, A.; Abd El-Mageed, S.A.; Semida, W.M. Co-composted poultry litter biochar enhanced soil quality and eggplant productivity under different irrigation regimes. J. Soil Sci. Plant Nutr. 2021, 21, 1917–1933. [Google Scholar] [CrossRef]
  49. Shaaban, A.; Al-Elwany, O.A.A.I.; Abdou, N.M.; Hemida, K.A.; El-Sherif, A.M.A.; Abdel-Razek, M.A.; Semida, W.M.; Mohamed, G.F.; Abd El-Mageed, T.A. Filter mud enhanced yield and soil properties of water-stressed Lupinus termis L. in saline calcareous soil. J. Soil Sci. Plant Nutr. 2022, 22, 1572–1588. [Google Scholar] [CrossRef]
  50. Hasanuzzaman, M.; Bhuyan, M.H.M.B.; Nahar, K.; Hossain, M.S.; Al Mahmud, J.; Hossen, M.S.; Masud, A.A.C.; Moumita; Fujita, M. Potassium: A vital regulator of plant responses and tolerance to abiotic stresses. Agronomy 2018, 8, 31. [Google Scholar] [CrossRef]
  51. Malhotra, H.; Vandana; Sharma, S.; Pandey, R. Phosphorus nutrition: Plant growth in response to deficiency and excess. In Plant Nutrients and Abiotic Stress Tolerance; Hasanuzzaman, M., Fujita, M., Oku, H., Nahar, K., Hawrylak-Nowak, B., Eds.; Springer: Singapore, 2018; pp. 171–190. [Google Scholar]
  52. Meng, X.; Chen, W.W.; Wang, Y.Y.; Huang, Z.R.; Ye, X.; Chen, L.S.; Yang, L.T. Effects of phosphorus deficiency on the absorption of mineral nutrients, photosynthetic system performance and antioxidant metabolism in Citrus grandis. PLoS ONE 2021, 16, e0246944. [Google Scholar] [CrossRef] [PubMed]
  53. Liu, J.; Shu, A.; Song, W.; Shi, W.; Li, M.; Zhang, W.; Li, Z.; Liu, G.; Yuan, F.; Zhang, S.; et al. Long-term organic fertilizer substitution increases rice yield by improving soil properties and regulating soil bacteria. Geoderma 2021, 404, 115287. [Google Scholar] [CrossRef]
  54. Semida, W.M.; Abd El-Mageed, T.A.; Howladar, S.M. A novel organo-mineral fertilizer can alleviate negative effects of salinity stress for eggplant production on reclaimed saline calcareous soil. Acta Hort. 2014, 1034, 493–500. [Google Scholar] [CrossRef]
  55. Alghamdi, S.A.; Al-Ghamdi, F.A.; El-Zohri, M.; Al-Ghamdi, A.A.M. Modifying of Calcareous Soil with Some Acidifying Materials and Its Effect on Helianthus Annuus (L.) Growth. Saudi J. Biol. Sci. 2023, 30, 103568. [Google Scholar] [CrossRef]
  56. Kranz, C.N.; McLaughlin, R.A.; Johnson, A.; Miller, G.; Heitman, J.L. The effects of compost incorporation on soil physical properties in urban soils—A concise Review. J. Environ. Manag. 2020, 261, 110209. [Google Scholar] [CrossRef]
  57. Wu, Q.F.; Hu, H.B.; He, L.M. Effect of aspergillus niger strain xf-1 on soil nutrients and growth of Amorpha fruticosa. Appl. Ecol. Environ. Res. 2020, 18, 5079–5092. [Google Scholar] [CrossRef]
  58. Qaswar, M.; Chai, R.; Ahmed, W.; Jing, H.; Han, T.; Liu, K.; Ye, X.; Xu, Y.; Anthonio, C.K.; Zhang, H. Partial substitution of chemical fertilizers with organic amendments increased rice yield by changing phosphorus fractions and improving phosphatase activities in fluvo-aquic soil. J. Soils Sediments 2020, 20, 1285–1296. [Google Scholar] [CrossRef]
  59. Abdelkhalik, A.; Abd El-mageed, T.A.; Mohamed, I.A.A.; Semida, W.M.; Al-elwany, O.A.A.I.; Ibrahim, I.M.; Hemida, K.A.; El-saadony, M.T.; Abuqamar, S.F.; El-tarabily, K.A. Soil application of effective microorganisms and nitrogen alleviates salt stress in hot pepper (Capsicum annum L.) plants. Front. Plant Sci. 2023, 13, 1079260. [Google Scholar] [CrossRef]
  60. Khan, K.S.; Ali, M.M.; Naveed, M.; Ishaq, M.; Rehmani, A.; Waleed, M.; Ali, H.M.; Abdelsalam, N.R.; Ghareeb, R.Y.; Feng, G. Co-application of organic amendments and inorganic P increase maize growth and soil carbon, phosphorus availability in calcareous soil. Front. Environ. Sci. 2022, 10, 949371. [Google Scholar] [CrossRef]
  61. Abdelkhalik, A.; Pascual, B.; Nájera, I.; Baixauli, C.; Pascual-Seva, N. Deficit irrigation as a sustainable practice in improving irrigation water use efficiency in cauliflower under Mediterranean conditions. Agronomy 2019, 9, 732. [Google Scholar] [CrossRef]
  62. Rady, M.M.; Mossa, A.T.H.; Youssof, A.M.; Osman, A.S.; Ahmed, S.M.; Mohamed, I.A. Exploring the reinforcing effect of nano-potassium on the antioxidant defense system reflecting the increased yield and quality of salt-stressed squash plants. Sci. Hortic. 2023, 308, 111609. [Google Scholar] [CrossRef]
  63. Semida, W.M.; Abd El-mageed, T.A.; Abdelkhalik, A.; Hemida, K.A.; Abdurrahman, H.A.; Howladar, S.M.; Leilah, A.A.A.; Rady, M.O.A. Selenium modulates antioxidant activity, osmoprotectants, and photosynthetic efficiency of onion under saline soil conditions. Agronomy 2021, 11, 855. [Google Scholar] [CrossRef]
  64. Zulfiqar, F.; Akram, N.A.; Ashraf, M. Osmoprotection in plants under abiotic stresses: New insights into a classical phenomenon. Planta 2020, 251, 3. [Google Scholar] [CrossRef] [PubMed]
  65. Abd El-mageed, T.A.; Gyushi, M.A.H.; Hemida, K.A.; El-Saadony, M.T.; Abd El-Mageed, S.A.; Abdalla, H.; AbuQamar, S.F.; El-Tarabily, K.A.; Abdelkhalik, A. Coapplication of effective microorganisms and nanomagnesium boosts the defenses against salt stress in Ipomoea batatas. Front. Plant Sci. 2022, 13, 883274. [Google Scholar] [CrossRef] [PubMed]
  66. Martínez-Ispizua, E.; Calatayud, Á.; Marsal, J.I.; Basile, F.; Cannata, C.; Abdelkhalik, A.; Soler, S.; Valcárcel, J.V.; Martínez-Cuenca, M.-R. Postharvest changes in the nutritional properties of commercial and traditional lettuce varieties in relation with overall visual quality. Agronomy 2022, 12, 403. [Google Scholar] [CrossRef]
  67. Martínez-Ispizua, E.; Calatayud, Á.; Marsal, J.I.; Cannata, C.; Basile, F.; Abdelkhalik, A.; Soler, S.; Valcárcel, J.V.; Martínez-Cuenca, M.-R. The nutritional quality potential of microgreens, baby leaves, and adult lettuce: An underexploited nutraceutical source. Foods 2022, 11, 423. [Google Scholar] [CrossRef]
  68. Zhang, Q.; Dai, W. Plant response to salinity stress. In Stress Physiology of Woody Plants; Dai, W., Ed.; CRC Press: Boca Raton, FL, USA, 2019; pp. 155–173. [Google Scholar]
  69. Baliyan, S.; Mukherjee, R.; Priyadarshini, A.; Vibhuti, A.; Gupta, A.; Pandey, R.P.; Chang, C. Determination of antioxidants by DPPH radical scavenging activity and quantitative phytochemical analysis of Ficus religiosa. Molecules 2022, 27, 1326. [Google Scholar] [CrossRef]
  70. Sánchez-Navarro, V.; Zornoza, R.; Faz, Á.; Fernández, J.A. Cowpea crop response to mineral and organic fertilization in SE Spain. Processes 2021, 9, 822. [Google Scholar] [CrossRef]
  71. Ye, L.; Zhao, X.; Bao, E.; Li, J.; Zou, Z.; Cao, K. Bio-organic fertilizer with reduced rates of chemical fertilization improves soil fertility and enhances tomato yield and quality. Sci. Rep. 2020, 10, 177. [Google Scholar] [CrossRef] [PubMed]
  72. Adnan, M.; Fahad, S.; Khan, I.A.; Saeed, M.; Ihsan, M.Z.; Saud, S.; Riaz, M.; Wang, D.; Wu, C. Integration of Poultry Manure and Phosphate Solubilizing Bacteria Improved Availability of Ca Bound P in Calcareous Soils. 3 Biotech 2019, 9, 368. [Google Scholar] [CrossRef]
  73. Mohamed, A.S.; Mohamed, M.H.M.; Halawa, S.S.; Saleh, S.A. Partial exchange of mineral N fertilizer for common bean plants by organic N fertilizer in the presence of salicylic acid as foliar application. In Gesunde Pflanzen; Springer: Berlin/Heidelberg, Germany, 2023. [Google Scholar] [CrossRef]
  74. Aykul, S.; Martinez-Hackert, E. Determination of half-maximal inhibitory concentration using biosensor-based protein interaction analysis. Physiol. Behav. 2017, 176, 139–148. [Google Scholar] [CrossRef]
  75. Van Loon, W.A.; Linssen, J.P.; Legger, A.; Voragen, A.G. Anti-radical power gives insight into early lipid oxidation events during frying. J. Sci. Food Agric. 2006, 86, 1446–1451. [Google Scholar] [CrossRef]
  76. Youssef, M.A.; Farag, M.I.H. Co-application of organic manure and bio-fertilizer to improve soil fertility and production of quinoa and proceeding Jew’s Mallow crops. J. Soil Sci. Plant Nutr. 2021, 21, 2472–2488. [Google Scholar] [CrossRef]
  77. Yang, Y.; Syed, S.; Mao, S.; Li, Q.; Ge, F.; Lian, B.; Lu, C. Bioorganic–mineral fertilizer can remediate chemical fertilizer-oversupplied soil: Purslane planting as an example. J. Soil Sci. Plant Nutr. 2020, 20, 892–900. [Google Scholar] [CrossRef]
  78. Chen, S.; Gao, J.; Chen, H.; Zhang, Z.; Huang, J.; Lv, L.; Tan, J. The role of long-term mineral and manure fertilization on P species accumulation and phosphate-solubilizing microorganisms in paddy red soils. Soil 2023, 9, 101–116. [Google Scholar] [CrossRef]
  79. Adnan, M.; Fahad, S.; Zamin, M.; Shah, S.; Mian, I.A.; Danish, S.; Zafar-Ul-hye, M.; Battaglia, M.L.; Naz, R.M.M.; Saeed, B.; et al. Coupling Phosphate-Solubilizing Bacteria with Phosphorus Supplements Improve Maize Phosphorus Acquisition and Growth under Lime Induced Salinity Stress. Plants 2020, 9, 900. [Google Scholar] [CrossRef] [PubMed]
  80. Ponce, V.M.; Pandey, R.P.; Ercan, S. Characterization of drought across the climate spectrum. J. Hydrol. Eng. ASCE 2000, 5, 222–224. [Google Scholar] [CrossRef]
  81. Klute, A.; Dirksen, C. Hydraulic conductivity and diffusivity: Laboratory methods, in methods of soil analysis: Part 1-physical and mineralogical methods (Soil Science Society of America). Am. Soc. Agron. 1986, 9, 687–734. [Google Scholar]
  82. Page, A.I.; Miller, R.H.; Keeny, D.R. Methods of soil analysis, in Part II. In Chemical and Microbiological Methods, 2nd ed.; American Society of Agronomy: Madison, WI, USA, 1982; pp. 225–246. [Google Scholar]
  83. Pikovskaya, R. Mobilization of phosphorus in soil in connection with vital activity of some microbial species. Mikrobiologiya 1948, 17, 362–370. [Google Scholar]
  84. Hu, X.; Chen, J.; Guo, J. Two phosphate and potassium-solubilizing bacteria isolated from Tianmu Mountain, Zhejiang, China. World J. Microbiol. Biotechnol. 2006, 22, 983–990. [Google Scholar] [CrossRef]
  85. Premono, M.E.; Moawad, A.; Vlek, P. Effect of phosphate-solubilizing Pseudomonas putida on the growth of maize and its survival in the rhizosphere. Indones. J. Crop Sci. 1996, 11, 13–23. [Google Scholar]
  86. Elias, F.; Woyessa, D.; Muleta, D. Phosphate solubilization potential of rhizosphere fungi isolated from plants in jimma zone, Southwest Ethiopia. Int. J. Microbiol. 2016, 2016, 5472601. [Google Scholar] [CrossRef]
  87. Prajapati, K.; Modi, H.A. The importance of potassium in plant growth-a review. Indian J. Plant Sci. 2012, 1, 177–186. [Google Scholar]
  88. Pitt, J.I.; Hocking, A.D. The ecology of fungal food spoilage. In Fungi and Food Spoilage; Springer: New York, NY, USA, 2009; pp. 3–9. [Google Scholar]
  89. White, T.J.; Bruns, T.; Lee, S.; Taylor, J. Amplification and direct sequencing of fungal ribosomal RNA genes for phylogenetics. PCR Protoc. Guide Methods Appl. 1990, 18, 315–322. [Google Scholar]
  90. Gardes, M.; Bruns, T.D. ITS Primers with enhanced specificity for basidiomycetes—Application to the identification of mycorrhizae and rusts. Mol. Ecol. 1993, 2, 113–118. [Google Scholar] [CrossRef]
  91. Tamura, K.; Peterson, D.; Peterson, N.; Stecher, G.; Nei, M.; Kumar, S. MEGA5: Molecular evolutionary genetics analysis using maximum likelihood, evolutionary distance, and maximum parsimony methods. Mol. Biol. Evol. 2011, 28, 2731–2739. [Google Scholar] [CrossRef]
  92. Li, Y.; Zhang, S.; Lv, Y.; Zhai, H.; Cai, J.; Hu, Y. Linalool, the main volatile constituent from Zanthoxylum schinifolium pericarp, prevents growth of Aspergillus flavus in post-harvest grains. Food Control 2022, 137, 108967. [Google Scholar] [CrossRef]
  93. Idrovo-Novillo, J.; Gavilanes-Terán, I.; Angeles Bustamante, M.; Paredes, C. Composting as a method to recycle renewable plant resources back to the ornamental plant industry: Agronomic and economic assessment of composts. Process Saf. Environ. Prot. 2018, 116, 388–395. [Google Scholar] [CrossRef]
  94. Sosa-Zuniga, V.; Brito, V.; Fuentes, F.; Steinfort, U. Phenological growth stages of quinoa (Chenopodium quinoa) based on the BBCH scale. Ann. Appl. Biol. 2017, 171, 117–124. [Google Scholar] [CrossRef]
  95. Meier, U.; Bleiholder, H.; Buhr, L.; Feller, C.; Hack, H.; Heß, M.; Lancashire, P.D.; Schnock, U.; Stauß, R.; Van Den Boom, T. The BBCH system to coding the phenological growth stages of plants–history and publications. J. Kulturpflanzen 2009, 61, 41–52. [Google Scholar]
  96. Lichtenthaler, H.K.; Buschmann, C. Chlorophylls and carotenoids: Measurement and characterisation by UV-VIS. In Current Protocols in Food Analytical Chemistry; Wiley: Madison, WI, USA, 2001; Volume 1, pp. F4.3.1–F4.3.8. [Google Scholar]
  97. Shibaeva, T.G.; Mamaev, A.V.; Sherudilo, E.G. Evaluation of a SPAD-502 plus chlorophyll meter to estimate chlorophyll content in leaves with interveinal chlorosis. Russ. J. Plant Physiol. 2020, 67, 690–696. [Google Scholar] [CrossRef]
  98. Lowry, O.H.; Rosebrough, N.J.; Farr, A.L.; Randall, R.J. Protein measurement with the folin phenol reagent. J. Biol. Chem. 1951, 193, 265–275. [Google Scholar] [CrossRef]
  99. Fales, F.W. The assimilation and degradation of carbohydrates by yeast cells. J. Biol. Chem. 1951, 193, 113–124. [Google Scholar] [CrossRef]
  100. Schlegel, H.Q. Die verwertung organischer säuren durch Chlorella im licht. Planta 1956, 47, 510–526. [Google Scholar] [CrossRef]
  101. Ábrahám, E.; Hourton-Cabassa, C.; Erdei, L.; Szabados, L. Methods for determination of proline in plants. Methods Mol. Biol. 2010, 639, 317–331. [Google Scholar]
  102. Anderson, M.E. Determination of glutathione and glutathione disulfide in biological samples. Meth. Enzymol. 1985, 113, 548–555. [Google Scholar]
  103. Jagota, S.; Dani, H. A new colorimetric technique for the estimation of vitamin C using Folin phenol reagent. Anal. Biochem. 1982, 127, 178–182. [Google Scholar] [CrossRef]
  104. Sauvesty, A.; Page, F.; Huot, J. A simple method for extracting plant phenolic compounds. Can. J. For. Res. 1992, 22, 654–659. [Google Scholar] [CrossRef]
  105. Abe, N.; Murata, T.; Hirota, A. Novel 1,1-diphenyl-2-picryhy-drazyl-radical scavengers, bisorbicillin and demethyltrichodimerol, from a fungus. Biosci. Biotechnol. Biochem. 1998, 62, 661–666. [Google Scholar] [CrossRef] [PubMed]
  106. AOAC. Official method of analysis. In Association of Analytical Chemists, 19th ed.; AOAC: Washington, DC, USA, 2012; pp. 121–130. [Google Scholar]
  107. Jackson, M.L. Soil Chemical Analysis; Prentice Hall of India Pvt. Ltd.: New Delhi, India, 1967; pp. 144–197. [Google Scholar]
  108. Johnson, C.M.; Ulrich, A. Analytical methods for use in plant analysis. Calif. Agric. Exp. Stat Bull. 1959, 767, 25–78. [Google Scholar]
  109. AOAC. Official Methods of Analysis of AOAC International, 18th ed.; AOAC International: Gaithersburg, MD, USA, 2005; p. 1141. [Google Scholar]
  110. Singleton, V.L.; Orthofer, R.; Lamuela-Raventós, R.M. Analysis of total phenols and other oxidation substrates and antioxidants by means of folin-ciocalteu reagent. Meth. Enzymol. 1999, 299, 152–178. [Google Scholar]
  111. Liyana-Pathirana, C.; Shahidi, F. Optimization of extraction of phenolic compounds from wheat using response surface methodology. Food Chem. 2005, 93, 47–56. [Google Scholar] [CrossRef]
  112. Nostro, A.; Guerrini, A.; Marino, A.; Tacchini, M.; Di Giulio, M.; Grandini, A.; Akin, M.; Cellini, L.; Bisignano, G.; Saraçoğlu, H.T. In vitro activity of plant extracts against biofilm-producing food-related bacteria. Int. J. Food Microbiol. 2016, 238, 33–39. [Google Scholar] [CrossRef] [PubMed]
  113. Bartlett, M.S. Properties of sufficiency and statistical tests. Proc. R. Soc. Ser. A 1937, 160, 268–282. [Google Scholar]
  114. Casella, G. Statistical Design, 1st ed.; Springer: Gainesville, FL, USA, 2008; pp. 32611–33545. [Google Scholar]
Figure 1. Interactive effect of soil type (ST) and compost with phosphate (P)–potassium (K)-solubilizing Aspergillus niger (PK+C-AN) level on leaf biochemical attributes, e.g., (a) total soluble proteins (TSPs), (b) total soluble sugars (TSSs), (c) free proline (FPro), (d) reduced glutathione (rGSH), (e) ascorbic acid (AsA), (f) total phenolics (TPs), and (g) 2,2-diphenyl-1-picrylhydrazyl-scavenging activity (DPPH-SA). PK100% = 72 kg P2O5 ha−1 + 60 kg K2O ha−1, PK75% = 54 kg P2O5 ha−1 + 45 kg K2O ha−1, PK50% = 36 kg P2O5 ha−1 + 30 kg K2O ha−1, PK25% = 18 kg P2O5 ha−1 + 15 kg K2O ha−1, PK0% = 0 kg P2O5 ha−1 + 0 kg K2O ha−1, and compost was added with a rate of 20 t ha−1. Normal (Nor) and calcareous (Calc). Each bar is expressed as the mean ± standard error of the mean (n = 3). Bars labeled with same letters are not significantly different according to the Duncan test (p ≤ 0.05). Values based on average of 2021/22 and 2022/23 seasons.
Plants 12 03071 g001
Figure 2. Interactive effect of soil type (ST) and compost with phosphate (P)–potassium (K)-solubilizing Aspergillus niger (PK+C-AN) level on leaf nutrients, e.g., nitrogen—N (a), phosphorus—P (b), potassium—K+ (c), calcium—Ca2+ (d), iron—Fe2+ (e), zinc—Zn2+ (f), and manganese—Mn2+ (g) contents. PK100% = 72 kg P2O5 ha−1 + 60 kg K2O ha−1, PK75% = 54 kg P2O5 ha−1 + 45 kg K2O ha−1, PK50% = 36 kg P2O5 ha−1 + 30 kg K2O ha−1, PK25% = 18 kg P2O5 ha−1 + 15 kg K2O ha−1, PK0% = 0 kg P2O5 ha−1 + 0 kg K2O ha−1, and compost was added with a rate of 20 t ha−1. Normal (Nor) and calcareous (Calc). Each bar is expressed as the mean ± standard error of the mean (n = 3). Bars labeled with same letters are not significantly different according to the Duncan test (p ≤ 0.05). Values based on average of 2021/22 and 2022/23 seasons.
Plants 12 03071 g002aPlants 12 03071 g002b
Figure 3. Interactive effect of soil type (ST) and compost with phosphate (P)–potassium (K)-solubilizing Aspergillus niger (PK+C-AN) level on total microbial community, e.g., (a) phosphorus-solubilizing microorganisms (PSMs) and (b) Azotobacter sp. at the end of experiment in rhizosphere soil of quinoa grown in (SI) 2021/22 and (SII) 2022/23 winter seasons. PK100% = 72 kg P2O5 ha−1 + 60 kg K2O ha−1, PK75% = 54 kg P2O5 ha−1 + 45 kg K2O ha−1, PK50% = 36 kg P2O5 ha−1 + 30 kg K2O ha−1, PK25% = 18 kg P2O5 ha−1 + 15 kg K2O ha−1, PK0% = 0 kg P2O5 ha−1 + 0 kg K2O ha−1, and compost was added with a rate of 20 t ha−1. Normal (Nor) and calcareous (Calc). Each bar is expressed as the mean ± standard error of the mean (n = 3). Bars labeled with same letters are not significantly different according to the Duncan test (p ≤ 0.05). Values based on average of 2021/22 and 2022/23 seasons.
Plants 12 03071 g003
Figure 4. Principal component biplot (PCA) for applied treatments (soil type + bio-organo-mineral applications) and studied attributes. T1: Nor + PK100% = the normal soil received the full recommended dose (FRD) of phosphorus (P) and potassium (K) fertilizers; T2: Nor + PK100%+C-AN = the normal soil received PK100% + 20 t compost ha−1 + PK-solubilizing Aspergillus niger; T3: Nor + PK75%+C-AN = the normal soil received 75% out of FRD of P and K fertilizers + 20 t compost ha−1 + PK-solubilizing Aspergillus niger; T4: Nor + PK50%+C-AN = the normal soil received 50% out of FRD of P and K fertilizers + 20 t compost ha−1 + PK-solubilizing Aspergillus niger; T5: Nor + PK25%+C-AN = the normal soil received 25% out of FRD of P and K fertilizers + 20 t compost ha−1 + PK-solubilizing Aspergillus niger; T6: Nor + PK0%+C-AN = neither P nor mineral K fertilizer was added to the tested normal soil; T7: Calc + PK100% = the calcareous soil received FRD of P and K fertilizers; T8: Calc + PK100%+C-AN = the calcareous soil received PK100% + 20 t compost ha−1 + PK-solubilizing Aspergillus niger; T9: Calc + PK75%+C-AN = the calcareous soil received 75% out of FRD of P and K fertilizers + 20 t compost ha−1 + PK-solubilizing Aspergillus niger; T10: Calc + PK50%+C-AN = the calcareous soil received 50% out of FRD of P and K fertilizers + 20 t compost ha−1 + PK-solubilizing Aspergillus niger; T11: Calc + PK25%+C-AN = the calcareous soil received 25% out of FRD of P and K fertilizers + 20 t compost ha−1 + PK-solubilizing Aspergillus niger; T12: Calc + PK0%+C-AN = neither P nor mineral K fertilizer was added to the tested calcareous soil. Chl a: chlorophyll a; Chl b: chlorophyll b; Total chl: total chlorophyll; TPP: total photosynthetic pigments; TSPs: total soluble proteins; TSSs: total soluble sugars; Fpro: free proline; rGSH: reduced glutathione; AsA: ascorbic acid; TPs: total phenolics; DPPH-SA: 2,2-diphenyl-1-picrylhydrazyl-scavenging activity; N: nitrogen; P: phosphorus; K+: potassium; Ca2+: calcium; Fe2+: iron; Zn2+: zinc; Mn2+: manganese; PSMs: phosphorus-solubilizing microorganisms; PLH: plant height; PDW: plant dry weight; HW: hectoliter weight; SY: seed yield; BioY: biological yield; and HI: harvest index. Col.: color. Values based on average of 2021/22 and 2022/23 seasons. Each dot (•) indicates a treatment number.
Plants 12 03071 g004
Figure 5. Pairwise comparisons among selected quinoa crop traits based on the data of soil types × bio-organo-mineral treatments shown in the correlogram are based on Pearson’s correlation coefficients. The circle color in the correlogram corresponds to the correlation coefficient, wherein a positive correlation coefficient is closer to 1 (purple end of the scale) and a negative correlation coefficient is closer to −1 (red end of the scale). The circle size matches the significance level. Chl a: chlorophyll a; Chl b: chlorophyll b; Total chl: total chlorophyll; TPP: total photosynthetic pigments; TSPs: total soluble proteins; TSSs: total soluble sugars; Fpro: free proline; rGSH: reduced glutathione; AsA: ascorbic acid; TPs: total phenolics; DPPH-SA: 2,2-diphenyl-1-picrylhydrazyl-scavenging activity; N: nitrogen; P: phosphorus; K+: potassium; Ca2+: calcium; Fe2+: iron; Zn2+: zinc; Mn2+: manganese; PSMs: phosphorus-solubilizing microorganisms; PLH: plant height; PDW: plant dry weight; HW: hectoliter weight; SY: seed yield; BioY: biological yield; and HI: harvest index. (*) refers to significant Person’s correlation at p ≤ 0.05. Values based on average of 2021/22 and 2022/23 seasons.
Plants 12 03071 g005
Figure 6. Phylogenetic tree of ITS sequences of rDNA from fungal isolate in the present study aligned with related sequences accessed from the Gen Bank. Phylogenetic tree based on ITS sequences of rDNA of Aspergillus niger AUMC15937 (red arrow) aligned with closely related sequences accessed from the GenBank. This strain showed 99.83–100% identity and 99–100% coverage with strain sequences of the same species. Penicillium chrysogenum is included in the tree as an outgroup strain. Aspergillus niger AUMC15937 registered in NCBI GenBank under accession no. OR361771. A. = Aspergillus and P. = Penicillium.
Plants 12 03071 g006
Table 1. Interactive effect of soil type (ST) and compost with phosphate (P)–potassium (K)-solubilizing Aspergillus niger (PK+C-AN) level on leaf chlorophylls, and carotenoids of quinoa grown in (SI) 2021/22 and (SII) 2022/23 winter seasons.
STPK+C-ANChl aChl bTotal ChlCarotenoidsTPP
(mg cm−2)
NorPK100%27.0 ± 0.4 cd5.39 ± 0.27 a32.4 ± 0.4 e9.03 ± 0.16 ab41.4 ± 0.5 de
PK100%+C-AN34.3 ± 0.4 a7.64 ± 0.29 a41.9 ± 0.5 a9.48 ± 0.28 a51.4 ± 0.7 a
PK75%+C-AN28.7 ± 0.6 c7.37 ± 0.16 a36.0 ± 0.7 bc8.57 ± 0.08 bc44.6 ± 0.7 bc
PK50%+C-AN27.6 ± 0.5 c7.15 ± 0.19 a34.8 ± 0.6 cd8.41 ± 0.15 c43.2 ± 0.7 cd
PK25%+C-AN27.0 ± 0.5 cd6.93 ± 0.11 a33.9 ± 0.6 de8.51 ± 0.17 c42.4 ± 0.5 d
PK0%+C-AN22.5 ± 0.3 f6.01 ± 0.60 a28.5 ± 0.4 fg7.92 ± 0.13 d36.4 ± 0.3 fg
CalcPK100%23.6 ± 0.7 ef4.61 ± 0.36 a28.2 ± 0.4 g7.13 ± 0.38 fg35.3 ± 0.8 gh
PK100%+C-AN30.6 ± 1.2 b6.80 ± 0.31 a37.4 ± 1.0 b9.01 ± 0.17 ab46.5 ± 1.1 b
PK75%+C-AN28.7 ± 0.8 c5.74 ± 0.21 a34.4 ± 0.8 cd8.44 ± 0.14 c42.9 ± 0.8 cd
PK50%+C-AN27.0 ± 0.8 cd5.25 ± 0.13 a32.2 ± 0.8 e7.64 ± 0.11 de39.9 ± 0.8 e
PK25%+C-AN25.2 ± 0.5 de4.96 ± 0.11 a30.2 ± 0.5 f7.36 ± 0.16 ef37.6 ± 0.4 f
PK0%+C-AN23.0 ± 0.3 f4.56 ± 0.14 a27.5 ± 0.4 g6.67 ± 0.17 g34.2 ± 0.3 h
p-value for ST × PK+C-AN0.007 **0.073 ns0.047 *<0.001 **0.016 *
Values are means ± standard error (n = 3). * and ** indicate differences at p ≤ 0.05 and p ≤ 0.01 probability level, respectively. ns = no significant difference. Mean values for each factor followed by the same lowercase letter in each column are not significantly different according to the Duncan test (p ≤ 0.05). PK100% = 72 kg P2O5 ha−1 + 60 kg K2O ha−1, PK75% = 54 kg P2O5 ha−1 + 45 kg K2O ha−1, PK50% = 36 kg P2O5 ha−1 + 30 kg K2O ha−1, PK25% = 18 kg P2O5 ha−1 + 15 kg K2O ha−1, PK0% = 0 kg P2O5 ha−1 + 0 kg K2O ha−1, and compost was added with a rate of 20 t ha−1. Normal (Nor), calcareous (Calc), chlorophyll a (Chl a), chlorophyll b (Chl b), total chlorophyll (Total Chl), and total photosynthetic pigments (TPP).
Table 2. Interactive effect of soil type (ST) and compost with phosphate (P)–potassium (K)-solubilizing Aspergillus niger (PK+C-AN) level on proximate chemical composition of quinoa’s seeds grown in (SI) 2021/22 and (SII) 2022/23 winter seasons.
STPK+C-ANCrude ProteinAshCrude LipidCrude FiberCarbohydrates
(%)
NorPK100%14.7 ± 0.10 f2.61 ± 0.03 e6.35 ± 0.15 a–c3.57 ± 0.04 f64.5 ± 0.44 f
PK100%+C-AN16.1 ± 0.12 a3.20 ± 0.07 c6.48 ± 0.15 ab3.61 ± 0.04 e62.4 ± 0.52 i
PK75%+C-AN15.2 ± 0.11 d2.91 ± 0.06 d6.55 ± 0.15 ab3.70 ± 0.04 d63.9 ± 0.46 g
PK50%+C-AN15.4 ± 0.11 c2.97 ± 0.04 d6.45 ± 0.22 ab3.82 ± 0.04 c63.1 ± 0.47 h
PK25%+C-AN15.6 ± 0.11 b2.41 ± 0.03 f6.59 ± 0.25 a4.00 ± 0.04 b63.3 ± 0.47 h
PK0%+C-AN14.9 ± 0.10 e1.48 ± 0.10 h6.13 ± 0.15 c–e4.13 ± 0.05 a65.2 ± 0.43 e
CalcPK100%11.9 ± 0.08 k2.00 ± 0.03 g5.90 ± 0.14 e3.24 ± 0.04 l71.1 ± 0.35 a
PK100%+C-AN12.4 ± 0.13 j3.67 ± 0.04 a6.03 ± 0.14 de3.27 ± 0.04 k68.5 ± 0.40 b
PK75%+C-AN13.3 ± 0.11 i3.34 ± 0.04 b6.03 ± 0.14 de3.36 ± 0.04 j67.7 ± 0.39 cd
PK50%+C-AN13.4 ± 0.09 i2.94 ± 0.03 d5.87 ± 0.15 e3.40 ± 0.04 i68.1 ± 0.37 bc
PK25%+C-AN13.6 ± 0.10 h2.60 ± 0.06 e6.15 ± 0.15 c–e3.74 ± 0.04 h68.3 ± 0.37 b
PK0%+C-AN14.0 ± 0.10 g2.57 ± 0.05 e6.28 ± 0.15 b–d3.52 ± 0.04 g67.6 ± 0.39 d
p-value for ST × PK+C-AN<0.001 **<0.001 **0.003 **<0.001 **<0.001 **
Values are means ± standard error (n = 3). ** indicates difference at p ≤ 0.01 probability level. Mean values for each factor followed by the same lowercase letter in each column are not significantly different according to the Duncan test (p ≤ 0.05). PK100% = 72 kg P2O5 ha−1 + 60 kg K2O ha−1, PK75% = 54 kg P2O5 ha−1 + 45 kg K2O ha−1, PK50% = 36 kg P2O5 ha−1 + 30 kg K2O ha−1, PK25% = 18 kg P2O5 ha−1 + 15 kg K2O ha−1, PK0% = 0 kg P2O5 ha−1 + 0 kg K2O ha−1, and compost was added with a rate of 20 t ha−1. Normal (Nor) and calcareous (Calc).
Table 3. Interactive effect of soil type (ST) and compost with phosphate (P)–potassium (K)-solubilizing Aspergillus niger (PK+C-AN) level on phytochemicals and antioxidant activity of quinoa’s seeds grown in (SI) 2021/22 and (SII) 2022/23 winter seasons.
STPK+C-ANTPCTFCIC50 (mg mL−1)ARP
(mg 100−1 g Dry Seed)
NorPK100%66.0 ± 0.53 f26.2 ± 0.38 f0.43 ± 0.00 e2.08 ± 0.02 g
PK100%+C-AN84.0 ± 0.56 a44.5 ± 0.41 a0.54 ± 0.01 a2.78 ± 0.05 c
PK75%+C-AN74.9 ± 0.50 c39.6 ± 0.41 b0.50 ± 0.01 b2.40 ± 0.04 d
PK50%+C-AN75.4 ± 0.52 c33.7 ± 0.41 d0.47 ± 0.01 c2.42 ± 0.03 d
PK25%+C-AN69.9 ± 0.52 d30.4 ± 0.32 e0.43 ± 0.01 e2.21 ± 0.03 ef
PK0%+C-AN53.6 ± 0.36 i30.0 ± 0.28 e0.37 ± 0.01 f1.91 ± 0.03 h
CalcPK100%57.1 ± 0.43 h23.6 ± 0.55 g0.35 ± 0.00 g2.28 ± 0.02 e
PK100%+C-AN77.7 ± 0.52 b43.6 ± 0.44 a0.48 ± 0.01 c3.21 ± 0.03 a
PK75%+C-AN68.3 ± 1.24 e36.0 ± 1.12 c0.45 ± 0.00 d2.94 ± 0.03 b
PK50%+C-AN69.2 ± 0.72 de30.0 ± 0.27 e0.43 ± 0.00 e2.75 ± 0.03 c
PK25%+C-AN63.6 ± 0.43 g25.1 ± 0.30 f0.38 ± 0.00 f2.42 ± 0.03 d
PK0%+C-AN51.5 ± 0.35 j21.9 ± 0.27 h0.32 ± 0.00 h2.16 ± 0.02 f
p-value for ST × PK+C-AN<0.001 **<0.001 **0.005 **<0.001 **
Values are means ± standard error (n = 3). ** indicates difference at p ≤ 0.01 probability level. Mean values for each factor followed by the same lowercase letter in each column are not significantly different according to the Duncan test (p ≤ 0.05). PK100% = 72 kg P2O5 ha−1 + 60 kg K2O ha−1, PK75% = 54 kg P2O5 ha−1 + 45 kg K2O ha−1, PK50% = 36 kg P2O5 ha−1 + 30 kg K2O ha−1, PK25% = 18 kg P2O5 ha−1 + 15 kg K2O ha−1, PK0% = 0 kg P2O5 ha−1 + 0 kg K2O ha−1, and compost was added with a rate of 20 t ha−1. Normal (Nor), calcareous (Calc), total phenolic compounds (TPC), total flavonoid compounds (TFC), half maximal inhibitory concentration (IC50), and antiradical power (ARP).
Table 4. Interactive effect of soil type (ST) and compost with phosphate (P)–potassium (K)-solubilizing Aspergillus niger (PK+C-AN) level on seed mineral (i.e., phosphorus—P; potassium—K+; calcium—Ca2+; magnesium—Mg2+, sodium—Na2+, iron—Fe2+, and zinc—Zn2+) contents of quinoa grown in (SI) 2021/22 and (SII) 2022/23 winter seasons.
STPK+C-ANPK+Ca2+Mg2+Na+Fe2+Zn2+
(g 100−1 g Dry Seed)
NorPK100%0.35 ± 0.00 ef2.52 ± 0.02 g1.63 ± 0.02 a0.84 ± 0.05 e0.30 ± 0.01 c0.92 ± 0.02 h0.46 ± 0.01 e
PK100%+C-AN0.48 ± 0.01 a3.19 ± 0.11 a1.95 ± 0.04 a1.42 ± 0.12 a0.37 ± 0.02 a1.15 ± 0.08 a0.50 ± 0.01 a
PK75%+C-AN0.44 ± 0.01 b2.70 ± 0.03 c1.74 ± 0.02 a1.08 ± 0.12 b0.34 ± 0.01 b1.01 ± 0.02 c0.49 ± 0.01 b
PK50%+C-AN0.42 ± 0.00 c2.64 ± 0.02 e1.69 ± 0.02 a0.87 ± 0.07 c0.30 ± 0.00 c0.95 ± 0.00 f0.47 ± 0.01 c
PK25%+C-AN0.33 ± 0.00 f2.59 ± 0.00 f1.49 ± 0.03 a0.84 ± 0.07 de0.29 ± 0.00 d0.89 ± 0.01 i0.47 ± 0.01 c
PK0%+C-AN0.27 ± 0.01 h2.30 ± 0.04 i1.23 ± 0.02 a0.63 ± 0.01 k0.25 ± 0.01 g0.86 ± 0.01 j0.43 ± 0.00 g
CalcPK100%0.36 ± 0.01 e2.21 ± 0.02 k1.42 ± 0.02 a0.68 ± 0.04 i0.21 ± 0.02 j0.82 ± 0.01 k0.45 ± 0.00 f
PK100%+C-AN0.47 ± 0.00 a2.89 ± 0.01 b1.72 ± 0.03 a0.85 ± 0.04 d0.28 ± 0.01 e1.08 ± 0.04 b0.47 ± 0.00 c
PK75%+C-AN0.42 ± 0.01 c2.69 ± 0.08 d1.55 ± 0.02 a0.80 ± 0.05 f0.26 ± 0.00 f0.98 ± 0.03 d0.46 ± 0.00 d
PK50%+C-AN0.40 ± 0.01 d2.47 ± 0.03 h1.52 ± 0.02 a0.75 ± 0.02 g0.24 ± 0.01 h0.96 ± 0.01 e0.45 ± 0.00 ef
PK25%+C-AN0.30 ± 0.01 g2.22 ± 0.03 j1.38 ± 0.02 a0.70 ± 0.02 h0.22 ± 0.01 i0.94 ± 0.01 g0.46 ± 0.01 e
PK0%+C-AN0.23 ± 0.01 i2.20 ± 0.00 k1.03 ± 0.02 a0.66 ± 0.02 j0.16 ± 0.03 k0.82 ± 0.00 k0.44 ± 0.01 g
p-value for ST × PK+C-AN<0.001 **<0.001 **0.220 ns<0.001 **<0.001 **<0.001 **<0.001 **
Values are means ± standard error (n = 3). ** indicates difference at p ≤ 0.01 probability level. ns = no significant difference. Mean values for each factor followed by the same lowercase letter in each column are not significantly different according to the Duncan test (p ≤ 0.05). PK100% = 72 kg P2O5 ha−1 + 60 kg K2O ha−1, PK75% = 54 kg P2O5 ha−1 + 45 kg K2O ha−1, PK50% = 36 kg P2O5 ha−1 + 30 kg K2O ha−1, PK25% = 18 kg P2O5 ha−1 + 15 kg K2O ha−1, PK0% = 0 kg P2O5 ha−1 + 0 kg K2O ha−1, and compost was added with a rate of 20 t ha−1. Normal (Nor) and calcareous (Calc).
Table 5. Effect of soil type, compost with phosphate (P)–potassium (K)-solubilizing Aspergillus niger (PK+C-AN) level, and their interaction on yield and yield-related attributes of quinoa grown in (SI) 2021/22 and (SII) 2022/23 winter seasons.
STPK+C-ANPlant Height (cm)Plant Dry Weight (g)HW (kg hL−1)Seed YieldBiological YieldHI (%)
(t ha−1)
NorPK100%96.8 ± 1.3 d26.5 ± 0.2 c67.6 ± 0.4 fg2.24 ± 0.04 e4.95 ± 0.24 d45.7 ± 1.9 a
PK100%+C-AN112.5 ± 1.3 a39.3 ± 0.4 a70.1 ± 0.5 b3.27 ± 0.05 a7.70 ± 0.20 a42.6 ± 1.8 a
PK75%+C-AN109.8 ± 1.0 b29.9 ± 0.8 b69.3 ± 0.5 b–d3.20 ± 0.04 a6.96 ± 0.26 b46.1 ± 1.4 a
PK50% + C-AN108.8 ± 0.7 b26.5 ± 0.2 c68.5 ± 0.5 d–f3.01 ± 0.06 b6.64 ± 0.43 b46.3 ± 3.2 a
PK25%+C-AN107.3 ± 0.8 bc24.2 ± 0.4 d68.2 ± 0.4 e–g2.01 ± 0.09 f5.42 ± 0.25 c37.4 ± 1.8 a
PK0%+C-AN104.8 ± 1.0 c23.7 ± 0.5 d66.5 ± 0.5 h1.76 ± 0.05 g4.21 ± 0.27 ef42.5 ± 1.9 a
CalcPK100%80.3 ± 1.0 g13.0 ± 0.4 i67.6 ± 0.6f g1.57 ± 0.04 h3.01 ± 0.04 g52.3 ± 1.5 a
PK100%+C-AN93.0 ± 1.4 e21.2 ± 0.5 e72.4 ± 1.03 a2.50 ± 0.07 c4.79 ± 0.04 d52.2 ± 1.0 a
PK75%+C-AN91.8 ± 1.3 e19.0 ± 0.2 f69.4 ± 0.1 bc2.43 ± 0.07 cd4.56 ± 0.10 de53.3 ± 0.8 a
PK50%+C-AN90.8 ± 1.5 ef17.2 ± 0.4 g69.0 ± 0.5 c–e2.27 ± 0.07 de4.25 ± 0.11 ef53.7 ± 1.8 a
PK25%+C-AN88.3 ± 1.8 f16.2 ± 0.3 h68.4 ± 0.4 d–f2.12 ± 0.15 ef4.02 ± 0.19 f52.4 ± 1.3 a
PK0%+C-AN82.2 ± 1.0 g12.4 ± 0.2 i67.4 ± 0.2 g1.63 ± 0.09 gh3.18 ± 0.10 g51.3 ± 2.8 a
p-value for ST × PK+C-AN0.034 *<0.001 **0.002 **<0.001 **<0.001 **0.077 ns
Values are means ± standard error (n = 3). * and ** indicate differences at p ≤ 0.05 and p ≤ 0.01 probability level, respectively. ns = no significant difference. Mean values for each factor followed by the same lowercase letter in each column are not significantly different according to the Duncan test (p ≤ 0.05). PK100% = 72 kg P2O5 ha−1 + 60 kg K2O ha−1, PK75% = 54 kg P2O5 ha−1 + 45 kg K2O ha−1, PK50% = 36 kg P2O5 ha−1 + 30 kg K2O ha−1, PK25% = 18 kg P2O5 ha−1 + 15 kg K2O ha−1, PK0% = 0 kg P2O5 ha−1 + 0 kg K2O ha−1, and compost was added with a rate of 20 t ha−1. Hectoliter weight (HW) and harvest index (HI).
Table 6. Initial physicochemical and microbial properties (n = 3) for the upper 0.3 m soil horizon of both experimental soils (i.e., normal and calcareous) at pre-sowing over both 2021/22 and (SII) 2022/23 winter seasons.
PropertyUniteSoil Type
Normal Calcareous
Sand (%)79.90 ± 0.7279.00 ± 0.91
Silt 9.60 ± 0.5110.10 ± 0.75
Clay 10.50 ± 0.4610.90 ± 0.42
Texture class S.L S.L
Dry bulk density (g cm−3)1.65 ± 0.061.59 ± 0.04
pH (in 1:2.5 soil: water (w:v) suspension) 7.52 ± 0.037.69 ± 0.05
ECe (in soil past (1:2.5, w:v) extract)(dS m−1)3.56 ± 0.053.19 ± 0.05
Cation exchange capacity (meq/100 g soil)9.35 ± 0.329.89 ± 0.45
CaCO3 (%)6.58 ± 0.0715.54 ± 0.09
Organic carbon47.09 ± 0.9543.60 ± 0.81
Organic matter 0.81 ± 0.020.75 ± 0.03
** Exchangeable cations
Ca2+(meq L−1)12.89 ± 0.2417.66 ± 0.33
Mg2+9.54 ± 0.3610.59 ± 0.18
Na+11.25 ± 0.1812.75 ± 0.26
K+ 0.78 ± 0.011.00 ± 0.02
** Exchangeable anions
Cl(meq L−1)8.17 ± 0.6214.21 ± 0.56
SO42−25.07 ± 0.7421.54 ± 0.66
HCO31.22 ± 0.036.25 ± 0.08
CO32−--
Available soil nutrients
N (%)0.08 ± 0.010.04 ± 0.01
P(mg kg−1 soil)7.54 ± 0.105.44 ± 0.12
K+ 50.00 ± 1.442.08 ± 1.2
Fe2+2.20 ± 0.052.00 ± 0.06
Mg2+ 4.10 ± 0.223.90 ± 0.18
Zn2+ 0.79 ± 0.030.70 ± 0.05
Cu2+ 0.51 ± 0.050.44 ± 0.06
Total microbial count
PSMs (cfu × 103 g−1 soil)0.000.00
Azotobacter sp. 2.00 ± 0.460.00
** measured in soil paste for soil analysis (1:2.5 soil: water, w/v, respectively) extract. Values are means ± standard error (n = 3). Sandy loam (S.L); Phosphate-solubilizing microorganisms (PSMs).
Table 7. The physicochemical characteristics of compost organic amendment used in this study.
ParameterUniteMean Value ± SE
Bulk density(g cm−3)0.75 ± 0.09
Moisture content(%)38.40 ± 0.93
Water holding pores25.50 ± 0.65
pH (in 1:2.5 compost: water (w:v) suspension) 7.64 ± 0.05
ECe (dS m−1)2.10 ± 0.05
CaCO3(%)1.65 ± 0.03
Organic carbon27.06 ± 0.65
Organic matter46.55 ± 0.70
Carbon/nitrogen ratio 20.81 ± 0.35
Total macro-and micronutrients
N(%)1.30 ± 0.03
P0.95 ± 0.02
K+0.84 ± 0.01
Fe+2(mg kg−1)0.979 ± 18
Mg2+0.469 ± 26
Zn2+0.659 ± 33
SE= standard error (n = 3); ECe = electrical conductivity of the compost past extract.
Disclaimer/Publisher’s Note: The statements, opinions and data contained in all publications are solely those of the individual author(s) and contributor(s) and not of MDPI and/or the editor(s). MDPI and/or the editor(s) disclaim responsibility for any injury to people or property resulting from any ideas, methods, instructions or products referred to in the content.

