Figure 1.
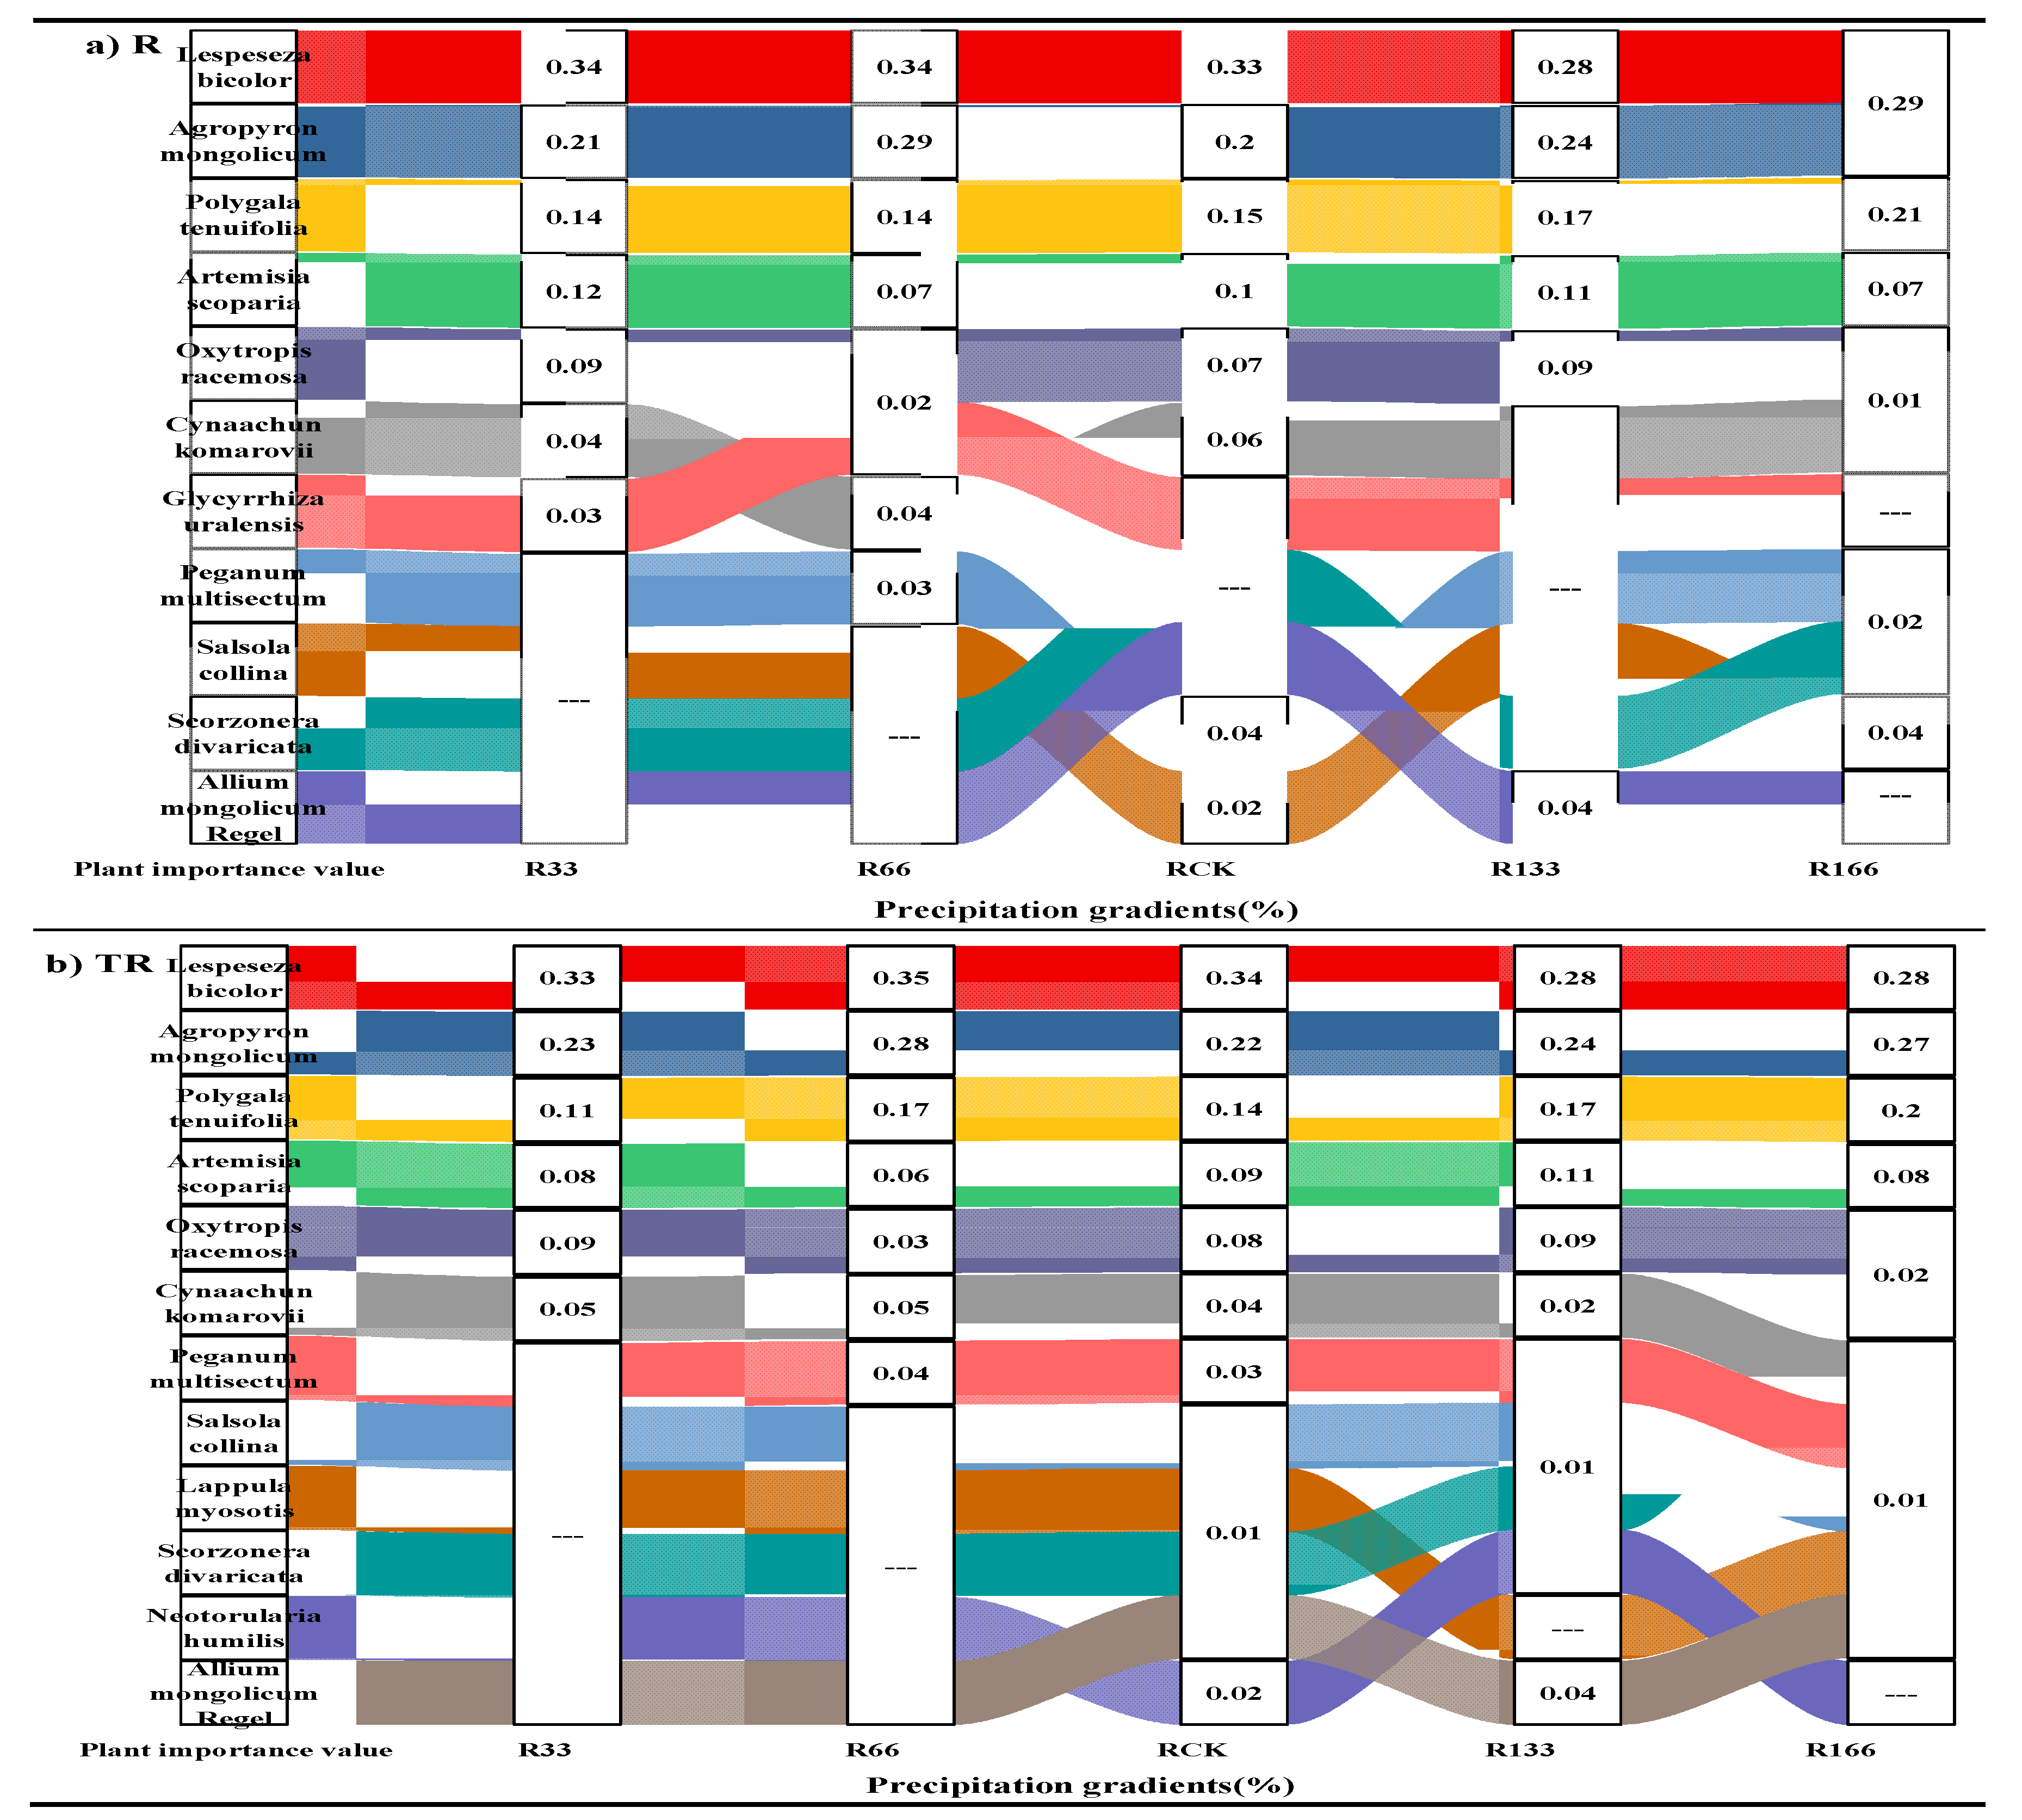
The main values of plants in the study sites. (a) The main values of plants under precipitation changing treatment (R); (b) The main values of plants under the interaction of precipitation changing and temperature increasing treatment (TR). Five levels of rainfall (R) were used: 33% (R33), 66% (R66), 100% (CK), 133% (R133), and 166% (R166) of the annual average. The first two rainfall conditions were obtained by using two rainout shelters with two manipulated rainfall doses: 97 mm (R33) and 194 mm (R66). For the three other rainfall conditions, we artificially increased rainfall pot in unsheltered plots using a watering: 295 mm (CK), 392 mm (R133), and 490 mm (R166). The temperature consisted of two levels: the actual temperature (CK) and the interaction between rainfall and the temperature, which was increased by about 2 °C (T) with the OTC (Open-Top Chamber) in each plot. TR33 was the first site of interaction between 33% precipitation (R33) and the temperature increase of about 2 °C (T); the marks of TR66, TCK, TR133, TR166 were the same. R33 was the first site of 33% precipitation, and the marks of R66, CK, R133, R166 were the same.
Figure 1.
The main values of plants in the study sites. (a) The main values of plants under precipitation changing treatment (R); (b) The main values of plants under the interaction of precipitation changing and temperature increasing treatment (TR). Five levels of rainfall (R) were used: 33% (R33), 66% (R66), 100% (CK), 133% (R133), and 166% (R166) of the annual average. The first two rainfall conditions were obtained by using two rainout shelters with two manipulated rainfall doses: 97 mm (R33) and 194 mm (R66). For the three other rainfall conditions, we artificially increased rainfall pot in unsheltered plots using a watering: 295 mm (CK), 392 mm (R133), and 490 mm (R166). The temperature consisted of two levels: the actual temperature (CK) and the interaction between rainfall and the temperature, which was increased by about 2 °C (T) with the OTC (Open-Top Chamber) in each plot. TR33 was the first site of interaction between 33% precipitation (R33) and the temperature increase of about 2 °C (T); the marks of TR66, TCK, TR133, TR166 were the same. R33 was the first site of 33% precipitation, and the marks of R66, CK, R133, R166 were the same.
![Plants 10 02580 g001]()
Figure 2.
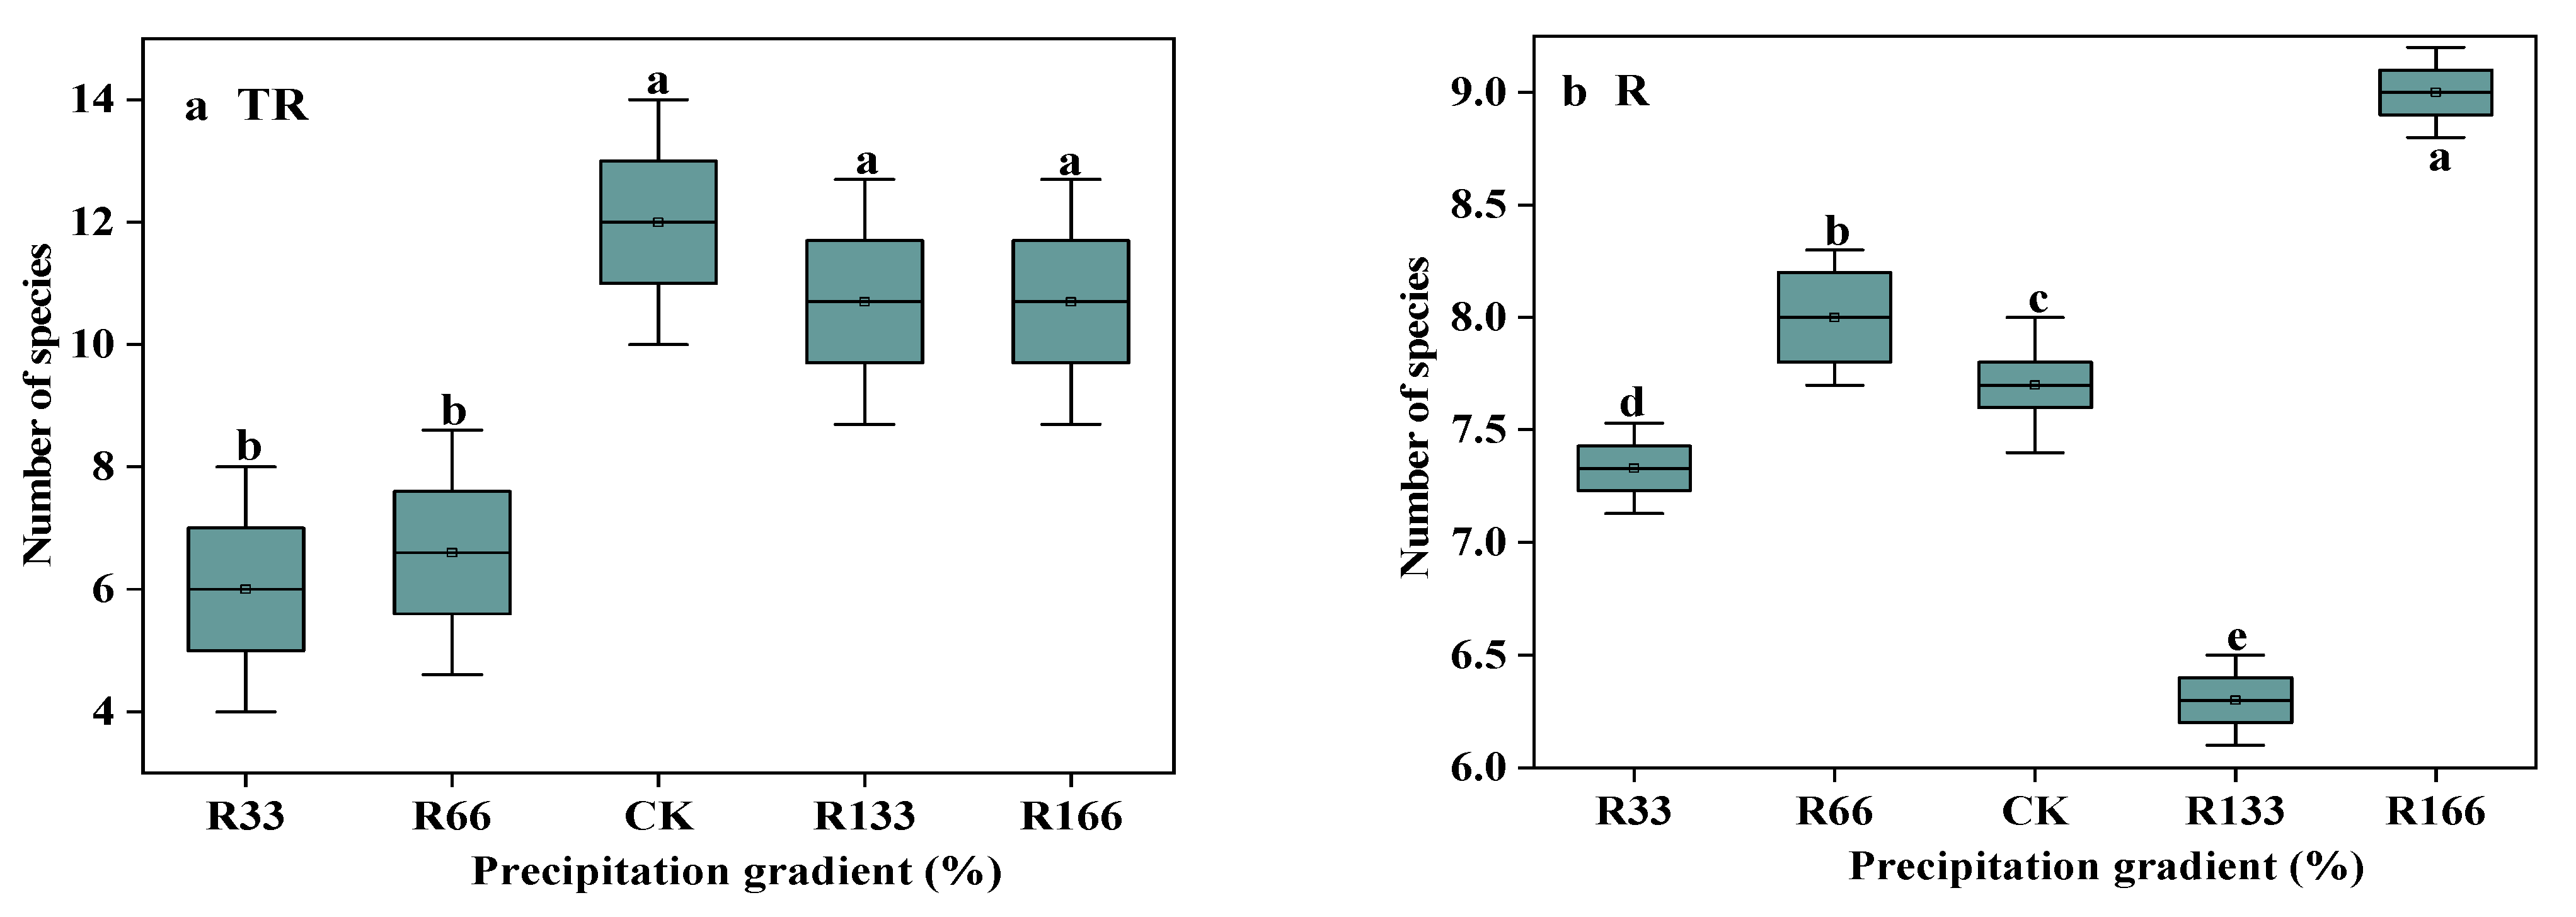
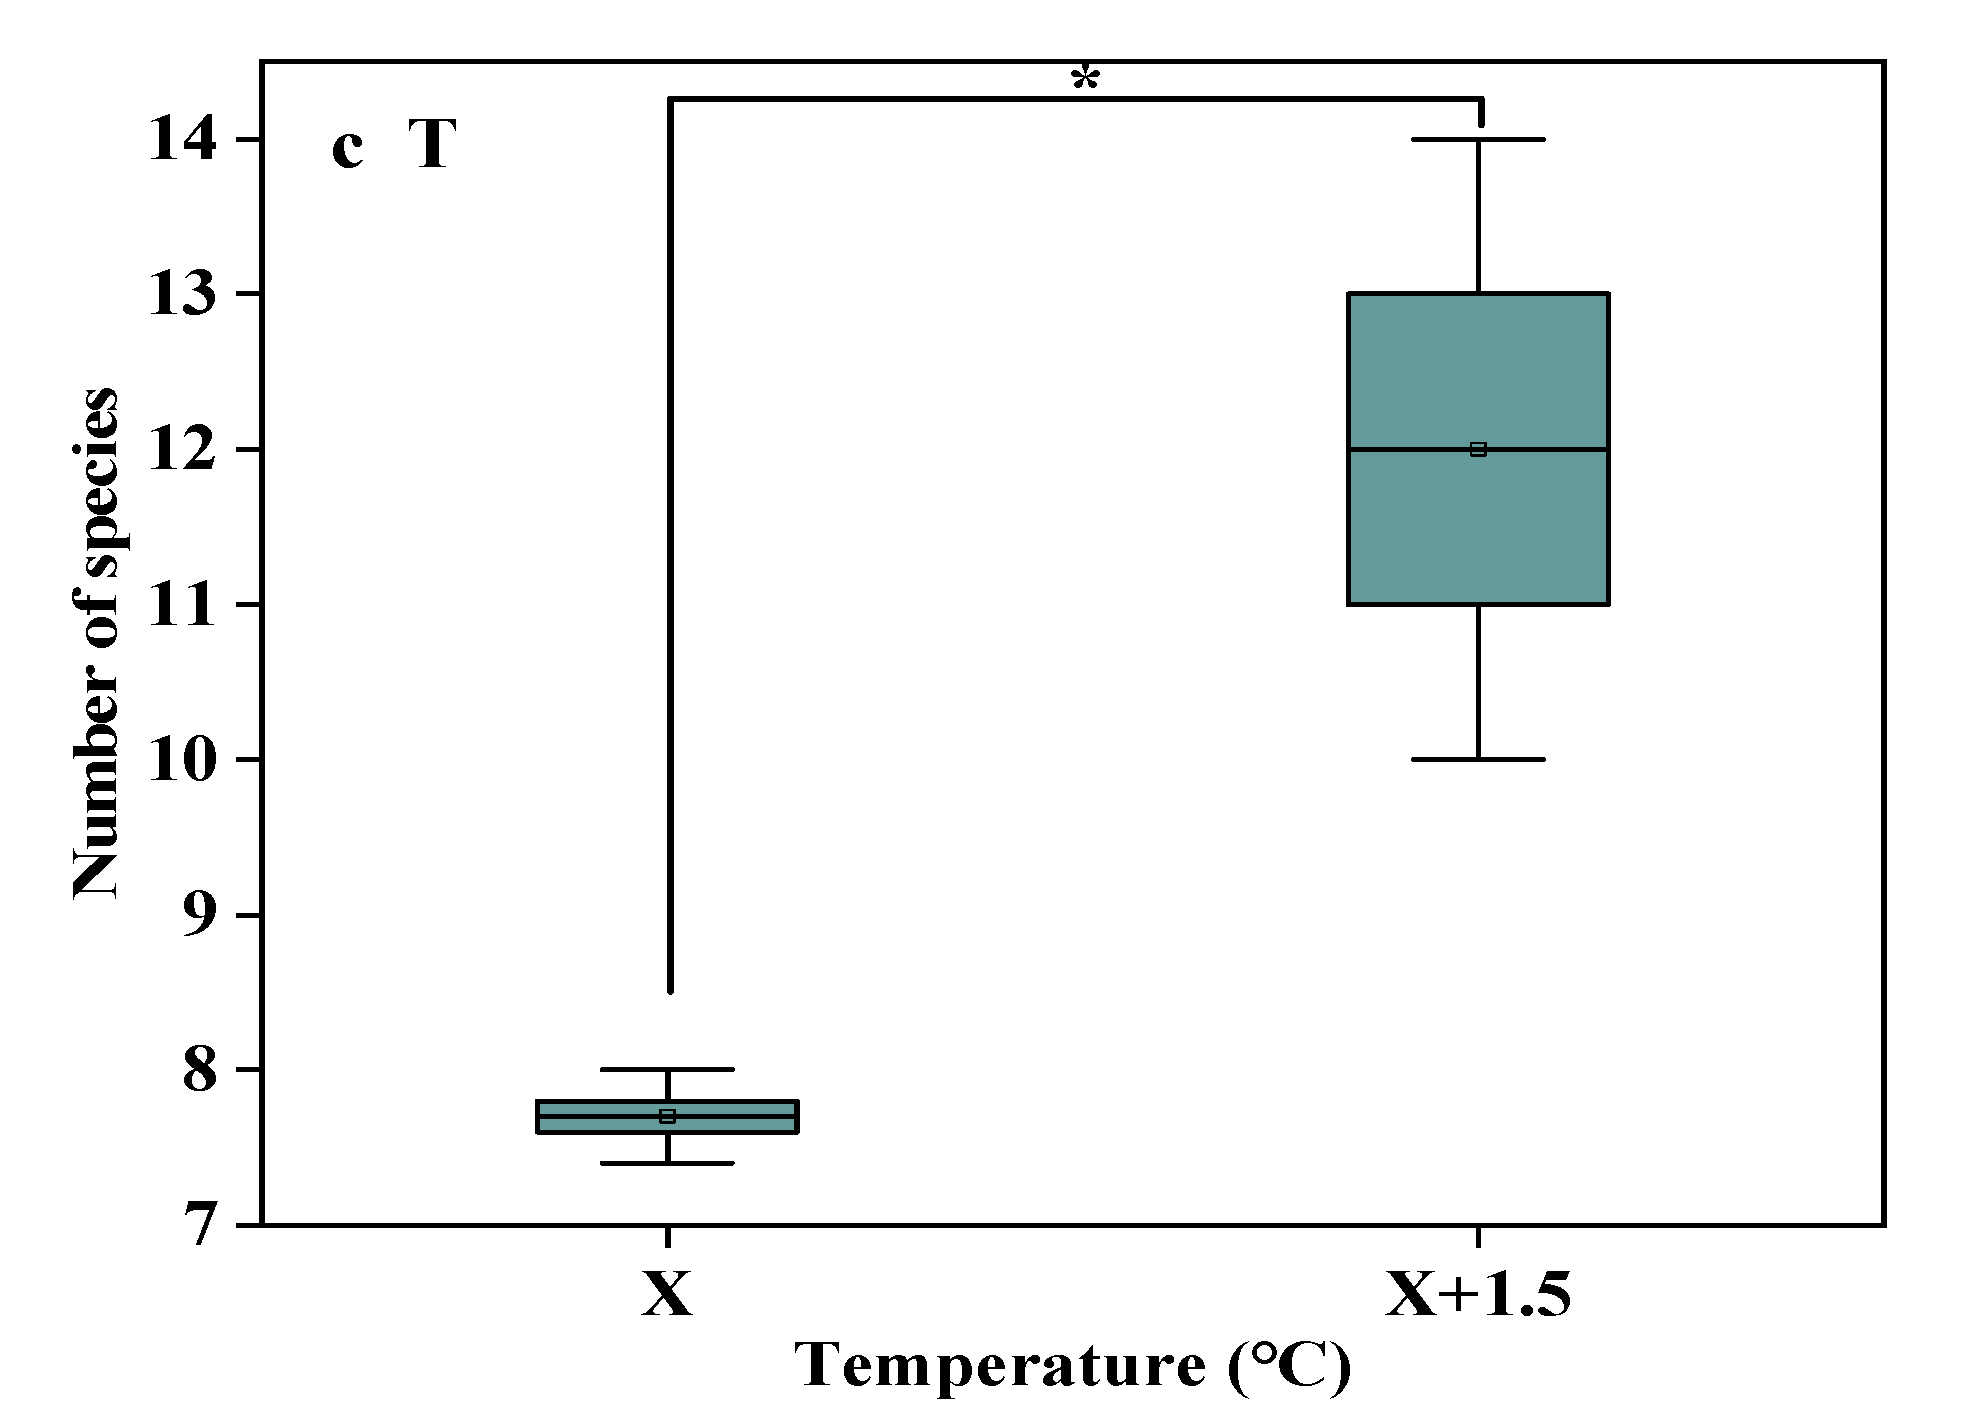
The number of species in the study sites. (a) The number of species under precipitation changing treatment (R); (b) The number of species under interaction of precipitation changing and temperature increasing treatment (TR). (c) The number of species under temperature increasing treatment (T). Five levels of rainfall (R) were used: 33% (R33), 66% (R66), 100% (CK), 133% (R133), and 166% (R166) of the annual average. The first two rainfall conditions were obtained by using two rainout shelters with two manipulated rainfall doses: 97 mm (R33) and 194 mm (R66). For the three other rainfall conditions, we artificially increased rainfall in unsheltered plots using a watering pot: 295 mm (CK), 392 mm (R133), and 490 mm (R166). The temperature consisted of two levels: the actual temperature (CK) and the interaction between rainfall and the temperature, which was increased by about 2 °C (T) with the OTC (Open-Top Chamber) in each plot. TR33 was the first site of interaction between 33% precipitation (R33) and the temperature increase of about 2 °C (T), R33 was the first site of 33% precipitation, and other marks were the same. Values indicate the mean ± SE; different letters represent a significant difference according to LSD test (p < 0.05). * represents a significant difference according to t-test (p < 0.05).
Figure 2.
The number of species in the study sites. (a) The number of species under precipitation changing treatment (R); (b) The number of species under interaction of precipitation changing and temperature increasing treatment (TR). (c) The number of species under temperature increasing treatment (T). Five levels of rainfall (R) were used: 33% (R33), 66% (R66), 100% (CK), 133% (R133), and 166% (R166) of the annual average. The first two rainfall conditions were obtained by using two rainout shelters with two manipulated rainfall doses: 97 mm (R33) and 194 mm (R66). For the three other rainfall conditions, we artificially increased rainfall in unsheltered plots using a watering pot: 295 mm (CK), 392 mm (R133), and 490 mm (R166). The temperature consisted of two levels: the actual temperature (CK) and the interaction between rainfall and the temperature, which was increased by about 2 °C (T) with the OTC (Open-Top Chamber) in each plot. TR33 was the first site of interaction between 33% precipitation (R33) and the temperature increase of about 2 °C (T), R33 was the first site of 33% precipitation, and other marks were the same. Values indicate the mean ± SE; different letters represent a significant difference according to LSD test (p < 0.05). * represents a significant difference according to t-test (p < 0.05).
![Plants 10 02580 g002a]()
![Plants 10 02580 g002b]()
Figure 3.
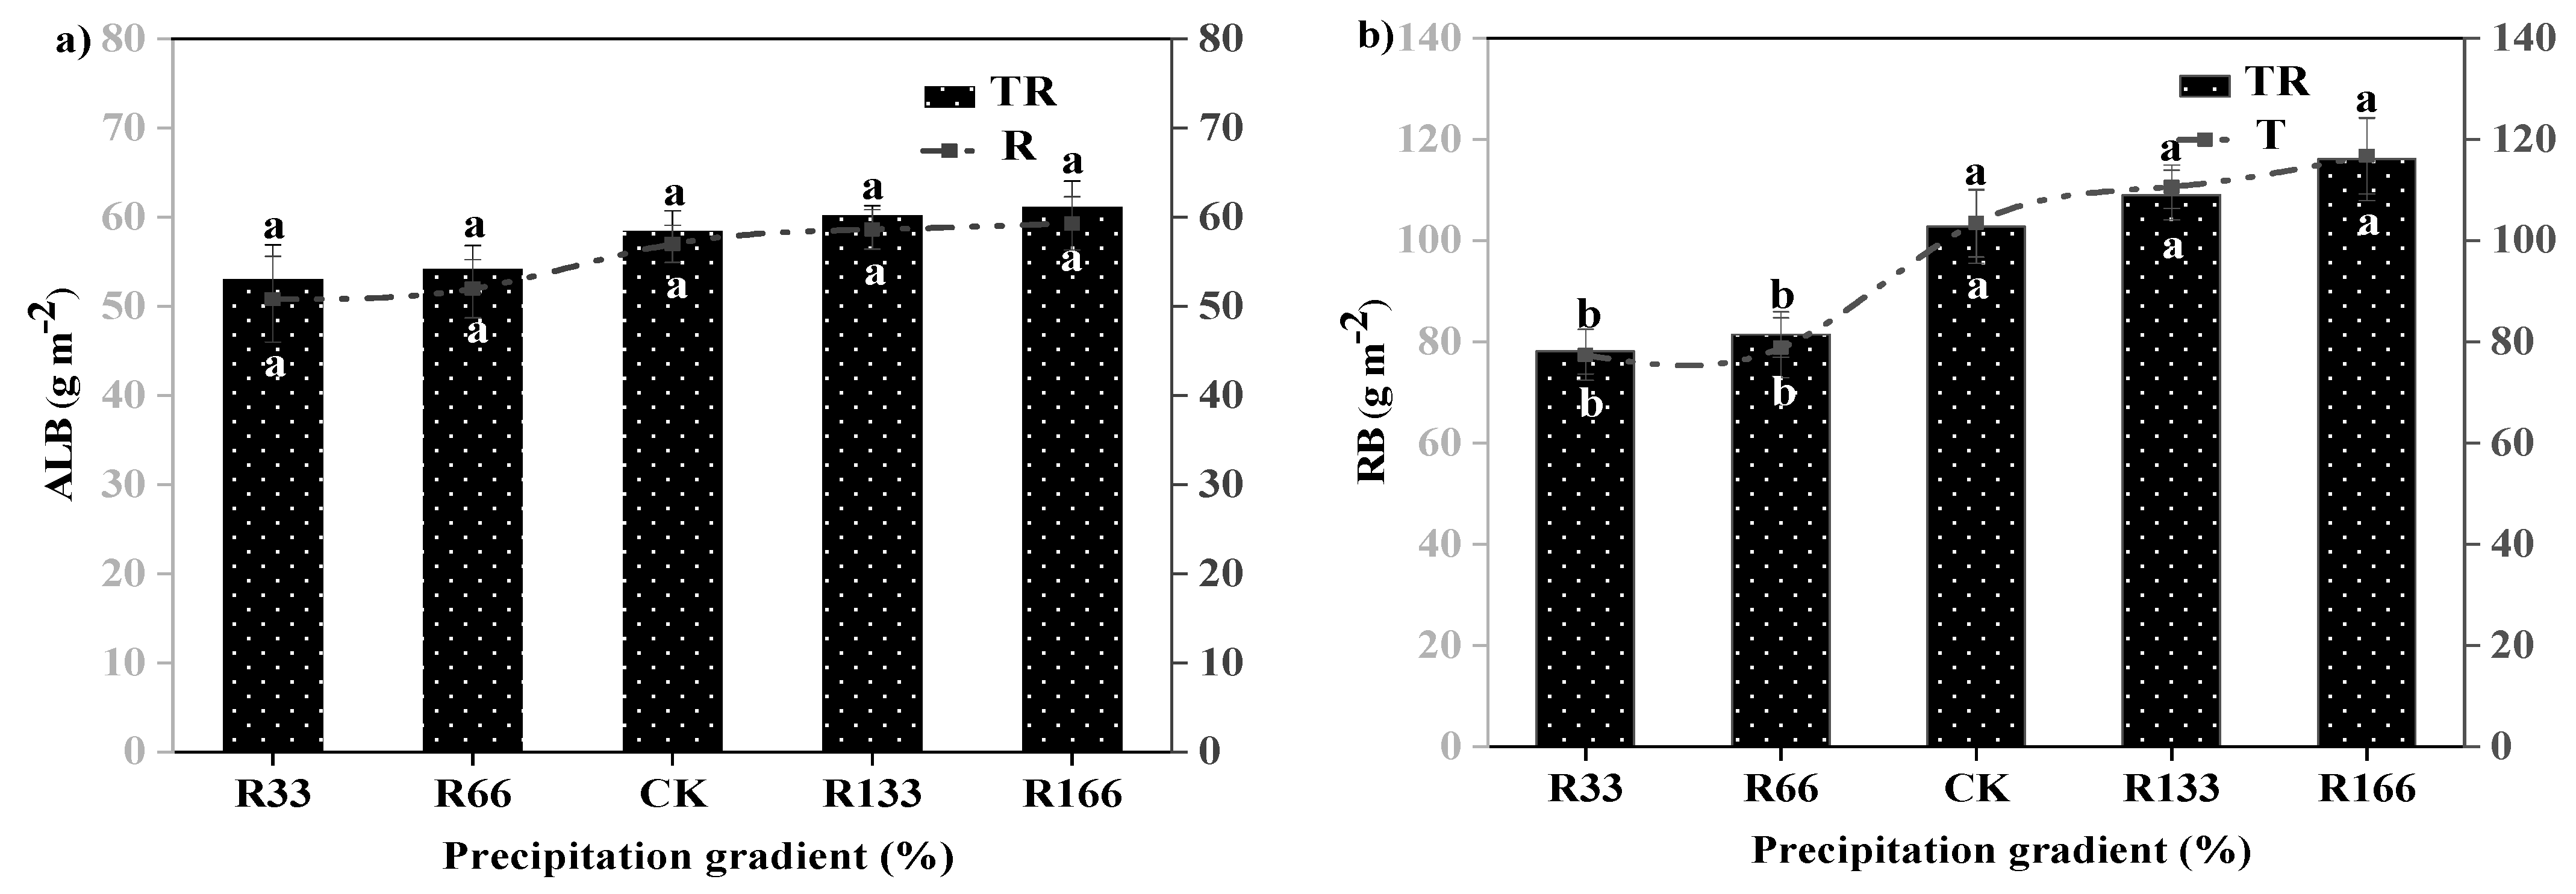
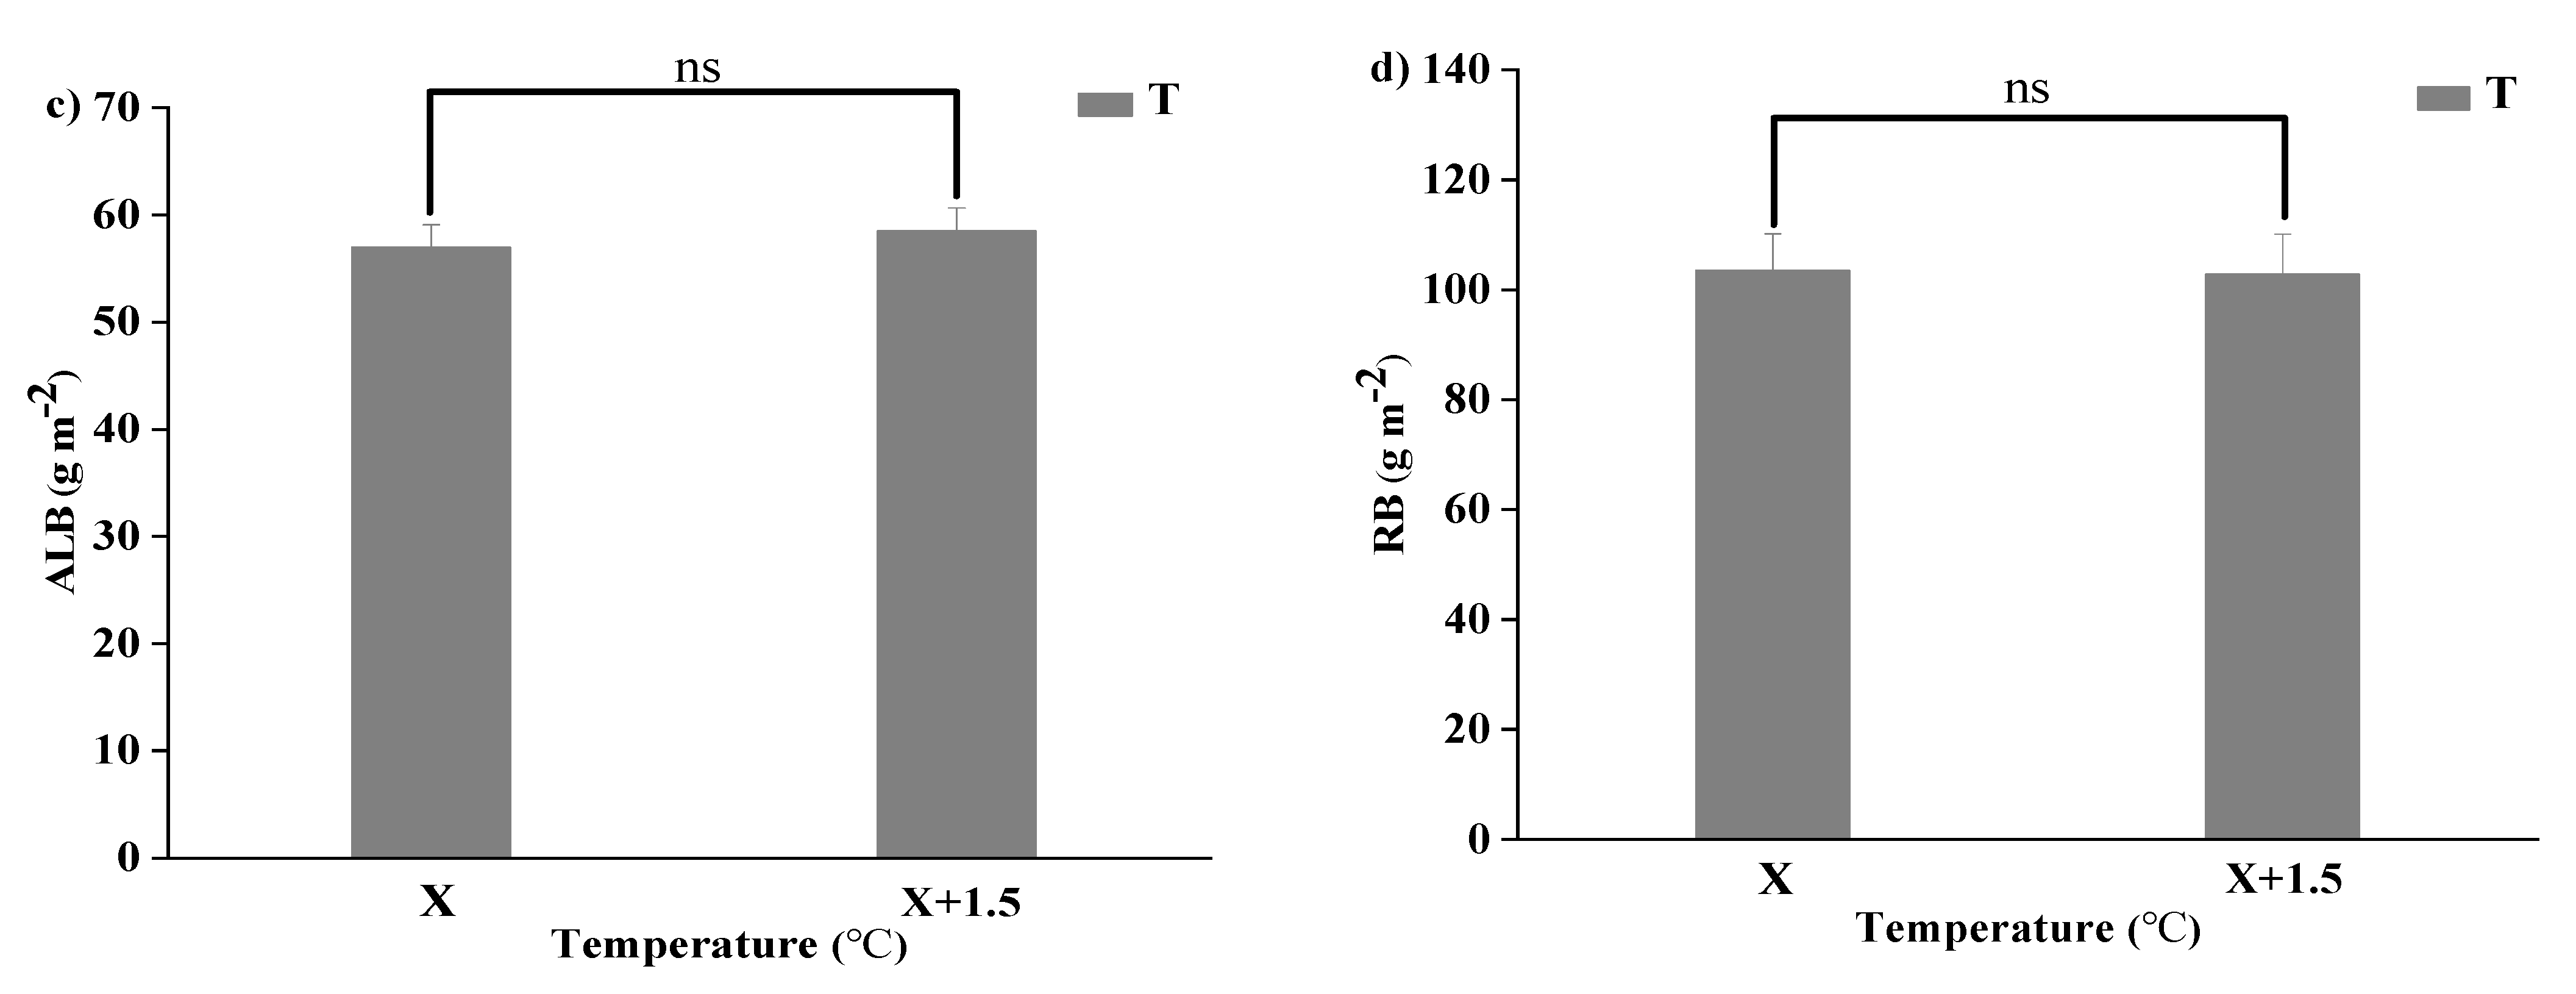
Variations of aboveground plant living biomass (ALB) and plant root biomass (RB) of vegetation in the study sites. (a) Aboveground plant living biomass (ALB) under precipitation changing (R) and the interaction of the precipitation changing and temperature increasing (TR). (b) Root biomass (RB) under precipitation changing (R) and the interaction of the precipitation changing and temperature increasing (TR). (c) Aboveground plant living biomass (ALB) under temperature increasing (T). (d) Root biomass (RB) under temperature increasing (T). Five levels of rainfall (R) were used: 33% (R33), 66% (R66), 100% (CK), 133% (R133), and 166% (R166) of the annual average. The first two rainfall conditions were obtained by using two rainout shelters with two manipulated rainfall doses: 97 mm (R33) and 194 mm (R66). For the three other rainfall conditions, we artificially increased rainfall in unsheltered plots using a watering pot: 295 mm (CK), 392 mm (R133), and 490 mm (R166). The temperature consisted of two levels: the actual temperature (CK) and the interaction between rainfall and the temperature increased by about 2 °C (T) with the OTC (Open-Top Chamber) in each plot. TR33 was the first site of interaction between 33% precipitation (R33) and the temperature, which was increased by about 2 °C (T), and the marks of TR66, TCK, TR133, TR166 are the same. R33 was the first site of 33% precipitation, and the marks of R66, CK, R133, R166 were the same. Values indicate the mean ± SE, and different letters represent a significant difference according to LSD test (p < 0.05). ns represents a no significant difference according to t-test (p < 0.05).
Figure 3.
Variations of aboveground plant living biomass (ALB) and plant root biomass (RB) of vegetation in the study sites. (a) Aboveground plant living biomass (ALB) under precipitation changing (R) and the interaction of the precipitation changing and temperature increasing (TR). (b) Root biomass (RB) under precipitation changing (R) and the interaction of the precipitation changing and temperature increasing (TR). (c) Aboveground plant living biomass (ALB) under temperature increasing (T). (d) Root biomass (RB) under temperature increasing (T). Five levels of rainfall (R) were used: 33% (R33), 66% (R66), 100% (CK), 133% (R133), and 166% (R166) of the annual average. The first two rainfall conditions were obtained by using two rainout shelters with two manipulated rainfall doses: 97 mm (R33) and 194 mm (R66). For the three other rainfall conditions, we artificially increased rainfall in unsheltered plots using a watering pot: 295 mm (CK), 392 mm (R133), and 490 mm (R166). The temperature consisted of two levels: the actual temperature (CK) and the interaction between rainfall and the temperature increased by about 2 °C (T) with the OTC (Open-Top Chamber) in each plot. TR33 was the first site of interaction between 33% precipitation (R33) and the temperature, which was increased by about 2 °C (T), and the marks of TR66, TCK, TR133, TR166 are the same. R33 was the first site of 33% precipitation, and the marks of R66, CK, R133, R166 were the same. Values indicate the mean ± SE, and different letters represent a significant difference according to LSD test (p < 0.05). ns represents a no significant difference according to t-test (p < 0.05).
![Plants 10 02580 g003a]()
![Plants 10 02580 g003b]()
Figure 4.
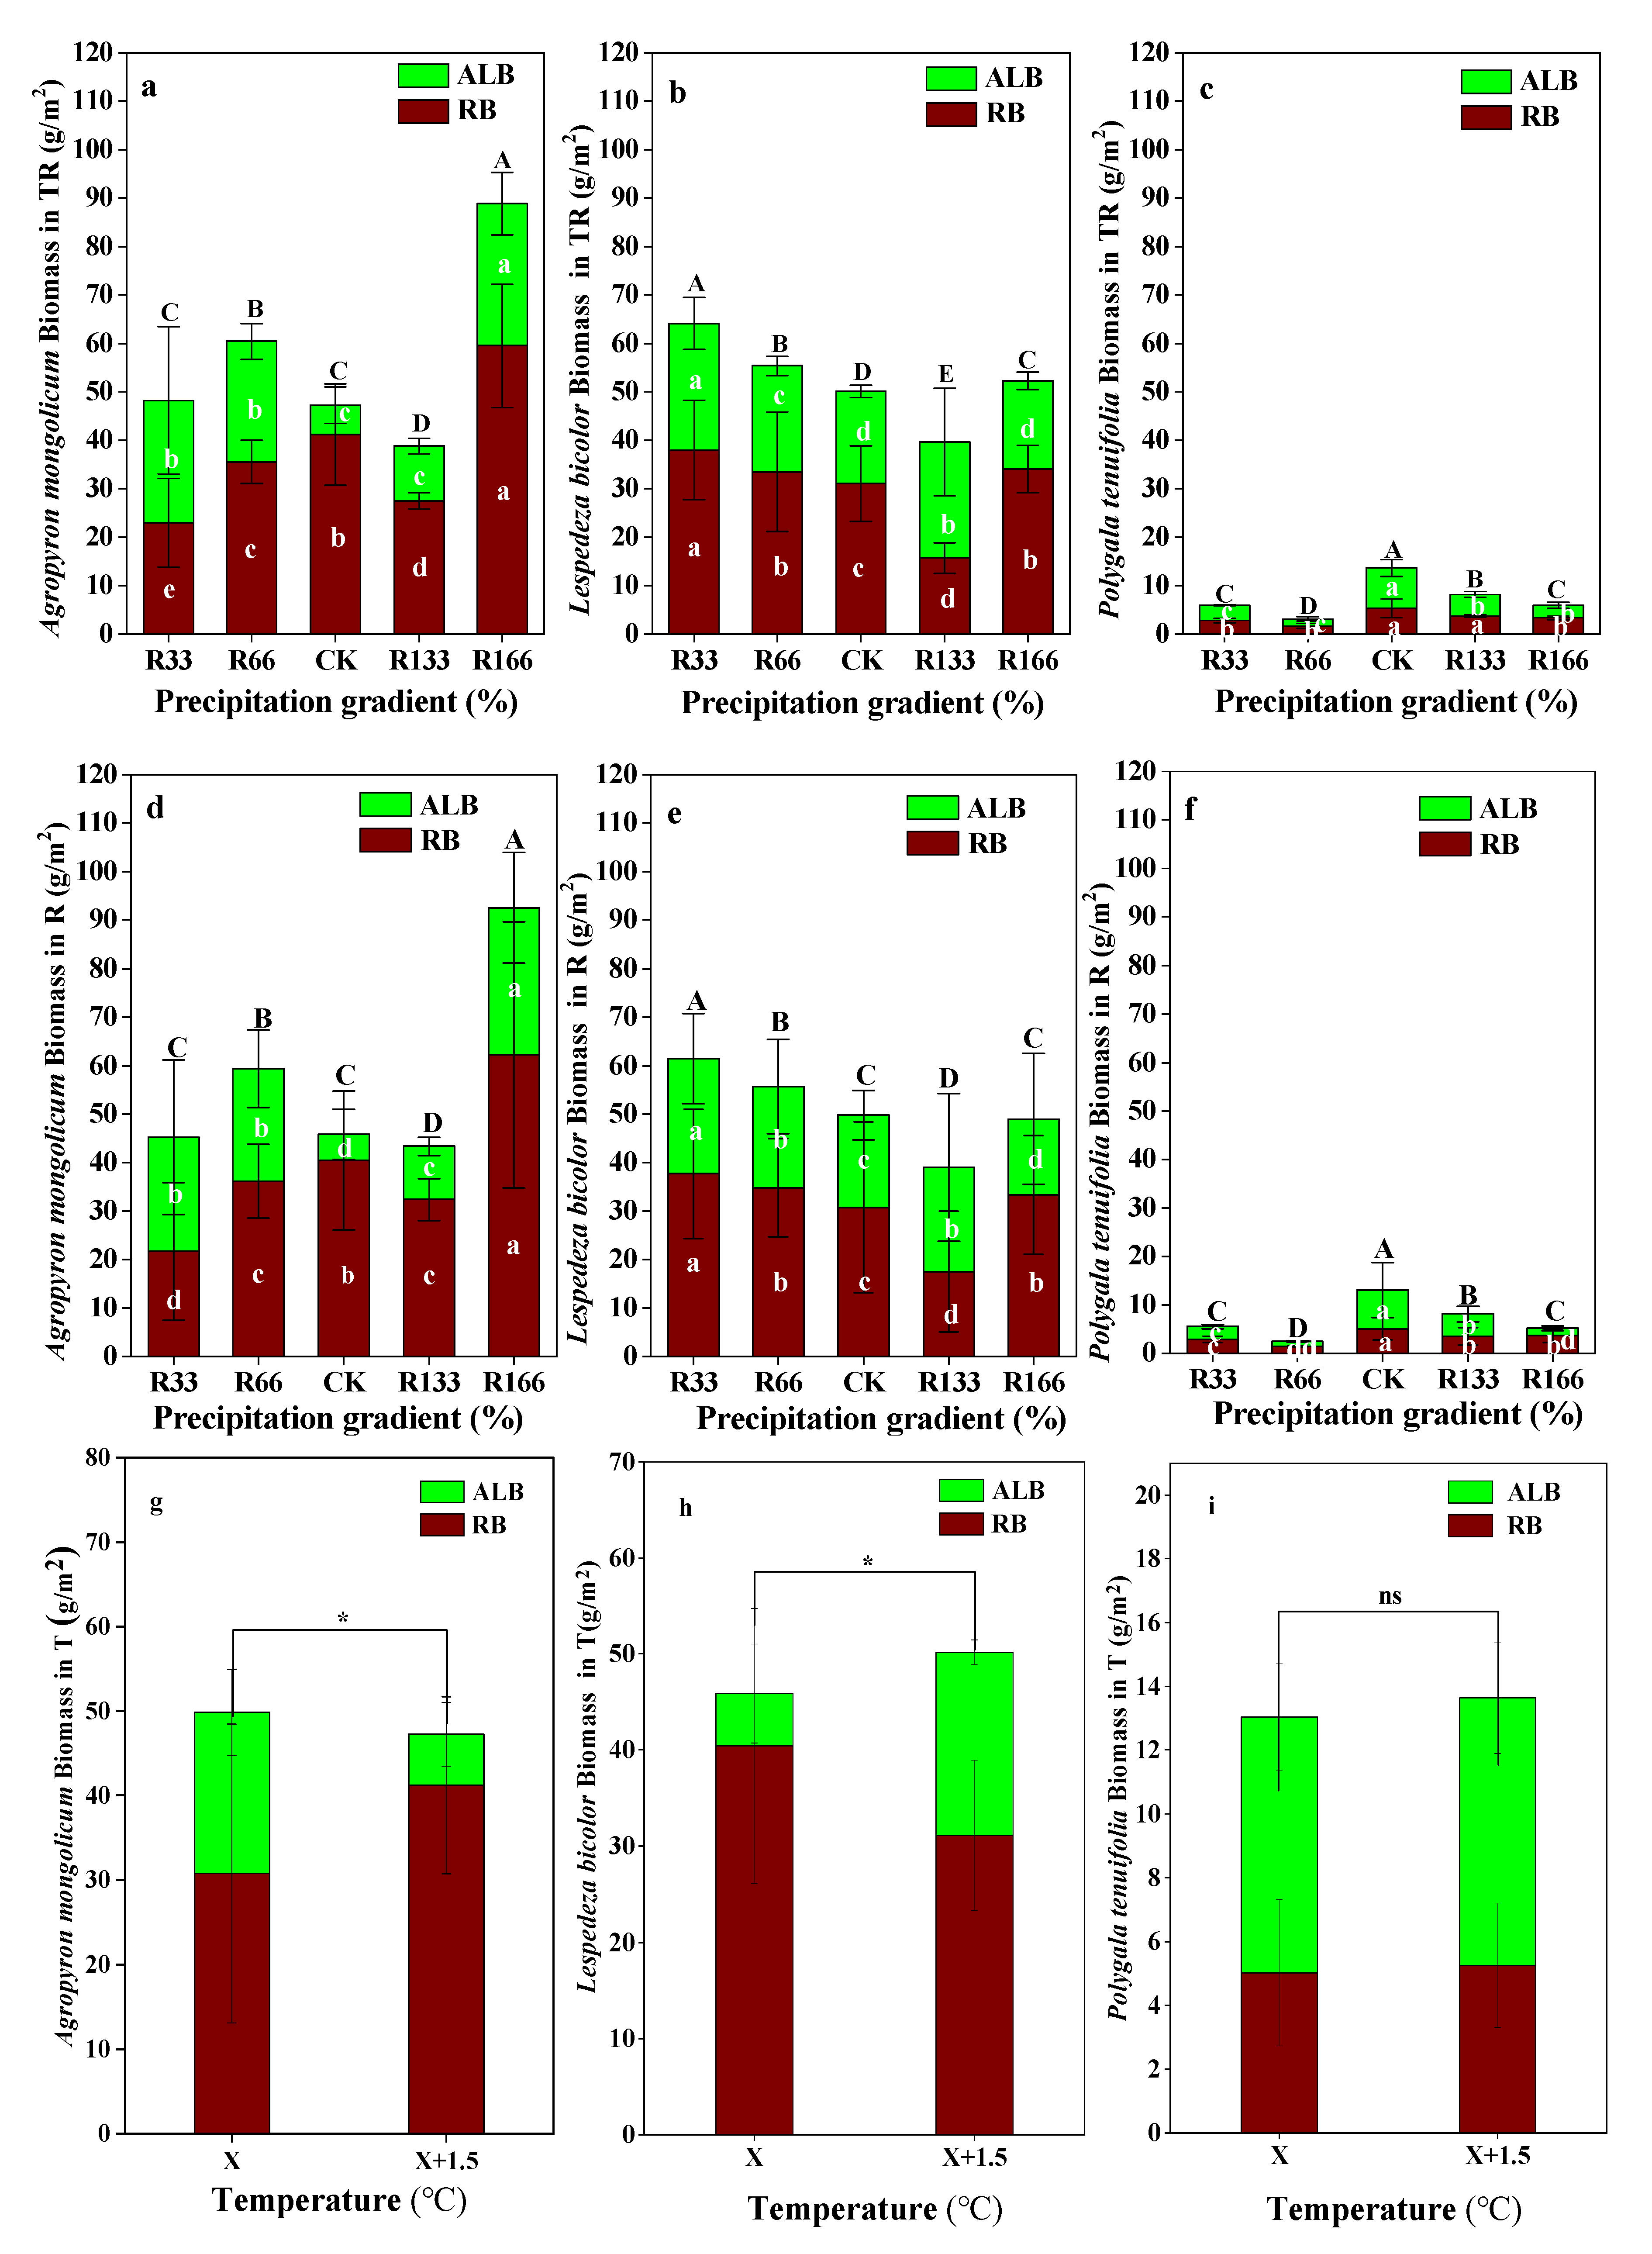
Variations of aboveground plant living biomass (ALB) and plant root biomass (RB) of dominant species in the study sites. (a) Aboveground plant living biomass (ALB) and plant root biomass (RB) of Agropyron mongolicum under the precipitation changing and temperature increasing(TR); (b) Aboveground plant living biomass (ALB) and plant root biomass (RB) of Lespedeza bicolor under the precipitation changing and temperature increasing(TR); (c) Aboveground plant living biomass (ALB) and plant root biomass (RB) of Polygala tenuifolia under the precipitation changing and temperature increasing(TR); (d) Aboveground plant living biomass (ALB) and plant root biomass (RB) of Agropyron mongolicum under the precipitation changing (R); (e) Aboveground plant living biomass (ALB) and plant root biomass (RB) of Lespedeza bicolor under the precipitation changing (R); (f) Aboveground plant living biomass (ALB) and plant root biomass (RB) of Polygala tenuifolia under the precipitation changing (R); (g) Aboveground plant living biomass (ALB) and plant root biomass (RB) of Agropyron mongolicum under the temperature increasing (T); (h) Aboveground plant living biomass (ALB) and plant root biomass (RB) of Lespedeza bicolor under the temperature increasing (T); (i) Aboveground plant living biomass (ALB) and plant root biomass (RB) of Polygala tenuifolia under the temperature increasing (T). Five levels of rainfall (R) were used: 33% (R33), 66% (R66), 100% (CK), 133% (R133), and 166% (R166) of the annual average. The first two rainfall conditions were obtained by using two rainout shelters with two manipulated rainfall doses: 97 mm (R33) and 194 mm (R66). For the three other rainfall conditions, we artificially increased rainfall in unsheltered plots using a watering pot: 295 mm (CK), 392 mm (R133), and 490 mm (R166). The temperature consisted of two levels: the actual temperature (CK) and the interaction between rainfall and the temperature increased by about 2 °C (T) with the OTC (Open-Top Chamber) in each plot. TR33 was the first site of interaction between 33% precipitation (R33) and the temperature, which was increased by about 2 °C (T), and the marks of TR66, TCK, TR133, TR166 were the same. R33 was the first site of 33% precipitation, and the marks of R66, CK, R133, R166 were the same. Values indicate the mean ± SE; different letters represent a significant difference according to LSD test (p < 0.05). ns represents a nonsignificant difference according to t-test (p < 0.05).
Figure 4.
Variations of aboveground plant living biomass (ALB) and plant root biomass (RB) of dominant species in the study sites. (a) Aboveground plant living biomass (ALB) and plant root biomass (RB) of Agropyron mongolicum under the precipitation changing and temperature increasing(TR); (b) Aboveground plant living biomass (ALB) and plant root biomass (RB) of Lespedeza bicolor under the precipitation changing and temperature increasing(TR); (c) Aboveground plant living biomass (ALB) and plant root biomass (RB) of Polygala tenuifolia under the precipitation changing and temperature increasing(TR); (d) Aboveground plant living biomass (ALB) and plant root biomass (RB) of Agropyron mongolicum under the precipitation changing (R); (e) Aboveground plant living biomass (ALB) and plant root biomass (RB) of Lespedeza bicolor under the precipitation changing (R); (f) Aboveground plant living biomass (ALB) and plant root biomass (RB) of Polygala tenuifolia under the precipitation changing (R); (g) Aboveground plant living biomass (ALB) and plant root biomass (RB) of Agropyron mongolicum under the temperature increasing (T); (h) Aboveground plant living biomass (ALB) and plant root biomass (RB) of Lespedeza bicolor under the temperature increasing (T); (i) Aboveground plant living biomass (ALB) and plant root biomass (RB) of Polygala tenuifolia under the temperature increasing (T). Five levels of rainfall (R) were used: 33% (R33), 66% (R66), 100% (CK), 133% (R133), and 166% (R166) of the annual average. The first two rainfall conditions were obtained by using two rainout shelters with two manipulated rainfall doses: 97 mm (R33) and 194 mm (R66). For the three other rainfall conditions, we artificially increased rainfall in unsheltered plots using a watering pot: 295 mm (CK), 392 mm (R133), and 490 mm (R166). The temperature consisted of two levels: the actual temperature (CK) and the interaction between rainfall and the temperature increased by about 2 °C (T) with the OTC (Open-Top Chamber) in each plot. TR33 was the first site of interaction between 33% precipitation (R33) and the temperature, which was increased by about 2 °C (T), and the marks of TR66, TCK, TR133, TR166 were the same. R33 was the first site of 33% precipitation, and the marks of R66, CK, R133, R166 were the same. Values indicate the mean ± SE; different letters represent a significant difference according to LSD test (p < 0.05). ns represents a nonsignificant difference according to t-test (p < 0.05).
![Plants 10 02580 g004]()
Figure 5.
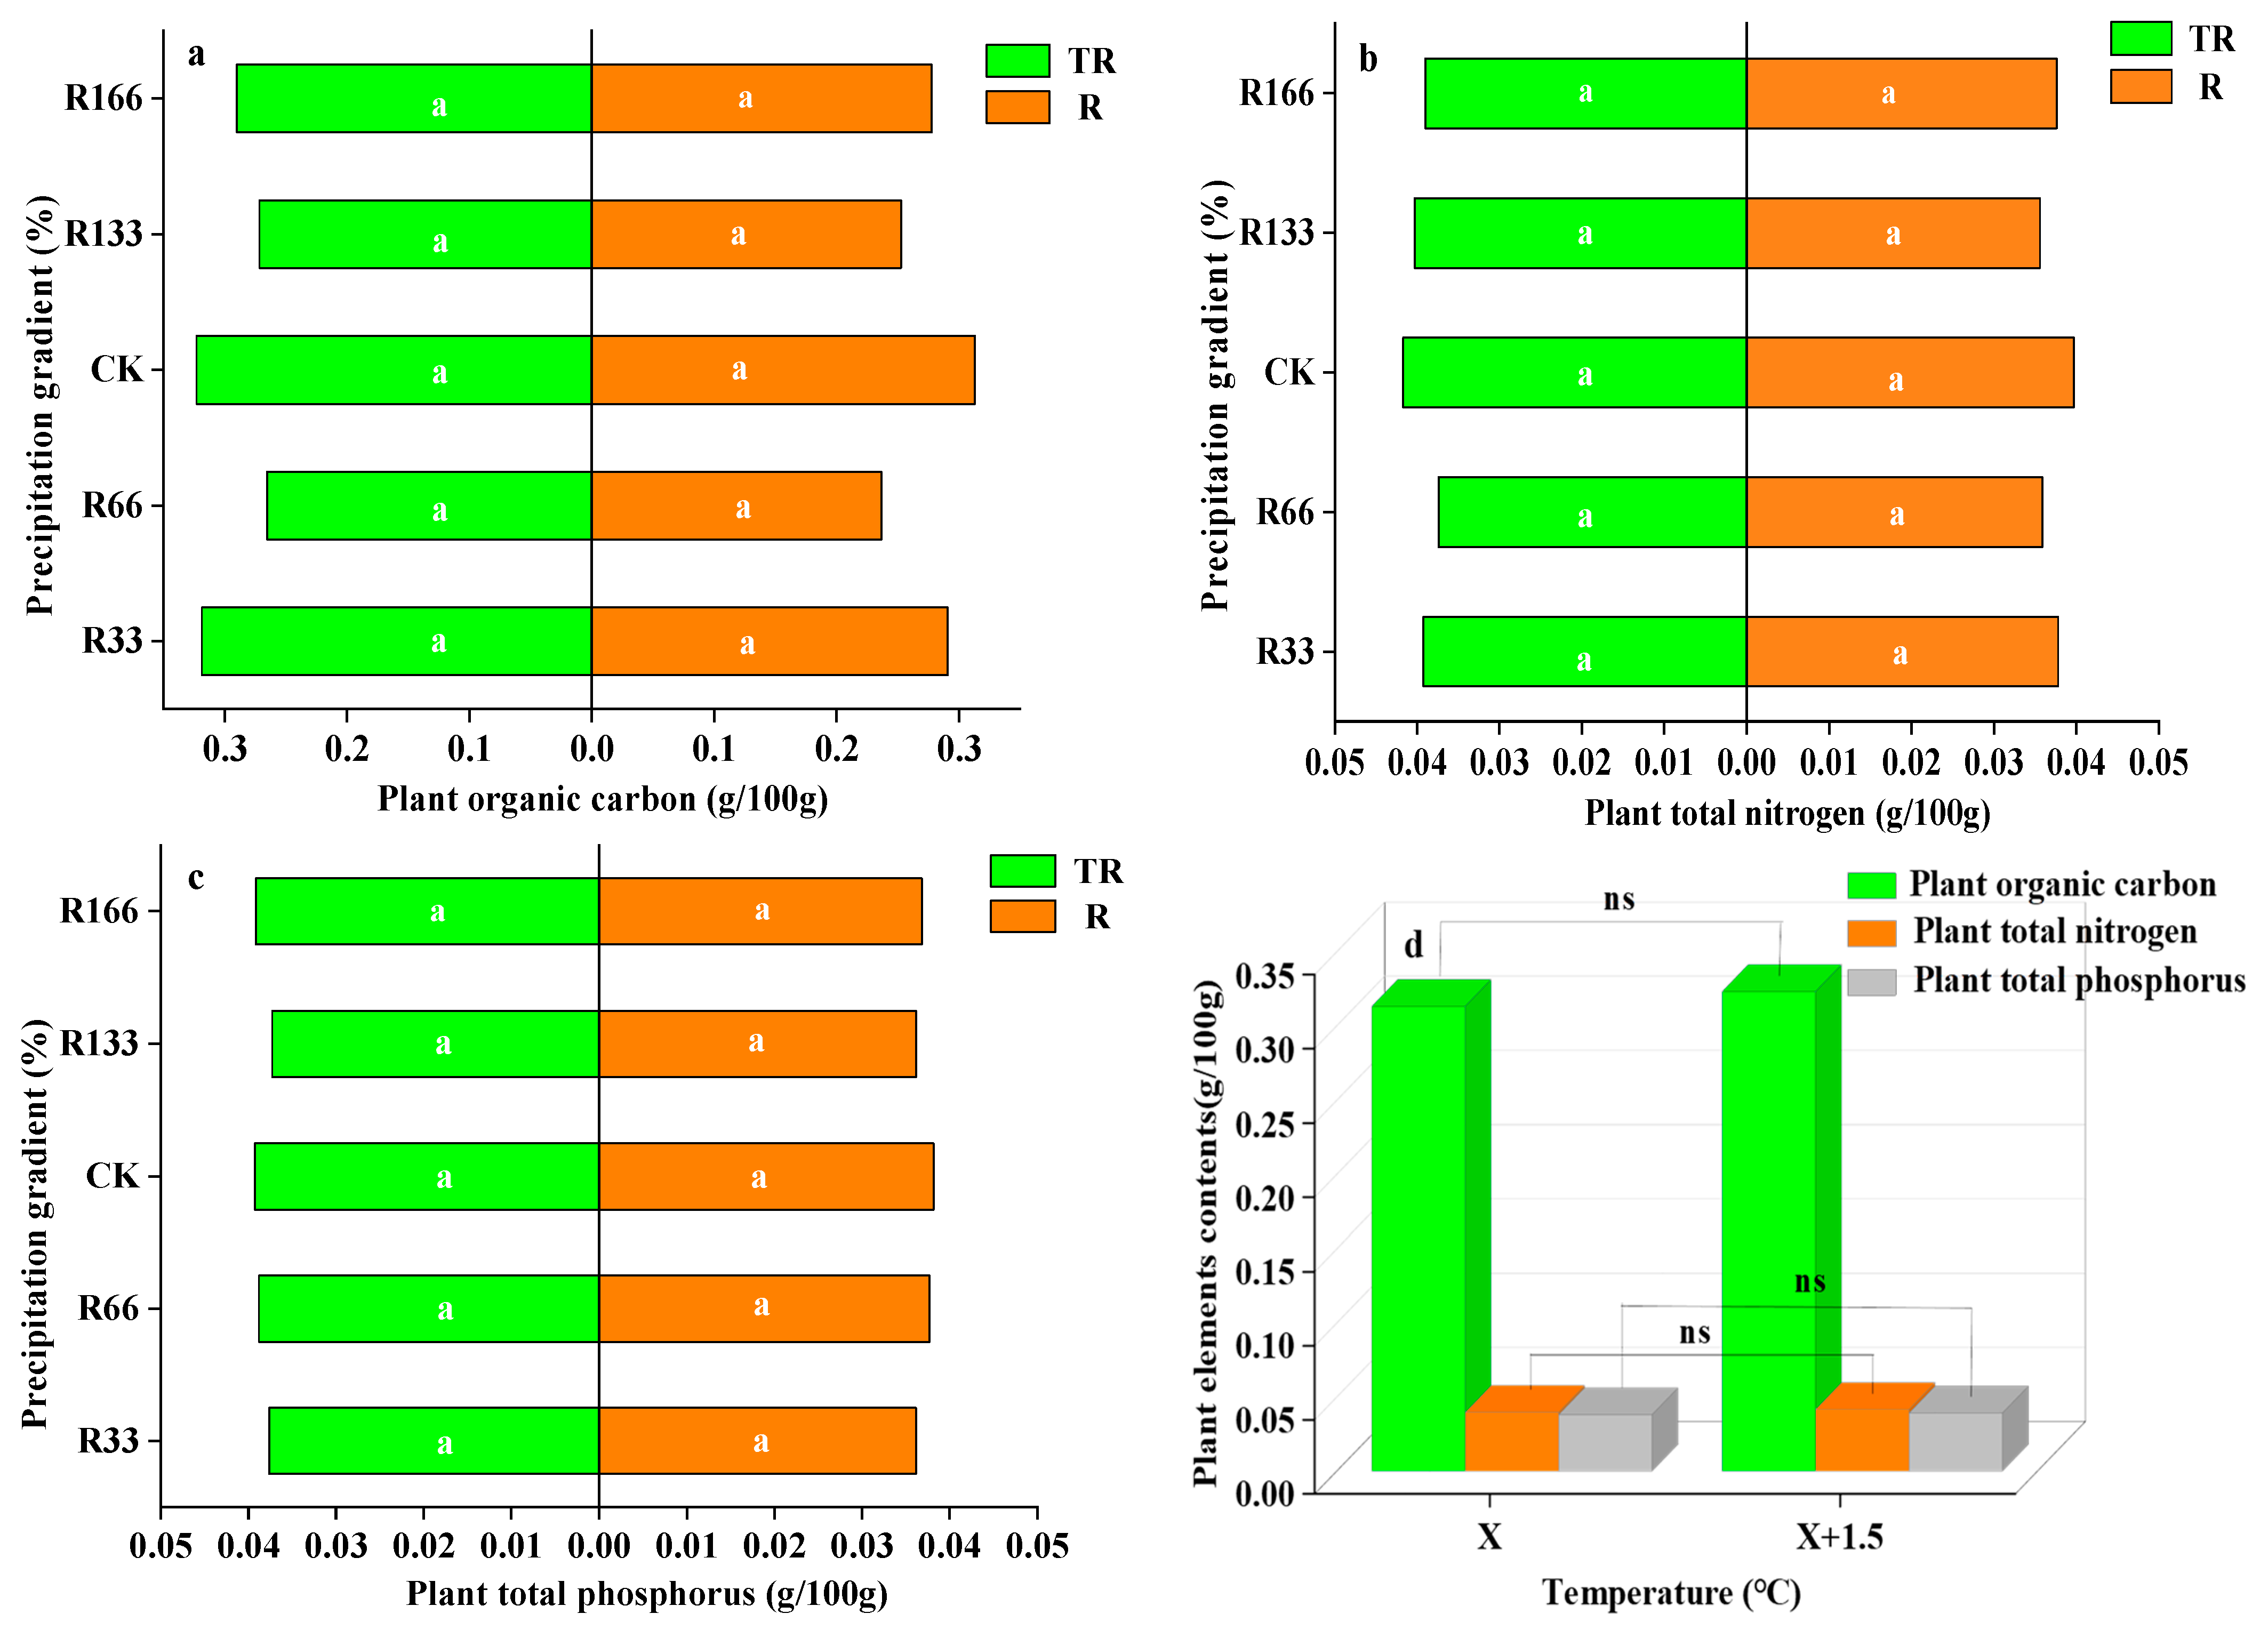
Percentages of plant organic carbon, plant total nitrogen, and total phosphorus of vegetation in the study sites. (a) Plant organic carbon under precipitation changing (R) and the interaction of the precipitation changing and temperature increasing (TR); (b) Plant total nitrogen under precipitation changing (R) and the interaction of the precipitation changing and temperature increasing (TR); (c) Plant total phosphorus under precipitation changing (R) and the interaction of the precipitation changing and temperature increasing(TR); (d) Plant organic carbon, plant total nitrogen, plant total phosphorus under temperature increasing (T). Five levels of rainfall (R) were used: 33% (R33), 66% (R66), 100% (CK), 133% (R133), and 166% (R166) of the annual average. The first two rainfall conditions were obtained by using two rainout shelters with two manipulated rainfall doses: 97 mm (R33) and 194 mm (R66). For the three other rainfall conditions, we artificially increased rainfall in unsheltered plots using a watering pot: 295 mm (CK), 392 mm (R133), and 490 mm (R166). The temperature consisted of two levels: the actual temperature (CK) and the interaction between rainfall and the temperature, which was increased by about 2 °C (T) with the OTC (Open-Top Chamber) in each plot. TR33 is the first site of interaction between 33% precipitation (R33) and the temperature increase of about 2 °C (T), and the marks of TR66, TCK, TR133, TR166 were the same. R33 was the first site of 33% precipitation, and the marks of R66, CK, R133, R166 were the same. Values indicate the mean ± SE, and different letters represent a significant difference according to LSD test (p < 0.05). ns represents a nonsignificant difference according to t-test.
Figure 5.
Percentages of plant organic carbon, plant total nitrogen, and total phosphorus of vegetation in the study sites. (a) Plant organic carbon under precipitation changing (R) and the interaction of the precipitation changing and temperature increasing (TR); (b) Plant total nitrogen under precipitation changing (R) and the interaction of the precipitation changing and temperature increasing (TR); (c) Plant total phosphorus under precipitation changing (R) and the interaction of the precipitation changing and temperature increasing(TR); (d) Plant organic carbon, plant total nitrogen, plant total phosphorus under temperature increasing (T). Five levels of rainfall (R) were used: 33% (R33), 66% (R66), 100% (CK), 133% (R133), and 166% (R166) of the annual average. The first two rainfall conditions were obtained by using two rainout shelters with two manipulated rainfall doses: 97 mm (R33) and 194 mm (R66). For the three other rainfall conditions, we artificially increased rainfall in unsheltered plots using a watering pot: 295 mm (CK), 392 mm (R133), and 490 mm (R166). The temperature consisted of two levels: the actual temperature (CK) and the interaction between rainfall and the temperature, which was increased by about 2 °C (T) with the OTC (Open-Top Chamber) in each plot. TR33 is the first site of interaction between 33% precipitation (R33) and the temperature increase of about 2 °C (T), and the marks of TR66, TCK, TR133, TR166 were the same. R33 was the first site of 33% precipitation, and the marks of R66, CK, R133, R166 were the same. Values indicate the mean ± SE, and different letters represent a significant difference according to LSD test (p < 0.05). ns represents a nonsignificant difference according to t-test.
![Plants 10 02580 g005]()
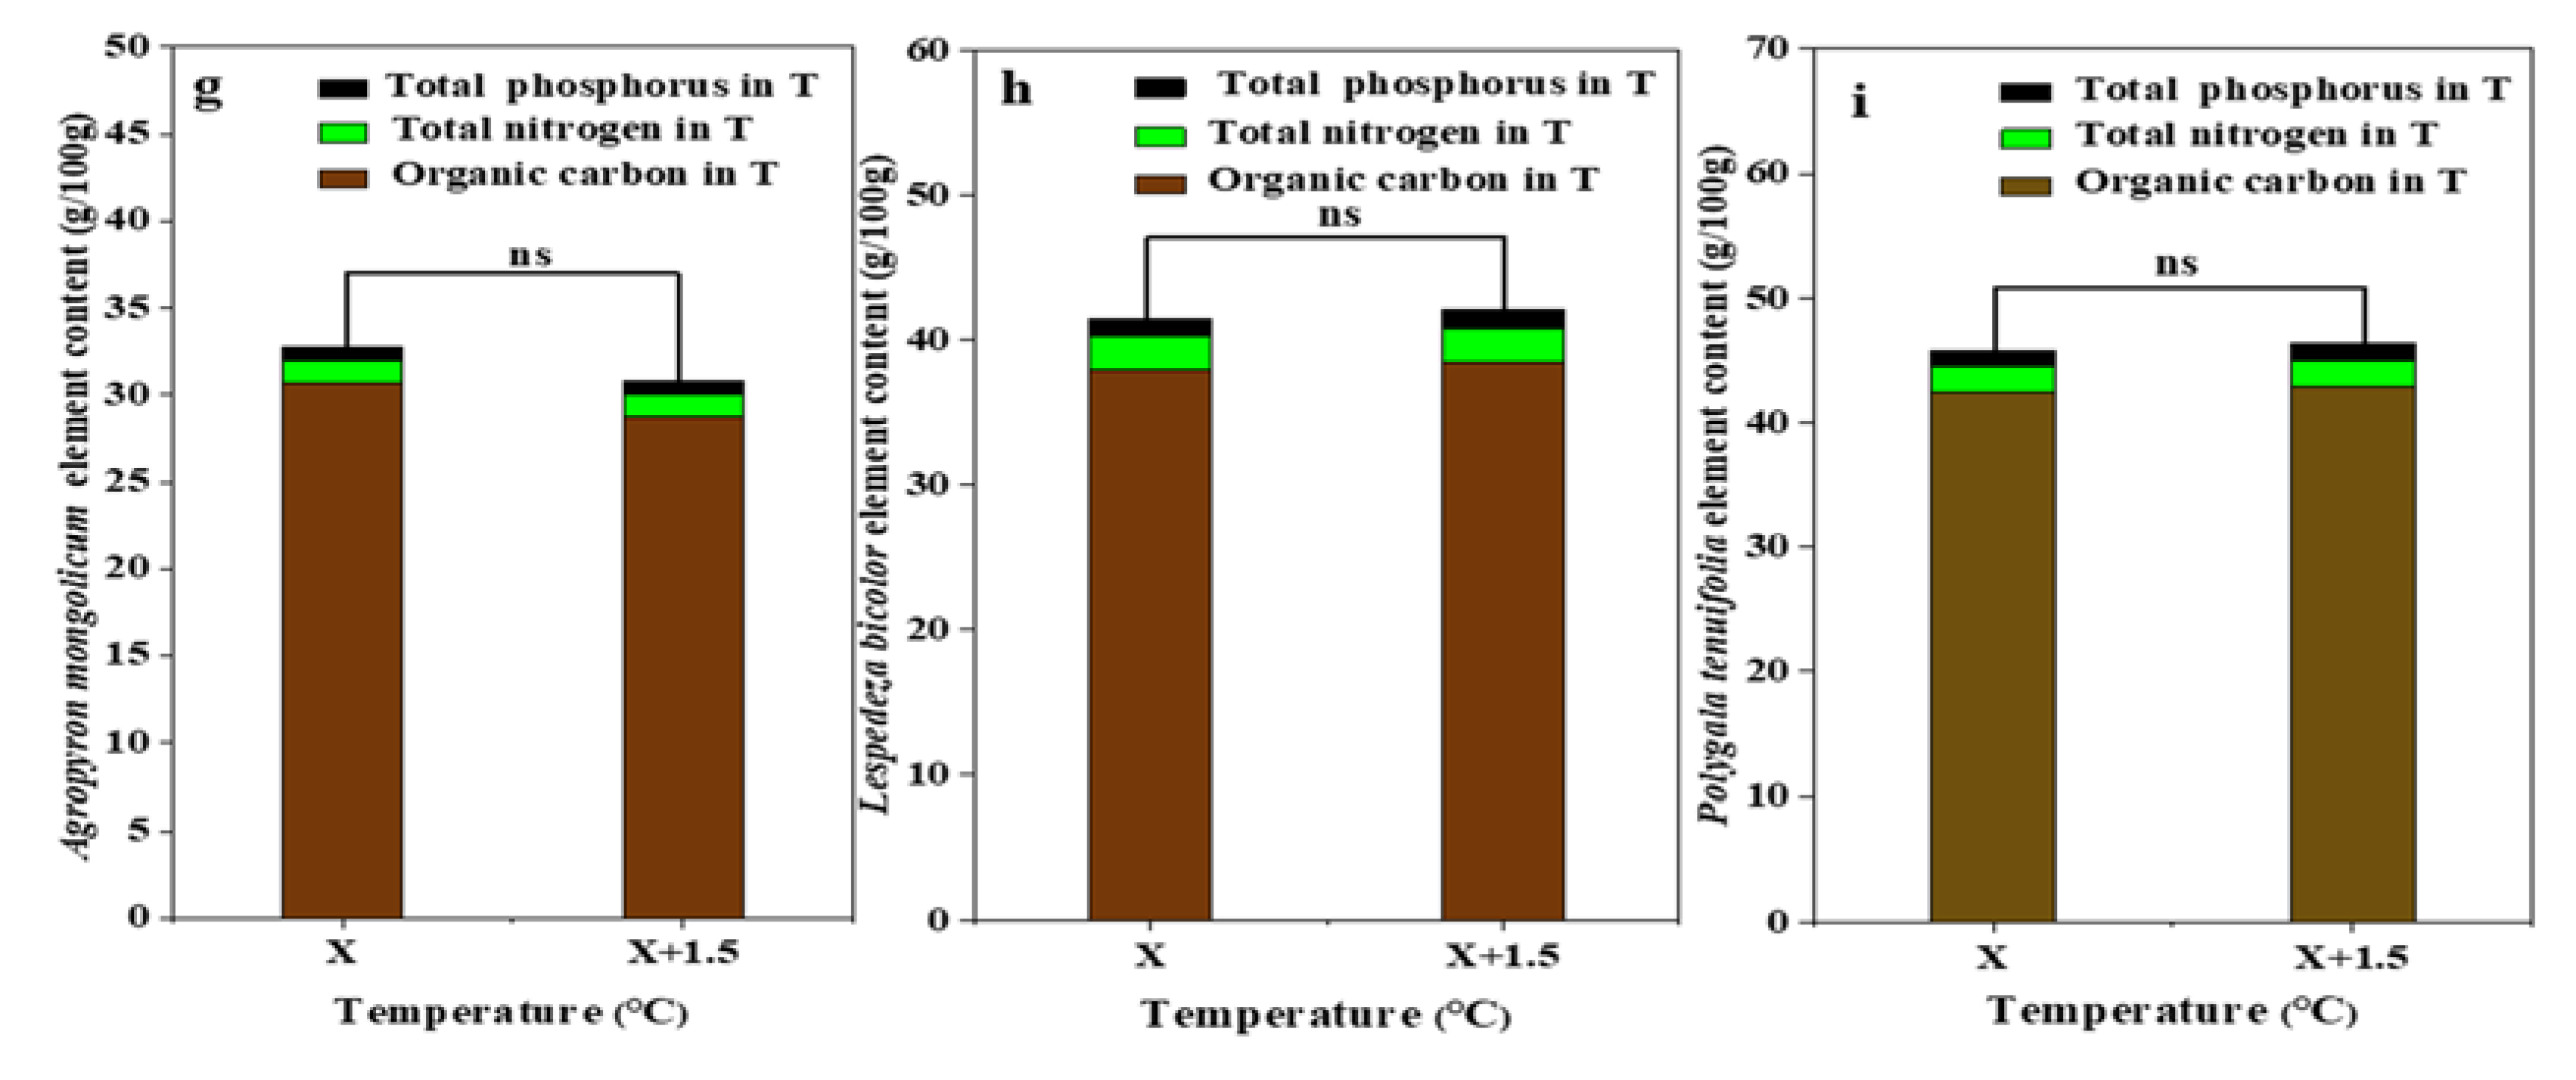
Figure 6.
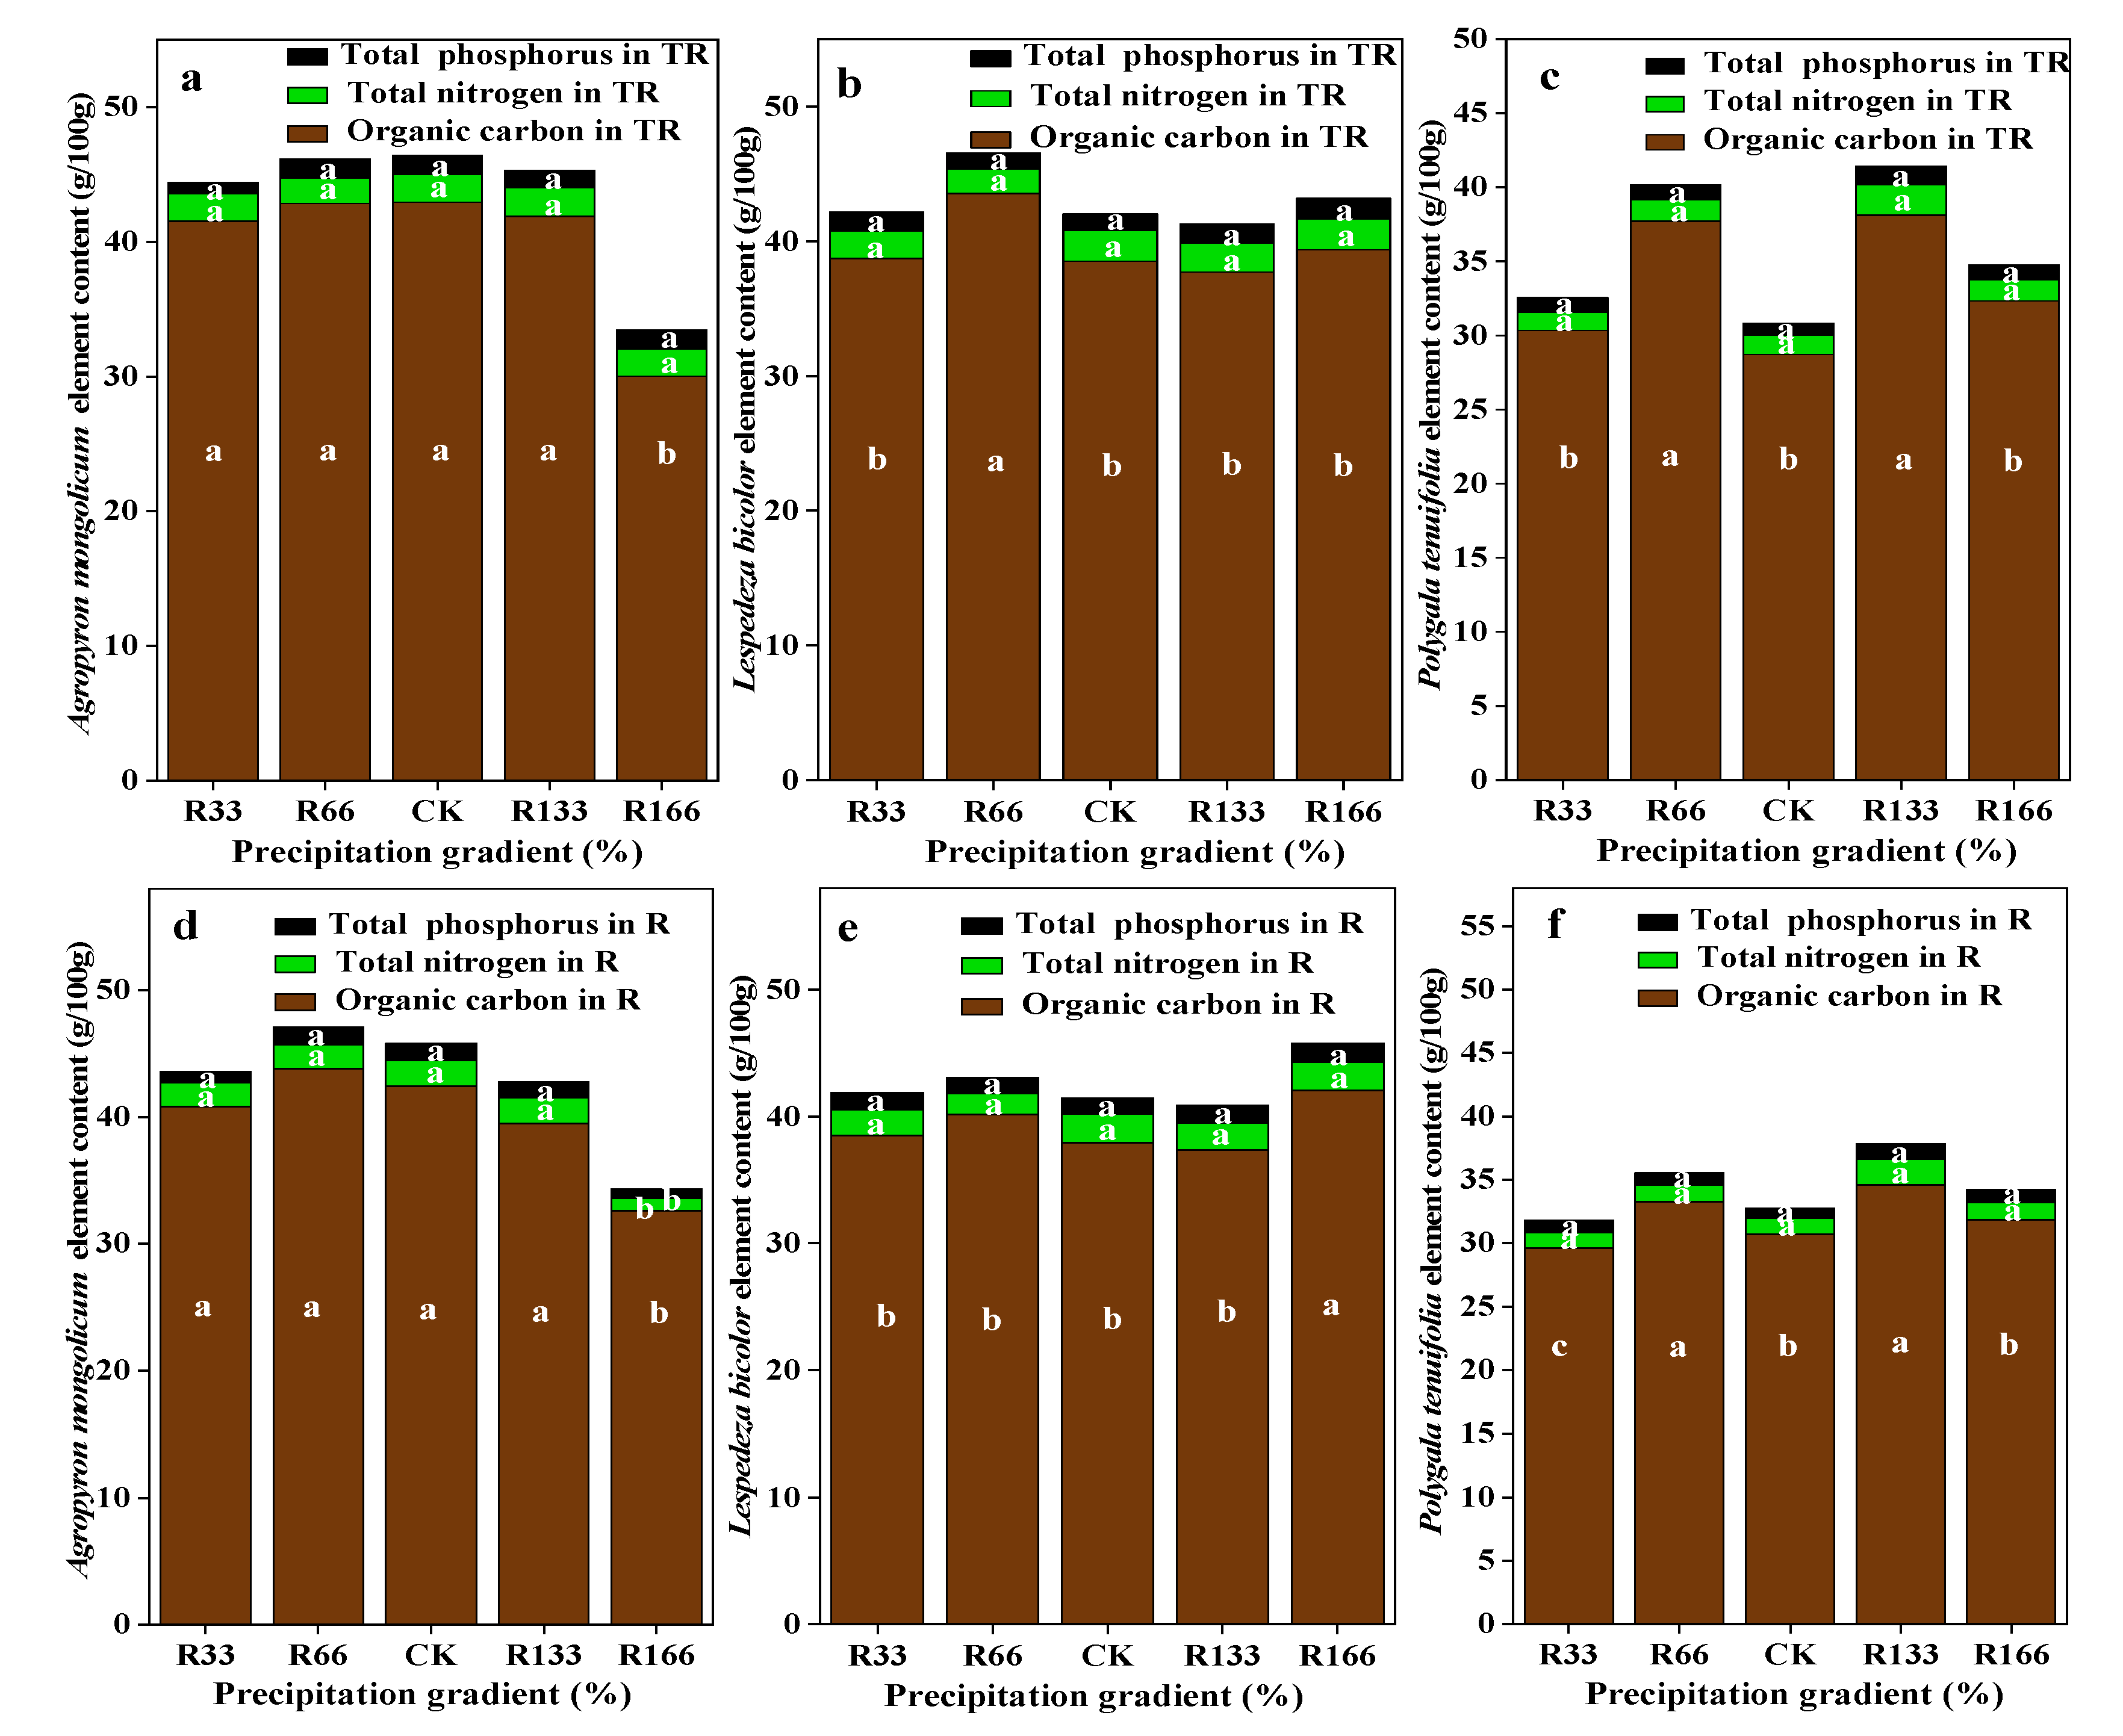
Percentage of plant organic carbon, plant total nitrogen, and total phosphorus of dominant species in the study sites. (a) The organic carbon, total nitrogen, total phosphorus of Agropyron mongolicum under the interaction of the precipitation changing and temperature increasing (TR); (b) The organic carbon, total nitrogen, total phosphorus of Lespedeza bicolor under the interaction of the precipitation changing and temperature increasing(TR); (c) The organic carbon, total nitrogen, total phosphorus of Polygala tenuifolia under the interaction of the precipitation changing and temperature increasing(TR); (d) The organic carbon, total nitrogen, total phosphorus of Agropyron mongolicum under the precipitation changing (R); (e) The organic carbon, total nitrogen, total phosphorus of Lespedeza bicolor under the precipitation changing (R); (f) The organic carbon, total nitrogen, total phosphorus of Polygala tenuifolia under the precipitation changing (R); (g) The organic carbon, total nitrogen, total phosphorus of Agropyron mongolicum under the temperature increasing (T); (h) The organic carbon, total nitrogen, total phosphorus of Lespedeza bicolor under the temperature increasing (T); (i) The organic carbon, total nitrogen, total phosphorus of Polygala tenuifolia under the temperature increasing (T). Five levels of rainfall (R) were used: 33% (R33), 66% (R66), 100% (CK), 133% (R133), and 166% (R166) of the annual average. The first two rainfall conditions were obtained by using two rainout shelters with two manipulated rainfall doses: 97 mm (R33) and 194 mm (R66). For the three other rainfall conditions, we artificially increased rainfall in unsheltered plots using a watering pot: 295 mm (CK), 392 mm (R133), and 490 mm (R166). The temperature consisted of two levels: the actual temperature (CK) and the interaction between rainfall and the temperature, which was increased by about 2 °C (T) with the OTC (Open-Top Chamber) in each plot. TR33 was the first site of interaction between 33% precipitation (R33) and the temperature increase of about 2 °C (T), and the marks of TR66, TCK, TR133, TR166 are the same. R33 was the first site of 33% precipitation, and the marks of R66, CK, R133, R166 are the same. Values indicate the mean ± SE, and different letters represent a significant difference according to LSD test (p < 0.05).
Figure 6.
Percentage of plant organic carbon, plant total nitrogen, and total phosphorus of dominant species in the study sites. (a) The organic carbon, total nitrogen, total phosphorus of Agropyron mongolicum under the interaction of the precipitation changing and temperature increasing (TR); (b) The organic carbon, total nitrogen, total phosphorus of Lespedeza bicolor under the interaction of the precipitation changing and temperature increasing(TR); (c) The organic carbon, total nitrogen, total phosphorus of Polygala tenuifolia under the interaction of the precipitation changing and temperature increasing(TR); (d) The organic carbon, total nitrogen, total phosphorus of Agropyron mongolicum under the precipitation changing (R); (e) The organic carbon, total nitrogen, total phosphorus of Lespedeza bicolor under the precipitation changing (R); (f) The organic carbon, total nitrogen, total phosphorus of Polygala tenuifolia under the precipitation changing (R); (g) The organic carbon, total nitrogen, total phosphorus of Agropyron mongolicum under the temperature increasing (T); (h) The organic carbon, total nitrogen, total phosphorus of Lespedeza bicolor under the temperature increasing (T); (i) The organic carbon, total nitrogen, total phosphorus of Polygala tenuifolia under the temperature increasing (T). Five levels of rainfall (R) were used: 33% (R33), 66% (R66), 100% (CK), 133% (R133), and 166% (R166) of the annual average. The first two rainfall conditions were obtained by using two rainout shelters with two manipulated rainfall doses: 97 mm (R33) and 194 mm (R66). For the three other rainfall conditions, we artificially increased rainfall in unsheltered plots using a watering pot: 295 mm (CK), 392 mm (R133), and 490 mm (R166). The temperature consisted of two levels: the actual temperature (CK) and the interaction between rainfall and the temperature, which was increased by about 2 °C (T) with the OTC (Open-Top Chamber) in each plot. TR33 was the first site of interaction between 33% precipitation (R33) and the temperature increase of about 2 °C (T), and the marks of TR66, TCK, TR133, TR166 are the same. R33 was the first site of 33% precipitation, and the marks of R66, CK, R133, R166 are the same. Values indicate the mean ± SE, and different letters represent a significant difference according to LSD test (p < 0.05).
![Plants 10 02580 g006a]()
![Plants 10 02580 g006b]()
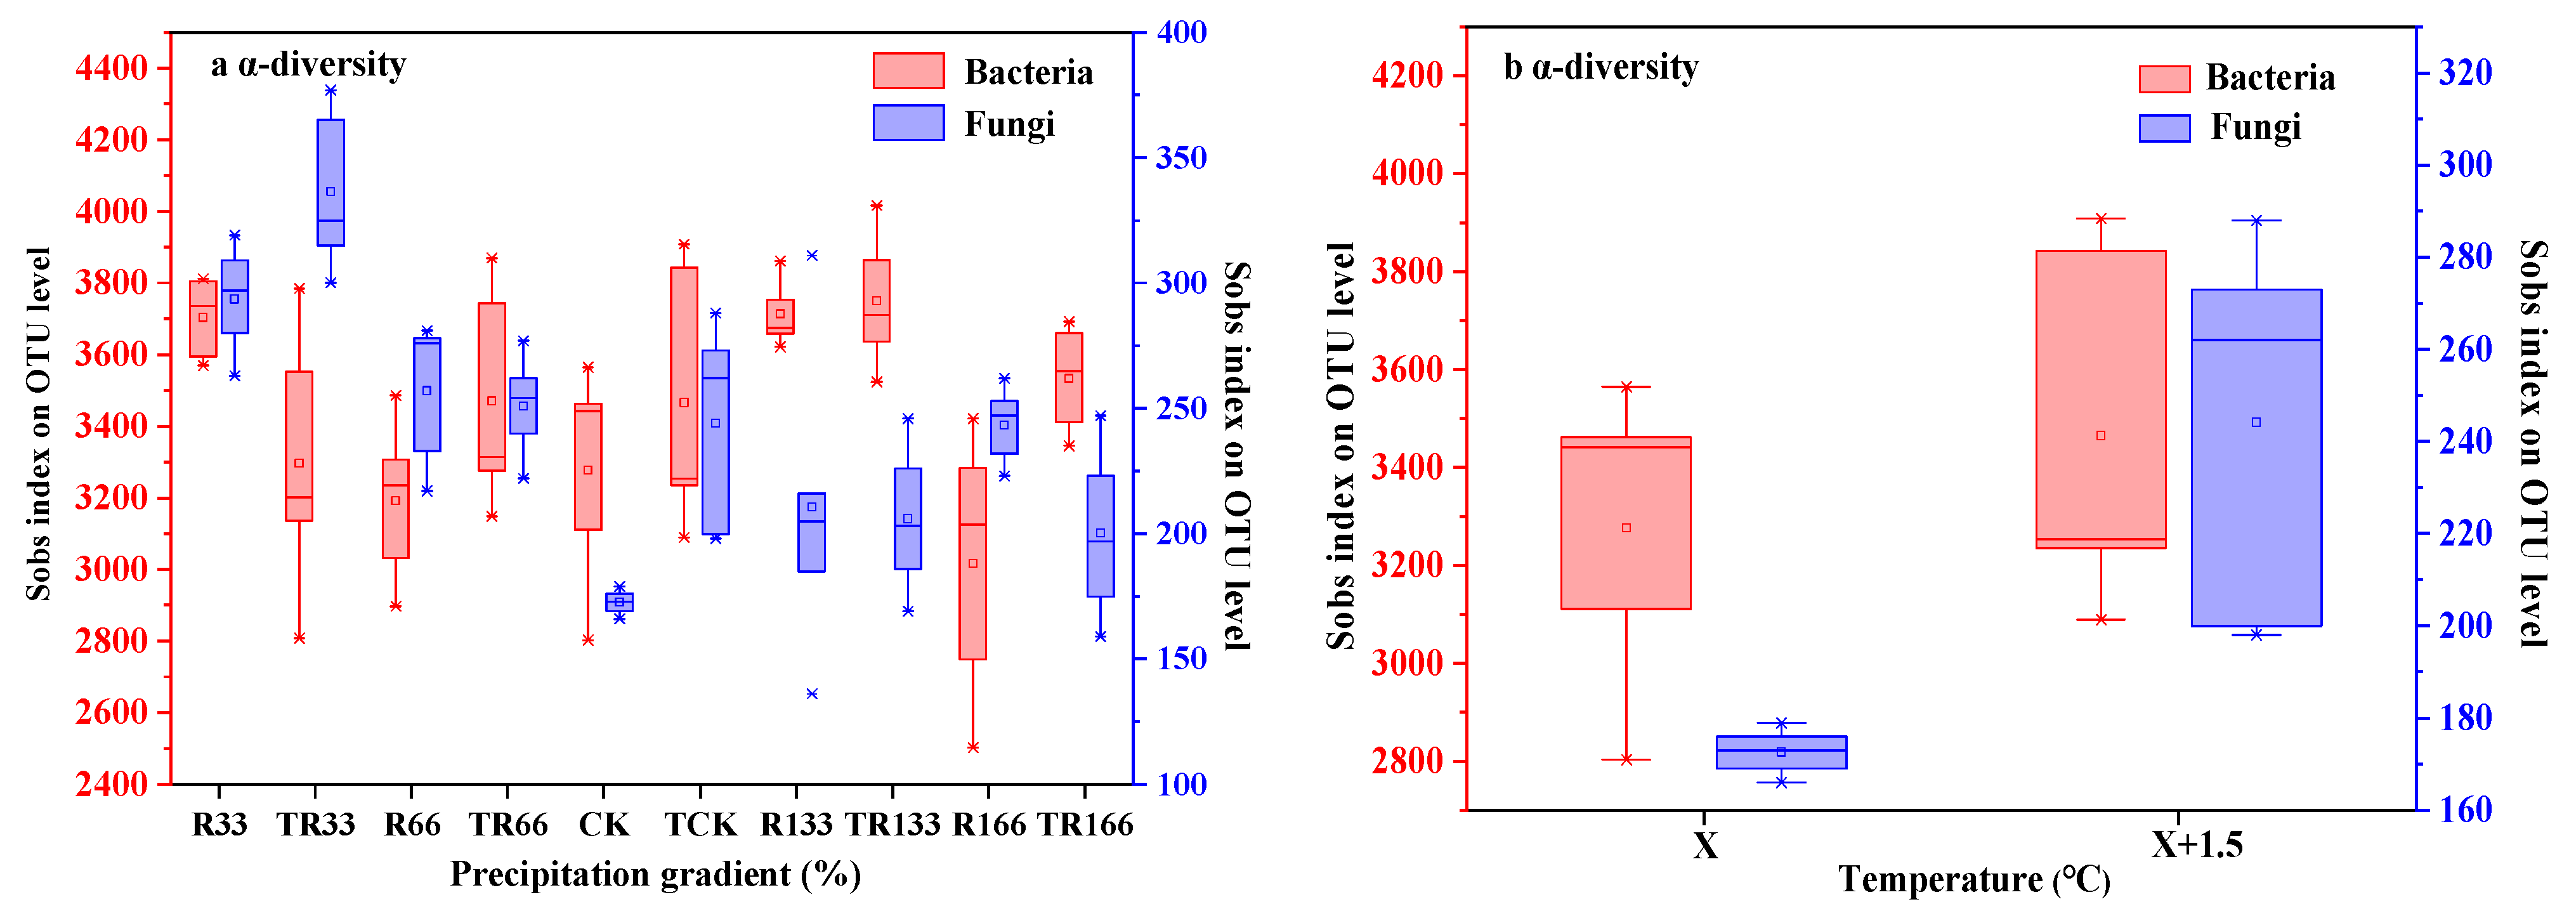
Figure 7.
Soil microbial α-diversity of (a) fungi and (b) bacteria in the study sites by principal component analysis (PCA). Sobs index was the observed richness. Five levels of rainfall (R) were used: 33% (R33), 66% (R66), 100% (CK), 133% (R133), and 166% (R166) of the annual average. The first two rainfall conditions were obtained by using two rainout shelters with two manipulated rainfall doses: 97 mm (R33) and 194 mm (R66). For the three other rainfall conditions, we artificially increased rainfall in unsheltered plots using a watering pot: 295 mm (CK), 392 mm (R133), and 490 mm (R166). The temperature consisted of two levels: the actual temperature (CK) and the interaction between rainfall and the temperature, which was increased by about 2 °C (T) with the OTC (Open-Top Chamber) in each plot. TR33 was the first site of interaction between 33% precipitation (R33) and the temperature increase of about 2 °C (T), and the marks of TR66, TCK, TR133, TR166 were the same. R33 was the first site of 33% precipitation, and the marks of R66, CK, R133, R166 were the same.
![Plants 10 02580 g007]()
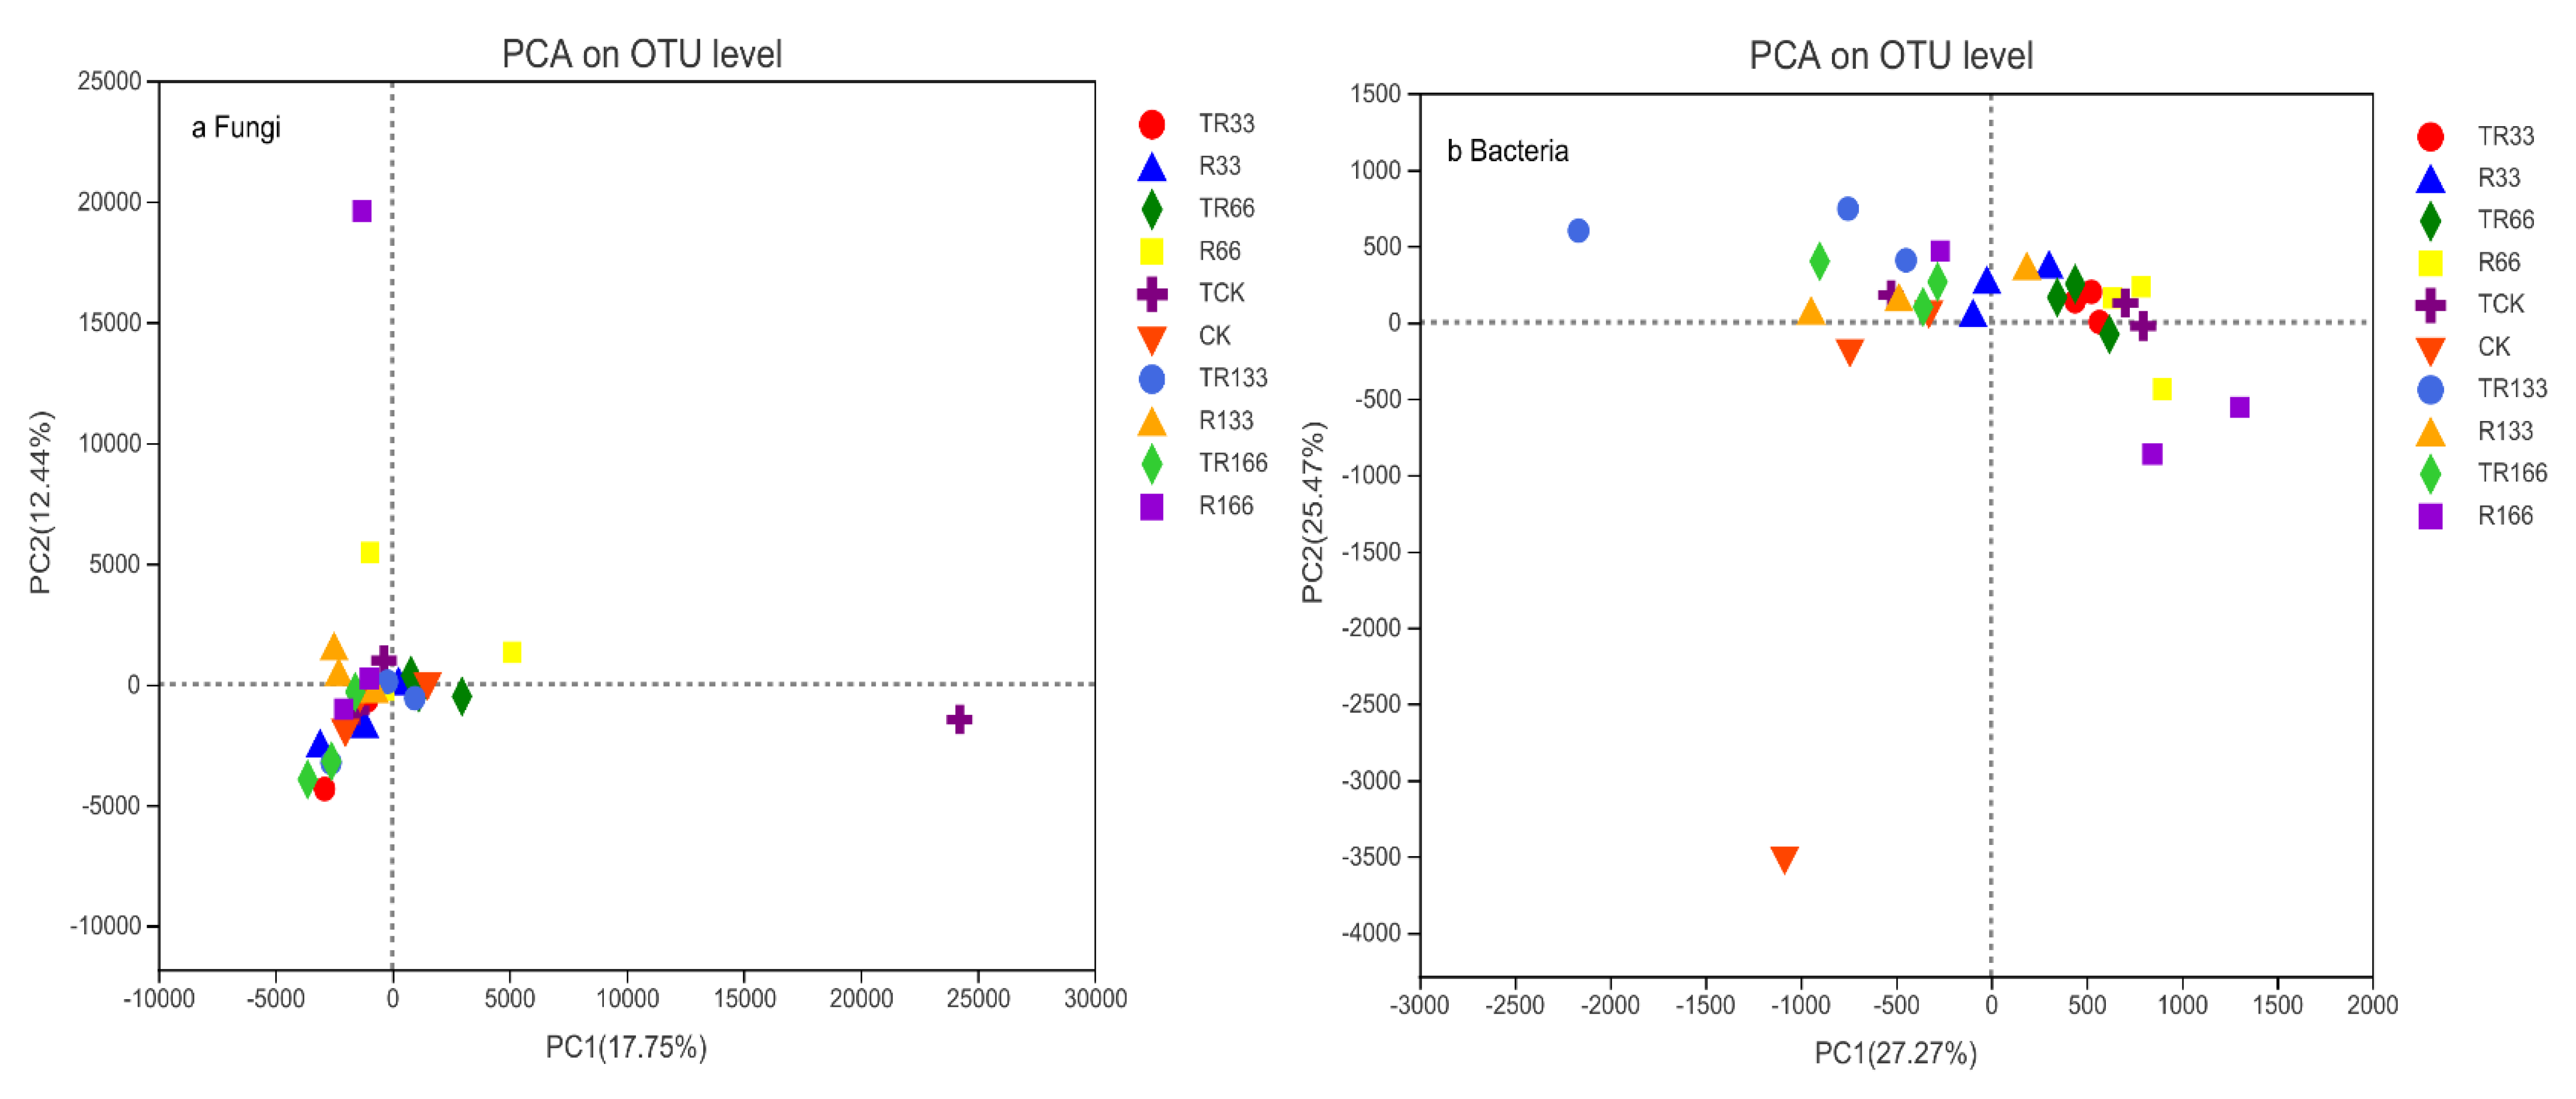
Figure 8.
Soil microorganism β-diversity of (a) fungi and (b) bacteria in the study sites by principal component analysis (PCA). Five levels of rainfall (R) were used: 33% (R33), 66% (R66), 100% (CK), 133% (R133), and 166% (R166) of the annual average. The first two rainfall conditions were obtained by using two rainout shelters with two manipulated rainfall doses: 97 mm (R33) and 194 mm (R66). For the three other rainfall conditions, we artificially increased rainfall in unsheltered plots using a watering pot: 295 mm (CK), 392 mm (R133), and 490 mm (R166). The temperature consisted of two levels: the actual temperature (CK) and the interaction between rainfall and the temperature, which was increased by about 2 °C (T) with the OTC (Open-Top Chamber) in each plot. TR33 was the first site of interaction between 33% precipitation (R33) and the temperature increase of about 2 °C (T), and the marks of TR66, TCK, TR133, TR166 were the same. R33 was the first site of 33% precipitation, and the marks of R66, CK, R133, R166 were the same.
![Plants 10 02580 g008]()
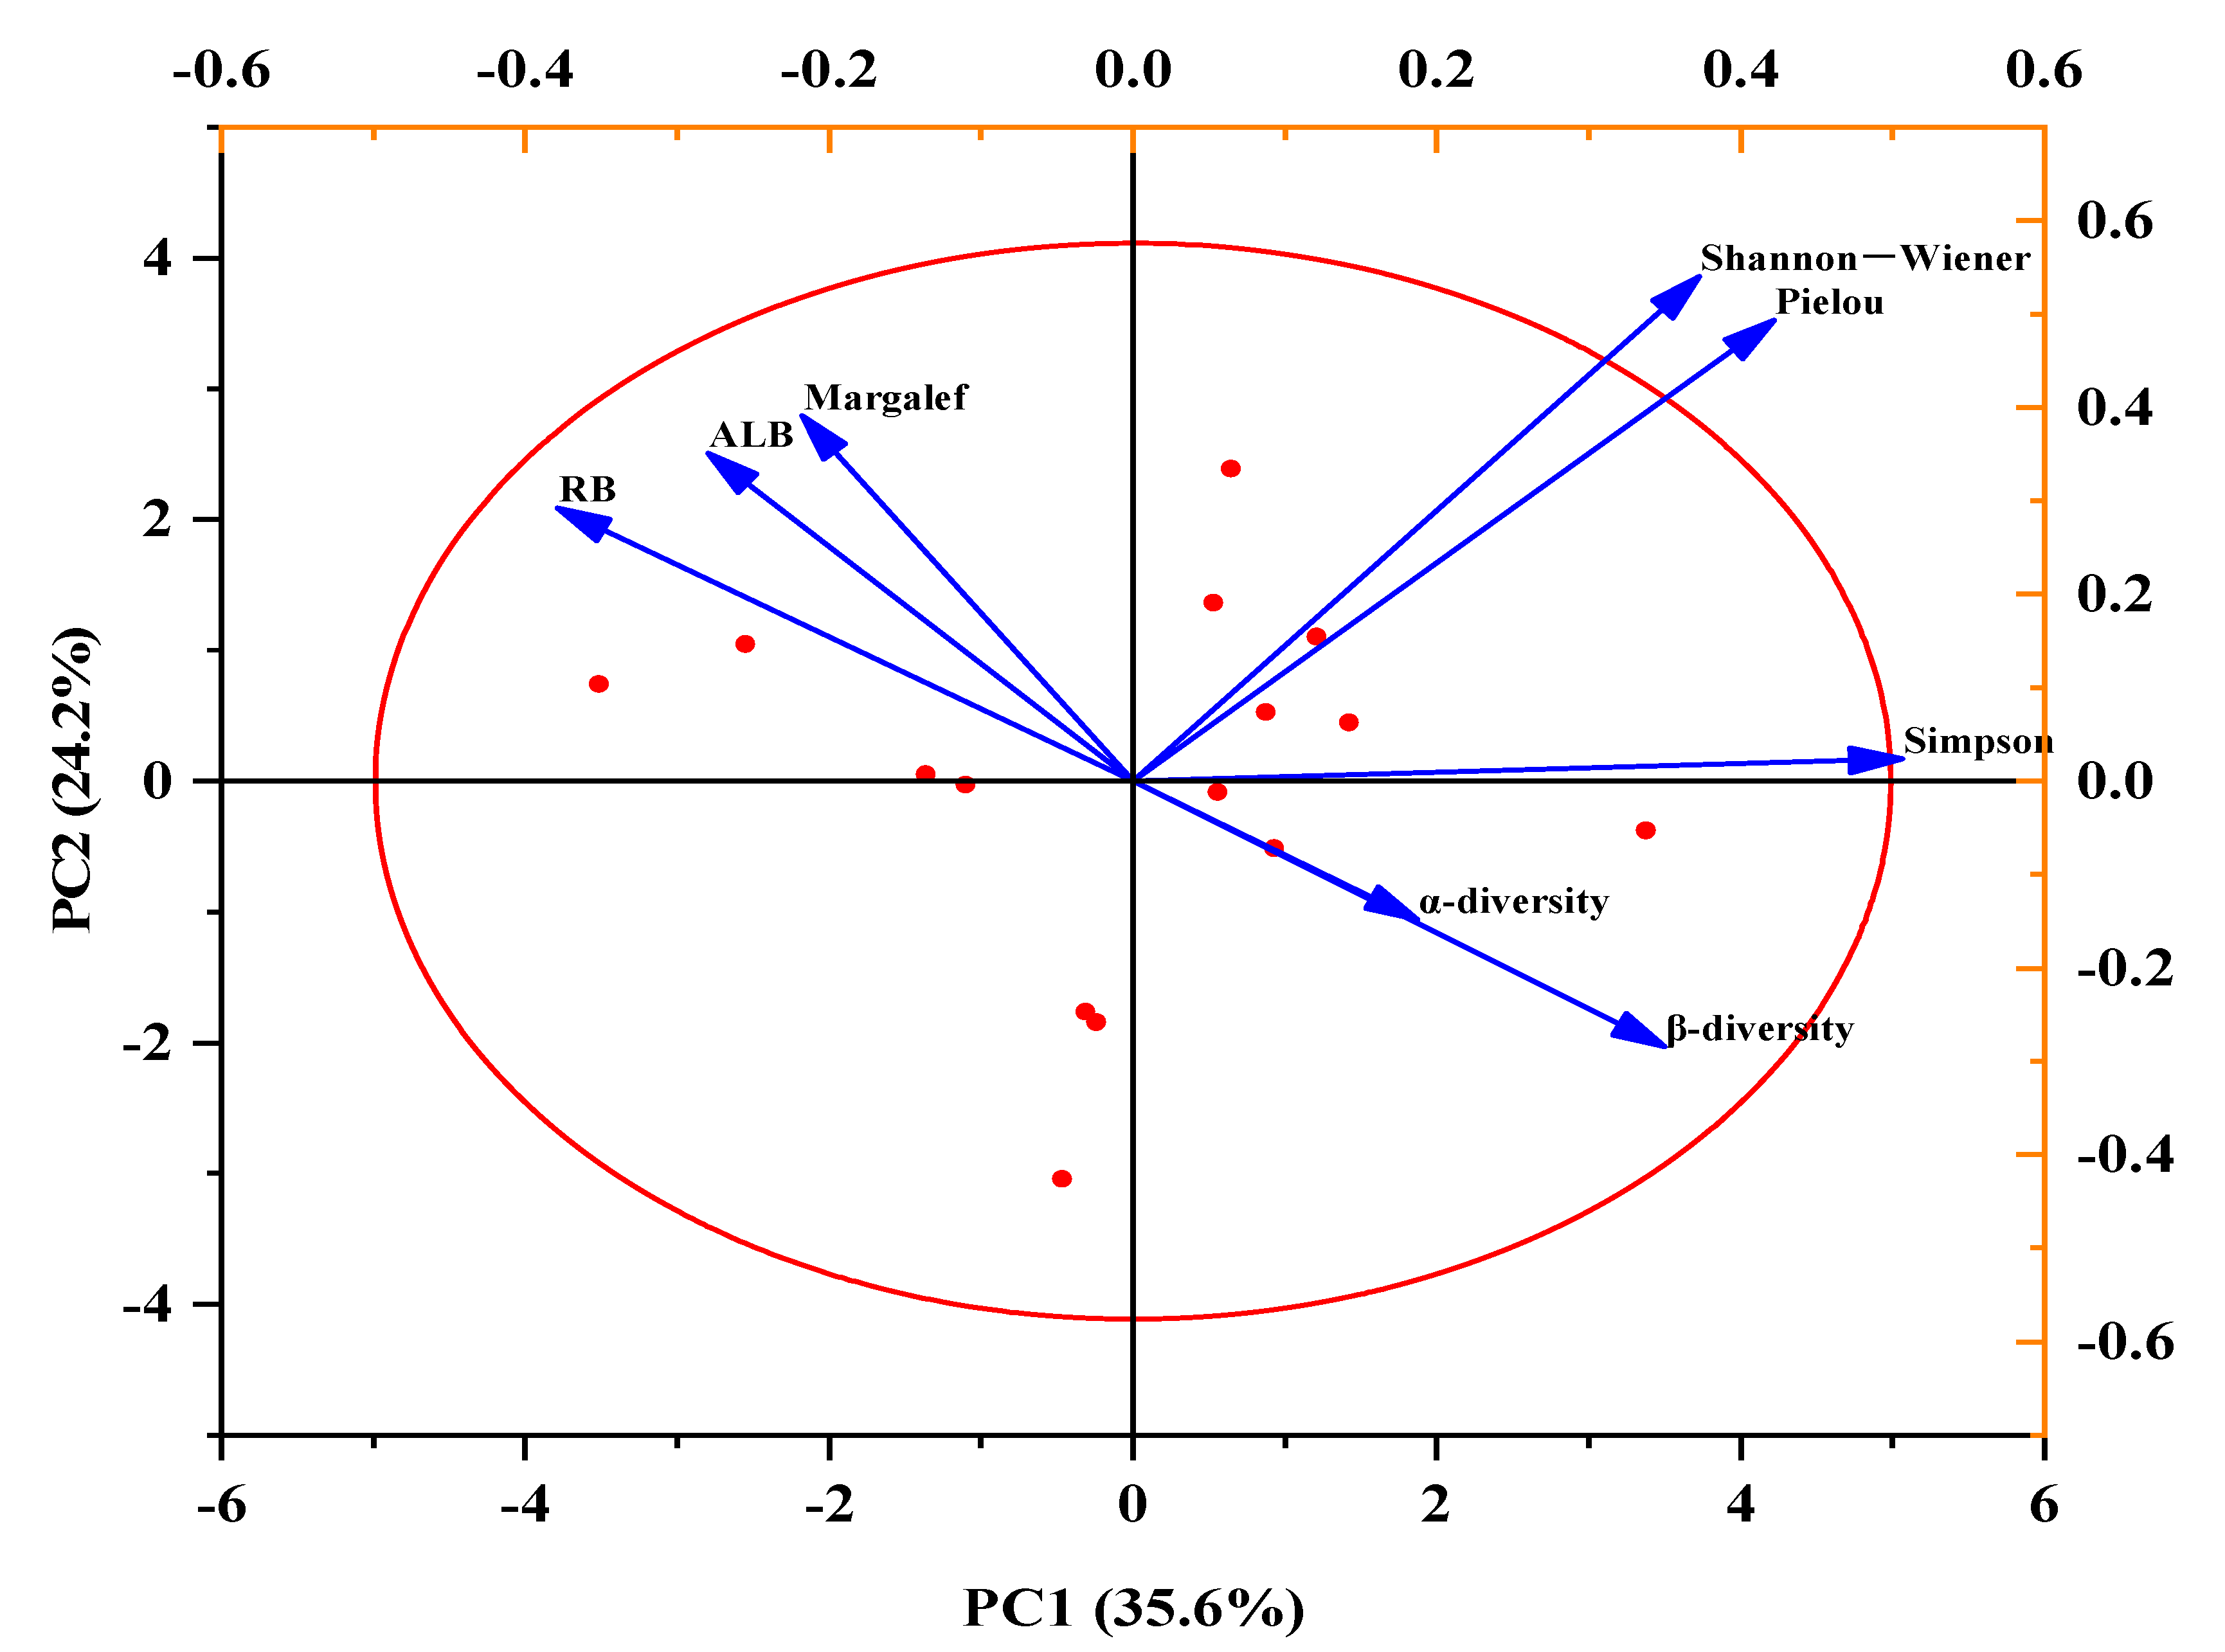
Figure 9.
Principal components analysis (PCA) plots showing the influence of the Shannon–Wiener, Pielou, Margalef, and Simpson indexes, and the above-living biomass (ALB), root biomass (RB), α-diversity, and β-diversity, which represented effects of different temperature (recorded as CK and T) and variation in precipitation (recorded as R33, R66, CK, R133, R166).
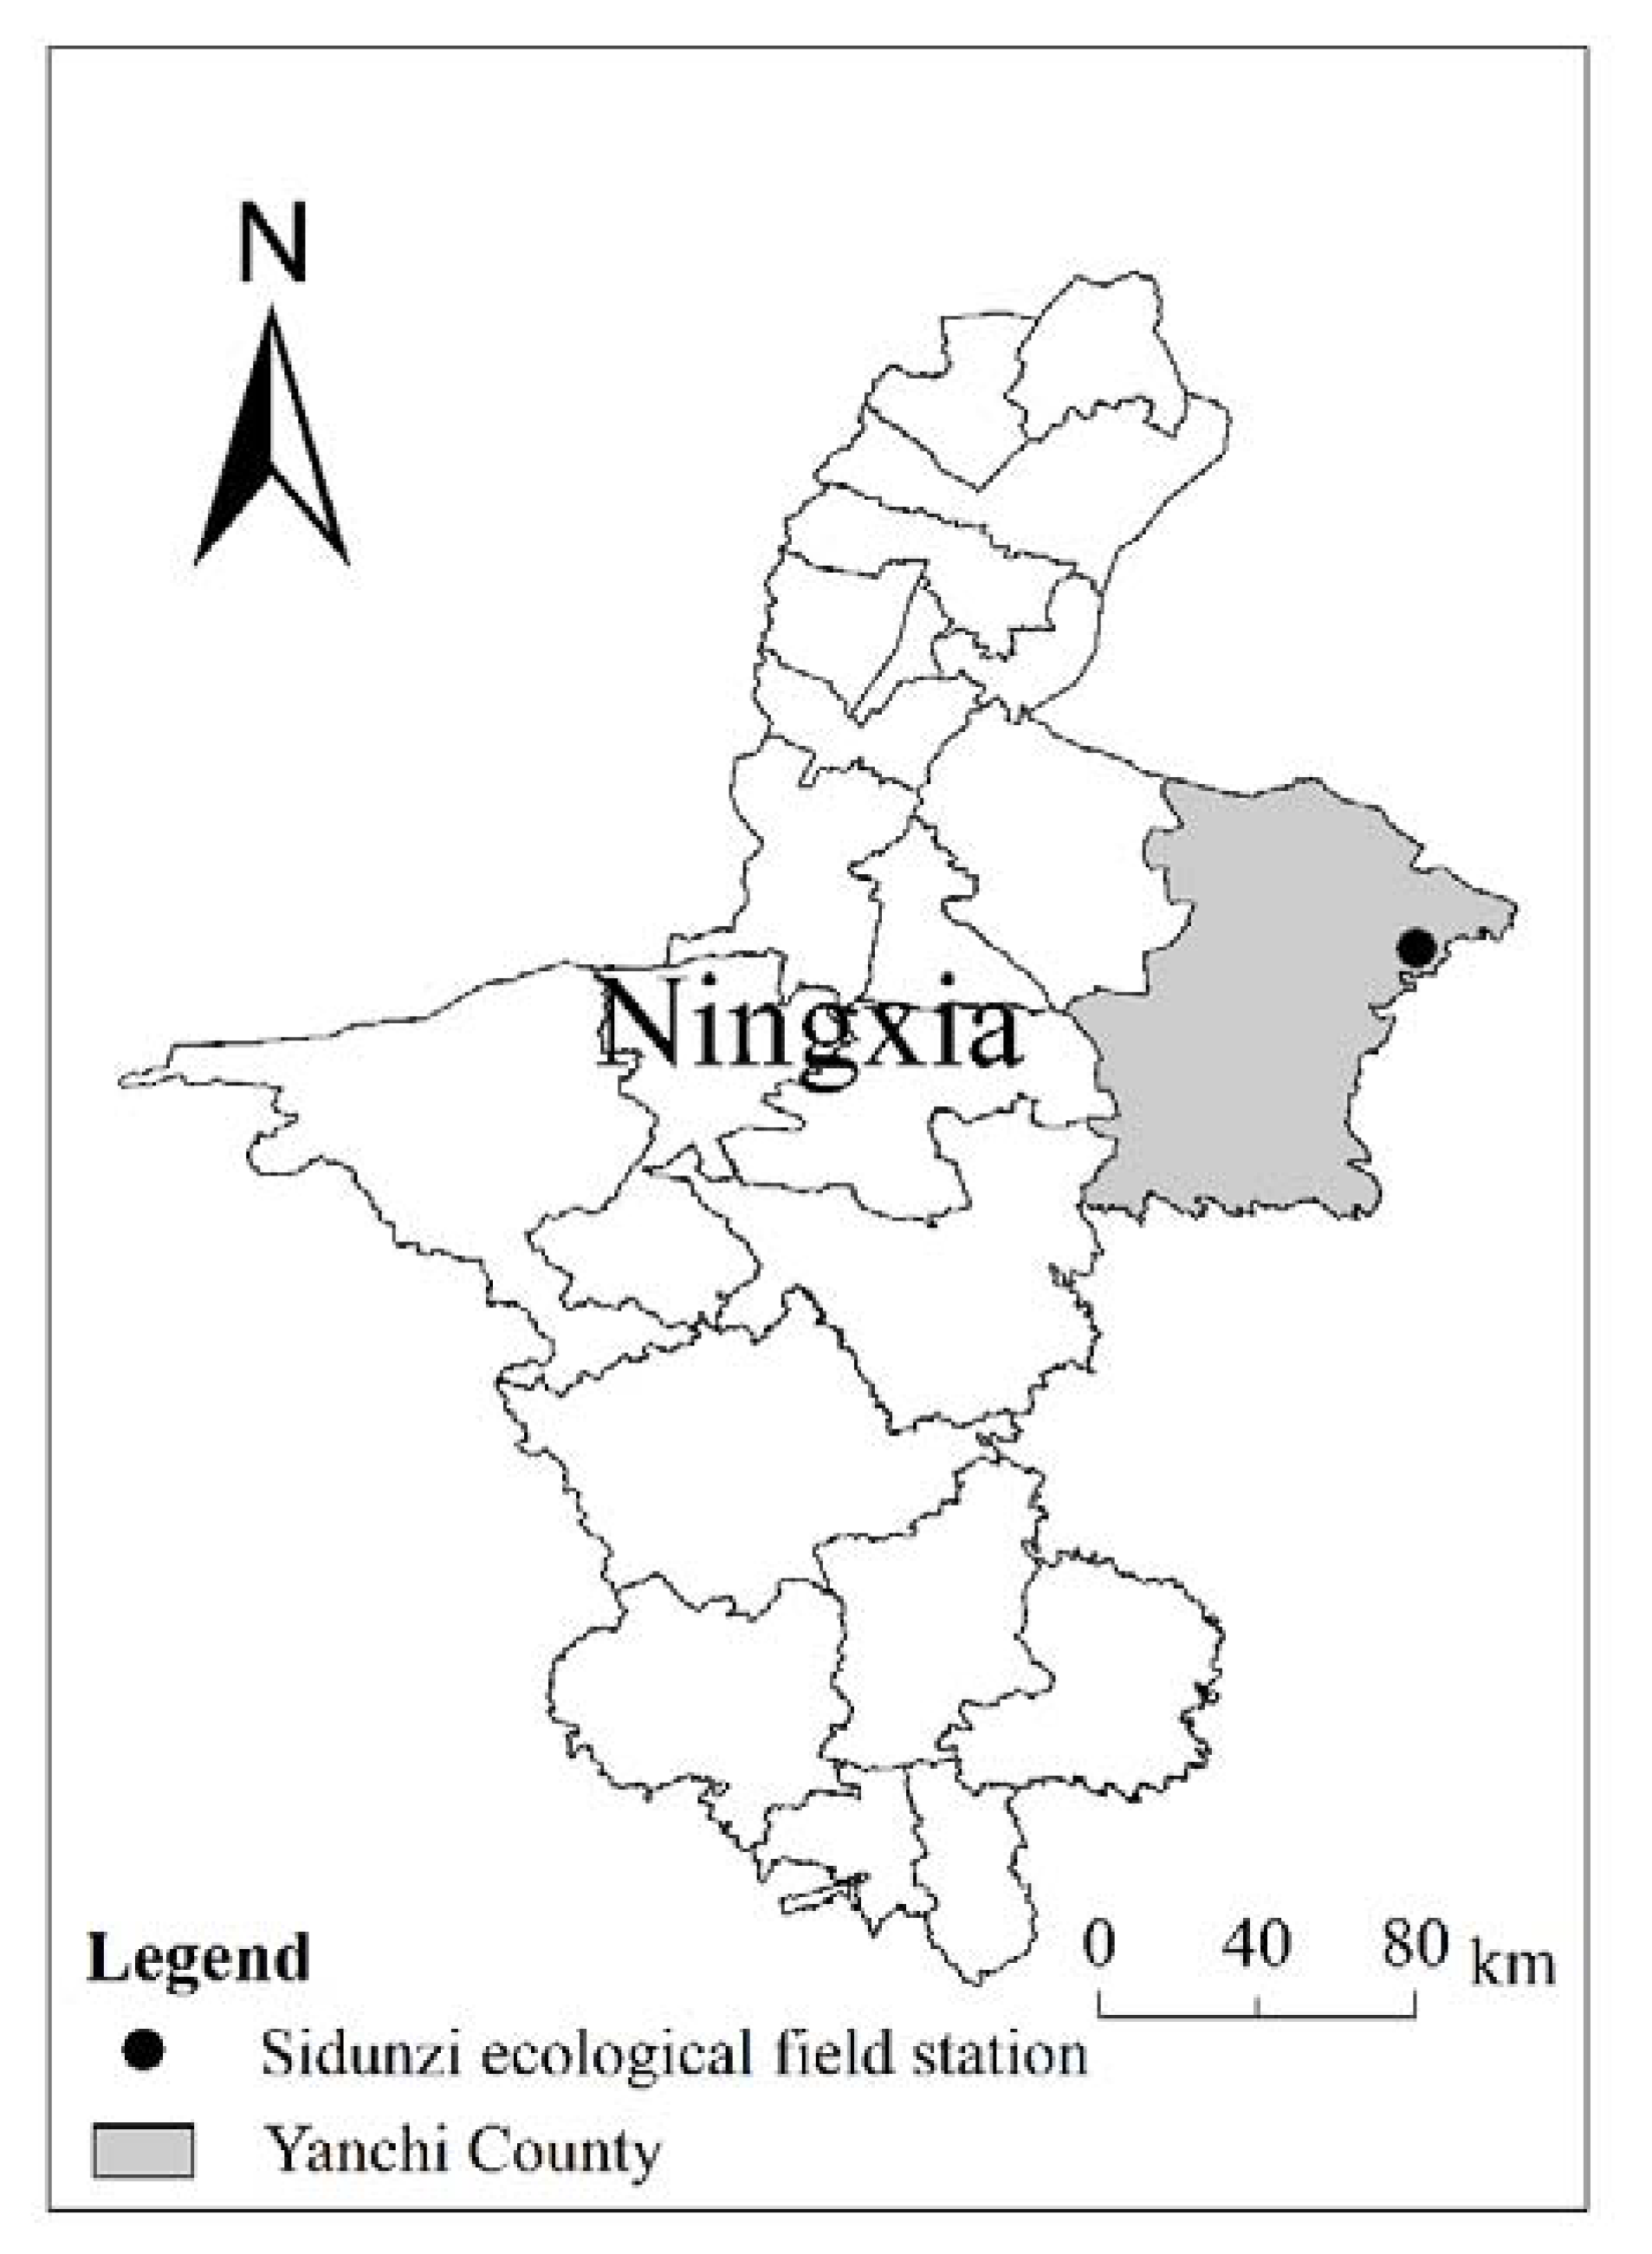
Figure 10.
Location of the Sidunzi Village of Ningxia Observatory on the Loess Plateau.
Figure 10.
Location of the Sidunzi Village of Ningxia Observatory on the Loess Plateau.
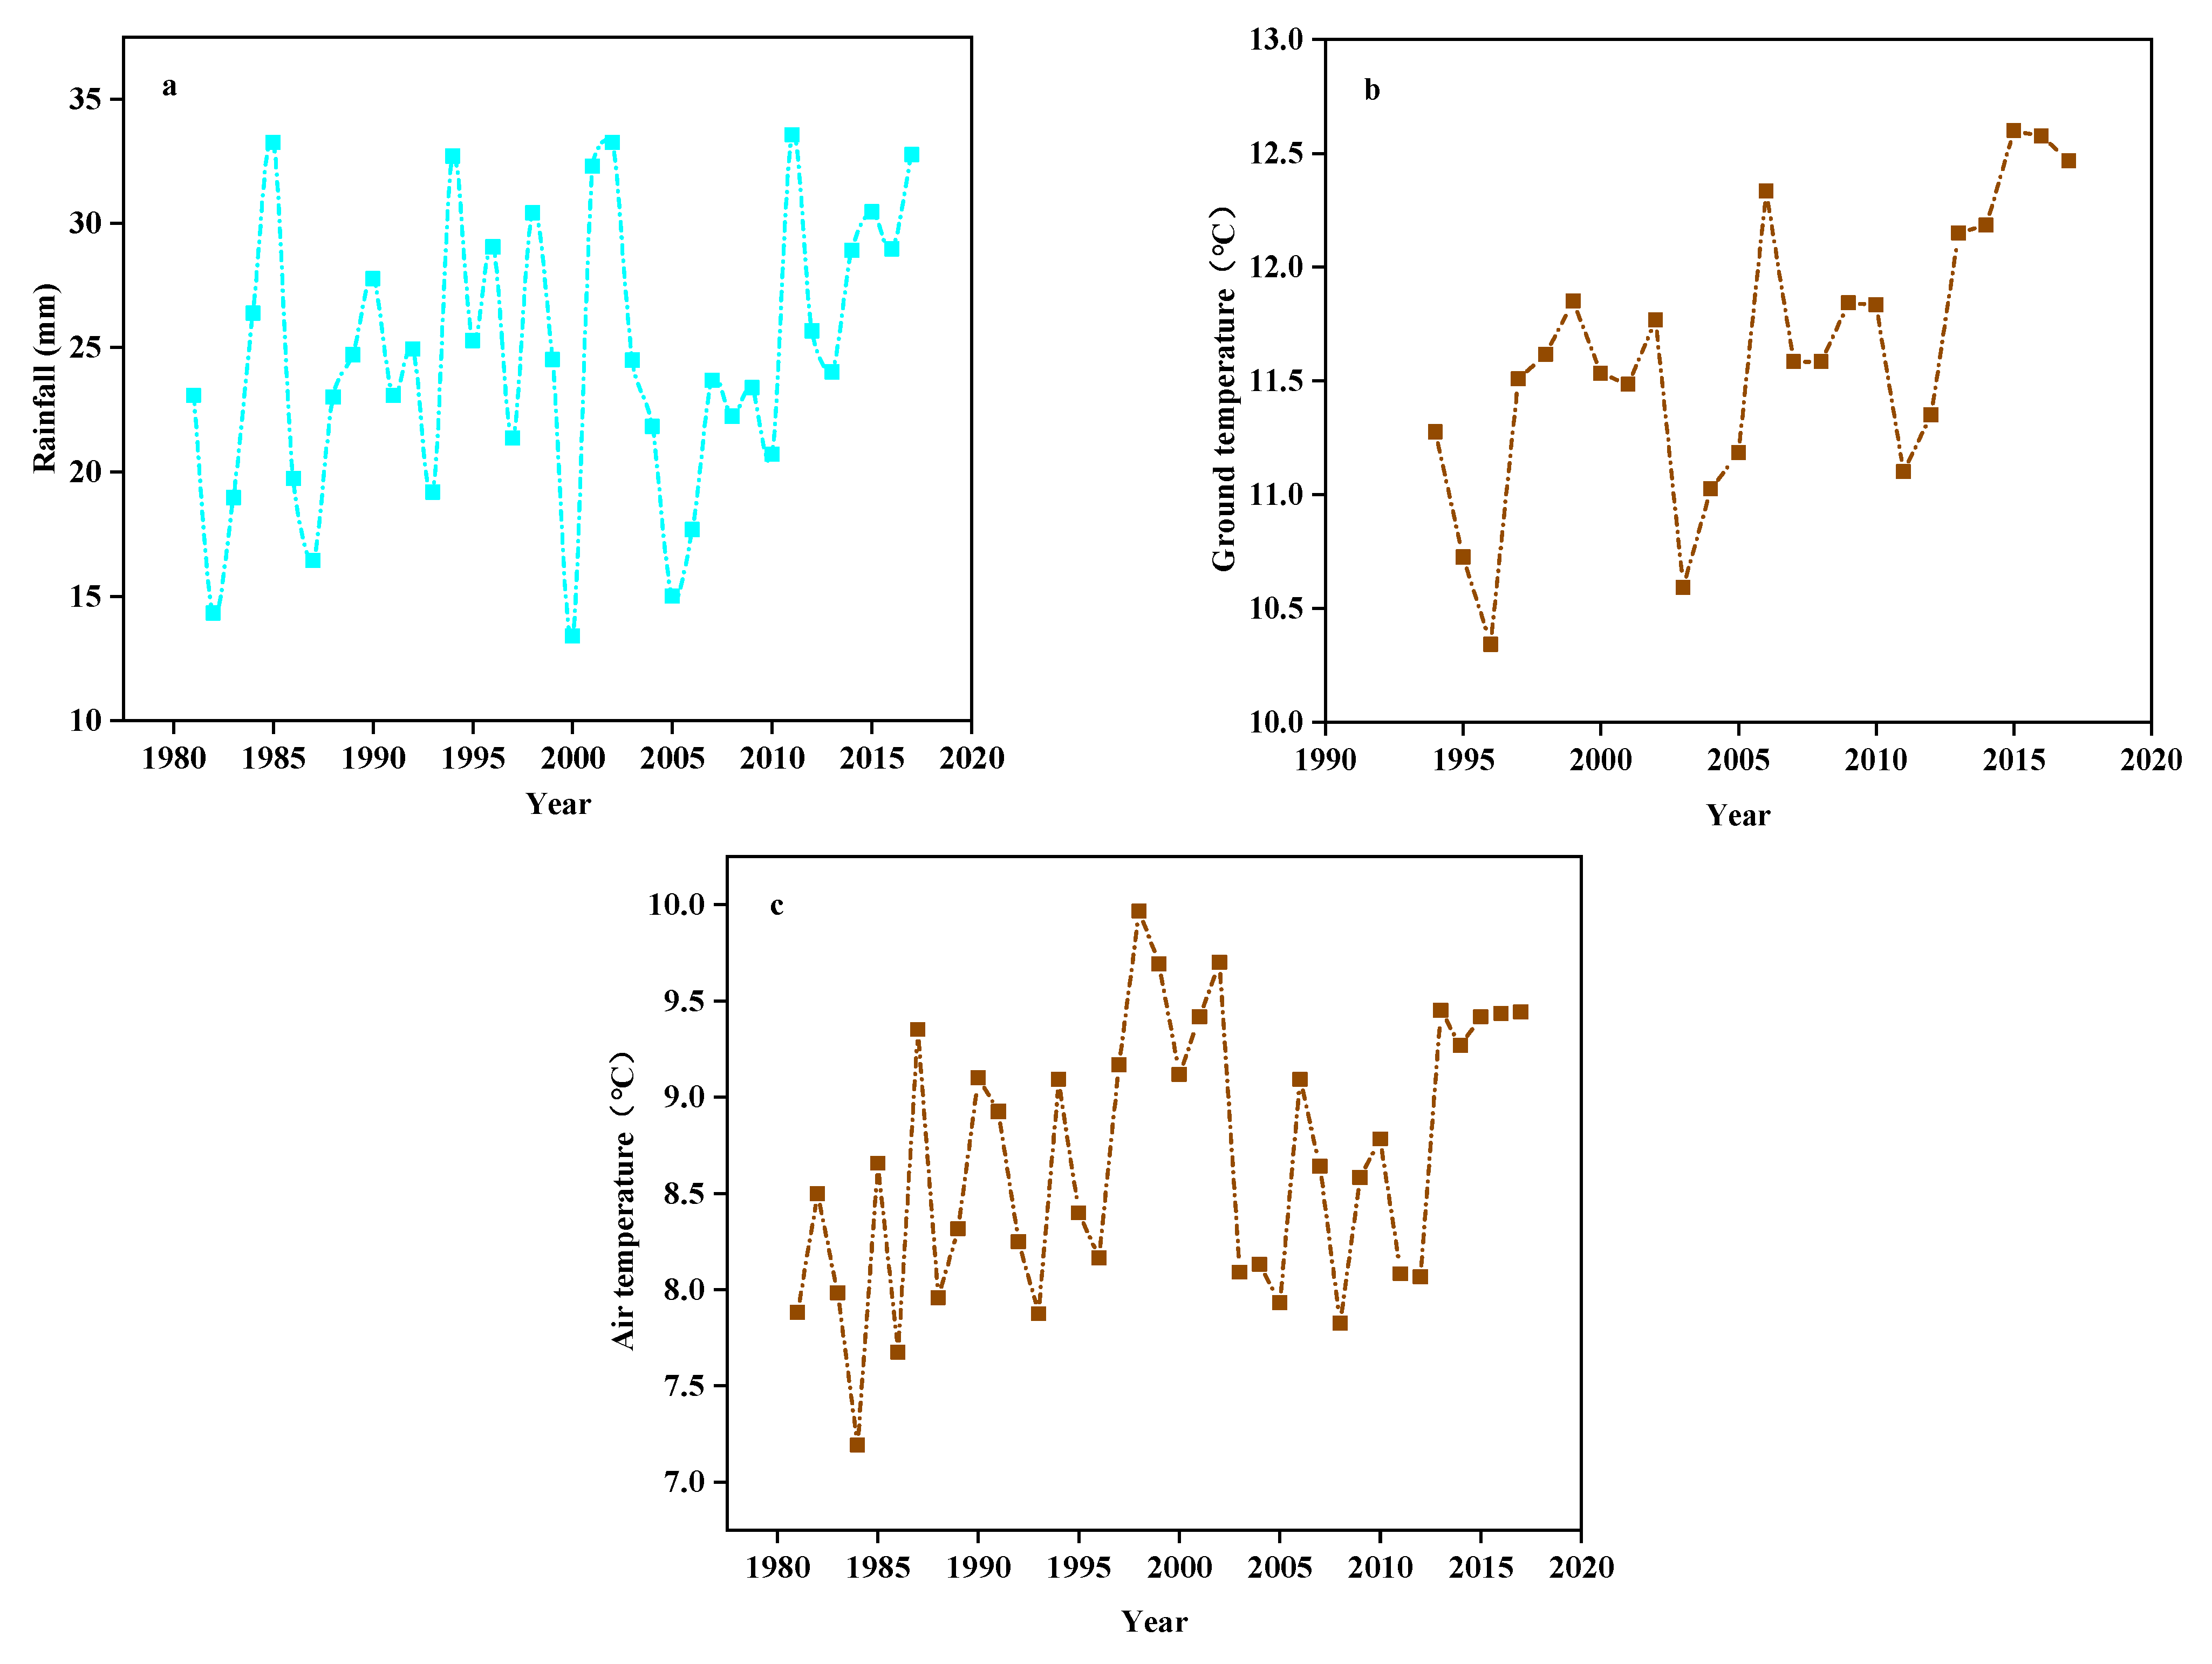
Figure 11.
The (a) Rainfall, (b) Ground temperature, and (c) Air temperature from 1981 to 2017.
Figure 11.
The (a) Rainfall, (b) Ground temperature, and (c) Air temperature from 1981 to 2017.
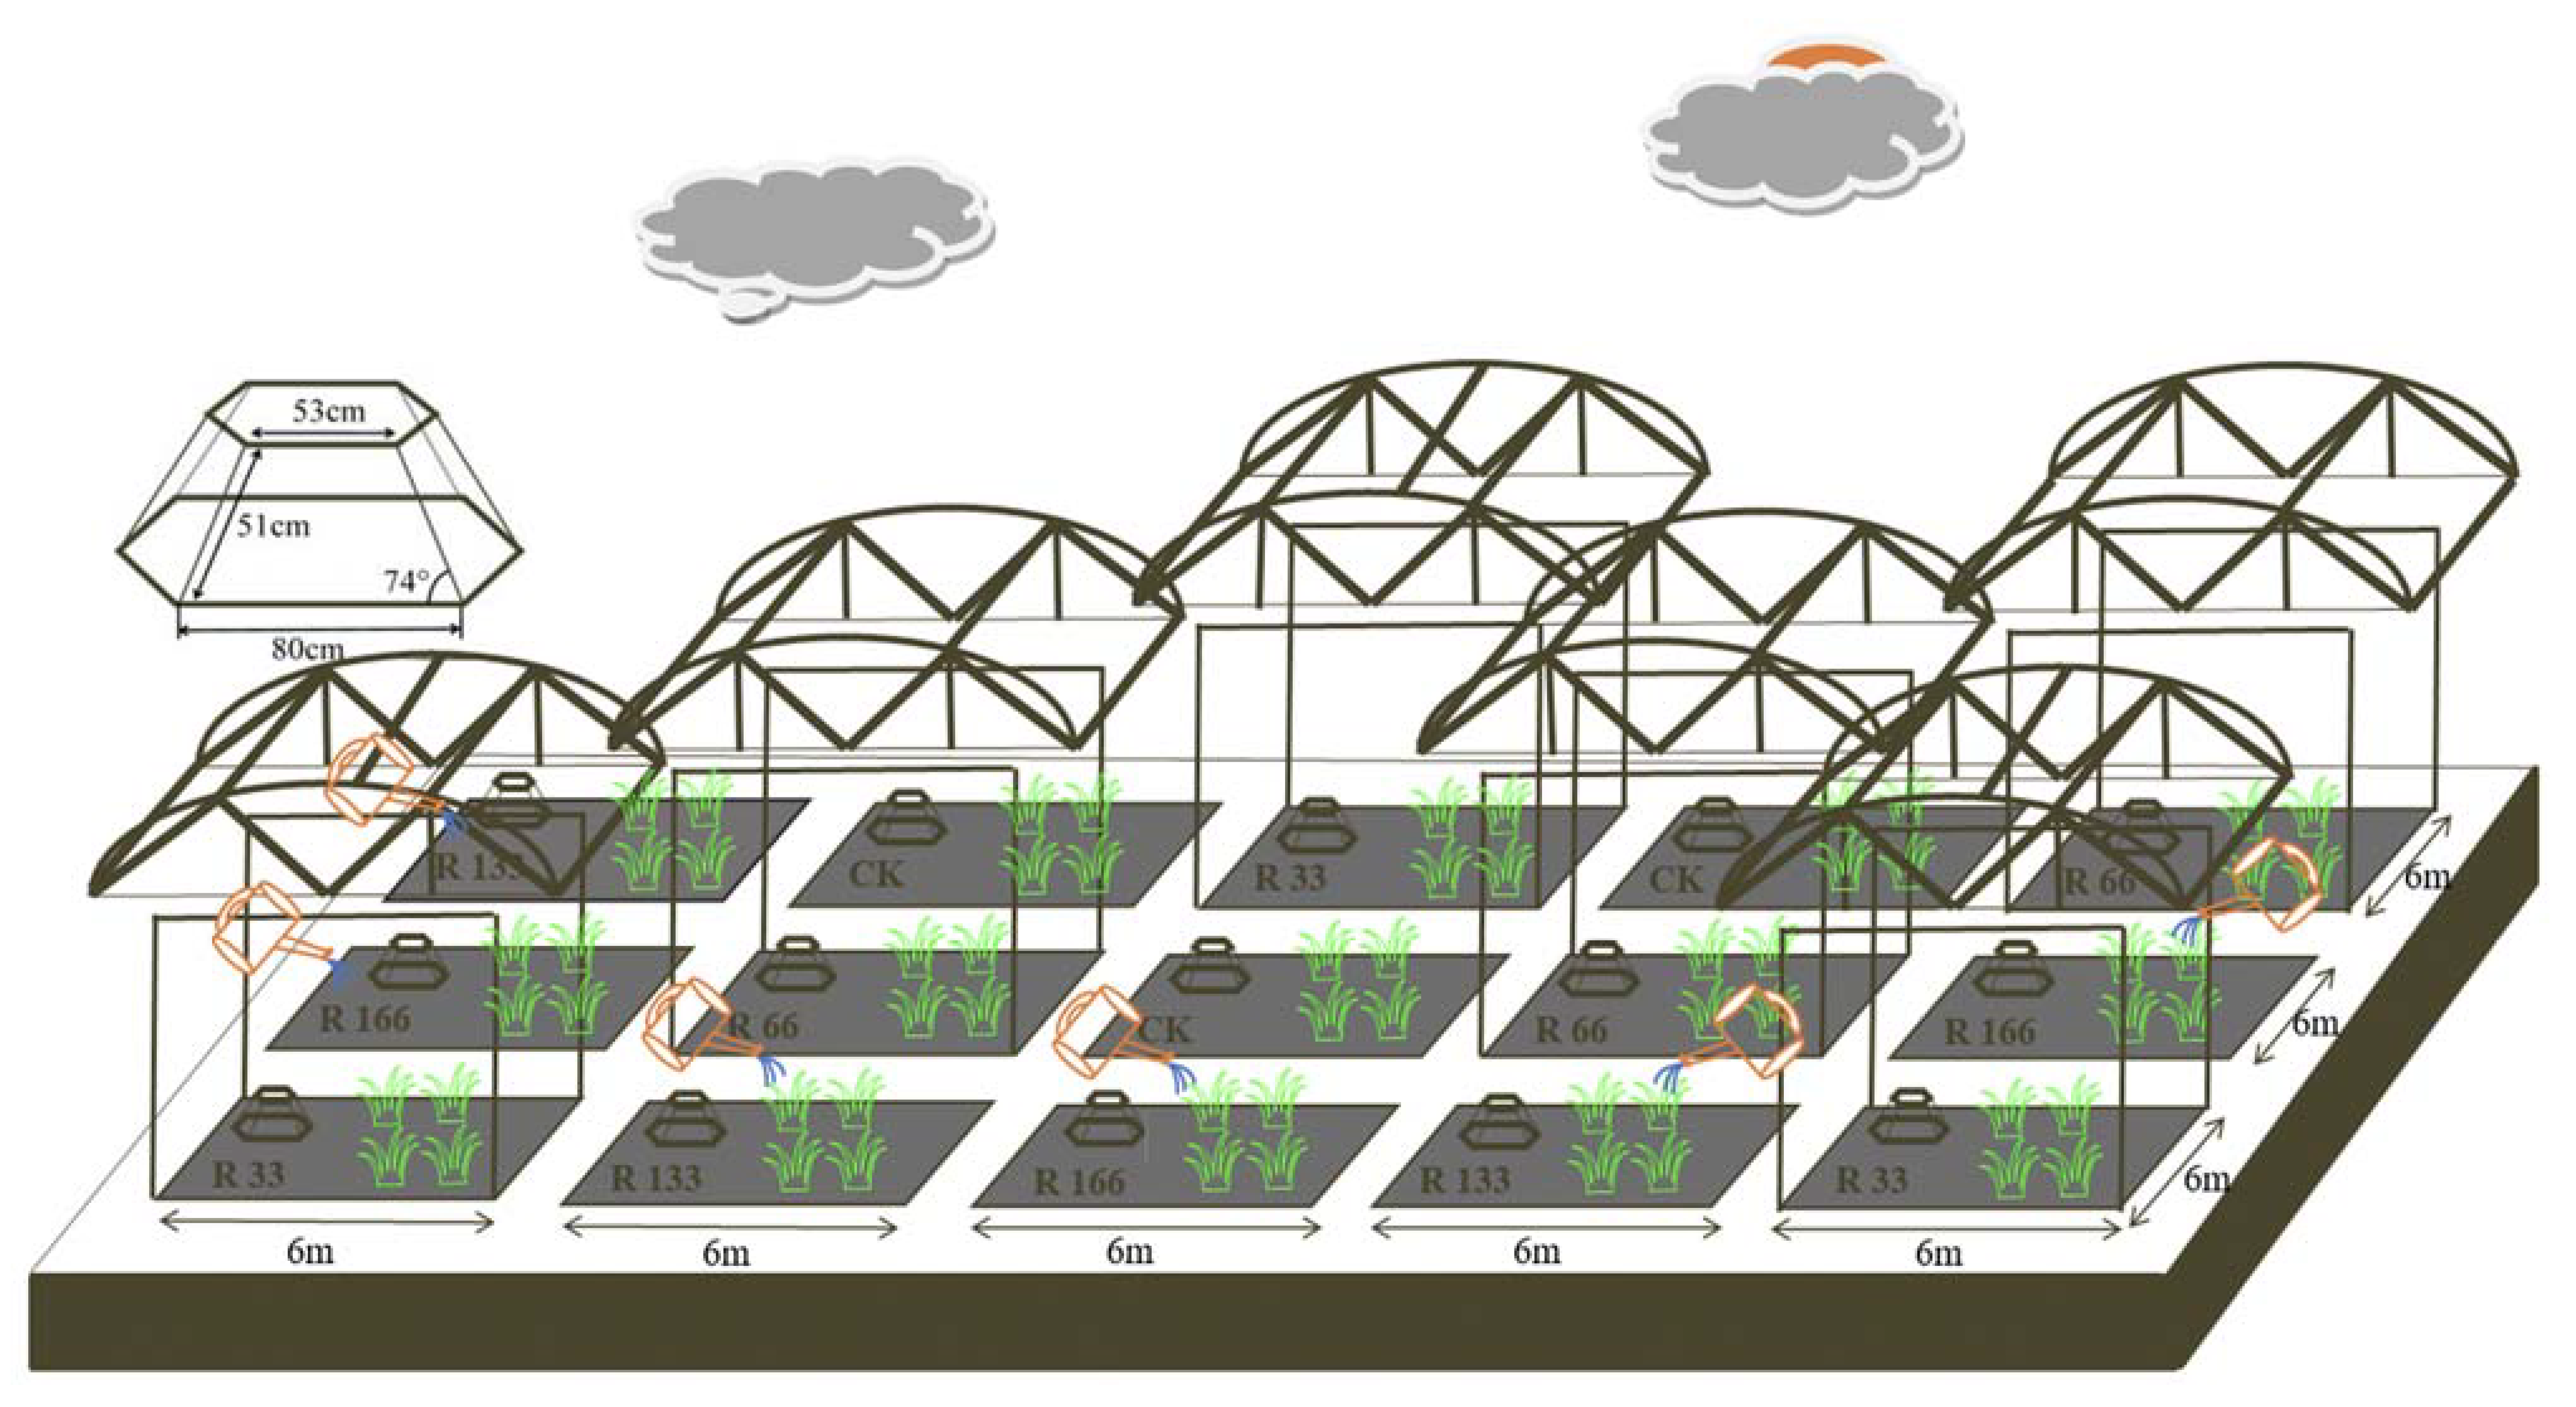
Figure 12.
Rain shelter construction and Open-Top Chamber (OTC) arrangements of the subplots at the study sites. Five levels of rainfall (R) were used: 33% (R33), 66% (R66), 100% (CK), 133% (R133), and 166% (R166) of the annual average. The first two rainfall conditions were obtained by using two rainout shelters with two manipulated rainfall doses: 97 mm (R33) and 194 mm (R66). For the three other rainfall conditions, we artificially increased rainfall in unsheltered plots using a watering pot: 295 mm (CK), 392 mm (R133), and 490 mm (R166). The temperature consisted of two levels: the actual temperature (CK) and the interaction between rainfall and the temperature, which was increased by about 2 °C (T) with the OTC (Open-Top Chamber) in each plot.
Table 1.
Grassland plant α-diversity index under different precipitation and temperature treatments.
Table 1.
Grassland plant α-diversity index under different precipitation and temperature treatments.
| | Shannon–Wiener | Pielou | Margalef | Simpson |
|---|
| | F = 6.12 p > 0.05 | F = 4.84 p > 0.05 | F = 6.34 p > 0.05 | F = 3.71 p > 0.05 |
| R33 | 1.64 ± 0.15 a | 0.80 ± 0.03 a | 3.17 ± 0.76 a | 0.76 ± 0.05 a |
| R66 | 1.65 ± 0.07 a | 0.75 ± 0.04 a | 3.75 ± 0.39 a | 0.75 ± 0.03 a |
| CK | 1.80 ± 0.11 a | 0.83 ± 0.04 a | 3.30 ± 0.35 a | 0.79 ± 0.03 a |
| R133 | 1.70 ± 0.07 a | 0.85 ± 0.05 a | 2.84 ± 0.21 a | 0.77 ± 0.04 a |
| R166 | 1.68 ± 0.11 a | 0.73 ± 0.07 a | 3.70 ± 0.39 a | 0.76 ± 0.03 a |
| | F = 6.09 p > 0.05 | F = 4.79 p > 0.05 | F = 5.98 p > 0.05 | F = 3.69 p > 0.05 |
| TR33 | 1.65 ± 0.14 a | 0.82 ± 0.04 a | 3.18 ± 0.74 a | 0.77 ± 0.03 a |
| TR66 | 1.67 ± 0.06 a | 0.76 ± 0.03 a | 3.76 ± 0.38 a | 0.76 ± 0.02 a |
| TCK | 1.81 ± 0.10 a | 0.84 ± 0.03 a | 3.31 ± 0.37 a | 0.80 ± 0.02 a |
| TR133 | 1.71 ± 0.08 a | 0.86 ± 0.06 a | 2.85 ± 0.23 a | 0.78 ± 0.03 a |
| TR166 | 1.69 ± 0.10 a | 0.75 ± 0.06 a | 3.71 ± 0.40 a | 0.77 ± 0.02 a |


 ,
, 
