Article

Detection and Quantification of Rhizoctonia solani and Rhizoctonia solani AG1-IB Causing the Bottom Rot of Lettuce in Tissues and Soils by Multiplex qPCR

by
Thérèse Wallon
,
Andréanne Sauvageau
and
Hervé Van der Heyden
*
Department of Phytopathology and Biosurveillance, Phytodata, 291 rue de la Coopérative, Sherrington, QC J0L 2N0, Canada
*
Author to whom correspondence should be addressed.
These authors contributed equally to this work.
Plants 2021, 10(1), 57; https://doi.org/10.3390/plants10010057
Submission received: 27 November 2020 / Revised: 18 December 2020 / Accepted: 24 December 2020 / Published: 29 December 2020
(This article belongs to the Special Issue Detection and Diagnostics of Fungal and Oomycete Plant Pathogens)

Abstract

:
In the muck soil region of southwestern Quebec, vegetable growers are threatened by several soilborne diseases, particularly the bottom rot of lettuce caused by the fungus Rhizoctonia solani. The particularly warm temperature of the few last seasons was marked by an increase in disease severity, and the associated yield losses were significant for Quebec lettuce growers. In the absence of registered fungicides and resistant cultivars, the management of Rhizoctonia solani-induced diseases in lettuce is based on good agricultural practices, which require detailed knowledge of the pathogen. In this study, Rhizoctonia solani fungal strains were isolated from infected field-grown lettuce plants presenting bottom rot symptoms to determine the anastomotic groups (AGs) of these isolates by internal transcribed spacer region (ITS) sequencing. Rhizoctonia solani AG 1-IB was identified as the main anastomotic group causing bottom rot lettuce in field-grown lettuce in organic soils in the Montérégie region. Two specific and sensitive quantitative PCR assays were then developed for R. solani AG1-IB and R. solani. The AG 1-IB qPCR assay amplified all strains of R. solani AG 1-IB tested, and no PCR product was obtained for any non-target strains. The R. solani qPCR assay amplified all strains of R. solani and did not amplify non-target strains, except for two strains of binucleate Rhizoctonia AG-E. In artificially inoculated soils, the sensitivity of both qPCR assays was set to 1 μg of sclerotia g−1 of dry soil. In the growth chamber experiment, a minimum concentration between 14 and 42 μg sclerotia g−1 of dry soil was required to induce the development of symptoms on the lettuce. Indeed, the AG 1-IB qPCR assay was sensitive enough to detect the lowest soil concentration of AG1-IB capable of inducing symptoms in head lettuce. In addition, the qPCR assays successfully detected R. solani and R. solani AG 1-IB from infected plant tissue samples and soil samples from lettuce fields. The qPCR assays developed in this study will be useful tools in lettuce bottom rot management.

1. Introduction

In southwestern Québec (Canada), lettuce is an important crop with an annual production of about 3500 metric tons, representing 62% of Canada’s production [1]. In this area, lettuce is mainly grown in muck soils from late April to early October, predominantly through the use of transplants. This production is threatened by several soilborne diseases. In the spring, pythium stunt caused by Pythium tracheiphilum is the most important disease [2], while bottom rot caused by Rhizoctonia solani is predominant throughout the summer. Rhizoctonia solani (Kühn) is a ubiquitous soilborne plant pathogen capable of infecting the seedlings, roots, leaves, and stems of a multitude of vegetable plants, causing a variety of diseases [3]. The first symptoms often occur as golden-brown lesions on leaf ribs and old leaves in contact with the soil, the main reservoir of the R. solani inoculum. Under conductive conditions, mycelial growth resumes from sclerotium, the over-seasoning structures, and the mycelium spreads until it meets the host plant tissue [4]. When temperatures and humidity are high, these lesions can quickly develop into wet rot, starting on the leaf ribs and moving toward the plant head, causing the greatest damage close to harvest. In eastern Canada, the number of high heat episodes tends to increase during the months of July and August, increasing bottom-rot incidence and severity. In southwestern Québec, no synthetic fungicides are registered against R. solani—only Bacilius subtilis-based biofungicides are currently available to growers. Moreover, there are no resistant lettuce cultivars available. Hence, the principal management method for R. solani in lettuce production is crop rotation, which in southwestern Québec mainly includes onions and carrots. Worldwide, the production areas in the United States, Brazil, and Germany also experienced outbreaks of basal rot caused by different anastomosis groups (AGs) of Rhizoctonia solani [5,6,7,8].
The Rhizoctonia complex consists of binucleate Rhizoctonia and multinucleate Rhizoctonia solani, each subdivided into several groups based on their hyphal anastomosis reactions. Binucleate Rhizoctonia are divided into 22 AGs (AG-A to AG-W), but, although some of them are associated with root rot in strawberry, potato, and soybean, the pathogenicity of these AGs varies greatly from isolate to isolate and many have been reported to have a neutral or beneficial relationship with the plant [9,10,11]. Rhizoctonia solani Kühn (teleomorph Thanatephorus cucumeris) is divided into 14 distinct anastomotic groups, AG-1 to AG-13, and AG-BI, which are also divided into subgroups (i.e., AG 1-IA, IB, IC, ID, IE, IF) [12,13]. Anastomosis groups can be distinguished by a distinct host range and virulence levels in crops, while the internal transcribed spacer region (ITS) has been identified as a useful barcode for the identification of R. solani to their respective AGs [12,14,15]. The anastomosis groups isolated thus far from greenhouses or field-grown lettuce worldwide include AG 1, AG 1-IB, AG 1-IC, AG 2, AG 2-1, AG 2-1Nt, AG 2-2, AG 3, AG4, AG4-HGI, AG 5, AG10, and AG-BI, as well as some unidentified AGs [5,7,8,15,16,17,18]. In the field AG1-IB, AG 1-IC, AG 2-1, AG 2-2, AG 4, and AG 5 groups were isolated in the muck soil of Ohio (USA); AG 1-IB, AG 1-IC, and AG 2-1 were isolated in Germany; and AG 1-IA and AG 1-IB were isolated in Brazil [5,7,8,19]. These studies showed that AG 1-IB is the most prevalent AG associated with bottom rot in field-grown lettuce. Hence, precise identification of the predominant R. solani AG may help implement new management strategies against bottom rot in lettuce crops [20].
Integrated pest management (IPM) relies on a combination of different approaches (e.g., cultivar selection, crop rotation, and biocontrol agents) to keep the populations of pathogens below the economic damage threshold [21,22,23]. For soilborne diseases, several promising IPM strategies are based on the quantification of soilborne pathogen inoculum [24,25]. In the specific case of Rhizoctonia-induced diseases, quantification of the soil inoculum was found to be useful in different contexts. For example, it was used to assess rice cultivar susceptibility to R. solani AG 1-IA [26] to assess the impact of different crop rotations on the inoculum levels of a specific AG and its main host plant [27,28], and to map the inoculum level at the field scale to make site-specific fungicide applications to limit the local transmission of the pathogen [29]. A positive correlation between R. solani soilborne inoculum and disease incidence or severity was found for several R. solani AGs and their host plants under controlled experiments [19,30], but fewer studies confirmed this relationship in field experiments [31]. Rhizoctonia solani inoculum can be assessed by baiting methods or with the use of molecular detection assays [27,32,33,34]. Since the molecular method has the advantage of being rapid and able to be designed specifically for a given R. solani AG, unlike baiting methods, it was used to quantify the R. solani soilborne inoculum in various soil types [32,33]. The implementation of such soilborne inoculum quantitation protocols enables the development of damage thresholds, allowing us to make better decisions regarding field selection [2,35]. Hence, this study aims to (i) identify the predominant R. solani AG responsible for lettuce basal rot in the muck soils of southwestern Québec; (ii) develop qPCR assays specific to R. solani and R. solani AG1-IB in order to detect and quantify them in soil and lettuce tissue samples; (iii) develop a molecular detection threshold for R. solani inoculum in muck soil; and (iv) investigate the relationship between the AG1-IB soil inoculum concentration and disease development under controlled conditions to validate the biological significance of the molecular detection threshold found.

2. Results

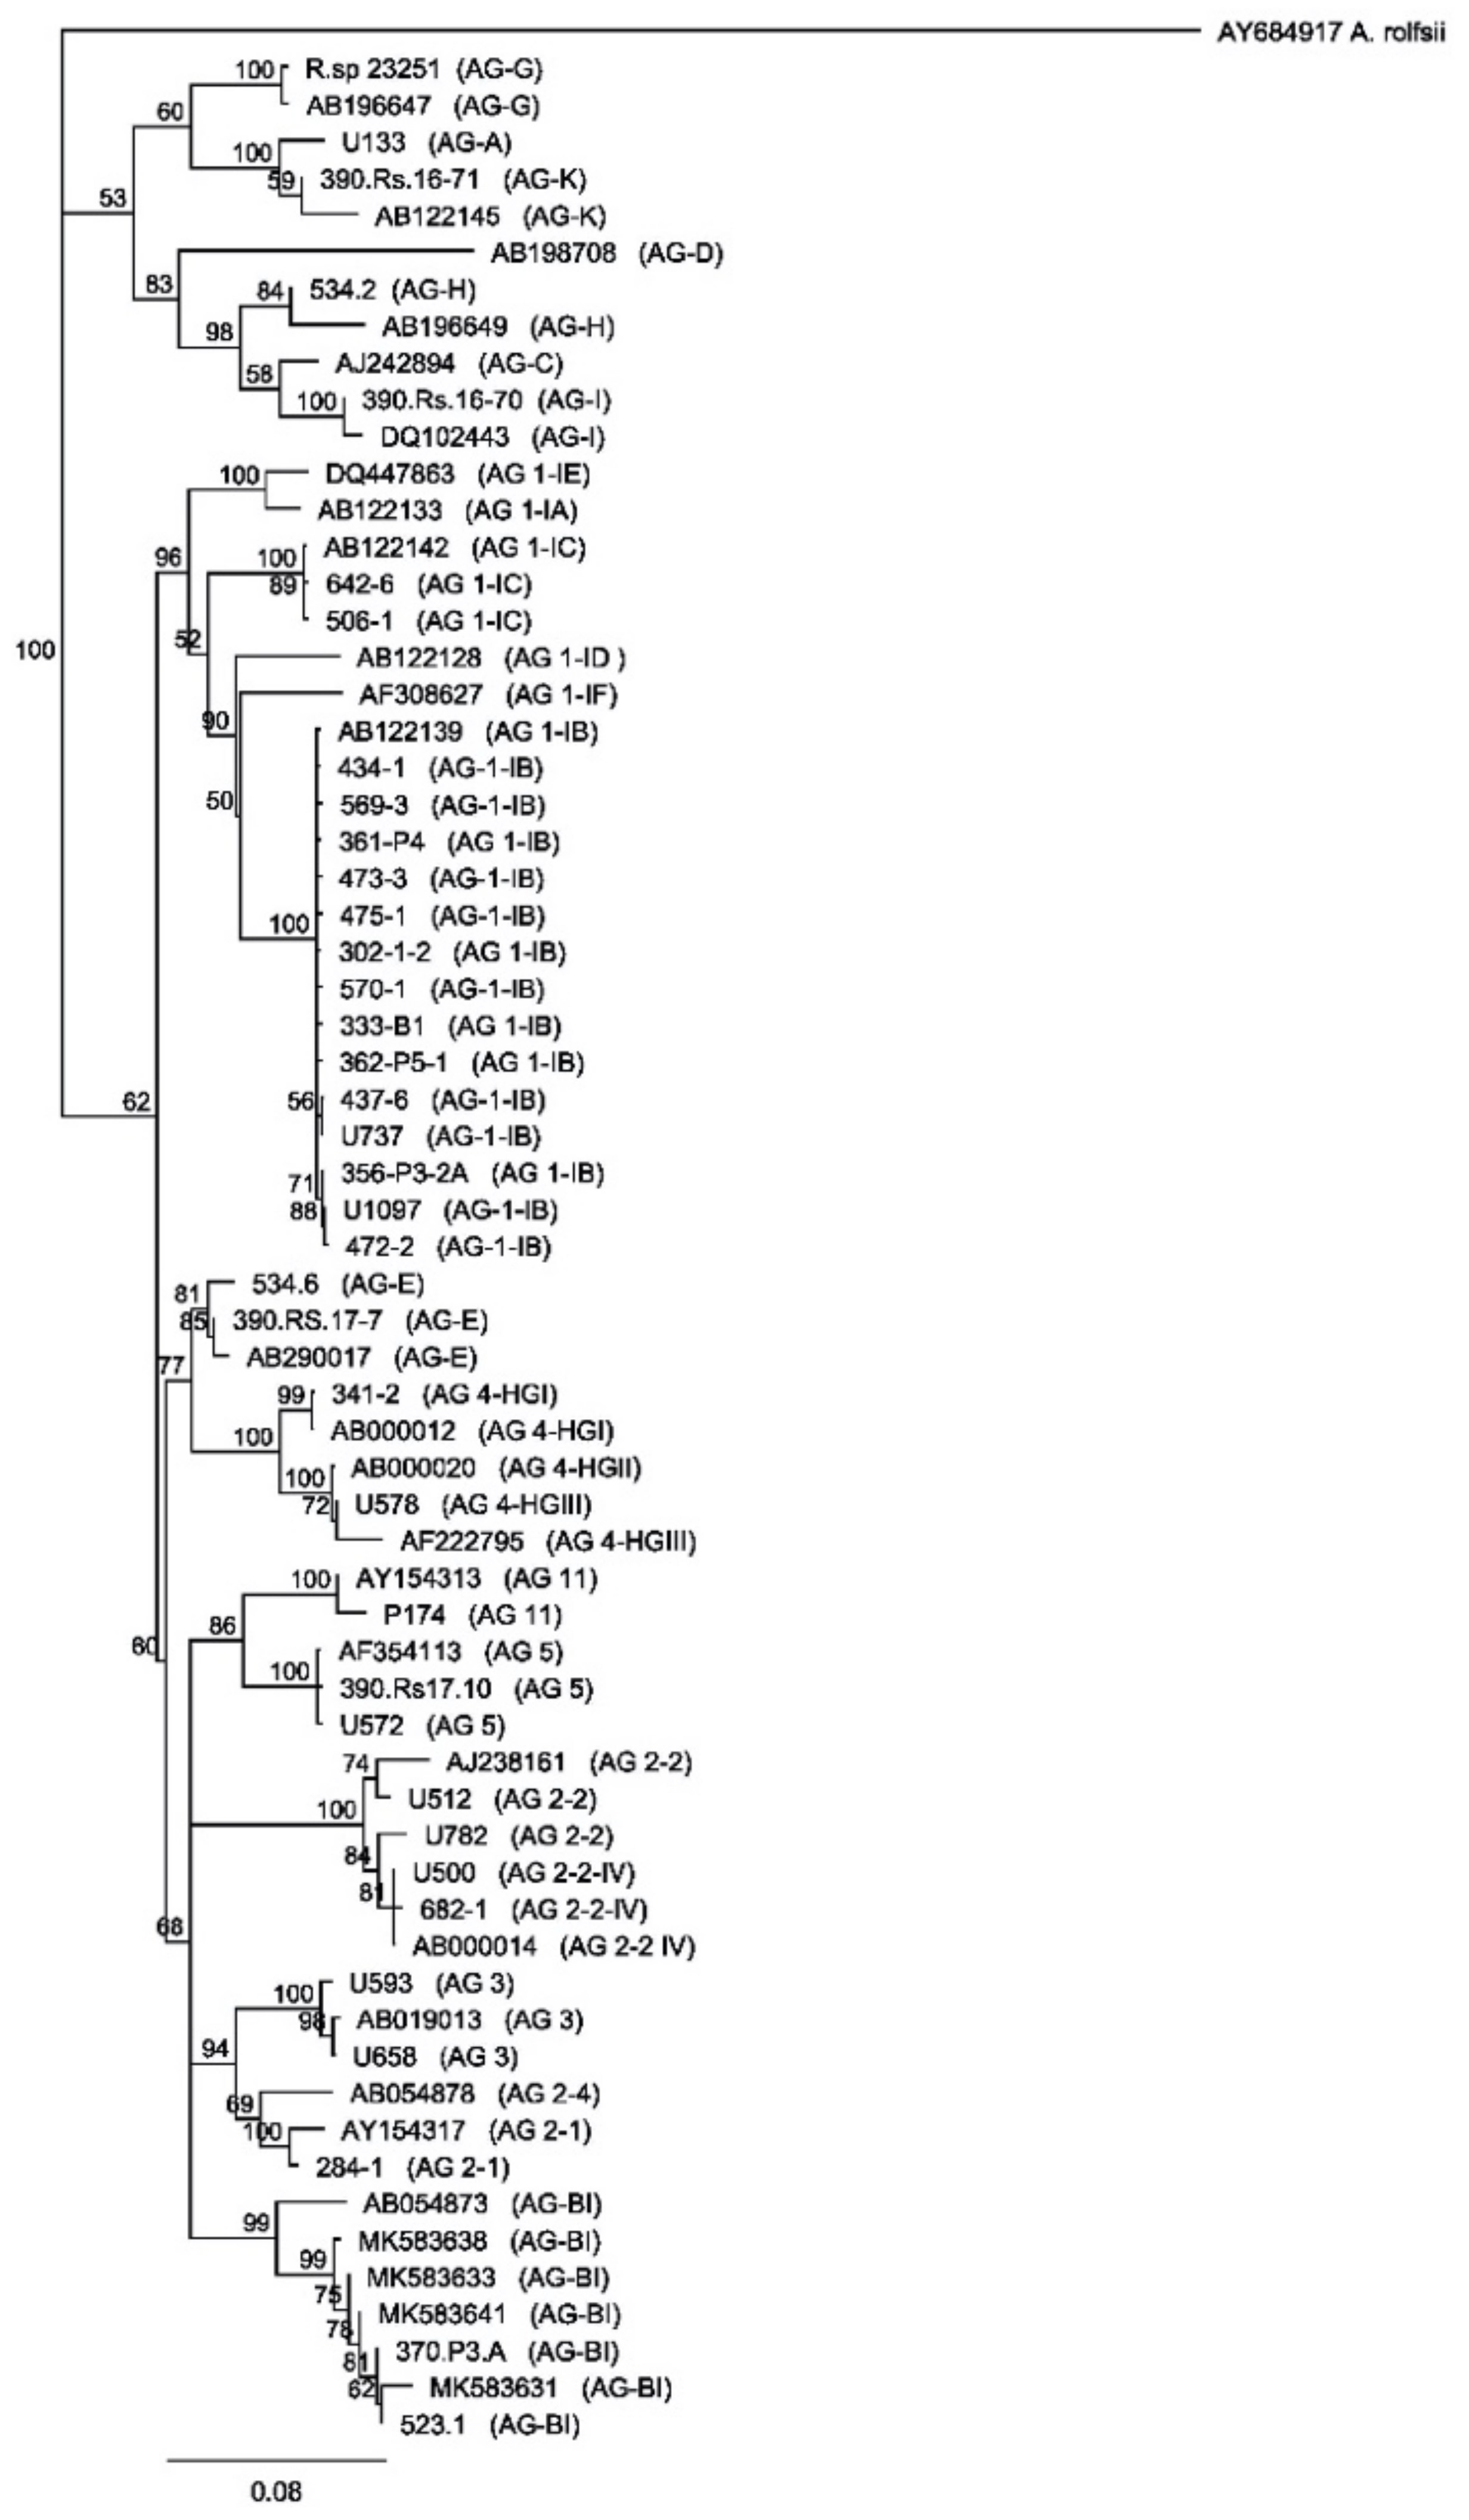
2.1. Characterization of Rhizoctonia solani Isolates

Sequencing of the internal transcribed spacer region (ITS) conducted on 60 R. solani isolates collected from infected lettuce showed that 95% of the isolates belonged to AG 1-IB, 3.3% to AG-BI, and 1.7% to AG 1-1C (Figure S1). The closest sequences to our AG-BI isolates came from pathogenic AG-BI strains isolated from lettuce in Belgian greenhouses [16] (Supplementary Figure S2). Isolates AG-BI 370-P3-A and 523-1 (Table 1) showed 100% and 99.8% identity with AG-BI MK583630, respectively. The R. solani AG-BI strains were isolated from romaine lettuce samples collected from two different fields on the same farm, while R. solani AG1-IC was isolated from iceberg lettuce. The phylogeny of R. solani ITS sequences obtained from the isolates collected from infected lettuce leaves allowed the identification of different AGs (Figure 1). All the sequences obtained in this study were deposited in the GenBank database (accession MT177217-MT177269).

2.2. Development of the Rhizoctonia solani- and Rhizoctonia solani AG1-IB-Specific qPCR Assays

2.2.1. Primer and Probe Design

The alignment of 87 R. solani and Binucleate Rhizoctonia ITS sequences obtained in this study and from the NCBI database was used to design the qPCR primers and probe sets (Supplementary Figure S3). Primers and probes used in this study are presented in Table 2. The previously described primers of GMRS3-R and a modified version of the GMRS4 primer (GRSM4m), combined with the newly developed probe (GRMP) (Supplementary Figure S4), amplified a PCR product ranging from 87 to 109 bp, depending on the AG (Supplementary Figures S4 and S8) [36]. For R. solani AG 1-IB, the ITS1 region specifically allowed us to differentiate between the members of the AG 1 subgroup, including AG 1-IA, -IB, -IC, -1D, -IE, and -IF (Supplementary Figure S5). The primers AG 1-IB-F3 and AG 1-IB-R and the probe AG 1-IB-P were designed on the 5′ end of the ITS1 region (Supplementary Figure S6) and amplified a 90 bp PCR product (Supplementary Figure S7). For the AG 1-IB assay, the specificity was largely conferred by reverse and forward primers.

2.2.2. Primer and Probe Specificity

The R. solani assay amplified DNA from 11 different R. solani AGs, including AG 1-IB, 1-IC, AG 2-1, 2-2, 2-2-IV, AG 3, AG 4-HGI, AG 4-HGII, AG 5, AG 11, and AG-BI, with Cq values ranging from 21.58 to 30.45. No amplification was recorded for Binucleate Rhizoctonia AG-A, AG-G, AG-H, AG-I, AG-K, or for the other tested fungi. The only unexpected amplification came from the Binucleate Rhizoctonia AG-E group, for which isolates 390.Rs17-7 and 534-6 were positive, with a Cq value of 25.69 and 27.24, respectively (Table 1). The R. solani AG 1-IB assay only amplified DNA from the 14 R. solani AG 1-IB isolates tested, with Cq value ranging from 21.59 to 25.20 (Table 1). No amplification was recorded for the other 10 AGs tested, for the six Binucleate Rhizoctonia, or for the other fungi.

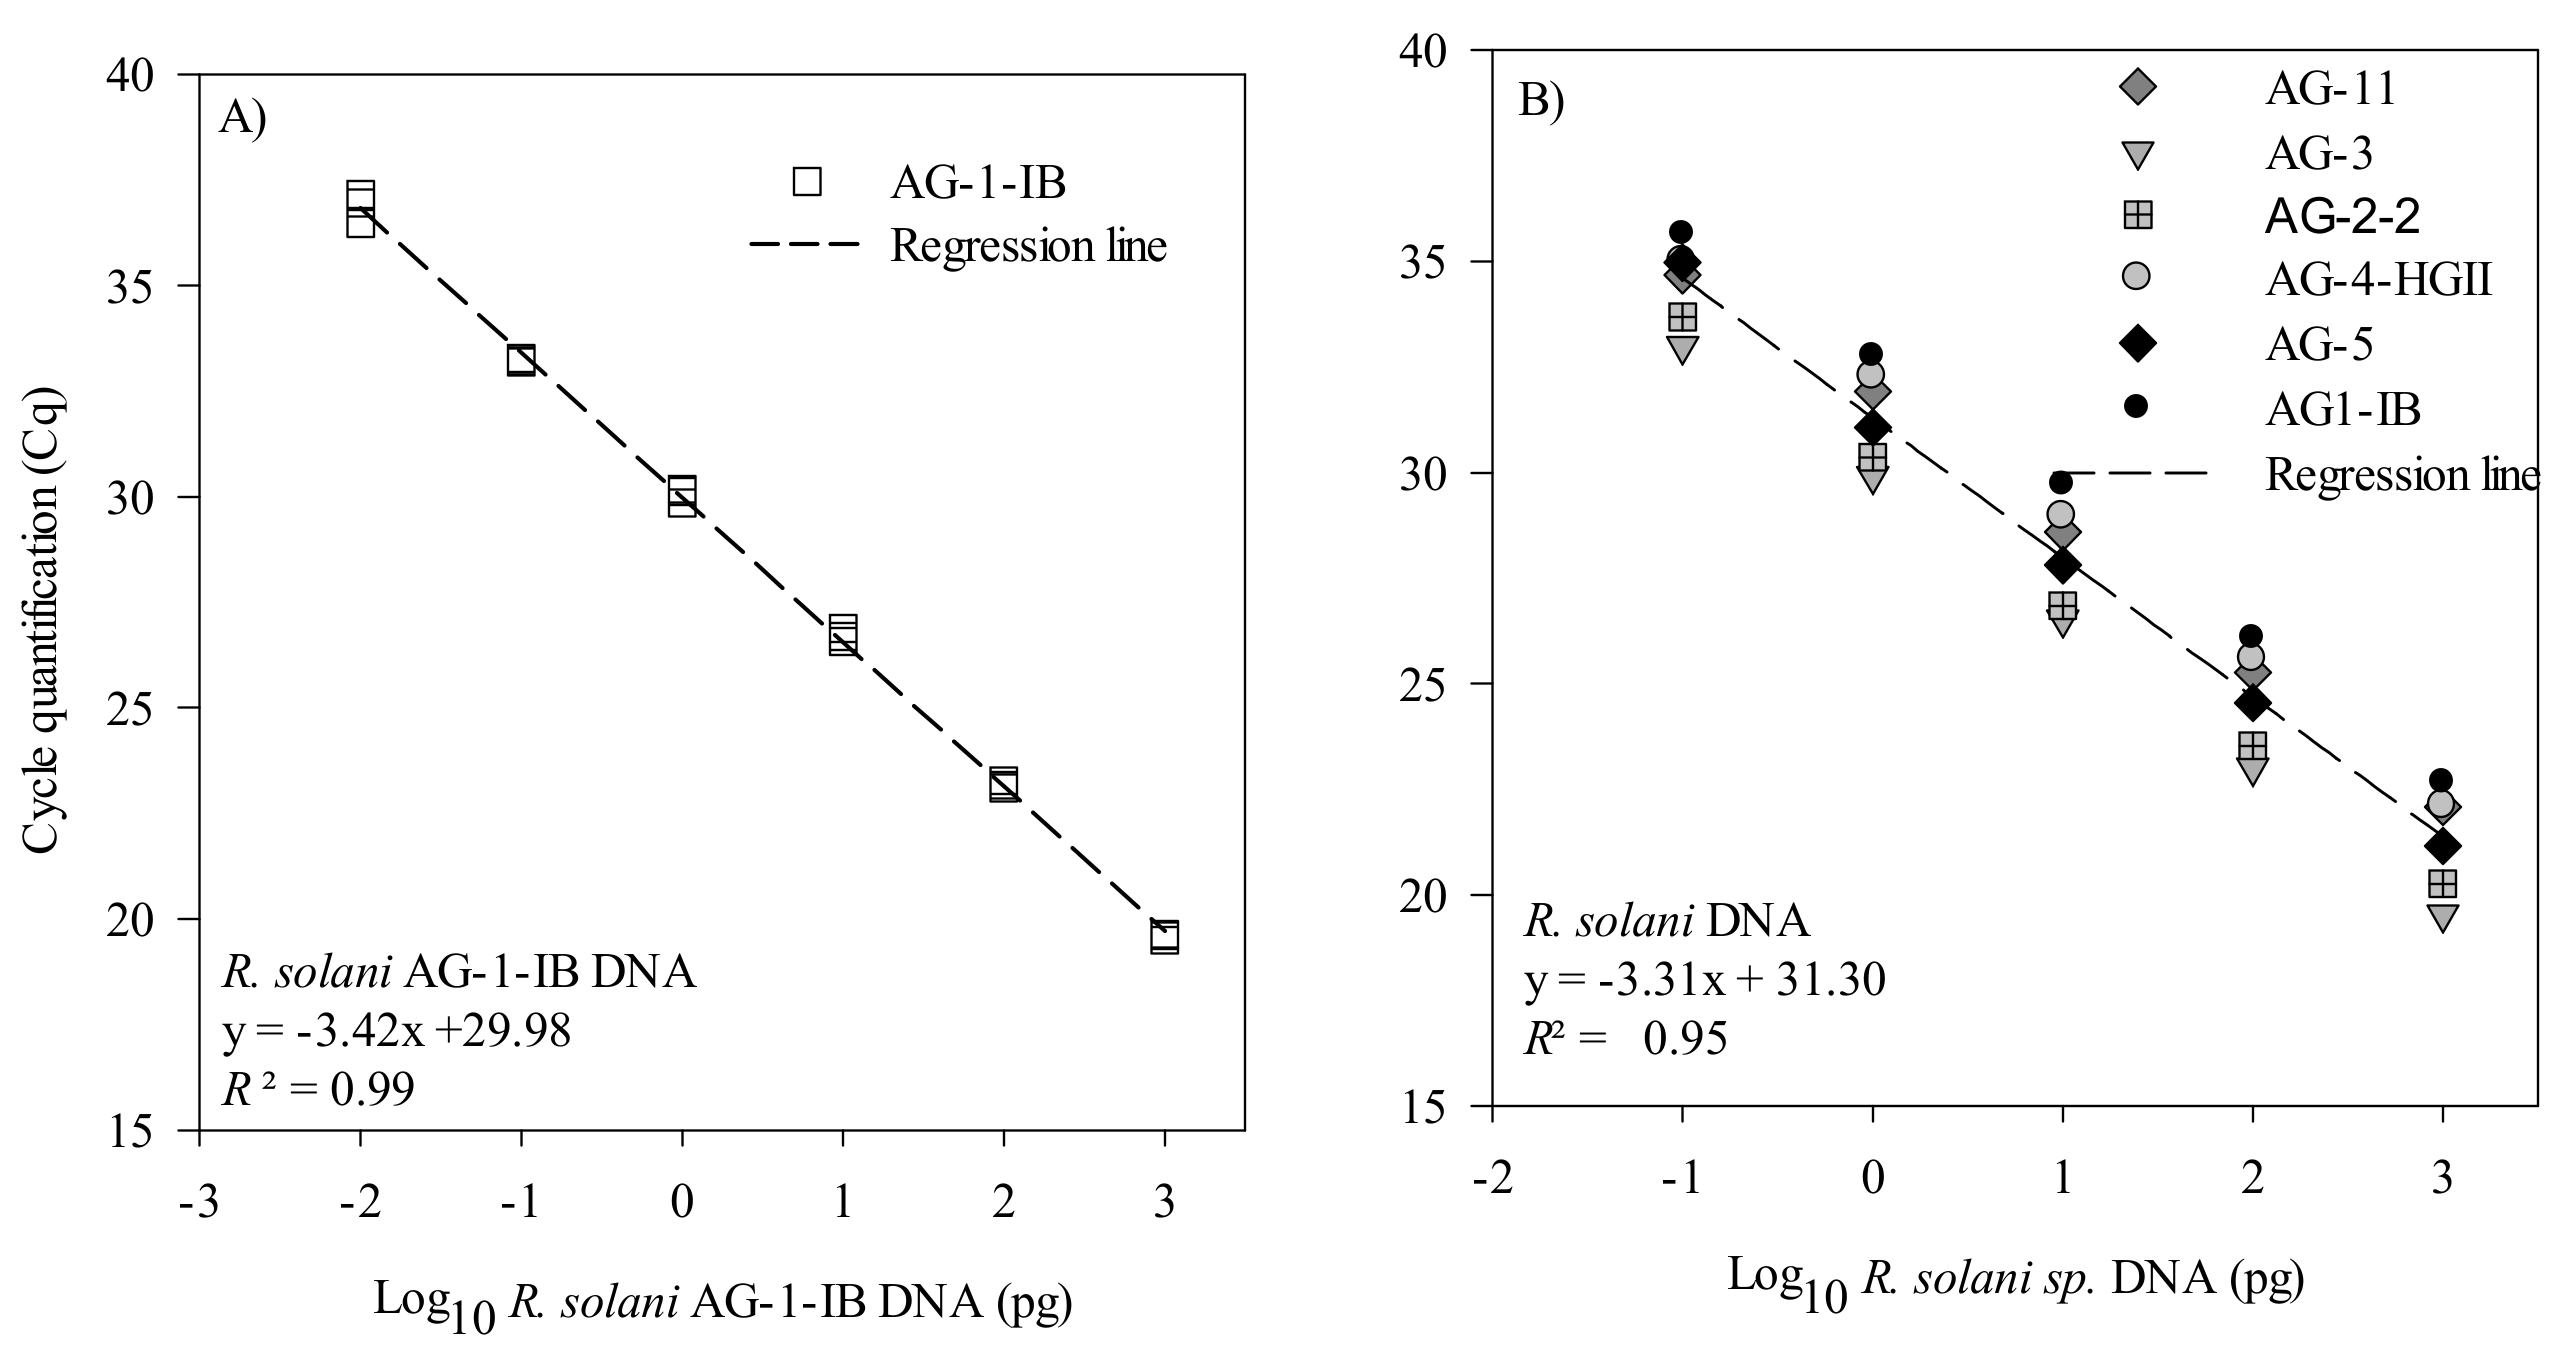
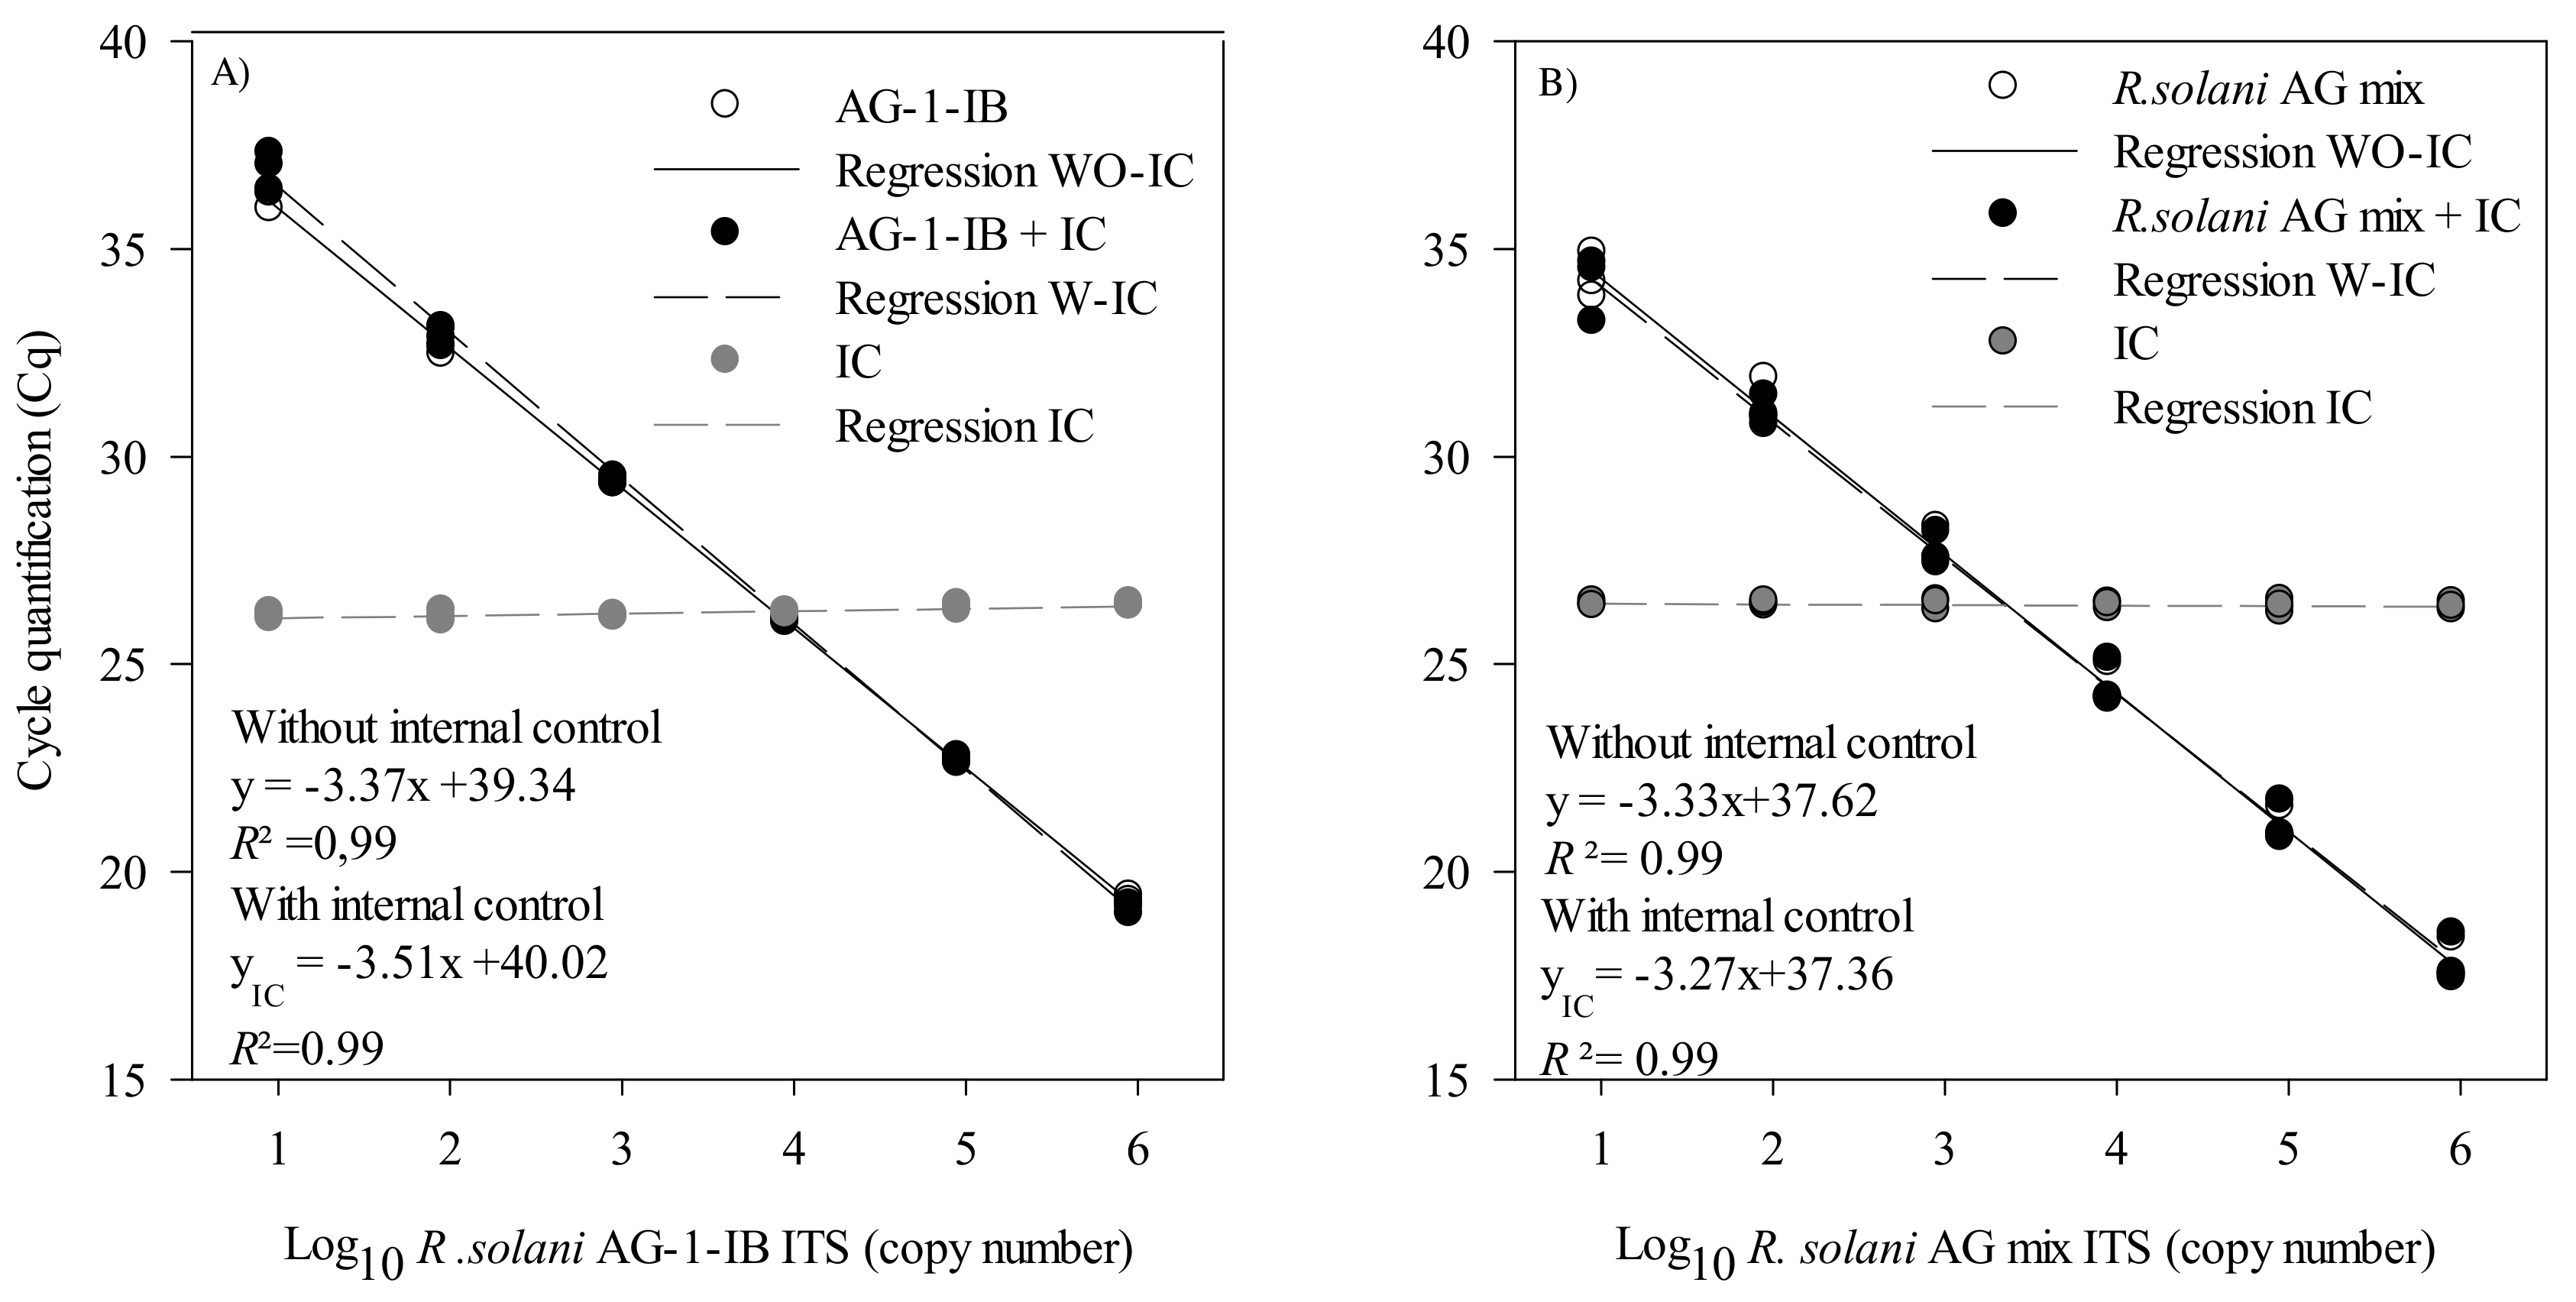
2.2.3. Primer and Probe Efficiency and Sensitivity

The efficiency and sensitivity of the R. solani and R. solani AG 1-IB qPCR assays were first evaluated using a 10-fold serial dilution of a gDNA solution. For the AG 1-IB assay, the standard curve showed a linear dynamic range of amplification over six orders of magnitude with a slope of −3.42, corresponding to an efficiency of 95.6% (Figure 2A). For the R. solani assay, the standard curve showed a linear dynamic range of amplification over five orders of magnitude with a slope of −3.31, corresponding to an efficiency of 100.5% (Figure 2B). The limit of detection was 0.01 pg of DNA and 0.1 pg of DNA for the AG 1-IB and the R. solani assays, respectively.
Both assays were multiplexed with an internal control to detect false negatives, which sometimes occur due to the presence of soil or plant inhibitors in environmental DNA extracts. For the R. solani AG1-IB assay, the slope of the regressions was slightly greater with the IC (−3.51) compared to the regression obtained without the IC (−3.37) (Figure 3A). For the R. solani assay, the slopes of the regressions were similar both with (−3.33) and without the IC (−3.27) (Figure 3B). The addition of the IC in a multiplex reaction did not interfere with the initial R. solani or R. solani AG 1-IB quantification or detection limit.

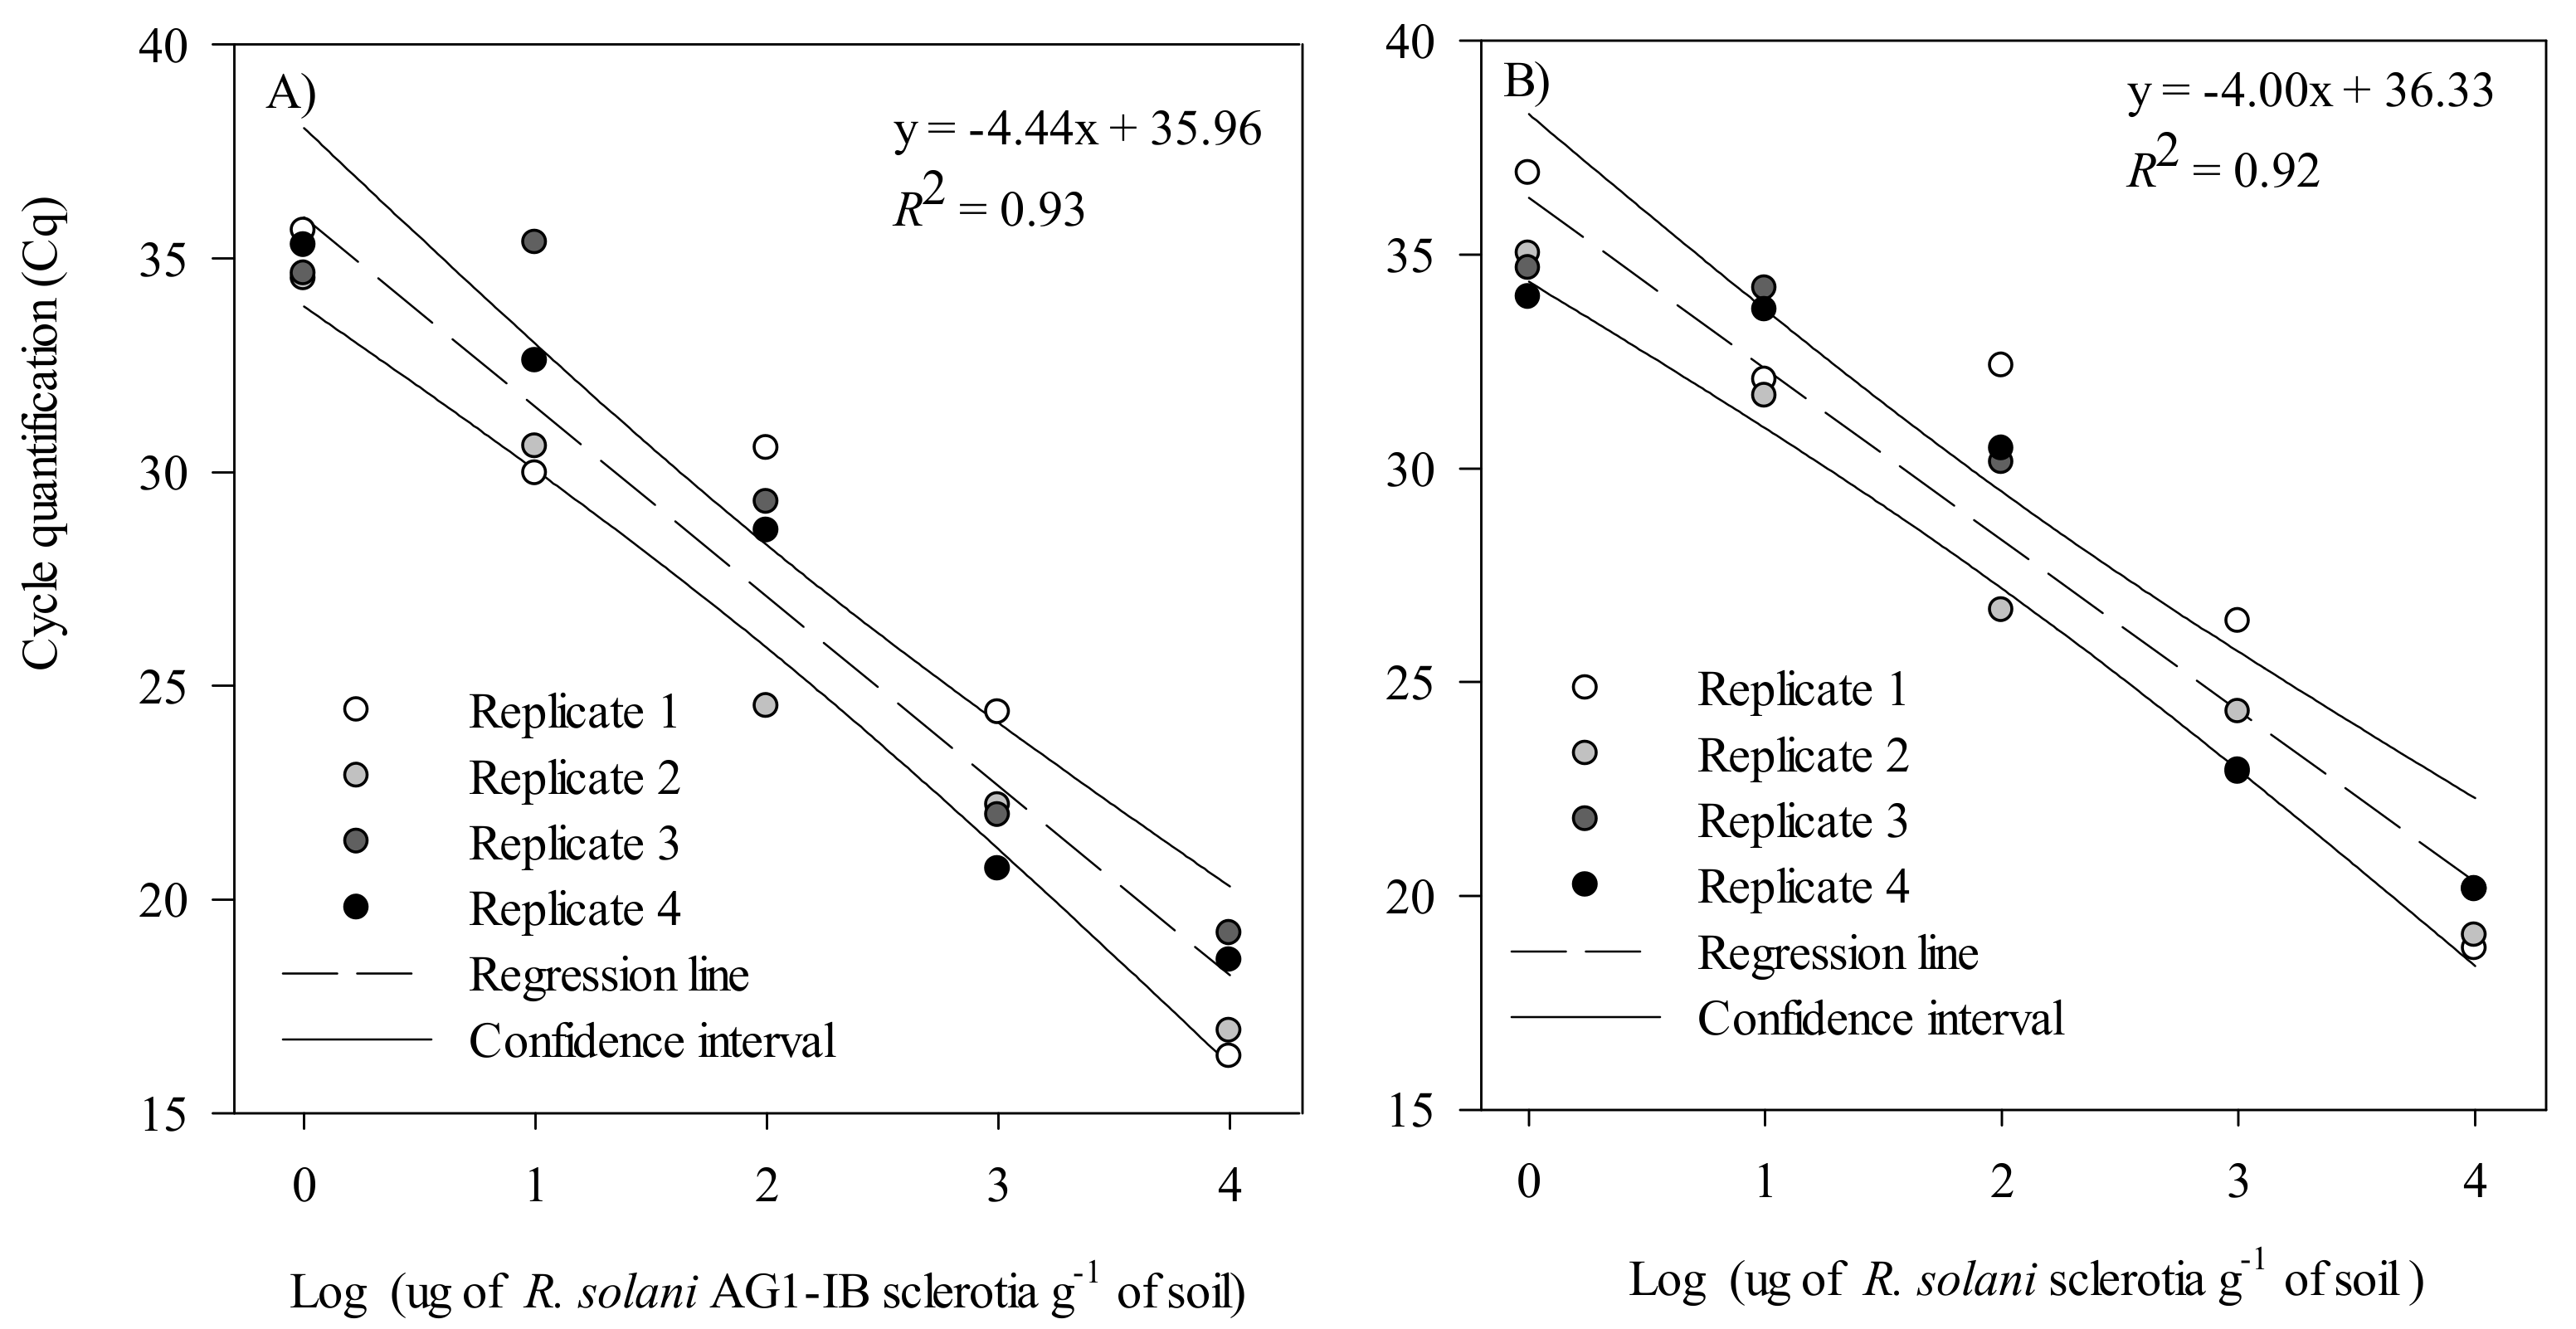
2.2.4. Validation in Artificially Inoculated Soil with R. solani AG 1-IB and R. solani Sclerotia

The validation conducted with artificially inoculated soils showed a negative linear relationship between the log10 of the sclerotia concentration in the soil (µg g−1 of soil) and the qPCR cycle threshold for both R. solani AG 1-IB and R. solani (Figure 4A,B). For the R. solani AG 1-IB assay, the slope of the linear regression was −4.44 (R2 = 0.92), and −4.00 (R2 = 0.93) for the R. solani assay. Moreover, for both assays, the ANOVA conducted with four independent replicates followed by an LSD test showed that all concentrations were significantly different from each other (p < 0.001). Hence, combining the soil conditioning method, DNA extraction protocol, and qPCR conditions provided a limit of detection of 1 μg sclerotia g−1 of dry soil.

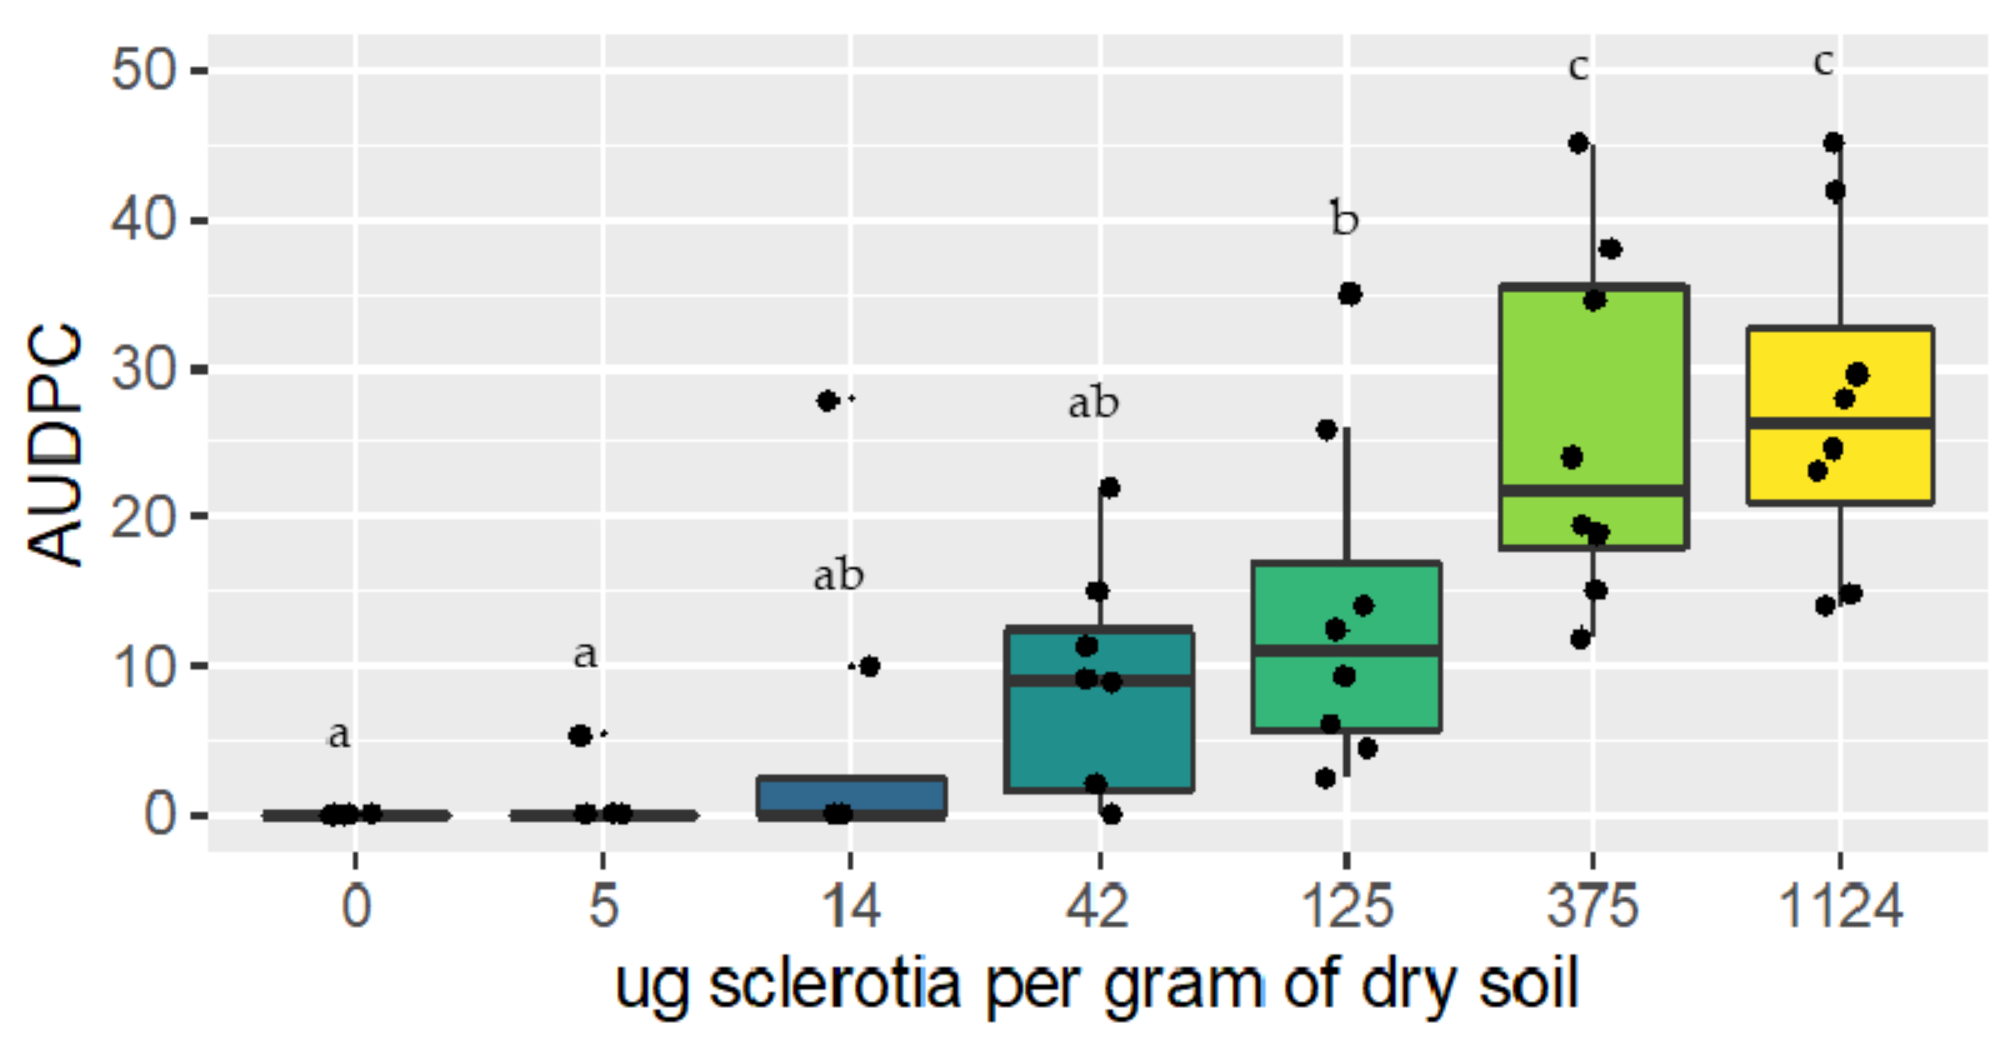
2.3. Investigation of the Relationship between R. solani AG 1-IB Soil Inoculum and Disease Development

For both trials, the area under the disease progress curve (AUDPC) increased as the soil inoculum concentration increased. Lettuce plants grown in non-inoculated soil did not show any basal rot symptom, except for one plant in trial two that may have been contaminated by a neighboring plant. The ANOVA conducted in both trials suggested that there was a significant effect of soilborne inoculum on disease development (p < 0.001) (Figure 5). The results of this experiment suggest that concentrations above 125 μg of sclerotia per gram of soil produce more symptoms than concentrations of 0 and 4 μg of sclerotia per gram of soil, while concentrations of 14 and 42 μg of sclerotia per gram of soil belong to both groups (Figure 5).

2.4. Validation Using Naturally Infested Plant and Soil Samples

2.4.1. Rhizoctonia solani and Rhizoctonia solani AG1-IB Detection in Plant Tissue

To validate the use of qPCR assays on the infected lettuce collected in the field, 30 samples of plant material were selected. For each of the tested samples, R. solani was previously isolated and identified in the anastomotic group by ITS sequencing, as described above (Table 3). All plant tissue samples from which R. solani AG 1-IB was isolated were positive for both R. solani and R. solani AG 1-IB using the qPCR assays developed in this study. The three samples in which R. solani AG1-1C or AG-BI were isolated were positive in the R. solani qPCR assay but negative for the R. solani AG 1-IB assay.

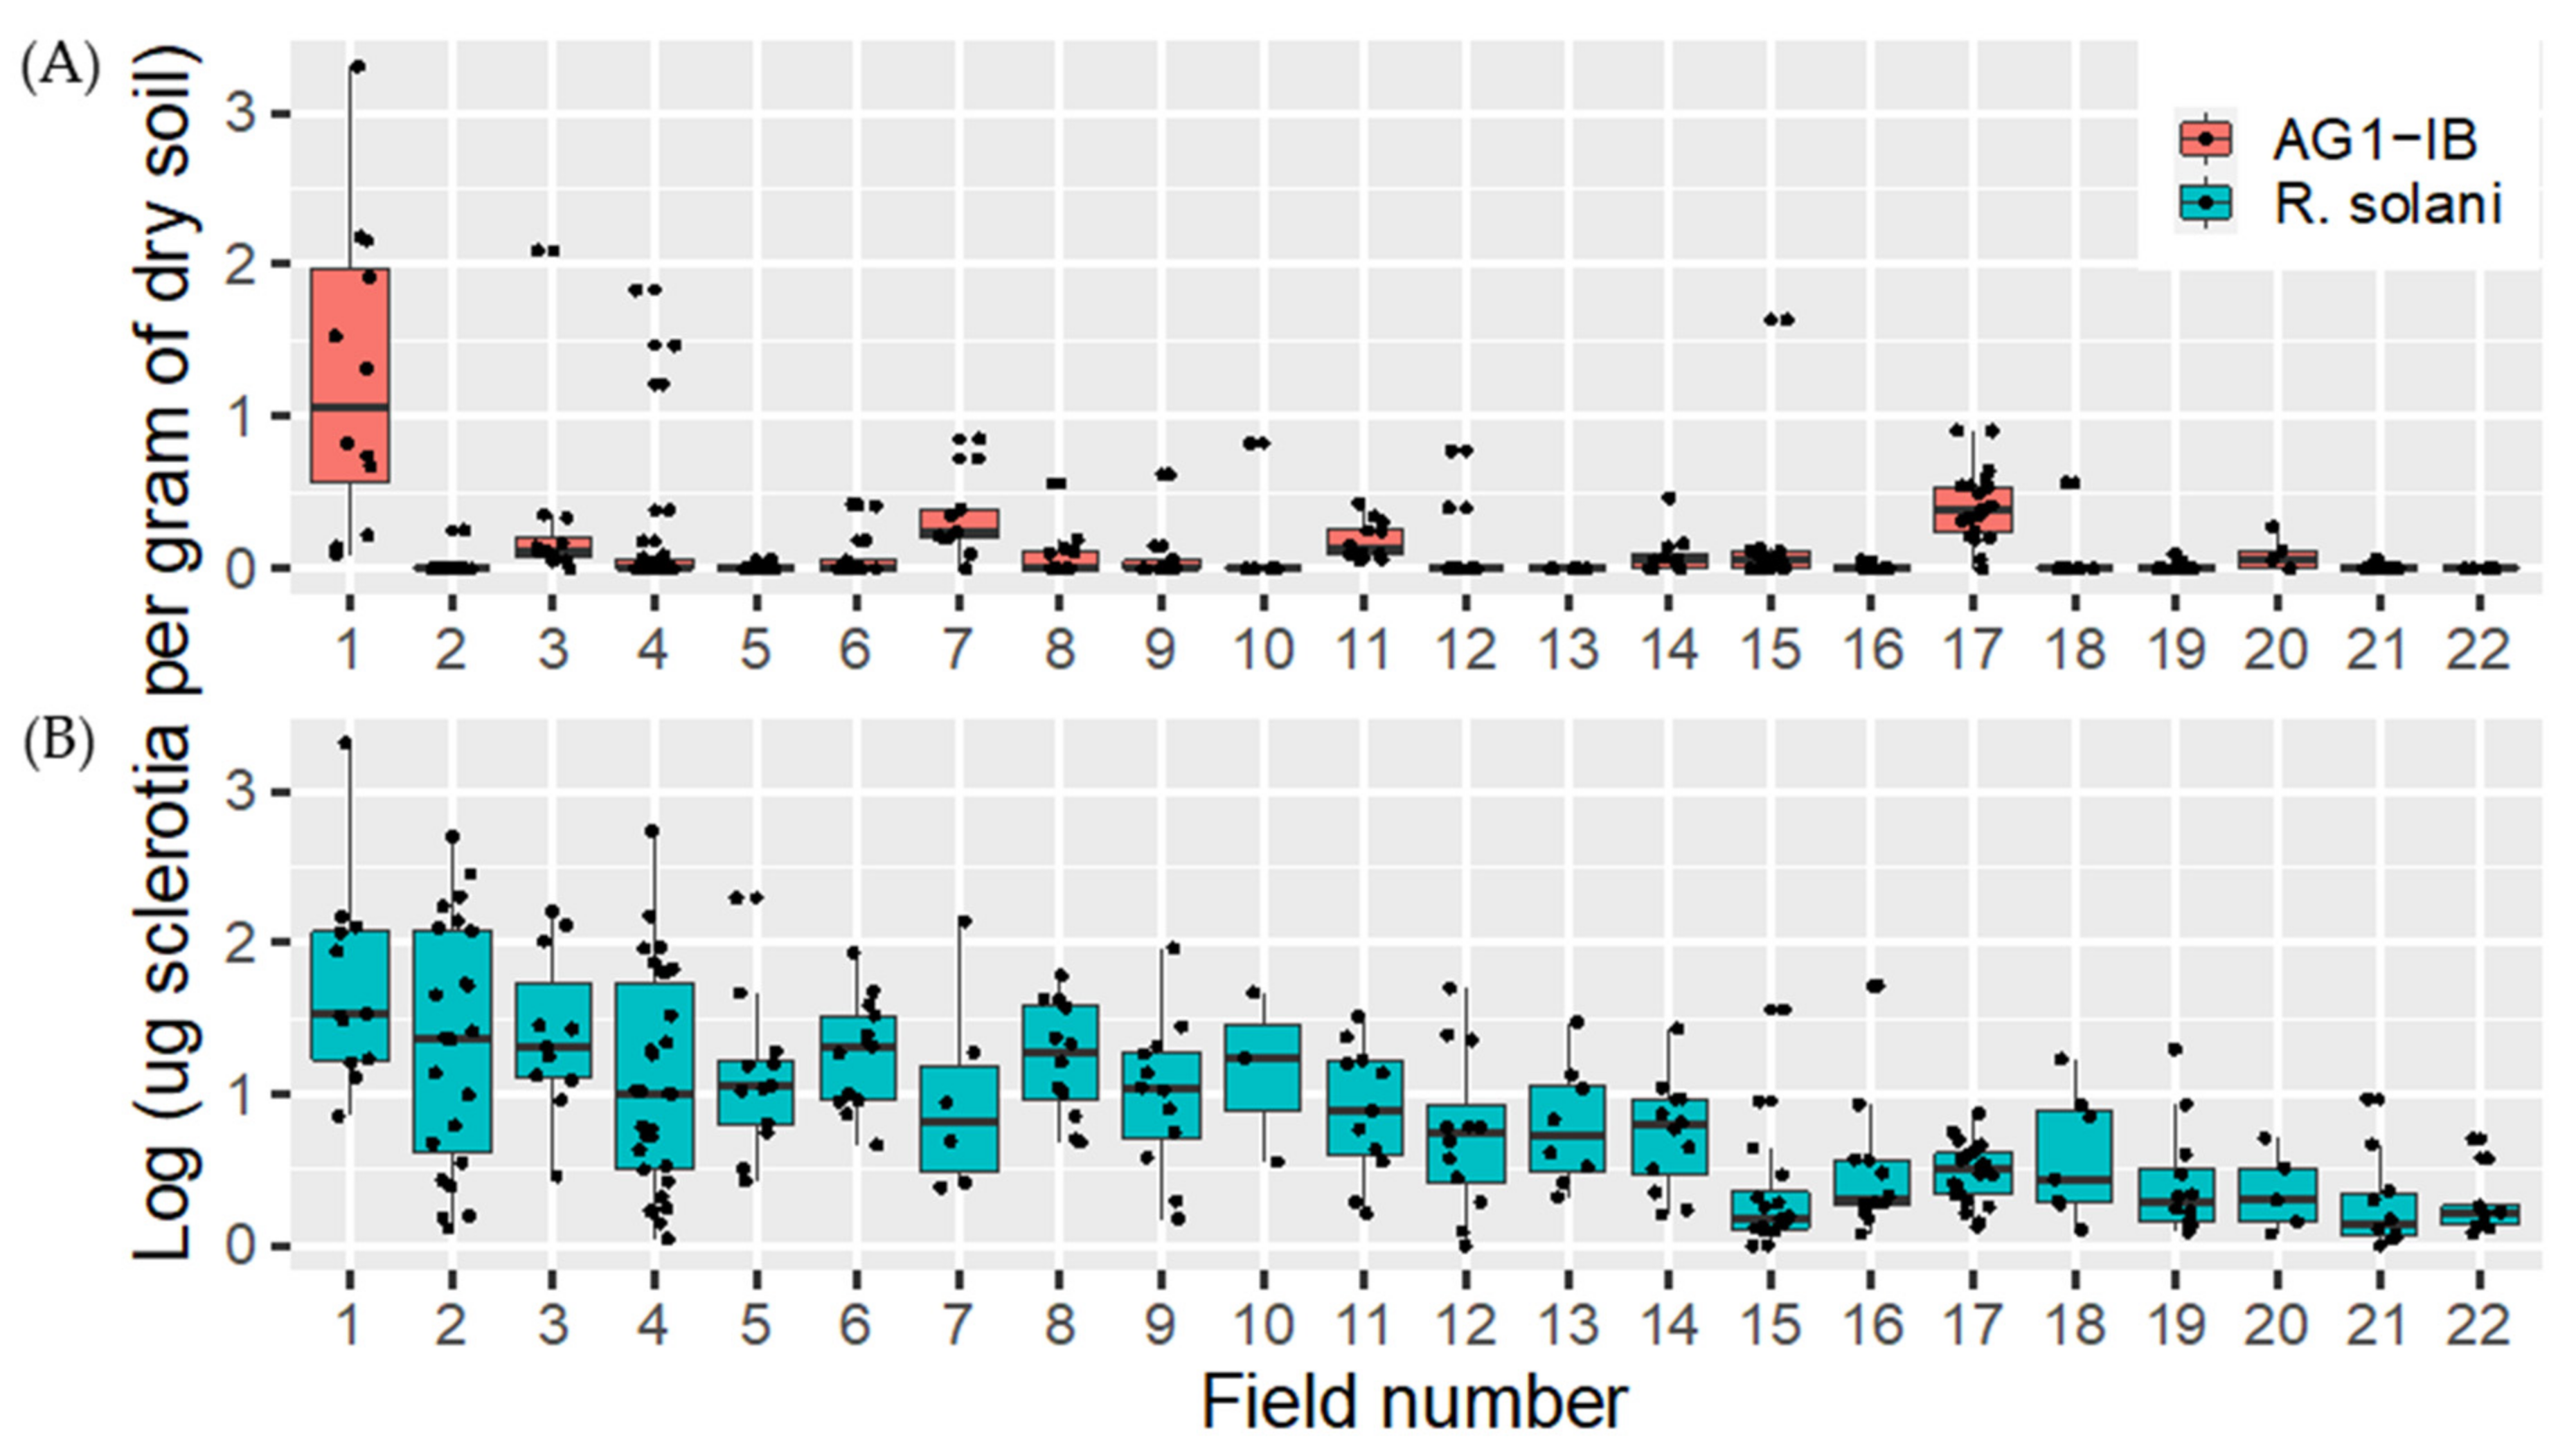
2.4.2. Rhizoctonia solani and Rhizoctonia solani AG1-IB Soil Distribution

In 2017 and 2018, a total of 284 soil samples were collected in 22 fields. These soil samples were processed and tested using the method described in this study for both R. solani and R. solani AG 1-IB. Globally, 98.5% of the samples tested were positive for R. solani, with concentrations ranging from 0 to 2082.9 μg of sclerotia per gram of dry soil, while 43.3% were positive for R. solani AG 1-IB, with concentrations ranging from 0 to 2010.5 μg of sclerotia per gram of dry soil (Figure 6). As expected, the average concentration of R. solani AG-1-IB was lower than the concentration measured for R. solani, suggesting that most of the DNA detected in the samples tested belong to other anastomotic groups.

3. Discussion

In Canada and elsewhere, the main method of controlling lettuce basal rot is based on crop rotation. In this context, it is essential to keep the inoculum concentration as low as possible. Thus, accurate knowledge of the anastomosis groups present and reliable quantification can allow better monitoring and contribute to improved and more efficient management.
The results obtained in this study suggest a high prevalence of R. solani AG1-IB causing bottom rot in Quebec lettuce. This is consistent with the findings from other regions of the world where R. solani AG 1-IB is highly prevalent and virulent in field lettuce [5,7,19]. Rhizoctonia solani AG 1-IC and AG-BI were also found in Quebec lettuce. The presence of R. solani AG 1-IC has also been reported in the United States and Germany [5,7]. This is the second study reporting the isolation of R. solani AG-BI from a diseased lettuce plant in the field.
Indeed, AG-BI is mostly found in soil and has long been considered non-pathogenic or weakly pathogenic when tested in a pathogenicity assay, but it was recently isolated from symptomatic plants on lettuce grown in greenhouse soil [12,16]. Studies have reported higher virulence and greater symptoms of AG 1-IB in lettuce compared to AG 1-1C and AG-BI [5,16]. Rhizoctonia solani AG 1-IC has also been shown to be pathogenic on lettuce [37]. Although not all R. solani AG1-IB isolates showed the same degree of virulence, several strains were able to infect broccoli, spinach, and radish [7]. All of these crops are grown in the Québec muck soil region and are likely to be part of the crop rotation plan with lettuce. Such crops could, therefore, constitute a reservoir for AG1-IB and help maintain a certain level of inoculum in the soil.
Following identification of the predominant AG associated with basal rot symptoms in Québec lettuce production, a molecular assay was developed for the detection of R. solani AG1-IB from plant tissues and soil samples. The ITS region has already been used for the detection of R. solani and was proven to be an appropriate barcode to resolve the AG-1 subgroup [38]. SCAR primers were previously developed for AG1-IB but were not adapted for soil samples and could not be quantitative [38]. The ITS region showed great diversity among its R. solani AGs, which allowed the successful design of a specific primer and probe set. The specificity of the assay was shown by testing several R. solani isolates representing a wide range of AGs from multinucleate and binucleate Rhizoctonia. Although our results suggest that AG1-IB is primarily responsible for lettuce basal rot, several other AGs can also infect lettuce in different growing regions. It was, therefore, important to provide a tool to capture as many AGs as possible while excluding binucleate Rhizoctonia (AGs), as these AGs are often non-pathogenic or reported to have a neutral or beneficial relationship with the plant [11]. All multinucleate strains were positive with the R. solani assay, but two AG-E strains of Binucleate Rhizoctonia were also positive (Table 2). Nevertheless, AG-E has a wide host range and has been reported on several crops, including lettuce, so it may be useful to include it when detecting R. solani in the environment [3]. Moreover, this assay represents an improvement of the previously described SYBR green assay, as it allows absolute quantification of the R. solani inoculum in plant and soil material [36,39].
Obtaining an accurate diagnosis is essential for adjusting integrated management strategies. Although it is relatively simple to identify R. solani on a culture medium, determining the anastomosis group using such techniques remains relatively complex. For the field samples collected in this study, the results obtained by isolation on a culture medium combined with ITS sequencing were consistent with the detection obtained by qPCR conducted with lettuce tissues. In general, the qPCR-based assay allowed a faster diagnosis than microbiological methods. Thus, when used in pairs, the qPCR assays proposed in this study confirm the presence of R. solani on rot lesions and determine whether this is the predominant AG 1-IB or not. The use of the R. solani marker alone may lead to false-positive results but since AG-BI, AG-1-IC, and other AGs can induce symptoms, it remains important to use this marker. When the sample is positive for R. solani and negative for AG 1-IB, an ITS1-GRSM4 PCR followed by sequencing can be performed to determine the AG present in the sample, thereby avoiding the use of the microbiological isolation method [40].
In addition to high specificity, the tests that were developed in this project had a high sensitivity. The protocol developed in this study allows the detection of 1 μg of sclerotia per gram of dry soil for R. solani and R. solani AG 1-IB. A SCAR marker was previously developed for AG1-IB, which allowed detection in soils, but the detection limit was 0.01 g sclerotia per gram of soil. The method proposed here, therefore, represents an improvement over the latter, since it offers sensitivity more than 5 logs higher than the previous method. The detection limit obtained in this study can be compared to other similar studies where the detection limit was around 0.1 μg sclerotia per gram of soil for, e.g., AG2-1, and 500 μg sclerotia per gram of soil for AG3 [32,33]. Several research groups have developed molecular assays to specifically detect anastomotic groups in different soil types, and all agree that the sensitivity of a molecular assay evaluated with field samples depends directly on the type of molecular technique used (PCR vs. qPCR) but also on the sampling techniques, the pre-treatments performed on the field sample before DNA extraction, and the DNA extraction technique itself [32,33]. Considering that Rhizoctonia solani often has an uneven distribution pattern in the field [32,41] and that Rhizoctonia solani is a sclerotia-producing fungus, this fungus is particularly difficult to reproduce with respect to DNA extraction without proper sample homogenization [24,42]. To illustrate the importance of homogenization and conditioning techniques prior to extraction, it is interesting to note that we obtained a detection threshold identical to that in a study by Budge et al. [33] using a DNA extraction of 0.2 g versus 4 g. In our protocol, we included a soil homogenization step with a mechanical method upstream of our extraction protocol. A total of 100 g of soil was crushed, which allowed us to crush the sclerotia and thus probably standardize the presence of the inoculum within the soil sample.
The results from growth chamber trials suggest that sclerotia concentrations between 5 and 14 μg per gram of soil can induce basal rot symptoms in lettuce, and for those above 42 μg sclerotia per gram of soil, the symptoms are significantly greater. The qPCR test developed in this study was effective in detecting up to 1 μg of sclerotia per gram of dry soil, which is well below the theoretical disease threshold found in the growth chamber trials. These results, therefore, suggest that the detection limit of the qPCR test developed in this project is sufficiently sensitive to be used for the development of risk indicators. The results obtained in this trial are supported by those obtained by Grosh and Kofoet [19], who demonstrated that there is a positive correlation between the concentration of artificially inoculated AG1-IB in the soil and the inhibition of lettuce growth.
Validation of the assays with environmental samples confirmed the ability of the assays to detect R. solani and AG1-IB in soils and reinforces the potential of these markers for biomonitoring and studying the epidemiology of this pathogen. It has been shown in the field that short rotations and soil temperatures influence the severity and frequency of field losses [31]. To develop an integrated risk management model, it will be necessary to correlate the development of symptoms in the field with the soil inoculum and also with other meteorological parameters since environmental factors are clearly as important as the presence of the inoculum itself.

4. Materials and Methods

4.1. Field Sampling

Plant and soil samples were collected from the muck soil of southwestern Québec, from 2015 to 2018. Iceberg and romaine lettuce plants showing basal rot symptoms were taken from 31 commercial lettuce fields belonging to 8 different growers. The collected plants were refrigerated at 4 °C prior to sample preparation and pathogen isolation. In 2017 and 2018, soil samples were also collected from a total of 22 fields belonging to 4 lettuce growers. Each soil sample was composed of 15 random soil subsamples collected within a 5 m × 5 m quadrant in the first 15 cm from the soil surface. Upon sampling, 100 g sub-samples were homogenized, poured into an aluminum plate, air-dried at room temperature for 48 h, and prepared for DNA extraction (see Section 4.3).

4.2. Rhizoctonia Solani Isolation and Culture Method

For each of the diseased lettuce plants collected, leaves showing bottom rot symptoms were washed under running water and cut into 10 mm discs. These discs were then placed in sterile water for 1 min, surface sterilized with a 1% sodium hypochlorite solution for 1 min, and rinsed again with sterile water for another minute. The sterilized leaf discs were placed on a water agar media (WA) and/or potato dextrose agar (PDA) amended with 0.1 g per liter novobiocin. Another 0.2 g of the remaining leaf discs was placed in a lysing matrix tube C (MP Biomedicals, Solon, OH, USA) and frozen until DNA extraction (see Section 4.3). Petri dishes containing the leaf discs were incubated at room temperature for 24 to 72 h, after which fresh mycelium taken from the edge of the growing colony was transferred onto a new Petri containing PDA without antibiotics. Once the R. solani isolates formed sclerotia, fresh mycelium was scratched from the surface of the Petri plate and placed in a sterile 2 mL tube with 100 mg of 500–750 µm bead glass and then frozen until DNA extraction.

4.3. Fungal, Plant, and Soil DNA Extraction

DNA from both mycelium and plant samples was extracted using the Fast DNA Spin Kit (MP Biomedicals, Solon, OH, USA) with a CLS-VF buffer, following the manufacturer’s instructions. For soil, the dried sub-samples were ground for 30 s using a mill grinder, and 0.2 g of the resulting powder was placed in a matrix tube D (MP Biomedicals, Solon, OH, USA). Total DNA was extracted using a Fast DNA Spin Kit for soil (MP Biomedicals, Solon, OH, USA) following the manufacturer’s instructions. Regardless of the sample type, the final DNA elution was performed using 100 uL of pre-heated (55 °C) provided elution buffer. The concentration and quality of each purified DNA sample were estimated using a Nano-Drop lite spectrophotometer (Thermo Scientific, Mississauga, ON, Canada). DNA extracts with a quantity above 10 ng/uL and A260/A280 ratio around 1.8 were kept.

4.4. Rhizoctonia Solani Isolate Characterization

The AG of each R. solani isolate was identified by sequencing the internal transcribed spacer region (ITS) [14]. The ITS region was amplified using the universal ITS1/ITS4 primers (Table 1) [42]. The amplification mix contained 500 nM of each primer, 1x of the Phusion High-Fidelity PCR Master Mix with HF Buffer (New England Biolab, Ipswich, MA, USA), 0.2 μg uL−1 of BSA, and 5 uL of the template DNA in a total reaction volume of 35 uL. The PCR cycling conditions were set to 98 °C for 2 min, 35 cycles at 98 °C for 10 s, 60 °C for 15 s, and 72 °C for 30 s, followed by a final extension step at 72 °C for 10 min. The PCR products were visualized by electrophoresis on an agarose gel and sent to the Centre de Recherche du CHUL/CHUQ at Laval University to be purified and sequenced using an ITS4 primer. Each DNA sequence was visualized and manually trimmed using Geneious V9.1.8 (Biomatters, Auckland, New Zealand). Sequences were aligned using the NCBI tool BLASTN to identify the sequence with the highest homology. To avoid misidentification, sequences were also aligned with a pool of R. solani ITS reference sequences using Geneious V9.1.8. A total of 60 R. solani isolates obtained from lettuce were sequenced in addition to other R. solani isolates collected from other crops (Figure 1).

4.5. Design of Rhizoctonia solani and Rhizoctonia solani AG1-IB qPCR Assays on ITS

A total of 87 R. solani and Binucleate Rhizoctonia ITS sequences obtained in this study or from the GenBank database were aligned using the MAFT alignment tool available in Geneious V9.1.8 [14,15,43]. Out of the R. solani alignment, a consensus nucleotide sequence unique to AG 1-IB was chosen for the primers and probe designed using Primer Express V3.0.1 (Life technologies, Carlsbad, CA, USA). A set of primers (AG 1-IB-F3 and AG 1-IB-R) and a probe (AG 1-IB-P) were obtained, producing a 90 pb PCR amplification product (Table 1). For R. solani, a probe (GRMP) was designed to be used with the previously described GMRS3-R PCR primer [38] and a slightly modified version of the GMRS4 reverse primer (Table 1) (Johanson, 1998). Potential secondary structures, such as hairpin, self-dimer, and hetero-dimer interactions, were checked using the oligoanalyzer tool from Integrated DNA Technologies (https://www.idtdna.com/pages/tools/oligoanalyzer). The specificity of the primers and probe set was first verified by a BLASTN analysis of each sequence in the NCBI database (https://blast.ncbi.nlm.nih.gov/Blast.cgi).

4.6. qPCR Conditions of Rhizoctonia solani and Rhizoctonia solani AG-1-IB Assays

For the R. solani simplex assay, the qPCR was conducted in a final volume of 25 uL containing 1X ECO master mix (Thermofisher, Mississauga, On, Canada), 500 nM each of the GRSM3 and GRSM4 primers, 250 nM of the GRMP probe, 0.2 μg uL−1 of BSA, 6 mM MgCl2, and 3 uL of the template DNA. An R. solani AG-1-IB assay was also conducted in a final volume of 25 uL containing 1X ECO master mix (Thermofisher), 400 nM each of the AG 1-IB-F3 and AG 1-IB-R primers, 200 nM of the AG 1-IB-P probe, 0.2 μg uL−1 of BSA, 6 mM MgCl2, 1% DMSO, and 3 uL of the template DNA. The qPCR cycling conditions for both qPCR assays were set at 95 °C for 5 min, followed by 40 cycles at 95 °C for 5 s and 62 °C for 20 s. The qPCR assays were performed using a QuantStudio 3 qPCR instrument (Thermofisher, Mississauga, ON, Canada), and each sample was run in duplicate on a 96-well plate containing a normalized standard curve. For both assays, the standard curves consisted of a 10-fold serial dilution ranging from 9 to 900,000 ITS copies. For the AG1-IB assay, a standard was built from a 150 bp double-stranded synthesized DNA gblock fragment from Integrated DNA Technologies (Coralville, IA, USA) based on the AG 1-IB ITS consensus sequence. For the R. solani assay, ITS1-ITS4-mixed PCR products of different AG strains (AG 1-IB, AG 2-2, AG 3, AG 4-HGII, AG 5, and AG 11) were used to capture as much variation as possible. Then, an exogenous internal control (IC) was multiplexed to each assay to detect PCR inhibition. The already published IC system EIPC100 was used as described in Reference [44]. The IC fragment consisted of double-stranded DNA genomic blocks designed from a random DNA sequence [44]. Three hundred nanomolar of each primer, 100 nM of the probe (Table 1), and a total of 10,000 copies of the gblock were added to each qPCR reaction. A comparison of the R. solani and AG-1-IB respective standard curves with or without IC was done to ensure that the duplex did not interfere with the assay sensitivity.

4.7. Specificity and Sensitivity of the Rhizoctonia solani and Rhizoctonia solani AG1-IB qPCR Assays

The specificity of the R. solani and R. solani AG1-IB assays was tested against the DNA of several R. solani samples belonging to different AG and Binucleate Rhizoctonia isolates collected in Québec from different host plants, as well as from ubiquitous fungi and other fungal organisms frequently isolated from lettuce (Table 2). A total of 0.1 ng of genomic DNA was used in each reaction. The sensitivity of both assays was determined using a 10-fold serial dilution ranging from 0.01 pg to 1000 pg of total R. solani DNA mix. The isolates U1097 (AG 1-IB), U512 (AG 2-2), U593 (AG 3), U578 (AG 4-HGII), U572 (AG-5), and P174 (AG 11) were used for the R. solani DNA mix, and isolates U117, U737, 333-J-1, 340-P8-1, 350-P7-1, 322-2-3, 302-1-2, 359-P1, and 352-P7-2 were used for the AG 1-IB DNA mix.

4.8. Validation with Artificially Inoculated Soil

The previously identified Rhizoctonia solani AG1-IB isolate 277.1 was grown on 90 mm Petri dishes containing PDA and incubated at room temperature for four weeks to promote sclerotia formation. At the end of the incubation period, the sclerotia were harvested, placed in a nylon mesh, washed under running water, and air-dried at room temperature for 48 h. The sclerotia were then sieved to keep only those with a diameter between 0.2 and 0.5 mm. Then, 300 mg of the sclerotia was thoroughly mixed to 30 g of dried organic soil to provide an initial concentration of 10,000 μg of sclerotia per gram of dry soil. From this concentration, a standard soil curve was prepared by mixing the inoculated soil with varying amounts of uninoculated soil to obtain concentrations ranging from 10,000 μg to 1 μg of sclerotia per gram of dry soil. A portion of the non-inoculated sterilized soil was used as a negative control. For each concentration, DNA extraction was performed as described in Section 4.3, and the DNA obtained was quantified using the qPCR assays developed in this project. This experiment was repeated four times.

4.9. Growth Chamber Assays

To verify that the qPCR detection limit in soil was not above the theoretical damage threshold, an inoculation experiment was performed under controlled conditions. The sclerotia were obtained from isolate 277.1 grown on PDA at room temperature for four weeks and harvested as described above. Inoculated soils were prepared to obtain concentrations of 0, 3, 8, 24, 72, 216, and 648 sclerotia in 800 g of fresh soil, corresponding to approximately 0, 5, 14, 42, 125, 375, and 1124 μg of sclerotia per g of dry soil. The inoculated soils were distributed in 1 L pots at the bottom, in which a 2 cm layer of sand was previously settled. A three-week-old lettuce plant (iceberg, c.v. Estival) was transplanted in each pot and then placed in a growth chamber following a randomized complete block design with four blocks and one replicate per concentration per block. Conditions in the growth chamber were set to 25 °C, with 80% relative humidity and a 14 h photoperiod. The plants were grown for 20 days and watered equally each day. The experiment was repeated twice.
Basal rot severity was evaluated for each plant every five days on a zero to three scale based on Grosch et al. (2010). A total of four evaluations were done in each experiment. Disease severity was evaluated using a four-category index (0—no distinct symptoms; 1—symptoms only on the first lower leaves in direct contact with the soil and small brown to dark spots primarily on the undersides of the leaf midribs; 2—brown spots on the leaf midribs in the lower and next upper leaf layers and rotting midribs and leaf blades; and 3—severe disease symptoms on the upper leaf layers and the beginning of head rot to total head rot) [7]. The area under the disease progress curve (AUDPC) was calculated to provide a single value that includes all the evaluations. The AUDPC was calculated as follows:
A U D P C   =   i N i 1 y i + y i + 1 2 t i + 1 t i
where y i is the disease severity at time t i .

4.10. Statistical Analysis

Linear regression analysis was performed to describe the relationship and best fit lines for R. solani and R. solani AG1-IB gDNA and gBlock-based standard curves (Cq values against the log of the concentration), with and without an internal control. qPCR efficiency was calculated using the following equation:
E = 10−(1/slope) − 1
The sensitivity and limits of detection in artificially inoculated soils were determined using an analysis of variance (ANOVA) followed by an LSD multiple comparison test. To characterize the relationship between inoculum density and disease severity in the artificial inoculation assay, an analysis of variance (ANOVA) followed by an LSD multiple comparison test was also performed. All statistical analyses were conducted using functions implemented in R (version 3.6.3).

Supplementary Materials

The following are available online at https://www.mdpi.com/2223-7747/10/1/57/s1, Figure S1: Sequence alignment of the internal transcribed spacer 1 region for Rhizoctonia solani strains collected from lettuce in this study. Figure S2: Sequence alignment of Rhizoctonia solani internal transcribed spacer sequences for AG1-IB and AG-BI. Supplementary Figure S3: Diagram showing the position of the AG1-IB and R. solani assay on the internal transcribed spacer region. Figure S4: Sequence alignment of Rhizoctonia solani internal transcribed spacer sequences used for the design of the GRMP probe in combination with the existing GRSM3-GRSM4 primers. Figure S5: Sequence alignment of internal transcribed spacer sequences for the AG1 sub-group. Figure S6: Alignment of R. solani internal transcribed spacer sequences used for the design of the AG1-IB primers and probe. Figure S7: Examples of PCR product visualisation on 2% agarose gel for the AG 1-IB qPCR assay with DNA from various AGs and other lettuce pathogens. Figure S8: Examples of PCR product visualisation on 2% agarose gel for the R. solani qPCR assay with DNA from various AGs and other lettuce pathogens. Table S1: Cycle quantification threshold (Cq) values obtained for the gDNA standard curves presented in Figure 2A for the AG1-IB assay. Table S2: Cycle quantification threshold (Cq) values obtained for the gDNA standard curves presented in Figure 2B for the R. solani assay. Table S3: Cycle quantification threshold (Cq) values obtained for the amplicon standard curves presented in Figure 3 for the AG1-IB and the R. solani assay. Table S4: Cycle quantification threshold (Cq) values obtained for the amplicon standard curves with and without internal control, as presented in Figure 3 for the AG1-IB and the R. solani assay. Table S5: Cycle quantification threshold (Cq) values obtained for the standard curves obtain from artificial inoculation of sterilized soil, as presented in Figure 4 for the AG1-IB and the R. solani assay.

Author Contributions

Conceptualization, H.V.d.H. and T.W.; methodology, H.V.d.H. and T.W.; formal analysis, T.W. and A.S.; investigation, T.W. and A.S.; validation, H.V.d.H.; writing—original draft preparation, T.W.; writing—review and editing, H.V.d.H. and A.S.; project administration, H.V.d.H.; funding acquisition, H.V.d.H. and T.W. All authors have read and agreed to the published version of the manuscript.

Funding

Funding for this project was provided in part by the Québec Ministère de l’Agriculture, des Pêcheries et de l’Alimentation through the Innov’Action program, as part of the Canadian Agricultural Partnership initiative and trough component 3.2 of the Prime-Vert program (2013–2018), and the financial assistance received from the Ministère de l’Agriculture, des Pêcheries et de l’Alimentation (MAPAQ) through the Green Fund (grant number: PV-3.2-PHYT-22).

Institutional Review Board Statement

Not applicable.

Informed Consent Statement

Not applicable.

Data Availability Statement

The data presented in this study are available as supplementary material.

Acknowledgments

The authors would like to thank the growers who are members of the PRISME consortium for providing the database used in this project. The authors are also thankful to all the PRISME agronomists, crop specialists, and summer students who contributed to the collection of field data.

Conflicts of Interest

The authors declare no conflict of interest.

References

  1. Mailvaganam, S. Seasonal Fruit and Vegetable Annual Summary Reports; Fruit and Vegetable Survey, Statistics Canada: Ottawa, ON, Canada, 2017.
  2. Van der Heyden, H.; Wallon, T.; Lévesque, C.A.; Carisse, O. Detection and quantification of Pythium tracheiphilum in soil by multiplex real-Time qPCR. Plant Dis. 2019, 103, 475–483. [Google Scholar] [CrossRef] [PubMed] [Green Version]
  3. Sneh, B.; Burpee, L.; Ogoshi, A. Identification of Rhizoctonia Species; APS Press: St-Paul, MN, USA, 1998. [Google Scholar]
  4. Anderson, N.A. The genetics and pathology of Rhizoctonia solani. Annu. Rev. Phytopathol. 1982, 20, 329–347. [Google Scholar] [CrossRef]
  5. Herr, L.J. Characteristics of Rhizoctonia isolates associated with botton rot of lettuce in organic soils in Ohio. Phytopathology 1992, 82, 1046–1050. [Google Scholar] [CrossRef]
  6. Davis, M.; Subbarao, K.; Raid, R.; Kurtz, E. Compendium of Lettuce Diseases; Davis, M., Ed.; APS Press: St Paul, MN, USA, 1997. [Google Scholar]
  7. Grosch, R.; Schneider, J.H.M.; Kofoet, A. Characterisation of Rhizoctonia solani anastomosis groups causing bottom rot in field-Grown lettuce in Germany. Eur. J. Plant Pathol. 2004, 110, 53–62. [Google Scholar] [CrossRef]
  8. Kuramae, E.E.; Buzeto, A.L.; Ciampi, M.B.; Souza, N.L. Identification of Rhizoctonia solani AG 1-IB in Lettuce, AG 4 HG-I in tomato and melon, and AG 4 HG-III in broccoli and spinach, in Brazil. Eur. J. Plant Pathol. 2003, 109, 391–395. [Google Scholar] [CrossRef]
  9. Muzhinji, N.; Truter, M.; Woodhall, J.W.; van der Waals, J.E. Anastomosis groups and pathogenicity of Rhizoctonia solani and binucleate Rhizoctonia from potato in South Africa. Plant Dis. 2015, 99, 1790–1802. [Google Scholar] [CrossRef] [Green Version]
  10. Woodhall, J.; Webb, K.; Harper, G.; Peters, J.; Rodriguez-Carres, M.; Cubeta, M. First report of a new binucleate Rhizoctonia on potato tubers in the UK. New Dis. Rep. 2011, 23. [Google Scholar] [CrossRef] [Green Version]
  11. Jabaji-Hare, S.; Neate, S.M. Nonpathogenic binucleate Rhizoctonia spp. and benzothiadiazole protect cotton seedlings against Rhizoctonia damping-off and Alternaria leaf spot in cotton. Phytopathology 2005, 95, 1030–1036. [Google Scholar] [CrossRef] [Green Version]
  12. Carling, D.E.; Kuninaga, S.; Brainard, K.A. Hyphal anastomosis reactions, rDNA-internal transcribed spacer sequences, and virulence levels among subsets of Rhizoctonia solani anastomosis group-2 (AG-2) and AG-BI. Phytopathology 2002, 92, 43–50. [Google Scholar] [CrossRef] [Green Version]
  13. Toda, T.; Mghalu, J.; Priyatmojo, A.; Hyakumachi, M. Comparison of sequences for the internal transcribed spacer region in Rhizoctonia solani AG 1ID and other subgroups of AG 1. J. Gen. Plant Pathol. 2004, 70, 270–272. [Google Scholar] [CrossRef]
  14. Sharon, M.; Kuninaga, S.; Hyakumachi, M.; Naito, S.; Sneh, B. Classification of Rhizoctonia spp. using rDNA-ITS sequence analysis supports the genetic basis of the classical anastomosis grouping. Mycoscience 2008, 49, 93–114. [Google Scholar] [CrossRef]
  15. Broders, K.D.; Parker, M.L.; Melzer, M.S.; Boland, G.J. Phylogenetic diversity of Rhizoctonia solani associated with canola and wheat in Alberta, Manitoba, and Saskatchewan. Plant Dis. 2014, 98, 1695–1701. [Google Scholar] [CrossRef] [PubMed] [Green Version]
  16. Claerbout, J.; Decombel, A.; Volckaert, A.; Venneman, S.; Vandevelde, I.; Bleyaert, P.; Neukermans, J.; Viaene, N.; Höfte, M. Glasshouse-specific occurrence of basal rot pathogens and the seasonal shift of Rhizoctonia solani anastomosis groups in lettuce. Eur. J. Plant Pathol. 2019, 155, 841–858. [Google Scholar] [CrossRef]
  17. Beneden, S.; Pannecoucque, J.; Debode, J.; Backer, G.; Höfte, M. Characterisation of fungal pathogens causing basal rot of lettuce in Belgian greenhouses. Eur. J. Plant Pathol. 2008, 124, 9–19. [Google Scholar] [CrossRef]
  18. Wareing, P.W.; Wang, Z.N.; Coley-Smith, J.R.; Jeves, T.M. Fungal pathogens in rotted basal leaves of lettuce in Humberside and Lancashire with particular reference to Rhizoctonia solani. Plant Pathol. 1986, 35, 390–395. [Google Scholar] [CrossRef]
  19. Grosch, R.; Kofoet, A. Influence of temperature, pH and inoculum density on bottom rot on lettuce caused by Rhizoctonia solani. Z. Pflanzenkrankh. Pflanzenschutz 2003, 110, 366–378. [Google Scholar]
  20. Ajayi-Oyetunde, O.O.; Bradley, C.A. Identification and characterization of Rhizoctonia species associated with soybean seedling disease. Plant Dis. 2016, 101, 520–533. [Google Scholar] [CrossRef] [Green Version]
  21. Boller, E.F.; Avilla, J.; Joerg, E.; Malavolta, C.; Wijnands, F.G.; Esbjerg, P.B. Integrated production: Principles and technical guidelines. Bull. OILB/SROP 2004, 27, 1–12. [Google Scholar]
  22. Panth, M.; Hassler, S.; Gurel, F.B. Methods for Management of Soilborne Diseases in Crop Production. Agriculture 2020, 10, 16. [Google Scholar] [CrossRef] [Green Version]
  23. Chellemi, D.O.; Gamliel, A.; Katan, J.; Subbarao, K.V. Development and deployment of systems-based approaches for the management of soilborne plant pathogens. Phytopathology 2015, 106, 216–225. [Google Scholar] [CrossRef] [Green Version]
  24. Bilodeau, G.J. Quantitative polymerase chain reaction for the detection of organisms in soil. CAB Rev. Perspect. Agric. Vet. Sci. Nutr. Nat. Resour. 2011, 6, 1–14. [Google Scholar] [CrossRef]
  25. Bilodeau, G.J.; Koike, S.T.; Uribe, P.; Martin, F.N. Development of an assay for rapid detection and quantification of Verticillium dahliae in soil. Phytopathology 2012, 102, 331–343. [Google Scholar] [CrossRef] [PubMed] [Green Version]
  26. Sayler, R.; Yang, Y. Detection and quantification of Rhizoctonia solani AG1 IA, the rice sheath blight pathogen, in rice using real-time PCR. Plant Dis. 2007, 91, 1663–1668. [Google Scholar] [CrossRef] [PubMed] [Green Version]
  27. Boine, B.; Renner, A.-C.; Zellner, M.; Nechwatal, J. Quantitative methods for assessment of the impact of different crops on the inoculum density of Rhizoctonia solani AG2-2IIIB in soil. Eur. J. Plant Pathol. 2014, 140, 745–756. [Google Scholar] [CrossRef]
  28. Bartholomäus, A.; Mittler, S.; Märländer, B.; Varrelmann, M. Control of Rhizoctonia solani in sugar beet and effect of fungicide application and plant cultivar on inoculum potential in the soil. Plant Dis. 2017, 101, 941–947. [Google Scholar] [CrossRef] [PubMed] [Green Version]
  29. Le Cointe, R.; Simon, T.E.; Delarue, P.; Hervé, M.; Leclerc, M.; Poggi, S. Reducing the use of pesticides with site-specific application: The chemical control of Rhizoctonia solani as a case of study for the management of soil-borne diseases. PLoS ONE 2016, 11, e0163221. [Google Scholar] [CrossRef]
  30. Brierley, J.L.; Hilton, A.J.; Wale, S.J.; Woodhall, J.W.; Lees, A.K. The relative importance of seed- and soil-borne Inoculum of Rhizoctonia solani AG-3 in causing black scurf on potato. Potato Res. 2016, 59, 181–193. [Google Scholar] [CrossRef]
  31. Grosch, R.; Schneider, J.H.M.; Kofoet, A.; Feller, C. Impact of continuous cropping of lettuce on the disease dynamics of bottom rot and genotypic diversity of Rhizoctonia solani AG 1-IB. J. Phytopathol. 2010, 159, 35–44. [Google Scholar] [CrossRef]
  32. Lees, A.K.; Cullen, D.W.; Sullivan, L.; Nicolson, M.J. Development of conventional and quantitative real-time PCR assays for the detection and identification of Rhizoctonia solani AG-3 in potato and soil. Plant Pathol. 2002, 51, 293–302. [Google Scholar] [CrossRef]
  33. Budge, G.E.; Shaw, M.W.; Colyer, A.; Pietravalle, S.; Boonham, N. Molecular tools to investigate Rhizoctonia solani distribution in soil. Plant Pathol. 2009, 58, 1071–1080. [Google Scholar] [CrossRef]
  34. Okubara, P.A.; Schroeder, K.L.; Paulitz, T.C. Identification and quantification of Rhizoctonia solani and R. oryzae using real-time polymerase chain reaction. Phytopathology 2008, 98, 837–847. [Google Scholar] [CrossRef] [PubMed] [Green Version]
  35. Sauvageau, A.; Gravel, V.; Van der Heyden, H. Soilborne inoculum density and environmental parameters influence the development of Pythium stunt caused by Pythium tracheiphilum in head lettuce crops. Plant Dis. 2019, 103, 1685–1692. [Google Scholar] [CrossRef] [PubMed]
  36. Johanson, A.; Turner, H.C.; McKay, G.J.; Brown, A.E. A PCR-based method to distinguish fungi of the rice sheath-blight complex, Rhizoctonia solani, R. oryzae and R. oryzae-sativae. FEMS Microbiol. Lett. 1998, 162, 289–294. [Google Scholar] [CrossRef] [PubMed] [Green Version]
  37. Hyakumachi, M.; Sumino, A. New morphological type (IC) in Rhizoctonia solani AG-1 isolated from the sugarbeet-manufactory-waste-soils and some of its characteristics (in Japanese with English summary). Jpn. J. Phytopathol. 1984, 50, 507–514. [Google Scholar] [CrossRef]
  38. Grosch, R.; Schneider, J.H.M.; Peth, A.; Waschke, A.; Franken, P.; Kofoet, A.; Jabaji-Hare, S.H. Development of a specific PCR assay for the detection of Rhizoctonia solani AG 1-IB using SCAR primers. J. Appl. Microbiol. 2007, 102, 806–819. [Google Scholar] [CrossRef]
  39. Copley, T.R.; Aliferis, K.A.; Jabaji, S. Maple bark biochar affects Rhizoctonia solani metabolism and increases damping-off severity. Phytopathology 2015, 105, 1334–1346. [Google Scholar] [CrossRef]
  40. Dubey, S.; Tripathi, A.; Upadhyay, B.; Atul, K. Development of conventional and real time PCR assay for detection and quantification of Rhizoctonia solani infecting pulse crops. Biologia 2016, 71, 133–138. [Google Scholar] [CrossRef]
  41. Paulitz, T.C. Spatial distribution of Rhizoctonia solani and Rhizoctonia oryzae at three different scales in direct-seeded wheat. Can. J. Plant Pathol. 2004, 26, 419. [Google Scholar]
  42. Ophel-Keller, K.; McKay, A.; Hartley, D.; Curran, J. Development of a routine DNA-based testing service for soilborne diseases in Australia. Australas. Plant Pathol. 2008, 37, 243–253. [Google Scholar] [CrossRef]
  43. White, T.J.; Bruns, T.; Lee, S.; Taylor, J. Amplification and Direct Sequencing of Fungal Ribosomal RNA Genes for Phylogenetics; Innis, M.A., Gelfand, D.H., Sninsky, J.J., White, T.J., Eds.; Academic Press: New York, NY, USA, 1990. [Google Scholar]
  44. Hua, G.K.H.; Bertier, L.; Soltaninejad, S.; Höfte, M. Cropping systems and cultural practices determine the Rhizoctonia anastomosis groups associated with Brassica spp. in Vietnam. PLoS ONE 2014, 9, e111750. [Google Scholar] [CrossRef] [Green Version]
Figure 1. Neighbor-joining consensus tree based on the alignment of 65 ITS sequences of Rhizoctonia solani and binucleate Rhizoctonia. Twenty-eight sequences were retrieved from Genbank, 17 were from lettuce isolates, 20 were isolated from other crops, and Athelia rolfsii (AY684917) was used as an outgroup. Bootstraps values (1000 replicates) are indicated only for branches with a value higher than 50.
Plants 10 00057 g001
Figure 2. Standard curves and regression of Rhizoctonia solani AG 1-IB and R. solani dilution series measured by qPCR. The cycle quantification threshold (Cq) is plotted against the log10 of (A) the picogram of R. solani AG 1-IB DNA belonging to several isolates. The results are from three independent experiments and (B) the picogram of R. solani DNA from isolates belonging to the AG1-IB, AG2-2, AG3, AG4-HGII, AG5, and AG11 groups. Cq values for these experiments are provided in Supplementary Tables S1 and S2.
Plants 10 00057 g002
Figure 3. Standard curves and regression of Rhizoctonia solani AG 1-IB and R. solani dilution series measured by qPCR. The cycle quantification threshold (Cq) is plotted against the log10 of (A) the R. solani AG1-IB ITS copy number with and without the EIPC100 internal control (IC) and (B) the number of R. solani AG-mix ITS copies with and without the EIPC100 IC. The results are from three independent experiments. These experiments were conducted using three biological replicates and two technical replicates for each biological replicate. Cq values for these experiments are provided in Supplementary Tables S3 and S4.
Plants 10 00057 g003
Figure 4. Linear regression of the mean cycle threshold (Cq) value plotted against the log10 of sclerotia (μg sclerotia g−1 of dry soil) of (A) Rhizoctonia solani AG1-IB and (B) R. solani, obtained from the artificial inoculation of sterilized muck soils. These experiments were conducted using four biological replicates and two technical replicates for each biological replicate. Cq values for these experiments are provided in Supplementary Table S5.
Plants 10 00057 g004
Figure 5. Results of the artificial inoculation trials performed under controlled conditions for R. solani AG 1-IB. Each boxplot shows the distribution of the combined results of the two experiments, with different letters indicating a significant difference between treatments according to an LSD test.
Plants 10 00057 g005
Figure 6. Box plot diagram showing the amount of (A) R. solani AG-1-IB log10 μg sclerotia per gram of dry soil and (B) Rhizoctonia solani log μg sclerotia per gram of dry soil detected by qPCR methods in commercial fields sampled in spring 2017 and 2018 prior to lettuce planting. The fields are placed in ascending order of their mean value for R. solani.
Plants 10 00057 g006
Table 1. Isolates of Rhizoctonia solani, Binucleate Rhizoctonia, and other pathogens used to test the specificity of the R. solani and R. solani AG 1-IB qPCR assays.
IsolateHostSpecies aAG Genbank AccessionqPCR Assays e
R. solaniR. solani AG 1-IB
U737 bLactuca sativaRhizoctonia solani1-IBMT17724222.7022.42
U1097 bLactuca sativaR. solani1-IBMT17724323.8623.79
302-1-2Lactuca sativaR. solani1-IBMT17723023.7323.97
333-B-1 bLactuca sativaR. solani1-IBMT17723125.1225.20
356-P3-2A bLactuca sativaR. solani1-IBMT17723223.0023.38
361-P4 bLactuca sativaR. solani1-IBMT17723323.6223.70
362-P5-1 bLactuca sativaR. solani1-IBMT17723423.1423.67
434-1 bLactuca sativaR. solani1-IBMT17723523.5623.71
437-6 bLactuca sativaR. solani1-IBMT17723622.3022.92
472-2 bLactuca sativaR. solani1-IBMT17723721.9921.64
473-3 bLactuca sativaR. solani1-IBMT17723821.5821.59
475-1 bLactuca sativaR. solani1-IBMT17723921.7921.72
569-3 bLactuca sativaR. solani1-IBMT17724023.5623.38
570-1 bLactuca sativaR. solani1-IBMT17724122.3522.48
506-1 bLactuca sativaR. solani1-ICMT17724423.47
642-6 bSpinacia oleraceaR. solani1-ICMT17724526.77
370-P3-A bLactuca sativaR. solaniBIMT17725924.92
523-1 bLactuca sativaR. solaniBIMT17726024.53
284-1 bRaphanus sativusR. solani2-1MT17724625.62
U782 bSpinacia oleraceaR. solani2-2MT17724823.93
U512 bDaucus carotaR. solani2-2MT17724724.22
U500 bDaucus carotaR. solani2-2-IVMT17725023.02
682-1 bDaucus carotaR. solani2-2-IVMT17724928.91
U593 bSolanum tuberosumR. solani3MT17725124.90
U658 bSolanum tuberosumR. solani3MT17725224.53
341-2 bRaphanus sativusR. solani4-HGIMT17725322.64
U578 bDaucus carotaR. solani4-HGIIMT17725430.45
U572 bDaucus carotaR. solani5MT17725625.76
390.Rs17-10 dGlycine maxR. solani5MT17725529.81
P174 bPisum sativum L. R. solani11MT17725725.09
U133 bLactuca sativaBinucleate RhizoctoniaAMT177258
390.Rs17-7 dGlycine maxBinucleate RhizoctoniaEMT17726125.69
534-6 dTriticum L.Binucleate RhizoctoniaEMT17726227.24
Rs.23251 c Fragaria × ananassaBinucleate RhizoctoniaGMT177263
534-2 dTriticum L.Binucleate RhizoctoniaHMT177264
390.Rs16-70 dGlycine maxBinucleate RhizoctoniaIMT177265
390.Rs16-71 dGlycine maxBinucleate RhizoctoniaKMT177266
343-5A-12 bApium graveolens L. Alternaria sp. MT177217
381-B2 bDaucus carotaBotrytis cinerea MT177218
LDCC01 cNDColletotrichum coccodes MT177219
U301 bLactuca sativaFusarium equiseti MT177220
U1416 bDaucus carotaF. graminearum MT177221
U197 bLactuca sativaF. oxysporum MT177222
357-P12-4B bLactuca sativaF. solani MT177223
U709 bLactuca sativaMortierella sp. MT177224
280-3 b Lactuca sativaPythium sylvaticum MT177227
U199 bLactuca sativaP. irregulare MT177225
U191 b Spinacia oleraceaP. oopapillum MT177226
U415 bDaucus carotaP. sulcatum MH023358
647-3 bLactuca sativaP. tracheiphilum MT177228
278-4 bSpinacia oleraceaP. ultimum MT177229
381-C1 bDaucus carotaSclerotinia sclerotiorum MT177267
U795 bGlycine maxTrichoderma sp. MT177268
Vda-18481 cNDVerticillium dahliae MT177269
a All species and AG group were determined by ITS (internal transcribed spacer) or EF (elongation factor alpha) sequencing. b Isolate from Phytodata collection. c Isolate provided by the Laboratoire d’expertise et de diagnostic en phytoprotection (MAPAQ). d Isolate provided by the Centre de recherche sur les grains (CEROM). e Negative reactions are indicated as –, and unexpected amplifications are in bold.
Table 2. Primers and probes used in this study.
TargetPrimers and Probes5′-3′ Nucleotide SequenceReference
ITSITS1TCC GTA GGT GAA CCT GCG G[30]
ITS4TCC TCC GCT TAT TGA TAT GC
EFEF1ATG GGT AAG GAR GAC AAG AC[31]
EF2GGA RGT ACC AGT SAT CAT GTT
GMRS3-RAGT GTT ATG CTT GGT TCC ACT
R. solaniGRSM4MCGG TTC RTC TGC ATT TAC CTTModified from [32]
GRMPFAM-CRG CGT GAT AAR TTA TCT ATC GCThis study
AG 1-IB-F3TGG CCT TTT AAC ATT GGC ATG TThis study
R. solani
AG 1-IB
AG 1-IB-RCCA ACC CCA AAG GAC CTT GA
AG 1-IB-PVIC-CAC ACA CCC CTG TGC ACT TGT GAG AC
EIPC1mt100FAGG CTA GCT AGG ACC GAT CAA TAGG[33]
IC-EIPC100EIPC1mt100RAGT GCT TCG TTA CGA AAG TGA CCT TA
EIPC1mt100PABY-CCT ATG CGT TCC GAG GTG ACG ACC TTG CC
Table 3. Validation of the detection of Rhizoctonia solani and Rhizoctonia solani AG1-IB in field lettuce samples presenting bottom rot symptoms by molecular assay with qPCR for which R. solani isolates were identified by culture method.
GrowerFieldSampleAG a IsolatedLettuce Type bqPCR Assays c
R. solaniR. solani AG 1-IB
1A4371-IBR++
4391-IBR++
4721-IBR++
2B4381-IBR++
4691-IBR++
C4341-IBI++
D5641-IBI++
5661-IBI++
5671-IBI++
5681-IBI++
5691-IBI++
5701-IBI++
5711-IBI++
370-P41-IBR++
370-P3BIR+
E523BIR+
F369-P21-IBR++
369-P71-IBR++
3G362-P5-11-IBI++
H337-P21-IBI++
I5061-ICI+
J5511-IBI++
5521-IBI++
4K333-B1-IBND++
333-E1-IBND++
333-J1-IBND++
a AG group of the isolates determined by ITS sequencing. b R: Romaine, I: Iceberg lettuce cultivars, ND: not determined. c Negative reactions are indicated as −.
Publisher’s Note: MDPI stays neutral with regard to jurisdictional claims in published maps and institutional affiliations.

