Article

Urban Fire Dynamics and Its Association with Urban Growth: Evidence from Nanjing, China

1
Department of Geographic Information Science, Hohai University, Nanjing 210098, China
2
Urban Big Data Centre, School of Social and Political Sciences, University of Glasgow, Glasgow G12 8QQ, UK
3
School of Environment, University of Auckland, Auckland 1142, New Zealand
4
College of Water Conservancy and Civil Engineering, South China Agriculture University, Guangzhou 510642, China
*
Author to whom correspondence should be addressed.
ISPRS Int. J. Geo-Inf. 2020, 9(4), 218; https://doi.org/10.3390/ijgi9040218
Submission received: 21 February 2020 / Revised: 16 March 2020 / Accepted: 4 April 2020 / Published: 6 April 2020

Abstract

:
Many Chinese cities currently are facing increased urban fire risks particularly at places such as urban villages, high-rise buildings and large warehouses. Using a unique historical fire incident dataset (2002–2013), this paper is intended to explore the urban fire dynamics and its association with urban growth in Nanjing, China, with a geographical information system (GIS)-based spatial analytics and remote sensing (RS) techniques. A new method is proposed to define a range of fire hot spots characterizing different phases of fire incident evolution, which are compared with the urban growth in the same periods. The results suggest that the fire events have been largely concentrated in the city proper and meanwhile expanding towards the suburbs, which has a similar temporal trend to the growth of population and urban land at the city level particularly since 2008. Most intensifying and persistent fire hot spots are found in the central districts, which have limited urban expansion but high population densities. Most new hot spots are located in the suburban districts, which have seen both rapid population growth and urban expansion in recent years. However, the analysis at a finer spatial scale (500 m × 500 m) shows no evidences of an explicit connection between the locations of new fire hot spots and recently developed urban land. The findings can inform future urban and emergency planning with respect to the deployment of fire and rescue resources, ultimately improving urban fire safety.

1. Introduction

Urban fire has long been a significant threat to urban safety, the physical environment and quality of life. There were over 237,000 urban fire incidents in China in 2018, leading to 798 injuries, 1407 fatalities and direct economic loss of 3.67 billion Chinese Yuan (CNY) [1]. With the progress of urbanization, Chinese cities are challenged by increased and new fire risks. For example, the number of migrant workers reached over 0.28 billion in 2018—an increase of 27.9% compared with that of 2008 [2], many of whom are living in urban villages or outskirts that are often occupied by dense populations with shortages of firefighting equipment. During 2009-2014, in Guangzhou, about 4132 fires occurred in the urban villages, accounting for 57.4% of total fires and 70% of all fire fatalities in the city [3]. Additionally, high-rise buildings are a common solution to the rising population particularly in densely urbanized regions, but can have a serious impact on fire rescue and evacuation. By 2017, China had more than 347,000 high-rise buildings over eight stories or 24 m, and over 6000 higher than 100 m, about 40% of which were lacking automatic fire suppression systems [4], greatly reducing the chance of survival if a fire occurs. During 2007–2017, there were about 31,000 high-rise building fires, resulting in 474 deaths and direct property loss of 1.56 billion CNY [4]. Therefore, understanding urban fire dynamics, particularly in the context of urbanization, is of great significance and can inform future urban and emergency planning with respect to the deployment of fire and rescue resources, ultimately improving urban fire safety.
Of interest here are the spatiotemporal dynamics of urban fires, that is, the spatiotemporal patterns of fire incidents [5,6,7,8,9,10]. The distribution of urban fires often varies over space and time and closely relates to human activities and the physical environment, as well as demographic and socioeconomic factors [11]. For instance, places with higher population densities are more vulnerable to building fires [5,6]. Corcoran et al. [5] indicated that neighbourhoods with less white residents and lower education levels were more likely to suffer property fires in South Wales, UK. Špatenková and Virrantaus [6] found that factors such as densities of population and workplaces could greatly increase building fire risks in Helsinki, Finland, while the presence of households with children in the city centre might reduce the chance of fire occurrence. Guldåker and Hallin [7] suggested that urban areas with more stressful living conditions in Malmö, Sweden, were more prone to intentional fires. Regarding the time of fire incidents, evidence showed that fires were more likely to occur on weekdays and school holidays [8,9]. Zhang et al. [10] found that on average nearly one third of monthly or daily urban fires in Nanjing, China, occurred at residential properties during 2003–2012.
Comparatively, little is known regarding whether and how urban fire dynamics have been associated with urban development. It is not surprising because most existing studies have focused on the cases in developed countries (e.g., Australia, Sweden or the UK) [5,7,9]. In a developing country like China where cities have undergone fundamental transformations in urban landscape and social structures over the last four decades, it has been commonly acknowledged that the increased occurrence and intensified consequences of urban fires are closely related to the process of urbanization [12], particularly rapid population growth and urban expansion. For instance, the ten provinces in Eastern China, which have higher urbanization levels and population densities, accounted for 33.9% of all urban fires and 41.5% of all direct property loss from fire in the country in 2018 [1]. There is, however, little empirical evidence in similar previous studies that shows the link between urban fires and urban growth. This research will fill that gap through exploring urban fire dynamics in an urbanization context.
Another limitation of existing studies on urban fire is that there is no differentiation among either spatial or spatiotemporal fire hot spots (e.g., [5,8,10]). That is, all fire hot spots are of the same type, failing to capture the evolution of fire hot spots, which otherwise can be linked to different phases of urban development. Thus, another contribution of this research is that a new method is proposed to identify different types of spatiotemporal fire hot spots that characterize different phases of fire incident evolution, facilitating the comparison with urban growth in the same periods.
To this end, this paper attempts to investigate, taking Nanjing, China as a case study city, urban fire dynamics as well as its association with urban growth using a unique historical fire incident dataset and free remote sensing (RS) images. Growth of the urban population and urban land, as two major consequences of urbanization, will be adopted as a proxy for urban growth and compared with the fire events during the same period (2002–2013). The next section introduces the research framework, including materials (i.e., data and study area) and research methods (i.e., spatiotemporal analysis of urban fire patterns and change detection of urban land). This is followed by a presentation and interpretation of the results. The paper finishes with a summary of major findings and contributions, as well as a discussion of policy implications with respect to future smart urban fire management and planning.

2. Materials and Methods

The research framework is presented in Figure 1. Using historical fire incidents, satellite images and urban population data, the urban fire dynamics and urban growth, particularly urban expansion, were analysed separately using a range of methods including descriptive statistics, desktop mapping, spatiotemporal pattern analysis and land use/cover detection with random forest classifier. Then, the results of urban fire dynamics and urban growth were linked together to examine the potential associations between the two. Those would be detailed in the remainder of this section.

2.1. Data and Study Area

The study area of this research is Nanjing, the capital city of Jiangsu Province in Eastern China, which is located on the lower reaches of the Yangtze River. It contains eleven districts: six in the city proper (Gulou, Xuanwu, Jianye, Qinhuai, Qixia and Yuhuatai) and five in the suburbs (Jiangning, Luhe, Pukou, Lishui and Gaochun; Figure 2). As a centre of politics, economy, culture and education in Eastern China, as well as a key member of the Yangtze River Delta urban agglomeration, Nanjing has undergone rapid development in the last three decades. By 2018, the total population of Nanjing has increased to 8.4 million (with 82.5% permanent urban residents), about 1.6 times that in 1990, and the urban built-up area has reached 796 km2, about 6.2 times that in 1990 [13].
Figure 3 depicts the population density (permanent residents) in each urban district during 2005–2013(Statistics of permanent urban residents were only available from 2005 onwards). Obviously, the population density in the city proper was consistently higher than that in the suburbs, with over 1000 people/km2 in all central districts and below 850 people/km2 in the suburbs during this period. In particular, Gulou and Qinhuai were much more densely populated than the other districts, with over 20,000 people per square meters on average, which was nearly 50 times that of Lishui—the most sparsely populated district. Regarding the temporal trend, Pukou and Jiangning in the suburb had a sharp increase in population in 2010, while Gulou, Qinhuai and Jianye in the city proper saw a slight decline in the same year.
In order to meet the increasing demand for public services like housing and transportation due to rapid population growth, a number of properties and public infrastructures have been developed. For instance, the residential area of Nanjing increased from 125.6 in 2002 to 216.9 km2 in 2017 [14]. However, due to limited land resources within the city, most newly development properties are high-rise buildings (≥10 stories) and particularly there were over 70 buildings higher than 150 m by 2018 [13]. Regarding public transportation, the total length of bus lines (12,035 km) in 2018 had increased by 8.6 times compared with that in 1990 [13]. Since the first line opened in 2005, Nanjing metro had now expanded to ten lines and 174 stops with a total length of 377.6km and an annual ridership of 1.1 billion [13]. The changing urban landscape as well as fast population growth brought new challenges to urban fire and rescue services such as high-rise firefighting and evacuation from underground transport in the event of emergences.
The fire incident data used in this research contained all urban fires (about 39,230) that occurred in Nanjing during 2002-2013, provided by the Fire and Rescue Bureau of Nanjing and included the location and time of each fire event. In addition, all fires were grouped into ten categories based on the official classification (see [10]). The proportion of each fire type was as follows: dwellings (31.1%), grassland (14.9%), facilities (14.6%), refuse (12.7%), vehicles (10.9%), false alarm (3.7%), industrial (2.8%), non-residential buildings (2.5%), retail stores (2.6%) and others (4.3%). It is noteworthy that the dwelling fire category had a much higher share than all the other fire types, at nearly one third of all urban fires in Nanjing. Dwelling fires were proportionally the highest cause of urban fires in China overall, which in 2018 accounted for about 45.3% of urban fires and 79.7% of fire-caused death nationwide [1]. Additionally, when studying residential development for increased population, which often accompanied urban expansion, dwelling fires were most related to urban growth compared with other types of urban fires. Therefore, only total fires and dwelling fires would be considered in the subsequent analysis and discussion.
Figure 4 depicts the temporal variations of urban fires in Nanjing during the study period. It was evident that dwelling fires had a similar overall temporal pattern to total fires, both with moderate variations during 2002-2008 but rapid increases between 2008 and 2013. Specifically, the number of urban fires increased slightly until 2004 before dropping to the lowest value in 2008. It then grew at a much more rapid rate each year until 2013, as shown in Figure 4a,b.
Additionally shown in Figure 4 is the number of fire events within each urban district. Again, similar patterns could be observed for total and dwelling fires. Obviously, the six districts in the city proper accounted for most of the fire events in Nanjing, particularly for the years before 2010. Additionally, the three central districts, Gulou, Qinhuai and Xuanwu, by and large, had more fire events than the districts. Comparatively, the suburb witnessed a rapid growth in the share of both total (from 18.5% in 2002 to 40.6% in 2013) and dwelling fire (from 12.9% in 2002 to 36.2% in 2013), particularly in Jiangning, Luhe and Pukou. For Gaochun and Lishui, an evident share of total fire and dwelling fire only could be observed after 2009.

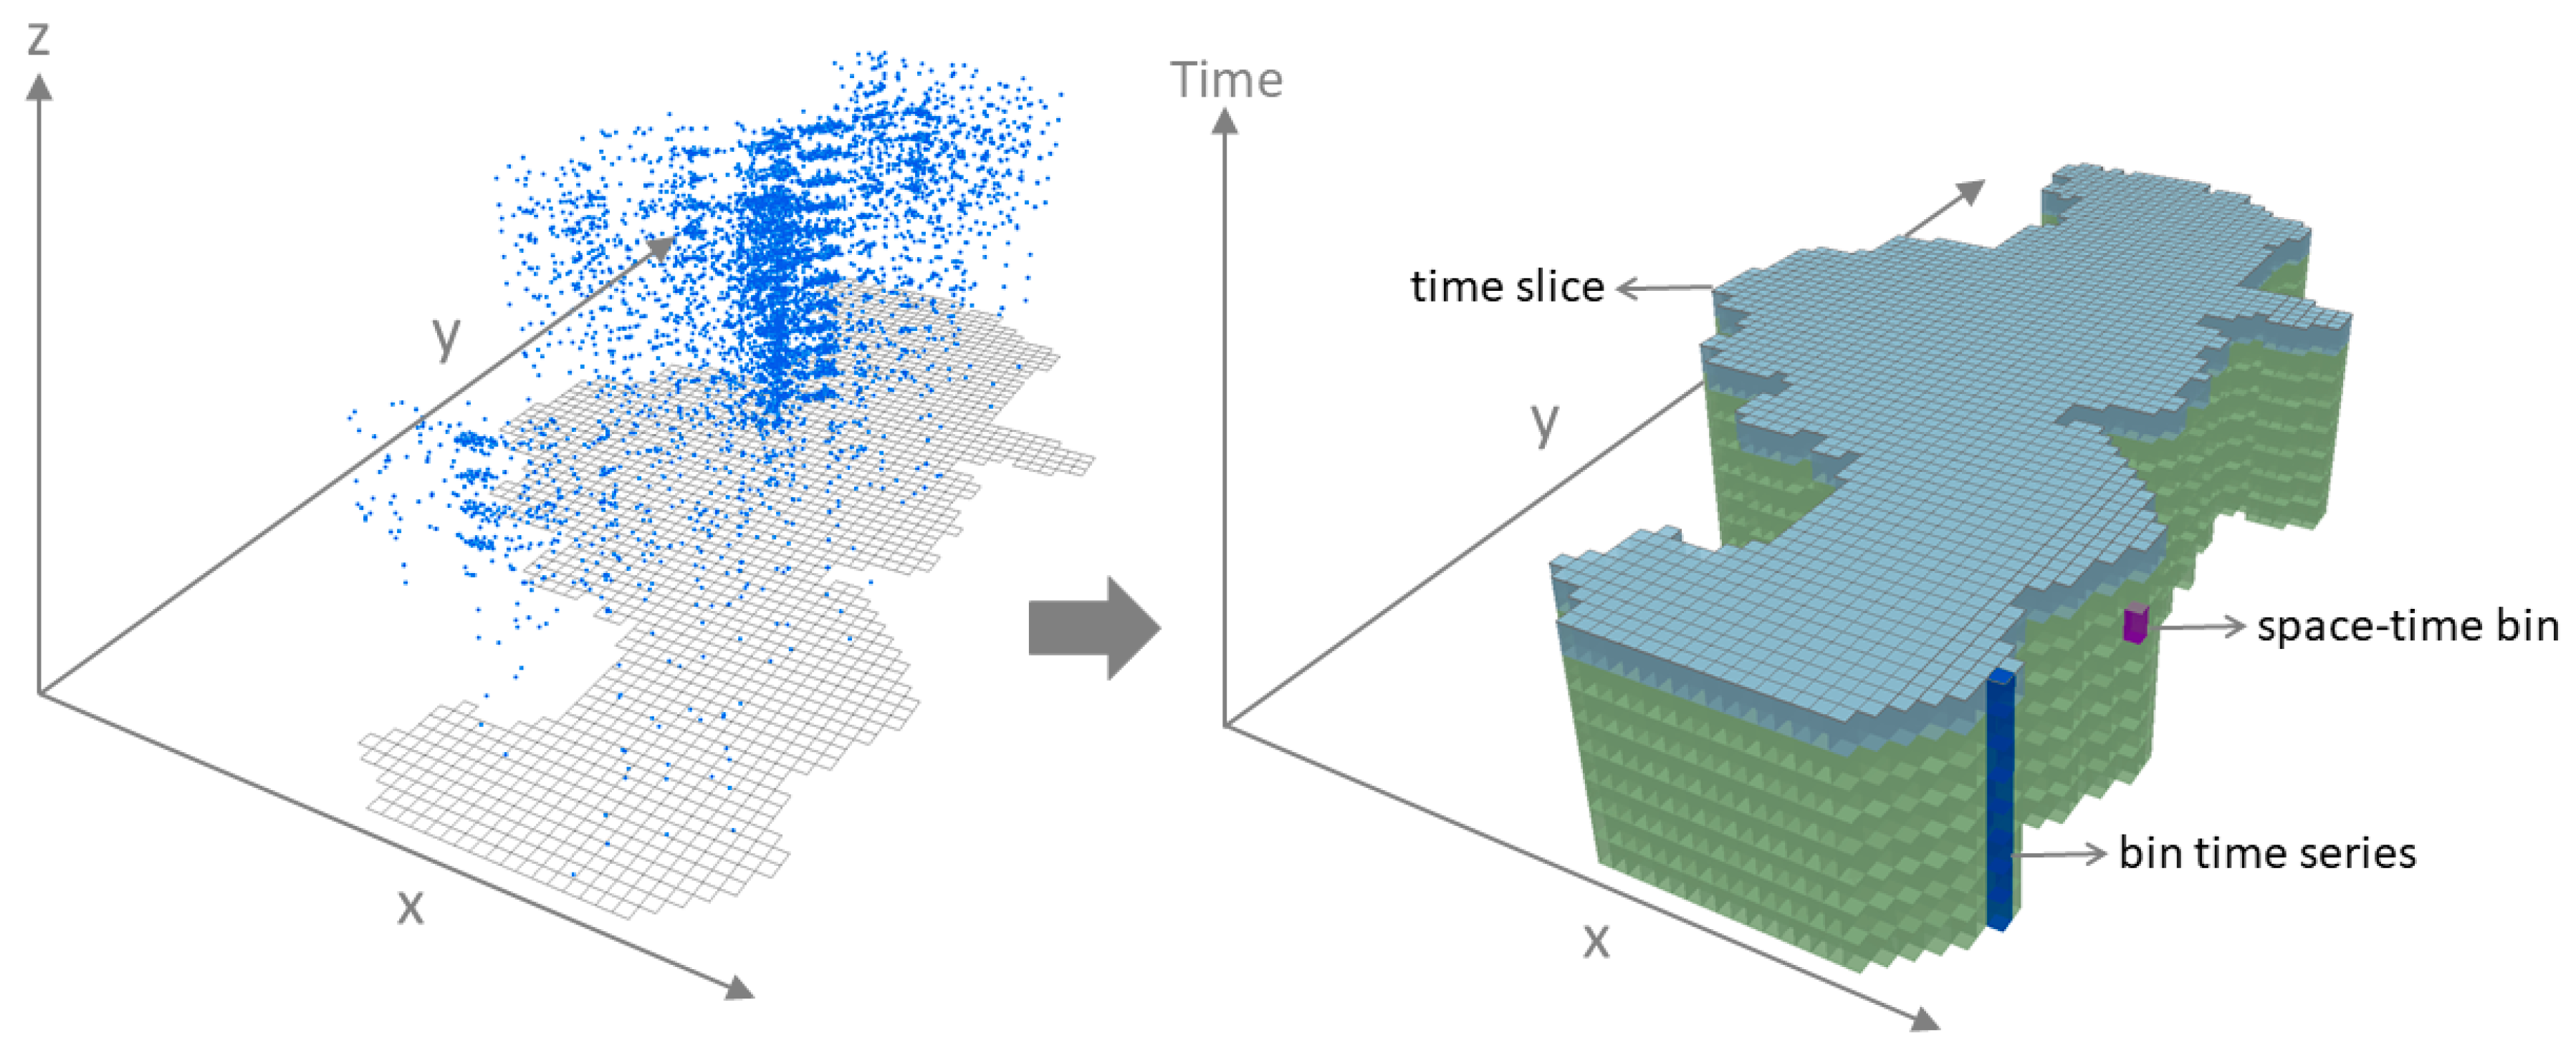
2.2. Spatiotemporal Analysis of Urban Fire Dynamics

Desktop mapping and spatial statistics were primarily utilized to explore the urban fire dynamics in Nanjing. First, desktop mapping was used to examine the spatial distribution of fire incidents across time. Then, the spatiotemporal distribution of fire events was summarized by a space-time cube, based on which spatiotemporal pattern mining was carried out in order to identify significant spatial concentrations (i.e., hot spots) of urban fires as well as associated temporal trends.
A typical space-time cube can be illustrated by Figure 5, where x and y axes define the spatial extent of the study area and the z axis represents the time scale under concern. Within the cube, the observations (i.e., fire events) were aggregated in both spatial and temporal dimensions, i.e., counted for each space-time bin—a container covering a unit-area in space with the height defined by a unit time-period. A time slice consisted of all bins at the same time period and a bin time series contained all the bins sharing the same geographic location across time. In this case, the spatial extent of each bin was 500 m × 500 m, which was about the size of a street block in Nanjing, and one year was adopted for the time-step interval as the urban expansion detection is on a yearly basis. As a result, the obtained space-time cube included 328,068 space-time bins, covering 27,339 grids in space and 12 periods in time.
The obtained space-time cube was further utilized in a spatiotemporal pattern analysis to identify hot spots of fire events as well as their trends over time. This is achieved by a combination of spatial statistical analysis and a time-series analysis. First, a spatiotemporal version of Getis-Ord G i * statistic [15], G i t * , was calculated for every bin within the space-time cube, denoted by bin(i, t) with i representing the geographical location and t the time period, as defined by (1):
G i t * = j t w i j t n j t / j t n j t
where j and t′ are the indices of locations and time periods, respectively; thus, w i j t represents the relationship between bin(i, t) and its neighbouring bin(j, t′) in both space and time; and n j t is the number of fire events within bin(j, t′). In this case, the spatial neighbourhood is defined by contiguity accounting for both common boundaries and vertices, and the temporal neighbourhood size is one time-step (i.e., one year) backward in time. The statistical significance of G i t * is assessed using the standardized G i t * , often known as the z-score (denoted by z G i t * here) and following standard normal distribution. As a result, significant positive values of z G i t * (p-value < 0.05) represent hot spots of urban fires.
Then, the overall temporal trend of hot spots identified by z G i t * at each location is assessed with the Mann–Kendall trend test [16], a common non-parametric approach for detecting monotonic trends in sequential data. In this case, all z G i t * associated with the bin time series at location i was considered as a sequence. Then, every z G i t * in the sequence was compared with all its succeeding values one by one, and the resulted test statistic for that bin time series could be defined as in (2):
S i = t = 1 T 1 k = t + 1 T ϕ t , k ( i ) with ϕ t , k ( i ) = { 1 if   z G i t * < z G i k * 0 if   z G i t * = z G i k * 1   if   z G i t * > z G i k *  
where T is the total number of time periods and z G i t * and z G i k * are the number of fires within the two bins at the same location i but two different periods, t and k, respectively. Similarly, a standardized value, denoted by z S i , can be obtained for S i . As a result, if z S i is statistically significant (p-value < 0.05), a positive value suggests an increasing trend of z G i t * while a negative value indicates a decreasing trend.
Regarding the spatiotemporal pattern of fire incidents, several types of fire hot spots are defined for the bin time series at location i based on the obtained z G i t * and z S i values, which is summarized by Table 1. First, if z G i t * is statistically significant and positive, considering the length of the study period (i.e., twelve years) as well as the transitional year 2008 (see Figure 4), “new” and “emerging” hot spots are defined for the locations where fire hot spots (defined by z G i t * ) were only found for the most three (2011–2013) and five (2009–2013) years, respectively. In contrast, “historical” hot spots only occurred during 2002–2008 and cover at least two periods for the same location. Similarly, “sporadic” hot spots relate to a minimum of two periods but must include periods before and after 2008. Further, another three categories can be defined by incorporating z S i : “intensifying”, “diminishing” and “persistent”, which all cover at least ten periods including the last one but only the first two categories have statistically significant z S i . That is, if z S i is significant, positive values indicate an ascending trend, thus implying “intensifying” hot spots, and negative values suggest a descending trend, thus implying “diminishing” hot spots.

2.3. Detection of Urban Expansion Using Satellite Images

The urban expansion process in Nanjing was explored through urban land expansion over the study period. Specifically, the land use/cover information is extracted from the Landsat satellite images, which are freely available from the United States Geological Survey [17]. Since 1972, Landsat satellites have continuously produced images of earth surface with spatial resolution of 30 m * 30 m, which have long been common and popular data sources for detecting land use/cover changes worldwide [18]. The images used in this research are selected by considering the least effect of clouds on the quality of land use/cover classification.
The detection of urban land changes is implemented with Google Earth Engine (GEE)—a free online platform for geospatial data analysis and visualization utilizing RS images [19]. Taking advantage of Google’s cloud infrastructure, GEE provides easy access to extensive imagery products as well as high performance computing that enables efficient satellite image analysis. Since its launch in 2014, GEE has been widely applied in large spatial scale or multitemporal analyses, including mapping global or regional settlement/cropland/disease and change detection of global forest/surface water, among others [20]. In this research, random forest classifier is employed for land cover/use classification through the integration of Java scripts and GEE application programming interfaces (APIs). Random forest, as a powerful machine learning technique, has been increasingly applied in automatic land use/cover extraction attributed to its high classification accuracy, good tolerance to outliers and noise, and capability of estimating missing values and assessing variable importance [21]. The training samples used by the random forest classifier are extracted from Google Earth high-resolution images (1 m × 1 m) by visual inspection, 500 for each year. The primary variables adopted in the classification include spectral bands, normalized difference vegetation index, grey level co-occurrence matrix with respect to imagery texture and topographic variables (e.g., slope and aspect; see [22] for technical details).
According to the Intergovernmental Panel on Climate Change (IPCC) guidance [23] and in consideration of the actual land use situation in Nanjing, six types of land cover/use—urban land, forest land, grassland, wetland, arable land and others—were first extracted from the satellite images. Then, the latter five types were grouped into one category—non-urban. The obtained image raster datasets were further converted to point datasets using the centroid of each raster cell, with an attribute value 1 for urban land and 0 otherwise. Next, those point data were aggregated into the same regular lattice dataset defining the space–time cube, taking the share of urban land within each grid cell as the attribute. Finally, the lattice datasets of different years were overlaid to identify the changes of urban land in each grid cell for a certain period.

3. Results

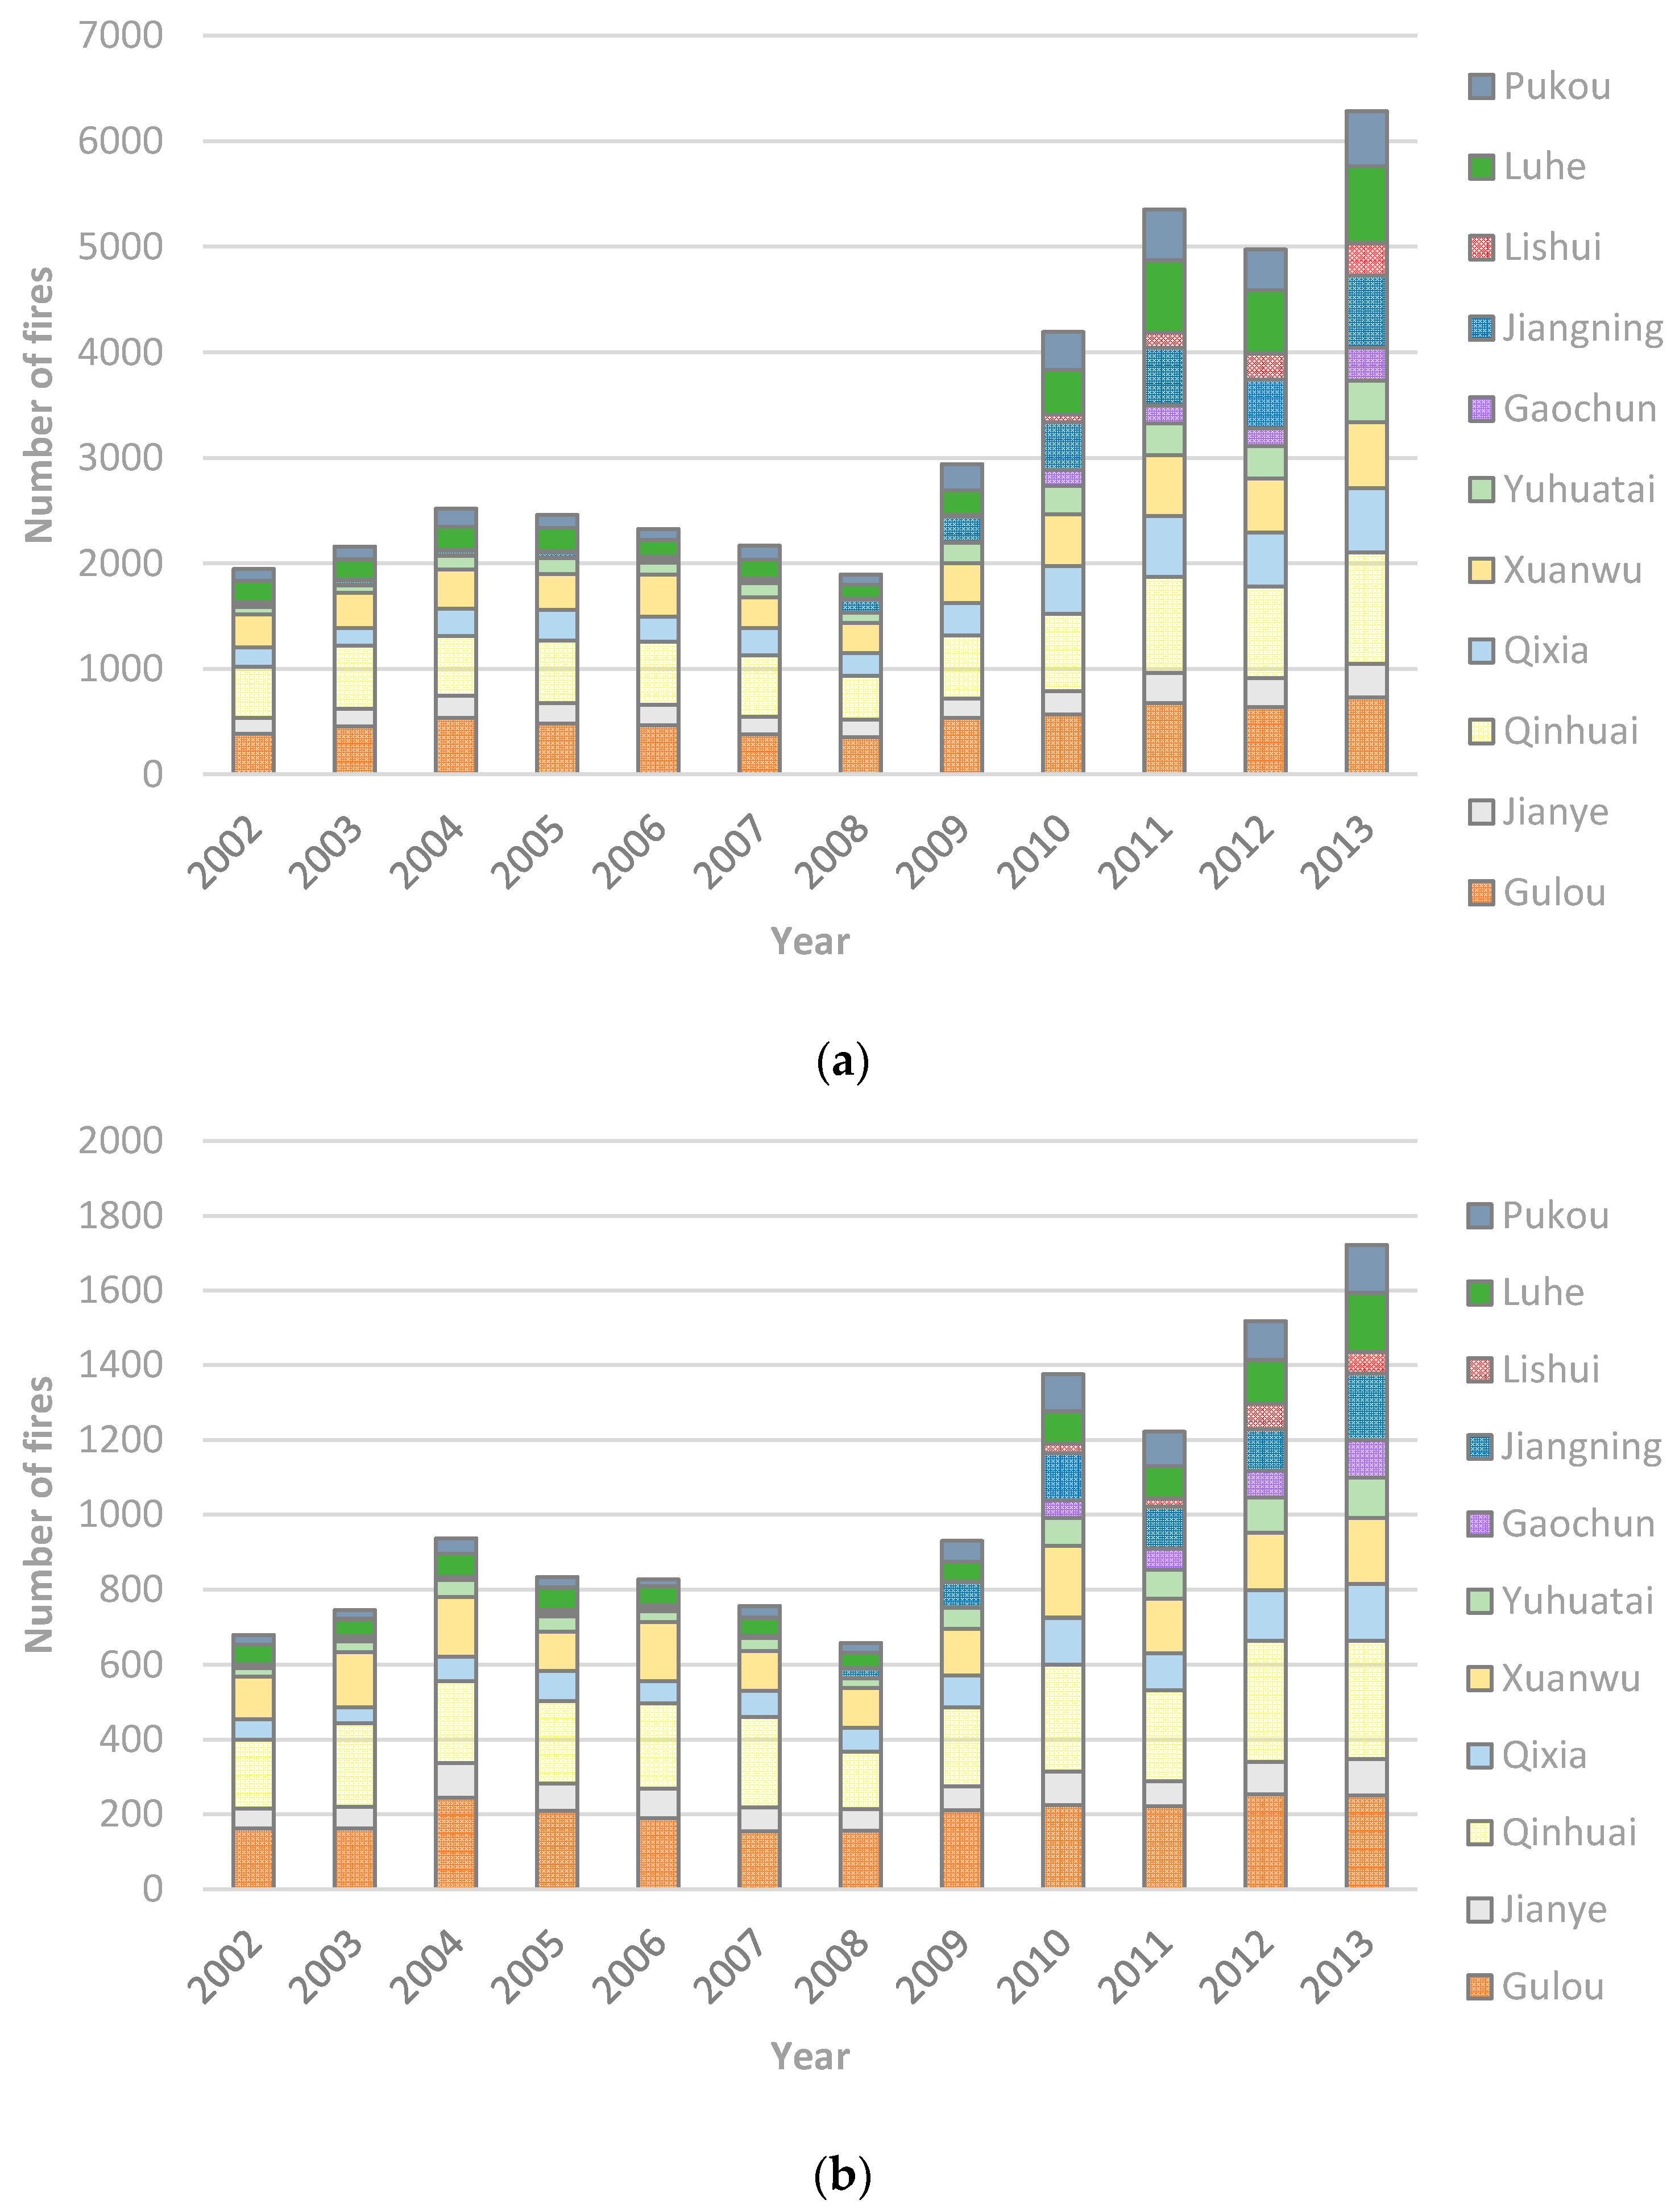
3.1. Spatiotemporal Dynamics of Urban Fires

The spatial distribution of fire incidents was explored by choropleth mapping, as shown in Figure 6. Since the occurrence of both total and dwelling fire had a major transition in 2008 (see Figure 4), Figure 6 presents the fire distribution for year 2008 and the start and end years of the study period. Here, the fire events were aggregated into a set of 1 km × 1 km grid cells—a spatial scale selected by trial and error in consideration of visual effects. Both Figure 6a,b suggests an expanding pattern of fire events from the city proper towards the suburb areas. Although the fire incidents in 2008 were less than those in 2002, they were more spread over space in 2008 particularly for total fire. In fact, the proportion of the grid cells with non-zero fire incidents increased from 5.0% (2002) to 6.6% (2008) and 16.9% (2013) for total fire, and from 2.4% to 3.3% and 8.3% for dwelling fire in the corresponding years. Among those regions, about 60%-75% contained 1-3 fire events. Further, the area with dense fire events—a grid cell with seven or more fire incidents—had largely concentrated in the city proper, with a few emerging and scattered in the suburb in 2013.
The identified fire hot spots are presented in Figure 7 and summarized by Table 2 as well. For both total and dwelling fire, the two overview maps in Figure 7a,b indicate that most hot spots were within the city proper and the surrounding areas, with a few—primarily new and sporadic hot spots—scattered in the north (i.e., Luhe) and the south (i.e., Gaochun and Lishui). The two enlarged maps on the right disclosed more details of the spatial distribution of various hot spots. Obviously, the majority of “intensifying”, “persistent” and “sporadic” hot spots were concentrated in the city proper, particularly Gulou, Qinhuai and Xuanwu. In the suburb, those three types of hot spots were primarily located in Pokou and Luhe, where the latter was the only suburban district containing “intensifying” hot spots for both total and dwelling fire. It also could be observed that “new” and “emerging” hot spots were mainly scattered around the “intensifying” and “persistent” hot spots, which could be found in both city proper (mainly Qixia and Yuhuatai) and the suburb (mainly Jiangning and Pukou). Compared with other types of hot spots, only a few “historical” and “diminishing” hot spots were found, largely located in the city proper and a suburban district—Luhe. For example, only five “historical” (in Jianye) and one “diminishing” (in Luhe) hot spots were identified for total fire.
Further, Table 2 confirms the dominance of the city proper in the “intensifying”, “persistent”, “sporadic” and “historical” hot spots. For example, the share of those four types of hot spots in the city proper were 89.6%, 81.2%, 72.6% and 100.0% for total fire, respectively; and the corresponding values for dwelling fire were 92.5%, 88.2%, 73.5% and 80.0%. Comparatively, the suburb had more share of “new” hot spots for both total and dwelling fire, about 58.6% and 69.7%, respectively. Regarding the “emerging” hot spots, the suburb had less share for total fire (36.8%) but similar share for dwelling fire (55.3%). In particular, Jiangning contained the most “new” and “emerging” hot sports (except the “emerging” hot spots for total fire) among all urban districts and accounted for over one third “emerging” hot spots for dwelling fire. In the city proper, those two types of hot spots were largely within Qixia and Yuhuatai. Regarding “historical” and “diminishing” hot spots, the former was only found in Jianye for total fire but also in three additional districts in the city proper and one in the suburb (i.e., Luhe) for dwelling fire; the latter was only found in Luhe for total fire but also in the city proper (i.e., Xuanwu and Yuhuatai) for dwelling fire. An interesting phenomenon that occurred was that, unlike the central districts, some suburban districts only contained certain types of fire hot spots. For instance, Gaochun only had “new” hot spots, Lishui only had “new” and “sporadic” hot spots and most hot spots within Jiangning were “new” and “emerging” except a few “sporadic” for the total fire.

3.2. Spatiotemporal Patterns of Urban Expansion

Figure 8 depicts the spatial distribution of urban land for the three years: 2002, 2008 and 2013, summarized on the same lattice dataset (500 m × 500 m) adopted by the space–time cube with the value in each grid cell representing the percent of urban land it contains. It can be seen that in 2002 the urban area largely concentrated in the city proper and around the town centres of suburban districts. During the study period, urban land had mainly expanded towards the northeast (e.g., along the Yangtze River primarily including Pukou, Luhe, Qixia and Jianye) as well as the south particularly Jiangning. Additionally, the newly developed urban area during 2008–2013 seemed linking the city proper and the suburbs in the south through Jiangning.
Figure 9 further describes the changes of urban land over time for the entire city as well as for each urban district. The urban land of Nanjing grew steadily during 2002–2013, with the area increasing from 12.2% of the entire city in 2002 to 18.6% in 2013. Obviously, the urban expansion primarily occurred in the suburb, and its share of the overall urban land increased from 65.5% in 2012 to 70.6% in 2013, over two times that of the city proper. Particularly, three districts, Jiangning, Luhe and Pukou, have expanded rapidly, the urban land of which increased by 98.8%, 110.2% and 84.9%, respectively, compared with that in 2002. In contrast, the increase of urban land in the city proper is much less except Qixia and Yuhuatai, where the urban land increased by 85.1% and 66.7%, respectively. Gulou had the least urban land growth across all urban districts, about a 10.0% increase compared with that in 2002.

3.3. Association Between Urban Fire Dynamics and Urban Growth

Considering the two major consequences of urban growth—population increase and urban expansion, this section will examine the association between urban fire dynamics and urban growth from those two perspectives at three spatial scales: the entire city, urban districts and the finer spatial scale adopted in the cluster analysis (500 m × 500 m). Specifically, Figure 10 describes the changes of urban population, urban land and urban fires for the entire city, in comparison with those at the beginning of the study period, 2002 (the population data were compared with that in 2005 due to data availability). The relevant association was further explored by linking Figure 3, Figure 4, Figure 6, Figure 7, Figure 8 and Figure 9 with respect to the eleven urban districts. Finally, the association between urban fire hot spots and urban expansion since 2008 was investigated at a finer spatial scale (500 m × 500 m) by Figure 11.
As shown in Figure 10, both urban population and urban land were growing steadily with the progress of urbanization in Nanjing, with an average annual increase of 2.2% of and 5.4%, respectively. Meanwhile, the urban expansion slowed down in 2008 and then accelerated again from 2011—the annual growth rate decreased from 5.9% in 2008 to 2.1% in 2009 and rose again to 5.4% in 2011. Regarding the urban fire, it was increasing slowly until 2004 before decreasing to the lowest value in 2008, and since then it saw a sharp increase except a drop off in 2012 for total fire and 2011 for dwelling fire. Apart from an overall ascending trend, particularly after 2008, Figure 10 indicates no evident temporal links between urban fire and urban growth in population or urban land during the study period.
Figure 3, Figure 4, Figure 6, Figure 7, Figure 8 and Figure 9 suggest that the variations presented in Figure 10 were virtually far more homogeneous across space. First, the high-density population in the city proper (Figure 3a) suggests that it was not surprising that the six central districts remained as the areas with the highest fire incidences (Figure 4 and Figure 6), particularly Gulou and Qinhuai, which ranked as the top two in both the number of fires and population density during the entire study period. This might also explain the existence of most “intensifying”, “persistent” and “sporadic” fire hot spots in the city proper (Figure 7). In addition, Qixia and Yuhuatai accounted for the most urban expansion within the central city (Figure 8 and Figure 9), which, along with the population growth, might explain why most of the “new” and “emerging” fire hot spots in the city proper were found in those two districts (Figure 7). Further, the two suburban districts, Jiangning and Pukou, had a sharp population increase in 2010 (Figure 3b). Meanwhile, Figure 8 and Figure 9 indicate they both had experienced major urban land growth, ranked the 1st and the 3rd, respectively, among all districts. Thus, it is not surprising they contained most of the “new” and “emerging” fire hot spots in the suburb.
Based on Figure 7, Figure 11 further overlays the locations of “new” and “emerging” fire hot spots with the urban land changes during the associated periods. Here, the periods of urban expansion included one more year than those adopted in the hot spot definition in order to obtain more accurate estimations of urban land changes. Thus, Figure 11a,b presents the urban expansion during 2010–2013 and 2008–2013, respectively. The value in each grid cell represents the share of new urban land, with darker colours indicating higher degrees of urban expansion. It could be observed that most hot spots actually were not located at the places where more urban land was developed. For the locations covered by “new” hot spots in Figure 11a, the average share of new urban land was about 2.9% and 1.2% for total and dwelling fire, respectively, both less than the mean value of the entire city, 3.5%. In addition, over half of the places where “new” hot spots are located did not have any new urban land: 52.8% and 79.8% for total and dwelling fire, respectively. As involving a longer period, the “emerging” hot spots in Figure 11b seemed related to more urban land changes at the corresponding locations, with the average share of new urban land 9.7% and 5.9% for total and dwelling fire, respectively, where only the former was higher than the average value of the entire city, 8.6%. Additionally, compared with “new” hot spots, “emerging” hot spots had less locations containing zero new urban land, 33.8% and 50.0% for total and dwelling fire, respectively.

4. Discussion

One objective of this research was to explore the urban fire dynamics in Nanjing. In this regard, an important novelty of this research is that, unlike most existing cluster analysis approaches that search spatiotemporal clusters within the entire temporal domain (e.g., [24]), constraints of different time intervals were added to each cluster category based on the length of the study period as well as the temporal trend of urban fires. Accordingly, several types of fire hot spots were defined (see Table 1), which could better reflect the temporal characteristics of urban fire evolution, facilitating the subsequent comparison with population growth and urban expansion in the same period. Additionally, the definition of the time intervals given in Table 1 could be revised to examine the fire hot spots in alternative periods. For instance, the “new” hot spots could consider only the last two years (i.e., 2012 and 2013) or the latest year 2013. Similarly, the number of years involved in each category could be modified to identify the hot spots with different time spans. Therefore, the methodological framework proposed here provided a flexible way to detect meaningful spatiotemporal clusters in various research contexts. For example, in epidemiology, a range of time intervals could be imposed on the definition of spatiotemporal disease clusters to characterise different phases of disease development.
Another objective of this research was to investigate the association between urban fire dynamics and urban growth in Nanjing during the study period. The results suggest that the relationship between spatiotemporal distribution of urban fires and urban growth varied at different spatial scales as well as across space. For example, the urban fire incidence in Gulou and Xuanwu was more related to population growth given the limited potential for urban expansion in such central districts. Comparatively, Jiangning and Pukou in the suburb saw rapid growth in population and urban land particularly since 2009, which both could have contributed to the increase of urban fires in those two districts. Although there were no strong links between the locations of “new” and “emerging” hot spots and areas with major urban land increase, the different types of fire hot spots could reflect the main processes of urban development in Nanjing during the twelve-year investigation period. For example, the three central districts, Gulou, Qinhuai and Xuanwu, have long been the most densely populated area where quality public resources and the majority of job opportunities are located [25]. Thus, it is not surprising that those districts, where socioeconomic activities are concentrated, are dominated by “intensifying” and “persistent” fire hot spots. Since 2000, the construction of new towns and development zones has transformed Nanjing into a polycentric city, including Hexi New Town (in Jianye), Banqiao New City (in Yuhuatai), Jiangning Economic and Technical Development Zone (in Jiangning), Nanjing Chemical Industry Park (in Luhe) and Nanjing High-Tech Zone (in Pukou). This process promoted the population growth and urban land increase in the periphery of the city (see Figure 3 and Figure 9), and meanwhile changed the landscape of urban fire risks as well (see Figure 4 and Figure 6). By 2013, the two major sub-centres of the Nanjing have been formed: one is Jiangning in the south and the other is in the north of Yangtze River including Pukou and Luhe [26]. This helps understand the existence of “new” and “emerging” hot spots within those newly developed urban districts.
This leads to potential contributions of this study for further research, that is, assisting with (1) hypothesis formulation with respect to the factors associated with urban fires and (2) future fire and rescue management and planning. For instance, it might be of interest to investigate why there is a descending trend of urban fires during 2004-2008, and why the year 2008 had the lowest number of fire events and whether it was affected by aforementioned factors like weather and enhanced monitoring due to big events (e.g., [5,6,7]). Additionally, as pointed by [10], the intensifying and persistent fire hot spots in the city proper, particularly for the dwelling fire, might be related to the concentration of old residential buildings that lack fire safety devices. Further, in addition to population growth and urban expansion, urban development such as urban regeneration in the city proper and construction of new housing and public facilities in the new towns also involves human activities that could affect urban fire incidence. In addition, there were a total of 19 fire stations in 2012 within the main urban area bounded by the expressway of the city, which were all built in the 1980s [27]. Clearly more fire services are required, particularly in the new towns, to meet the increasing urban fire risks with the ongoing urban development. The identified spatiotemporal distribution of urban fires and fire hot spots can help with assessing the locational efficiency of existing fire stations as well as siting new fire stations, optimizing resource deployment and improving fire and rescue services.
Finally, one limitation of this research is that the investigation of the association between urban fire dynamics and urban growth remained descriptive due to the short time series of the data. That is, the twelve year-based temporal observations (e.g., fire incidents, urban population or urban land) were not enough to carry out meaningful statistical tests (e.g., correlation) for the relationship between urban fire dynamics and urban growth. Additionally, it should be noted that as the quality of selected satellite images for land use/cover change detection is largely reliant on the weather, particularly the clouds on the date of image acquisition, the detected urban land changes should be considered as an approximation rather than an exact reflection of the urban expansion during the study period. Further, in addition to the spatiotemporal dynamics, there are other possible urban fire dynamics such as the causes of fire (natural, deliberate and accidental, etc.), the knowledge of which can help develop effective fire protection and prevention measures and therefore worthy of further investigation.

5. Conclusions

Using a unique fire incident dataset and free time-series of satellite images, this paper explored the urban fire dynamics and its association with urban growth in Nanjing, China, during 2002–2013, based on spatial analytics and the proposed spatiotemporal cluster analysis method. The results suggest that the relationship between urban fire dynamics and urban growth varied at different spatial scales as well as across space. At the city level, the urban fire had a similar overall temporal trend to the growth of population and urban land particularly since 2008, which in space was largely concentrated in the city proper and meanwhile expanding towards the suburbs. At the district level, most intensifying, persistent and historical fire hot spots were in the central districts, which had limited urban expansion but high population densities; most new and emerging hot spots were located in the suburban districts, which had seen rapid population growth and urban expansion in recent years. At the finer scale (500 m × 500 m), however, there were no explicit connections between the locations of new fire hot spots and recently developed urban land. This research demonstrated that spatial analytics such as spatiotemporal data mining and RS techniques could help understand urban fire dynamics and its association with potential influencing factors such as population growth and urban expansion, which could inform decision-making in relation to optimizing spatial layout of fire stations and allocation of fire and rescue resources.

Author Contributions

Conceptualization, Xiaoxiang Zhang and Jing Yao; data curation, Jing Yao and Yuhao Jin; funding acquisition, Jing Yao; investigation, Katarzyna Sila-Nowicka and Yuhao Jin; methodology, Jing Yao and Katarzyna Sila-Nowicka; resources, Xiaoxiang Zhang and Yuhao Jin; supervision, Xiaoxiang Zhang and Jing Yao; writing—original draft, Xiaoxiang Zhang and Jing Yao; writing—review and editing, Katarzyna Sila-Nowicka. All authors have read and agreed to the published version of the manuscript.

Funding

This research was funded by the Economic and Social Research Council (UK), grant number ES/P011020/1.

Acknowledgments

We are grateful to the Fire Department of Ministry of Public Security (FDMPS), Nanjing, China, for their provision of the historical fire incident data.

Conflicts of Interest

The authors declare no conflict of interest. The funders had no role in the design of the study; in the collection, analyses or interpretation of data; in the writing of the manuscript, or in the decision to publish the results.

References

  1. Fire and Rescue Bureau of the Ministry of Emergency Management of China (FRB-MEM) (known as Fire Department of the Ministry of Public Security (FDMPS) before April 2018). Summary of National Fire and Police Records in 2018; 2019. Available online: http://www.119.gov.cn/xiaofang/hztj/36306.htm (accessed on 2 February 2020).
  2. National Bureau of Statistics of China (NBSC). 2018 Migrant Worker Monitoring and Survey Report. 2019. Available online: http://www.stats.gov.cn/Tjsj/zxfb/201904/t20190429_1662268.html (accessed on 2 February 2020).
  3. Chinanews. Over 4000 Fires in Guangzhou Urban Villages in the Last Five Years. 2014. Available online: http://www.chinanews.com/sh/2014/05-08/6149077.shtml (accessed on 2 February 2020).
  4. Xinhua News. How Many Fire Hazards in High-Rise Buildings are in China? 2017. Available online: http://www.xinhuanet.com//local/2017-07/11/c_1121296707.htm (accessed on 2 February 2020).
  5. Corcoran, J.; Higgs, G.; Brunsdon, C.; Ware, A.; Norman, P. The use of spatial analytical techniques to explore patterns of fire incidence: A South Wales case study. Comput. Environ. Urban Syst. 2007, 31, 623–647. [Google Scholar] [CrossRef]
  6. Špatenková, O.; Virrantaus, K. Discovering spatio-temporal relationships in the distribution of building fires. Fire Saf. J. 2013, 62, 49–63. [Google Scholar] [CrossRef]
  7. Guldåker, N.; Hallin, P.O. Spatio-temporal patterns of intentional fires, social stress and socio-economic determinants: A case study of Malmö, Sweden. Fire Saf. J. 2014, 70, 71–80. [Google Scholar] [CrossRef] [Green Version]
  8. Corcoran, J.; Higgs, G.; Brunsdon, C.; Ware, A. The Use of Comaps to Explore the Spatial and Temporal Dynamics of Fire Incidents: A Case Study in SouthWales, United Kingdom. Prof. Geogr. 2007, 59, 521–536. [Google Scholar] [CrossRef] [Green Version]
  9. Corcoran, J.; Higgs, G.; Rohde, D.; Chhetri, P. Investigating the association between weather conditions, calendar events and socio-economic patterns with trends in fire incidence: An Australian case study. J. Geogr. Syst. 2011, 13, 193–226. [Google Scholar] [CrossRef]
  10. Zhang, X.; Yao, J.; Sila-Nowicka, K. Exploring Spatiotemporal Dynamics of Urban Fires: A Case of Nanjing, China. ISPRS Int. Geo-Inf. 2018, 7, 7. [Google Scholar] [CrossRef] [Green Version]
  11. Jennings, C.R. Social and economic characteristics as determinants of residential fire risk in urban neighborhoods: A review of the literature. Fire Saf. J. 2013, 62, 13–19. [Google Scholar] [CrossRef]
  12. Fire Department of Ministry of Public Security of China (FDMPS). China Fire Yearbook 2018; Yunnan People’s Publishing House: Yunnan, China, 2018. (In Chinese) [Google Scholar]
  13. Bureau of Statistics of Nanjing (BSN). The Statistical Communique of the 2018 National Economic and Social Development of Nanjing. 2019. Available online: http://tjj.nanjing.gov.cn/tjxx/201904/t20190402_1495115.html (accessed on 2 February 2020).
  14. Ministry of Housing and Urban-Rural Development (MOHURD). China Urban Construction Statistical Yearbook; China Statistics Press: Beijing, China, 2018. (In Chinese) [Google Scholar]
  15. Getis, A.; Ord, J.K. The analysis of spatial association by use of distance statistics. Geogr. Anal. 1992, 24, 189–206. [Google Scholar] [CrossRef]
  16. Kendall, M.G.; Gibbons, J.D. Rank Correlation Methods, 5th ed.; Griffin: London, UK, 1990. [Google Scholar]
  17. United States Geological Survey. Available online: https://www.usgs.gov/land-resources/nli/landsat (accessed on 2 February 2020).
  18. Vogelmann, J.E.; Howard, S.M.; Yang, L.; Larson, C.R.; Wylie, B.K.; Van Driel, N. Completion of the 1990s National Land Cover Data Set for the conterminous United States from Landsat Thematic Mapper data and ancillary data sources. Photogramm. Eng. Remote Sens. 2001, 67, 650–652. [Google Scholar] [CrossRef]
  19. Google Earth Engine. Available online: https://earthengine.google.com/ (accessed on 2 February 2020).
  20. Gorelick, N.; Hancher, M.; Dixon, M.; Ilyushchenko, S.; Thau, D.; Moore, R. Google Earth Engine: Planetary-scale geospatial analysis for everyone. Remote Sens. Environ. 2017, 202, 18–27. [Google Scholar] [CrossRef]
  21. Rodriguez-Galiano, V.F.; Ghimire, B.; Rogan, J.; Chica-Olmo, M.; Rigol-Sanchez, J.P. An assessment of the effectiveness of a random forest classifier for land-cover classification. ISPRS J. Photogramm. 2012, 67, 93–104. [Google Scholar] [CrossRef]
  22. Jin, Y.; Liu, X.; Yao, J.; Zhang, X.; Zhang, H. Mapping the annual dynamics of cultivated land in typical area of the Middle-lower Yangtze plain using long time-series of Landsat images based on Google Earth Engine. Int. J. Remote Sens. 2020, 41, 1625–1644. [Google Scholar] [CrossRef]
  23. Penman, J.; Gytarsky, M.; Hiraishi, T.; Krug, T.; Kruger, D.; Pipatti, R.; Buendia, L.; Miwa, K.; Ngara, T.; Tanabe, K.; et al. Good Practice Guidance for Land Use, Land-Use Change and Forestry; IPCC National Greenhouse Gas Inventories Programme and Institute for Global Environmental Strategies: Kanagawa, Japan, 2003; Available online: https://www.ipcc-nggip.iges.or.jp/public/gpglulucf/gpglulucf_files/GPG_LULUCF_FULL.pdf (accessed on 2 February 2020).
  24. Robertson, C.; Nelson, T.A.; MacNab, Y.C.; Lawson, A.B. Review of methods for space–time disease surveillance. Spat. Spatio-temporal Epidemiol. 2010, 1, 105–116. [Google Scholar] [CrossRef] [PubMed]
  25. Qian, Z. Master plan, plan adjustment and urban development reality under China’s market transition: A case study of Nanjing. Cities 2013, 30, 77–88. [Google Scholar] [CrossRef]
  26. Chen, J.; Gao, J.; Chen, W. Urban land expansion and the transitional mechanisms in Nanjing, China. Habitat Int. 2016, 53, 274–283. [Google Scholar] [CrossRef]
  27. Yao, J.; Zhang, X.; Murray, A.T. Location optimization of urban fire stations: Access and service coverage. Comput. Environ. Urban Syst. 2019, 73, 184–190. [Google Scholar] [CrossRef]
Figure 1. Research framework.
Ijgi 09 00218 g001
Figure 2. Study area—Nanjing, China.
Ijgi 09 00218 g002
Figure 3. Variations of population density in urban districts (2005–2013): (a) city proper and (b) suburbs.
Ijgi 09 00218 g003
Figure 4. Temporal variations of urban fires (2002–2013): (a) total fire and (b) dwelling fire.
Ijgi 09 00218 g004
Figure 5. An example of a space-time cube.
Ijgi 09 00218 g005
Figure 6. Spatial distribution of fire incidents: (a) total fire and (b) dwelling fire.
Ijgi 09 00218 g006
Figure 7. Hot spots of urban fires: (a) total fire and (b) dwelling fire.
Ijgi 09 00218 g007
Figure 8. Spatial distribution of urban land in Nanjing.
Ijgi 09 00218 g008
Figure 9. Temporal variations of urban land (2002–2013).
Ijgi 09 00218 g009
Figure 10. Temporal variations of urban population, urban land and urban fires (2002–2013).
Ijgi 09 00218 g010
Figure 11. Comparison of urban fire hot spots and urban land changes: (a) “new” hot spots vs. urban land change in 2010-2013 and (b) “emerging” hot spots vs. urban land change in 2008–2013.
Ijgi 09 00218 g011
Table 1. Characterizing the bin time series at location i in relation to urban fire dynamics.
Type of Fire Hot Spots z S i z G i t *   is   Significant   and   Positive
SignificantSignAssociated Periods
New/ 1/[2011, 2013] only
Emerging//[2009, 2013] only
Intensifying+At least 10 years including 2013
Persistent/At least 10 years including 2013
Diminishing-At least 10 years including 2013
Sporadic//At least 2 years (one between [2002, 2008] and one between [2009, 2013]) and less than 10 years
Historical//At least 2 years, only between [2002, 2008]
1 /: not applicable.
Table 2. Number of fire hot spots within each urban district 2: (a) total fire and (b) dwelling fire.
(a)
(a)
NewEmergingIntensifyingPersistentSporadicHistoricalDiminishing
City ProperGulou3 (1.2%) 85 (24.6%)50 (21.9%)12 (5.6%)
Jianye18 (7.3%)8 (11.8%)16 (4.6%)19 (8.3%)25 (11.6%)5 (100.0%)
Qinhuai8 (3.3%)7 (10.3%)89 (25.8%)43 (18.9%)17 (7.9%)
Qixia27 (11.0%)12 (17.6%)17 (4.9%)13 (5.7%)42 (19.5%)
Xuanwu14 (5.7%)2 (2.9%)92 (26.7%)58 (25.4%)25 (11.6%)
Yuhuatai32 (13.0%)14 (20.6%)10 (2.9%)2 (0.9%)35 (16.3%)
SuburbGaochun24 (9.8%)
Jiangning60 (24.4%)13 (19.1%) 2 (0.9%)
Lishui3 (1.2%) 9 (4.2%)
Luhe30 (12.2%)1 (1.5%)21 (6.1%)37 (16.2%)9 (4.2%) 1 (100.0%)
Pukou27 (11.0%)11 (16.2%)15 (4.3%)6 (2.6%)39 (18.1%)
(b)
(b)
NewEmergingIntensifyingPersistentSporadicHistoricalDiminishing
City ProperGulou 1 (2.6%)59 (34.1%)74 (22.4%)14 (6.9%)1 (10.0%)
Jianye7 (7.1%) 13 (7.5%)17 (5.2%)9 (4.4%)4 (40.0%)
Qinhuai 6 (15.8%)47 (27.2%)78 (23.6%)16 (7.8%)
Qixia1 (1.0%)5 (13.2%)9 (5.2%)17 (5.2%)41 (20.1%)
Xuanwu6 (6.1%) 29 (16.8%)97 (29.4%)42 (20.6%)2 (20.0%)1 (25.0%)
Yuhuatai16 (16.2%)5 (13.2%)3 (1.7%)8 (2.4%)28 (13.7%)1 (10.0%)1 (25.0%)
SuburbGaochun21 (21.2%)
Jiangning22 (22.2%)13 (34.2%)
Lishui5 (5.1%) 9 (4.4%)
Luhe3 (3.0%) 13 (7.5%)30 (9.1%)20 (9.8%)2 (20.0%)2 (50.0%)
Pukou18 (18.2%)8 (21.1%) 9 (2.7%)25 (12.3%)
2 The numbers in brackets indicate the corresponding percentage within each hot spot category.

