Next Issue
Volume 9, March
Previous Issue
Volume 9, January


ISPRS Int. J. Geo-Inf., Volume 9, Issue 2 (February 2020) – 77 articles

Cover Story (view full-size image): 
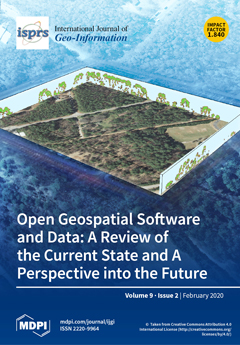
Over the past decade, the adoption of open source software and open data principles has accelerated worldwide, with geospatial domain often leading the way. This paper reviews the current state of the Open Source Geospatial Foundation (OSGeo) software ecosystem and its communities, while also highlighting major trends outside OSGeo. Collaboratively contributed, authoritative, and scientific open geospatial data are discussed, along with new developments in open data standards. The openness has changed how geospatial data is collected, processed, analyzed, and visualized. For example, generalized 3D vegetation fragmentation index derived from open lidar point cloud data was computed and visualized using open source GRASS GIS software (see reference [15] in the article).View this paper.
  • Issues are regarded as officially published after their release is announced to the table of contents alert mailing list.
  • You may sign up for e-mail alerts to receive table of contents of newly released issues.
  • PDF is the official format for papers published in both, html and pdf forms. To view the papers in pdf format, click on the "PDF Full-text" link, and use the free Adobe Reader to open them.
Order results
Result details
Select all
Export citation of selected articles as:
34 pages, 23834 KiB  
Article
Visualization, Spatiotemporal Patterns, and Directional Analysis of Urban Activities Using Geolocation Data Extracted from LBSN
by Muhammad Rizwan, Wanggen Wan and Luc Gwiazdzinski
ISPRS Int. J. Geo-Inf. 2020, 9(2), 137; https://doi.org/10.3390/ijgi9020137 - 24 Feb 2020
Cited by 17 | Viewed by 4616
Abstract
Location-based social networks (LBSNs) have rapidly prevailed in China with the increase in smart devices use, which has provided a wide range of opportunities to analyze urban behavior in terms of the use of LBSNs. In a LBSN, users socialize by sharing their [...] Read more.
Location-based social networks (LBSNs) have rapidly prevailed in China with the increase in smart devices use, which has provided a wide range of opportunities to analyze urban behavior in terms of the use of LBSNs. In a LBSN, users socialize by sharing their location (also referred to as “geolocation”) in the form of a tweet (also referred to as a “check-in”), which contains information in the form of, but is not limited to, text, audio, video, etc., which records the visited place, movement patterns, and activities performed (e.g., eating, living, working, or leisure). Understanding the user’s activities and behavior in space and time using LBSN datasets can be achieved by archiving the daily activities, movement patterns, and social media behavior patterns, thus representing the user’s daily routine. The current research observing and analyzing urban activities behavior was often supported by the volunteered sharing of geolocation and the activity performed in space and time. The objective of this research was to observe the spatiotemporal and directional trends and the distribution differences of urban activities at the city and district levels using LBSN data. The density was estimated, and the spatiotemporal trend of activities was observed, using kernel density estimation (KDE); for spatial regression analysis, geographically weighted regression (GWR) analysis was used to observe the relationship between different activities in the study area. Finally, for the directional analysis, to observe the principle orientation and direction, and the spatiotemporal movement and extension trends, a standard deviational ellipse (SDE) analysis was used. The results of the study show that women were more inclined to use social media compared with men. However, the activities of male users were different during weekdays and weekends compared to those of female users. The results of the directional analysis at the district level reflect the change in the trajectory and spatiotemporal dynamics of activities. The directional analysis at the district level reveals its fine spatial structure in comparison to the whole city level. Therefore, LBSN can be considered as a supplementary and reliable source of social media big data for observing urban activities and behavior within a city in space and time. Full article
(This article belongs to the Special Issue Measuring, Mapping, Modeling, and Visualization of Cities)
Show Figures

Figure 1

21 pages, 4791 KiB  
Technical Note
Traffic Impact Area Detection and Spatiotemporal Influence Assessment for Disaster Reduction Based on Social Media: A Case Study of the 2018 Beijing Rainstorm
by Tengfei Yang, Jibo Xie, Guoqing Li, Naixia Mou, Cuiju Chen, Jing Zhao, Zhan Liu and Zhenyu Lin
ISPRS Int. J. Geo-Inf. 2020, 9(2), 136; https://doi.org/10.3390/ijgi9020136 - 24 Feb 2020
Cited by 8 | Viewed by 3507
Abstract
The abnormal change in the global climate has increased the chance of urban rainstorm disasters, which greatly threatens people’s daily lives, especially public travel. Timely and effective disaster data sources and analysis methods are essential for disaster reduction. With the popularity of mobile [...] Read more.
The abnormal change in the global climate has increased the chance of urban rainstorm disasters, which greatly threatens people’s daily lives, especially public travel. Timely and effective disaster data sources and analysis methods are essential for disaster reduction. With the popularity of mobile devices and the development of network facilities, social media has attracted widespread attention as a new source of disaster data. The characteristics of rich disaster information, near real-time transmission channels, and low-cost data production have been favored by many researchers. These researchers have used different methods to study disaster reduction based on the different dimensions of information contained in social media, including time, location and content. However, current research is not sufficient and rarely combines specific road condition information with public emotional information to detect traffic impact areas and assess the spatiotemporal influence of these areas. Thus, in this paper, we used various methods, including natural language processing and deep learning, to extract the fine-grained road condition information and public emotional information contained in social media text to comprehensively detect and analyze traffic impact areas during a rainstorm disaster. Furthermore, we proposed a model to evaluate the spatiotemporal influence of these detected traffic impact areas. The heavy rainstorm event in Beijing, China, in 2018 was selected as a case study to verify the validity of the disaster reduction method proposed in this paper. Full article
(This article belongs to the Special Issue GIS Software and Engineering for Big Data)
Show Figures

Figure 1

12 pages, 2438 KiB  
Article
Understanding the Shared E-scooter Travels in Austin, TX
by Junfeng Jiao and Shunhua Bai
ISPRS Int. J. Geo-Inf. 2020, 9(2), 135; https://doi.org/10.3390/ijgi9020135 - 24 Feb 2020
Cited by 127 | Viewed by 10258
Abstract
This paper investigated the travel patterns of 1.7 million shared E-scooter trips from April 2018 to February 2019 in Austin, TX. There were more than 6000 active E-scooters in operation each month, generating over 150,000 trips and covered approximately 117,000 miles. During this [...] Read more.
This paper investigated the travel patterns of 1.7 million shared E-scooter trips from April 2018 to February 2019 in Austin, TX. There were more than 6000 active E-scooters in operation each month, generating over 150,000 trips and covered approximately 117,000 miles. During this period, the average travel distance and operation time of E-scooter trips were 0.77 miles and 7.55 min, respectively. We further identified two E-scooter usage hotspots in the city (Downtown Austin and the University of Texas campus). The spatial analysis showed that more trips originated from Downtown Austin than were completed, while the opposite was true for the UT campus. We also investigated the relationship between the number of E-scooter trips and the surrounding environments. The results show that areas with higher population density and more residents with higher education were correlated with more E-scooter trips. A shorter distance to the city center, the presence of transit stations, better street connectivity, and more compact land use were also associated with increased E scooter usage in Austin, TX. Surprisingly, the proportion of young residents within a neighborhood was negatively correlated with E-scooter usage. Full article
Show Figures

Figure 1

25 pages, 2760 KiB  
Article
Land Use and Land Cover Change Modeling and Future Potential Landscape Risk Assessment Using Markov-CA Model and Analytical Hierarchy Process
by Biswajit Nath, Zhihua Wang, Yong Ge, Kamrul Islam, Ramesh P. Singh and Zheng Niu
ISPRS Int. J. Geo-Inf. 2020, 9(2), 134; https://doi.org/10.3390/ijgi9020134 - 24 Feb 2020
Cited by 77 | Viewed by 8587
Abstract
Land use and land cover change (LULCC) has directly played an important role in the observed climate change. In this paper, we considered Dujiangyan City and its environs (DCEN) to study the future scenario in the years 2025, 2030, and 2040 based on [...] Read more.
Land use and land cover change (LULCC) has directly played an important role in the observed climate change. In this paper, we considered Dujiangyan City and its environs (DCEN) to study the future scenario in the years 2025, 2030, and 2040 based on the 2018 simulation results from 2007 and 2018 LULC maps. This study evaluates the spatial and temporal variations of future LULCC, including the future potential landscape risk (FPLR) area of the 2008 great (8.0 Mw) earthquake of south-west China. The Cellular automata–Markov chain (CA-Markov) model and multicriteria based analytical hierarchy process (MC-AHP) approach have been considered using the integration of remote sensing and GIS techniques. The analysis shows future LULC scenario in the years 2025, 2030, and 2040 along with the FPLR pattern. Based on the results of the future LULCC and FPLR scenarios, we have provided suggestions for the development in the close proximity of the fault lines for the future strong magnitude earthquakes. Our results suggest a better and safe planning approach in the Belt and Road Corridor (BRC) of China to control future Silk-Road Disaster, which will also be useful to urban planners for urban development in a safe and sustainable manner. Full article
Show Figures

Figure 1

20 pages, 1033 KiB  
Article
On the Right Track: Comfort and Confusion in Indoor Environments
by Nina Vanhaeren, Laure De Cock, Lieselot Lapon, Nico Van de Weghe, Kristien Ooms and Philippe De Maeyer
ISPRS Int. J. Geo-Inf. 2020, 9(2), 132; https://doi.org/10.3390/ijgi9020132 - 24 Feb 2020
Cited by 3 | Viewed by 3050
Abstract
Indoor navigation systems are not well adapted to the needs of their users. The route planning algorithms implemented in these systems are usually limited to shortest path calculations or derivatives, minimalizing Euclidian distance. Guiding people along routes that adhere better to their cognitive [...] Read more.
Indoor navigation systems are not well adapted to the needs of their users. The route planning algorithms implemented in these systems are usually limited to shortest path calculations or derivatives, minimalizing Euclidian distance. Guiding people along routes that adhere better to their cognitive processes could ease wayfinding in indoor environments. This paper examines comfort and confusion perception during wayfinding by applying a mixed-method approach. The aforementioned method combined an exploratory focus group and a video-based online survey. From the discussions in the focus group, it could be concluded that indoor wayfinding must be considered at different levels: the local level and the global level. In the online survey, the focus was limited to the local level, i.e., local environmental characteristics. In this online study, the comfort and confusion ratings of multiple indoor navigation situations were analyzed. In general, the results indicate that open spaces and stairs need to be taken into account in the development of a more cognitively-sounding route planning algorithm. Implementing the results in a route planning algorithm could be a valuable improvement of indoor navigation support. Full article
(This article belongs to the Special Issue Recent Trends in Location Based Services and Science)
Show Figures

Figure 1

21 pages, 8423 KiB  
Article
Spatiotemporal Characteristics and Driving Force Analysis of Flash Floods in Fujian Province
by Junnan Xiong, Quan Pang, Chunkun Fan, Weiming Cheng, Chongchong Ye, Yunliang Zhao, Yuanrong He and Yifan Cao
ISPRS Int. J. Geo-Inf. 2020, 9(2), 133; https://doi.org/10.3390/ijgi9020133 - 23 Feb 2020
Cited by 21 | Viewed by 3539
Abstract
Flash floods are one of the most destructive natural disasters. The comprehensive identification of the spatiotemporal characteristics and driving factors of a flash flood is the basis for the scientific understanding of the formation mechanism and the distribution characteristics of flash floods. In [...] Read more.
Flash floods are one of the most destructive natural disasters. The comprehensive identification of the spatiotemporal characteristics and driving factors of a flash flood is the basis for the scientific understanding of the formation mechanism and the distribution characteristics of flash floods. In this study, we explored the spatiotemporal patterns of flash floods in Fujian Province from 1951 to 2015. Then, we analyzed the driving forces of flash floods in geomorphic regions with three different grades based on three methods, namely, geographical detector, principal component analysis, and multiple linear regression. Finally, the sensitivity of flash floods to the gross domestic product, village point density, annual maximum one-day precipitation (Rx1day), and annual total precipitation from days > 95th percentile (R95p) was analyzed. The analytical results indicated that (1) The counts of flash floods rose sharply from 1988, and the spatial distribution of flash floods mainly extended from the coastal low mountains, hills, and plain regions of Fujian (IIA2) to the low-middle mountains, hills, and valley regions in the Wuyi mountains (IIA4) from 1951 to 2015. (2) From IIA2 to IIA4, the impact of human activities on flash floods was gradually weakened, while the contribution of precipitation indicators gradually strengthened. (3) The sensitivity analysis results revealed that the hazard factors of flash floods in different periods and regions had significant differences in Fujian Province. Based on the above results, it is necessary to accurately forecast extreme precipitation and improve the economic development model of the IIA2 region. Full article
Show Figures

Figure 1

31 pages, 56352 KiB  
Article
Slope Hazard Monitoring Using High-Resolution Satellite Remote Sensing: Lessons Learned from a Case Study
by Yuxiao Qin, Edward Hoppe and Daniele Perissin
ISPRS Int. J. Geo-Inf. 2020, 9(2), 131; https://doi.org/10.3390/ijgi9020131 - 23 Feb 2020
Cited by 10 | Viewed by 4098
Abstract
In this study, a highway slope monitoring project for a section of US highway I-77 in Virginia was carried out with the InSAR technique. This paper attempts to provide insights into the complete and practical solution for the monitoring project, including two parts: [...] Read more.
In this study, a highway slope monitoring project for a section of US highway I-77 in Virginia was carried out with the InSAR technique. This paper attempts to provide insights into the complete and practical solution for the monitoring project, including two parts: what to consider for selecting the optimal satellites and configurations for the given area of interest (AoI) and budget; and how to best process the selected data for the monitoring purposes. To answer the first question, the simulated geometric distortion map, cumulative change detection map, intensity map, interferograms and coherence maps from all available historical datasets were generated. The satellite configuration that gives the best coherence and least geometric distortion with the given budget was selected for the monitoring project. For this project, it was the X-band COSMO stripmap with 3 m resolution and eight-days revisit time. To answer the second question, a multi-temporal InSAR (MTInSAR) was applied to retrieve the settlement time series of the slopes along the highway. Several special techniques were applied to increase the level of confidence, i.e., dividing AoI into smaller and independent areas, using a non-linear approach, etc. Finally, fieldwork was carried out for the interpretation and validation of the results. The AoI was overall stable, though some local changes were detected by the SAR signal which were validated by the fieldwork. Full article
(This article belongs to the Special Issue Geospatial Approaches to Landslide Mapping and Monitoring)
Show Figures

Figure 1

16 pages, 1770 KiB  
Article
Promoting Environmental Justice through Integrated Mapping Approaches: The Map of Water Conflicts in Andalusia (Spain)
by Belen Pedregal, Cesare Laconi and Leandro del Moral
ISPRS Int. J. Geo-Inf. 2020, 9(2), 130; https://doi.org/10.3390/ijgi9020130 - 22 Feb 2020
Cited by 7 | Viewed by 3369
Abstract
Addressing environmental governance conflicts requires the adoption of a complexity approach to carry out an adaptive process of collective learning, exploration, and experimentation. In this article, we hypothesize that by integrating community-based participatory mapping processes with internet-based collaborative digital mapping technologies, it is [...] Read more.
Addressing environmental governance conflicts requires the adoption of a complexity approach to carry out an adaptive process of collective learning, exploration, and experimentation. In this article, we hypothesize that by integrating community-based participatory mapping processes with internet-based collaborative digital mapping technologies, it is possible to create tools and spaces for knowledge co-production and collective learning. We also argue that providing a collaborative web platform enables these projects to become a repository of activist knowledge and practices that are often poorly stored and barely shared across communities and organizations. The collaborative Webmap of Water Conflicts in Andalusia, Spain, is used to show the benefits and potential of mapping processes of this type. The article sets out the steps and methods used to develop this experience: (i) background check; (ii) team discussion and draft proposal; (iii) in-depth interviews, and (iv) integrated participative and collaborative mapping approach. The main challenge that had to be addressed during this process was to co-create a tool able to combine the two perspectives that construct the identity of integrated mapping: a data-information-knowledge co-production process that is useful for the social agents—the environmental activists—while also sufficiently categorizable and precise to enable the competent administrations to steer their water management. Full article
Show Figures

Figure 1

27 pages, 14131 KiB  
Article
Behavioural Effects of Spatially Structured Scoring Systems in Location-Based Serious Games—A Case Study in the Context of OpenStreetMap
by Rene Westerholt, Heinrich Lorei and Bernhard Höfle
ISPRS Int. J. Geo-Inf. 2020, 9(2), 129; https://doi.org/10.3390/ijgi9020129 - 22 Feb 2020
Cited by 5 | Viewed by 4384
Abstract
Location-based games have become popular in recent years, with Pokémon Go and Ingress being two very prominent examples. Some location-based games, known as Serious Games, go beyond entertainment and serve additional purposes such as data collection. Such games are also found in the [...] Read more.
Location-based games have become popular in recent years, with Pokémon Go and Ingress being two very prominent examples. Some location-based games, known as Serious Games, go beyond entertainment and serve additional purposes such as data collection. Such games are also found in the OpenStreetMap context and playfully enrich the project’s geodatabase. Examples include Kort and StreetComplete. This article examines the role of spatially structured scoring systems as a motivational element. It is analysed how spatial structure in scoring systems is correlated with changes observed in the game behaviour. For this purpose, our study included two groups of subjects who played a modified game based on StreetComplete in a real urban environment. One group played the game with a spatially structured scoring system and the other with a spatially random scoring system. We evaluated different indicators and analysed the players’ GPS trajectories. In addition, the players filled out questionnaires to investigate whether they had become aware of the scoring system they were playing. The results obtained show that players who are confronted with a spatially structured scoring system are more likely to be in areas with high scores, have a longer playing time, walk longer distances and are more willing to take detours. Furthermore, discrepancies between the perception of a possible system in the scoring system and corresponding actions were revealed. The results are informative for game design, but also for a better understanding of how players interact with their geographical context during location-based games. Full article
(This article belongs to the Special Issue Gaming and Geospatial Information)
Show Figures

Figure 1

22 pages, 11963 KiB  
Article
An OD Flow Clustering Method Based on Vector Constraints: A Case Study for Beijing Taxi Origin-Destination Data
by Xiaogang Guo, Zhijie Xu, Jianqin Zhang, Jian Lu and Hao Zhang
ISPRS Int. J. Geo-Inf. 2020, 9(2), 128; https://doi.org/10.3390/ijgi9020128 - 22 Feb 2020
Cited by 18 | Viewed by 5588
Abstract
Origin-destination (OD) flow pattern mining is an important research method of urban dynamics, in which OD flow clustering analysis discovers the activity patterns of urban residents and mine the coupling relationship of urban subspace and dynamic causes. The existing flow clustering methods are [...] Read more.
Origin-destination (OD) flow pattern mining is an important research method of urban dynamics, in which OD flow clustering analysis discovers the activity patterns of urban residents and mine the coupling relationship of urban subspace and dynamic causes. The existing flow clustering methods are limited by the spatial constraints of OD points, rely on the spatial similarity of geographical points, and lack in-depth analysis of high-dimensional flow characteristics, and therefore it is difficult to find irregular flow clusters. In this paper, we propose an OD flow clustering method based on vector constraints (ODFCVC), which defines OD flow event point and OD flow vector to express the spatial location relationship and geometric flow behavior characteristics of OD flow. First, the OD flow vector coordinate system is normalized by the Euclidean distance-based OD flow event point spatial clustering, and then the OD flow clusters with similar flow patterns are mined using adjusted cosine similarity-based OD flow vector feature clustering. The transformation of OD data from point set space to vector space is realized by constraining the vector coordinate system and vector similarity through two-step clustering, which simplifies the calculation of high-dimensional similarity of OD flow and helps mining representative OD flow clusters in flow space. Due to the OD flow cluster property, the k-means algorithm is selected as the basic clustering logic in the two-step clustering method, and a sum of squared error perceptually important points algorithm considering silhouette coefficients (SSEPIP) is adopted to automatically extract the optimal cluster number without defining any parameters. Tested by origin-destination flow data in Beijing, China, new traffic flow communities based on traffic hubs are obtained by using the ODFCVC method, and irregular traffic flow clusters (including cluster mode, divergence mode, and convergence mode) with representative travel trends are found. Full article
Show Figures

Figure 1

17 pages, 4344 KiB  
Article
A Graph-Based Spatiotemporal Data Framework for 4D Natural Phenomena Representation and Quantification–An Example of Dust Events
by Manzhu Yu
ISPRS Int. J. Geo-Inf. 2020, 9(2), 127; https://doi.org/10.3390/ijgi9020127 - 22 Feb 2020
Cited by 2 | Viewed by 2666
Abstract
Natural phenomena are intrinsically spatiotemporal and often highly dynamic. The increasing availability of simulation and observation datasets has provided us a great opportunity to better capture and understand the complexity and dynamics of natural phenomena. Challenges are posed by the formalization of the [...] Read more.
Natural phenomena are intrinsically spatiotemporal and often highly dynamic. The increasing availability of simulation and observation datasets has provided us a great opportunity to better capture and understand the complexity and dynamics of natural phenomena. Challenges are posed by the formalization of the representation of such phenomena in terms of their non-rigid boundaries and the quantification of event dynamics over space and time. The objectives of this research are to (1) conceptually represent the natural phenomenon as an event, and (2) quantify the dynamic movements and evolutions of events using a graph-based approach. This proposed data framework is applied to a dust simulation dataset to represent the 4D dynamic dust events. Dust events are identified, and movements are tracked to reconstruct dust events in the Northern Africa region from December 2013 to November 2014. Quantified dynamics of different dust events are demonstrated and verified to be in alignment with observations. Full article
Show Figures

Figure 1

14 pages, 3391 KiB  
Article
Using Areal Interpolation to Deal with Differing Regional Structures in International Research
by Pavlína Netrdová, Vojtěch Nosek and Pavol Hurbánek
ISPRS Int. J. Geo-Inf. 2020, 9(2), 126; https://doi.org/10.3390/ijgi9020126 - 22 Feb 2020
Cited by 5 | Viewed by 2540
Abstract
When working with regional data from different countries, issues concerning data comparability need to be solved, including regional comparability. Differing regional unit size is a common issue which influences the results of socio-economic analyses. In this paper, we introduce a strategy to deal [...] Read more.
When working with regional data from different countries, issues concerning data comparability need to be solved, including regional comparability. Differing regional unit size is a common issue which influences the results of socio-economic analyses. In this paper, we introduce a strategy to deal with the regional incomparability of administrative data in international research. We propose a methodological approach based on the areal interpolation method, which facilitates the usage of advanced spatial analyses. To illustrate, we analyze spatial patterns of unemployment in seven Central European countries. We use a very detailed spatial (municipal) level to reveal local tendencies. To have comparable units across the whole region, we apply the areal interpolation method, a process of projecting data from source administrative units to the target structure of a grid. After choosing the most suitable grid structure and projecting the data onto the grid, we perform a hot spot analysis to show the benefits of the grid structure for socio-economic analyses. The proposed approach has great potential in international research for its methodological correctness and the ability to interpret results. Full article
Show Figures

Figure 1

33 pages, 14037 KiB  
Article
Analyzing Social-Geographic Human Mobility Patterns Using Large-Scale Social Media Data
by Zeinab Ebrahimpour, Wanggen Wan, José Luis Velázquez García, Ofelia Cervantes and Li Hou
ISPRS Int. J. Geo-Inf. 2020, 9(2), 125; https://doi.org/10.3390/ijgi9020125 - 21 Feb 2020
Cited by 23 | Viewed by 5056
Abstract
Social media data analytics is the art of extracting valuable hidden insights from vast amounts of semi-structured and unstructured social media data to enable informed and insightful decision-making. Analysis of social media data has been applied for discovering patterns that may support urban [...] Read more.
Social media data analytics is the art of extracting valuable hidden insights from vast amounts of semi-structured and unstructured social media data to enable informed and insightful decision-making. Analysis of social media data has been applied for discovering patterns that may support urban planning decisions in smart cities. In this paper, Weibo social media data are used to analyze social-geographic human mobility in the CBD area of Shanghai to track citizen’s behavior. Our main motivation is to test the validity of geo-located Weibo data as a source for discovering human mobility and activity patterns. In addition, our goal is to identify important locations in people’s lives with the support of location-based services. The algorithms used are described and the results produced are presented using adequate visualization techniques to illustrate the detected human mobility patterns obtained by the large-scale social media data in order to support smart city planning decisions. The outcome of this research is helpful not only for city planners, but also for business developers who hope to extend their services to citizens. Full article
(This article belongs to the Special Issue Recent Trends in Location Based Services and Science)
Show Figures

Figure 1

19 pages, 3101 KiB  
Article
A New Approach to Refining Land Use Types: Predicting Point-of-Interest Categories Using Weibo Check-in Data
by Xucai Zhang, Yeran Sun, Anyao Zheng and Yu Wang
ISPRS Int. J. Geo-Inf. 2020, 9(2), 124; https://doi.org/10.3390/ijgi9020124 - 21 Feb 2020
Cited by 25 | Viewed by 3646
Abstract
The information of land use plays an important role in urban planning and optimizing the allocation of resources. However, traditional land use classification is imprecise. For instance, the type of commercial land is highly filled with the categories of shopping, eating, etc. The [...] Read more.
The information of land use plays an important role in urban planning and optimizing the allocation of resources. However, traditional land use classification is imprecise. For instance, the type of commercial land is highly filled with the categories of shopping, eating, etc. The number of mixed-use lands is increasingly growing nowadays, and these lands sometimes are too mixed to be well investigated by conventional approaches such as remote sensing technology. To address this issue, we used a new social sensing approach to classify land use according to human mobility and activity patterns. Previous studies used other social sensing approaches to predict land use types at the parcel or the area level, whilst fine-grained point-of-interest (POI)-level land use data are likely to more useful in urban planning. To abridge this research gap, we proposed a new social sensing approach dedicated to classifying land use at a finer scale (i.e., POI-level or building level) according to human mobility and activity patterns reflected by location-based social network (LBSN) data. Specifically, we firstly investigated spatial and temporal patterns of human mobility and activity behavior using check-in data from a popular Chinese LBSN named Sina Weibo and subsequently applied those patterns to predicting the category of POI to refine urban land use classification in Guangzhou, China. In this study, we applied three classification methods (i.e., naive Bayes, support vector machines, and random forest) to recognize category of a certain POI by spatial and temporal features of human mobility and activity behavior as well as POIs’ locational characteristics. Random forest outperformed the other two methods and obtained an overall accuracy of 72.21%. Apart from that, we compared the results of the different rules in filtering check-in samples. The comparison results show that a reasonable rule to select samples is essential for predicting the category of POI. Moreover, the approach proposed in this study can be potentially applied to identifying functions of buildings according to visitors’ mobility and activity behavior and buildings’ locational characteristics. Full article
(This article belongs to the Special Issue Convergence of GIS and Social Media)
Show Figures

Figure 1

14 pages, 6769 KiB  
Article
Automatic Threat Detection for Historic Buildings in Dark Places Based on the Modified OptD Method
by Wioleta Błaszczak-Bąk, Czesław Suchocki, Joanna Janicka, Andrzej Dumalski, Robert Duchnowski and Anna Sobieraj-Żłobińska
ISPRS Int. J. Geo-Inf. 2020, 9(2), 123; https://doi.org/10.3390/ijgi9020123 - 21 Feb 2020
Cited by 16 | Viewed by 2163
Abstract
Historic buildings, due to their architectural, cultural, and historical value, are the subject of preservation and conservatory works. Such operations are preceded by an inventory of the object. One of the tools that can be applied for such purposes is Light Detection and [...] Read more.
Historic buildings, due to their architectural, cultural, and historical value, are the subject of preservation and conservatory works. Such operations are preceded by an inventory of the object. One of the tools that can be applied for such purposes is Light Detection and Ranging (LiDAR). This technology provides information about the position, reflection, and intensity values of individual points; thus, it allows for the creation of a realistic visualization of the entire scanned object. Due to the fact that LiDAR allows one to ‘see’ and extract information about the structure of an object without the need for external lighting or daylight, it can be a reliable and very convenient tool for data analysis for improving safety and avoiding disasters. The main goal of this paper is to present an approach of automatic wall defect detection in unlit sites by means of a modified Optimum Dataset (OptD) method. In this study, the results of Terrestrial Laser Scanning (TLS) measurements conducted in two historic buildings in rooms without daylight are presented. One location was in the basement of the ruins of a medieval tower located in Dobre Miasto, Poland, and the second was in the basement of a century-old building located at the University of Warmia and Mazury in Olsztyn, Poland. The measurements were performed by means of a Leica C-10 scanner. The acquired dataset of x, y, z, and intensity was processed by the OptD method. The OptD operates in such a way that within the area of interest where surfaces are imperfect (e.g., due to cracks and cavities), more points are preserved, while at homogeneous surfaces (areas of low interest), more points are removed (redundant information). The OptD algorithm was additionally modified by introducing options to detect and segment defects on a scale from 0 to 3 (0—harmless, 1—to the inventory, 2—requiring repair, 3—dangerous). The survey results obtained proved the high effectiveness of the modified OptD method in the detection and segmentation of the wall defects. The values of area of changes were calculated. The obtained information about the size of the change can be used to estimate the costs of repair, renovation, and reconstruction. Full article
Show Figures

Figure 1

21 pages, 6298 KiB  
Article
The Indoor Localization of a Mobile Platform Based on Monocular Vision and Coding Images
by Fei Liu, Jixian Zhang, Jian Wang and Binghao Li
ISPRS Int. J. Geo-Inf. 2020, 9(2), 122; https://doi.org/10.3390/ijgi9020122 - 21 Feb 2020
Cited by 4 | Viewed by 2404
Abstract
With the extensive development and utilization of urban underground space, coal mines, and other indoor areas, the indoor positioning technology of these areas has become a hot research topic. This paper proposes a robust localization method for indoor mobile platforms. Firstly, a series [...] Read more.
With the extensive development and utilization of urban underground space, coal mines, and other indoor areas, the indoor positioning technology of these areas has become a hot research topic. This paper proposes a robust localization method for indoor mobile platforms. Firstly, a series of coding graphics were designed for localizing the platform, and the spatial coordinates of these coding graphics were calculated by using a new method proposed in this paper. Secondly, two spatial resection models were constructed based on unit weight and Tukey weight to localize the platform in indoor environments. Lastly, the experimental results show that both models can calculate the position of the platform with good accuracy. The space resection model based on Tukey weight correctly identified the residuals of the observations for calculating the weights to obtain robust positioning results and has a high positioning accuracy. The navigation and positioning method proposed in this study has a high localization accuracy and can be potentially used in localizing practical indoor space mobile platforms. Full article
Show Figures

Figure 1

26 pages, 12480 KiB  
Article
A Harmonized Data Model for Noise Simulation in the EU
by Kavisha Kumar, Hugo Ledoux, Richard Schmidt, Theo Verheij and Jantien Stoter
ISPRS Int. J. Geo-Inf. 2020, 9(2), 121; https://doi.org/10.3390/ijgi9020121 - 21 Feb 2020
Cited by 10 | Viewed by 3738
Abstract
This paper presents our implementation of a harmonized data model for noise simulations in the European Union (EU). Different noise assessment methods are used by different EU member states (MS) for estimating noise at local, regional, and national scales. These methods, along with [...] Read more.
This paper presents our implementation of a harmonized data model for noise simulations in the European Union (EU). Different noise assessment methods are used by different EU member states (MS) for estimating noise at local, regional, and national scales. These methods, along with the input data extracted from the national registers and databases, as well as other open and/or commercially available data, differ in several aspects and it is difficult to obtain comparable results across the EU. To address this issue, a common framework for noise assessment methods (CNOSSOS-EU) was developed by the European Commission’s (EC) Joint Research Centre (JRC). However, apart from the software implementations for CNOSSOS, very little has been done for the practical guidelines outlining the specifications for the required input data, metadata, and the schema design to test the real-world situations with CNOSSOS. We describe our approach for modeling input and output data for noise simulations and also generate a real world dataset of an area in the Netherlands based on our data model for simulating urban noise using CNOSSOS. Full article
Show Figures

Figure 1

15 pages, 24263 KiB  
Article
Fusion of Sentinel-1 with Official Topographic and Cadastral Geodata for Crop-Type Enriched LULC Mapping Using FOSS and Open Data
by Christoph Hütt, Guido Waldhoff and Georg Bareth
ISPRS Int. J. Geo-Inf. 2020, 9(2), 120; https://doi.org/10.3390/ijgi9020120 - 21 Feb 2020
Cited by 13 | Viewed by 4166
Abstract
Accurate crop-type maps are urgently needed as input data for various applications, leading to improved planning and more sustainable use of resources. Satellite remote sensing is the optimal tool to provide such data. Images from Synthetic Aperture Radar (SAR) satellite sensors are preferably [...] Read more.
Accurate crop-type maps are urgently needed as input data for various applications, leading to improved planning and more sustainable use of resources. Satellite remote sensing is the optimal tool to provide such data. Images from Synthetic Aperture Radar (SAR) satellite sensors are preferably used as they work regardless of cloud coverage during image acquisition. However, processing of SAR is more complicated and the sensors have development potential. Dealing with such a complexity, current studies should aim to be reproducible, open, and built upon free and open-source software (FOSS). Thereby, the data can be reused to develop and validate new algorithms or improve the ones already in use. This paper presents a case study of crop classification from microwave remote sensing, relying on open data and open software only. We used 70 multitemporal microwave remote sensing images from the Sentinel-1 satellite. A high-resolution, high-precision digital elevation model (DEM) assisted the preprocessing. The multi-data approach (MDA) was used as a framework enabling to demonstrate the benefits of including external cadastral data. It was used to identify the agricultural area prior to the classification and to create land use/land cover (LULC) maps which also include the annually changing crop types that are usually missing in official geodata. All the software used in this study is open-source, such as the Sentinel Application Toolbox (SNAP), Orfeo Toolbox, R, and QGIS. The produced geodata, all input data, and several intermediate data are openly shared in a research database. Validation using an independent validation dataset showed a high overall accuracy of 96.7% with differentiation into 11 different crop-classes. Full article
Show Figures

Figure 1

20 pages, 3878 KiB  
Article
Geoweaver: Advanced Cyberinfrastructure for Managing Hybrid Geoscientific AI Workflows
by Ziheng Sun, Liping Di, Annie Burgess, Jason A. Tullis and Andrew B. Magill
ISPRS Int. J. Geo-Inf. 2020, 9(2), 119; https://doi.org/10.3390/ijgi9020119 - 21 Feb 2020
Cited by 20 | Viewed by 5758
Abstract
AI (artificial intelligence)-based analysis of geospatial data has gained a lot of attention. Geospatial datasets are multi-dimensional; have spatiotemporal context; exist in disparate formats; and require sophisticated AI workflows that include not only the AI algorithm training and testing, but also data preprocessing [...] Read more.
AI (artificial intelligence)-based analysis of geospatial data has gained a lot of attention. Geospatial datasets are multi-dimensional; have spatiotemporal context; exist in disparate formats; and require sophisticated AI workflows that include not only the AI algorithm training and testing, but also data preprocessing and result post-processing. This complexity poses a huge challenge when it comes to full-stack AI workflow management, as researchers often use an assortment of time-intensive manual operations to manage their projects. However, none of the existing workflow management software provides a satisfying solution on hybrid resources, full file access, data flow, code control, and provenance. This paper introduces a new system named Geoweaver to improve the efficiency of full-stack AI workflow management. It supports linking all the preprocessing, AI training and testing, and post-processing steps into a single automated workflow. To demonstrate its utility, we present a use case in which Geoweaver manages end-to-end deep learning for in-time crop mapping using Landsat data. We show how Geoweaver effectively removes the tedium of managing various scripts, code, libraries, Jupyter Notebooks, datasets, servers, and platforms, greatly reducing the time, cost, and effort researchers must spend on such AI-based workflows. The concepts demonstrated through Geoweaver serve as an important building block in the future of cyberinfrastructure for AI research. Full article
(This article belongs to the Special Issue GIS Software and Engineering for Big Data)
Show Figures

Figure 1

20 pages, 4712 KiB  
Article
Developing a Serious Game That Supports the Resolution of Social and Ecological Problems in the Toolset Environment of Cities: Skylines
by Robert Olszewski, Mateusz Cegiełka, Urszula Szczepankowska and Jacek Wesołowski
ISPRS Int. J. Geo-Inf. 2020, 9(2), 118; https://doi.org/10.3390/ijgi9020118 - 20 Feb 2020
Cited by 10 | Viewed by 6190
Abstract
Game engines are not only capable of creating virtual worlds or providing entertainment, but also of modelling actual geographical space and producing solutions that support the process of social participation. This article presents an authorial concept of using the environment of Cities: Skylines [...] Read more.
Game engines are not only capable of creating virtual worlds or providing entertainment, but also of modelling actual geographical space and producing solutions that support the process of social participation. This article presents an authorial concept of using the environment of Cities: Skylines and the C# programming language to automate the process of importing official topographic data into the game engine and developing a prototype of a serious game that supports solving social and ecological problems. The model—developed using digital topographic data, digital terrain models, and CityGML 3D models—enabled the creation of a prototype of a serious game, later endorsed by the residents of the municipality, local authorities, as well as the Ministry of Investment and Economic Development. Full article
(This article belongs to the Special Issue Gaming and Geospatial Information)
Show Figures

Figure 1

14 pages, 5832 KiB  
Article
Complexity Level of People Gathering Presentation on an Animated Map—Objective Effectiveness Versus Expert Opinion
by Beata Medyńska-Gulij, Łukasz Wielebski, Łukasz Halik and Maciej Smaczyński
ISPRS Int. J. Geo-Inf. 2020, 9(2), 117; https://doi.org/10.3390/ijgi9020117 - 20 Feb 2020
Cited by 16 | Viewed by 2616
Abstract
The aim of the following study was to present three alternative methods of visualization on animated maps illustrating the movement of people gathered at an open-air event recorded on photographs taken by a drone. The effectiveness of an orthorectified low-level aerial image (a [...] Read more.
The aim of the following study was to present three alternative methods of visualization on animated maps illustrating the movement of people gathered at an open-air event recorded on photographs taken by a drone. The effectiveness of an orthorectified low-level aerial image (a so-called orthophoto), a dot distribution map, and a buffer map was tested in an experiment featuring experts, and key significance was attached to the juxtaposition of objective responses with subjective opinions. The results of the study enabled its authors to draw conclusions regarding the importance of visualizing topographic references (stable objects) and people (mobile objects) and the usefulness of the particular elements of animated maps for their analysis and interpretation. Full article
(This article belongs to the Special Issue Multimedia Cartography)
Show Figures

Figure 1

17 pages, 3549 KiB  
Article
Predicting Future Locations of Moving Objects by Recurrent Mixture Density Network
by Rui Chen, Mingjian Chen, Wanli Li and Naikun Guo
ISPRS Int. J. Geo-Inf. 2020, 9(2), 116; https://doi.org/10.3390/ijgi9020116 - 20 Feb 2020
Cited by 13 | Viewed by 2529
Abstract
Accurate and timely location prediction of moving objects is crucial for intelligent transportation systems and traffic management. In recent years, ubiquitous location acquisition technologies have provided the opportunity for mining knowledge from trajectories, making location prediction and real-time decisions more feasible. Previous location [...] Read more.
Accurate and timely location prediction of moving objects is crucial for intelligent transportation systems and traffic management. In recent years, ubiquitous location acquisition technologies have provided the opportunity for mining knowledge from trajectories, making location prediction and real-time decisions more feasible. Previous location prediction methods have mostly developed on the basis of shallow models whereas shallow models are not competent for some tricky challenges such as multi-time-step location coordinates prediction. Motivated by the current study status, we are dedicated to a deep-learning-based approach to predict the coordinates of several future locations of moving objects based on recent trajectory records. The method of this work consists of three successive parts: trajectory preprocessing, prediction model construction, and post-processing. In this work, a prediction model named the bidirectional recurrent mixture density network (BiRMDN) was constructed by integrating the long short-term memory (LSTM) and mixture density network (MDN) together. This model has the ability to learn long-term contextual information from recent trajectory and model real-valued location coordinates. We employed a vessel trajectory dataset for the implementation of this approach and determined the optimal model configuration after several parameter analysis experiments. Experimental results involving a performance comparison with other widely used methods demonstrate the superiority of the BiRMDN model. Full article
Show Figures

Figure 1

15 pages, 2751 KiB  
Article
Assessing Similarities and Differences between Males and Females in Visual Behaviors in Spatial Orientation Tasks
by Weihua Dong, Zhicheng Zhan, Hua Liao, Liqiu Meng and Jiping Liu
ISPRS Int. J. Geo-Inf. 2020, 9(2), 115; https://doi.org/10.3390/ijgi9020115 - 20 Feb 2020
Cited by 7 | Viewed by 6840
Abstract
Spatial orientation is an important task in human wayfinding. Existing research indicates sex-related similarities and differences in performance and strategies when executing spatial orientation behaviors, but few studies have investigated the similarities and differences in visual behaviors between males and females. To address [...] Read more.
Spatial orientation is an important task in human wayfinding. Existing research indicates sex-related similarities and differences in performance and strategies when executing spatial orientation behaviors, but few studies have investigated the similarities and differences in visual behaviors between males and females. To address this research gap, we explored visual behavior similarities and differences between males and females using an eye-tracking method. We recruited 40 participants to perform spatial orientation tasks in a desktop environment and recorded their eye-tracking data during these tasks. The results indicate that there are no significant differences between sexes in efficiency and accuracy of spatial orientation. In terms of visual behaviors, we found that males fixated significantly longer than females on roads. Males and females had similar fixation counts in building, signpost, map, and other objects. Males and females performed similarly in fixation duration for all five classes. Moreover, fixation duration was well fitted to an exponential function for both males and females. The base of the exponential function fitted by males’ fixation duration was significantly lower than that of females, and the coefficient difference of exponential function was not found. Females were more effective in switching from maps to signposts, but differences of switches from map to other classes were not found. The newfound similarities and differences between males and females in visual behavior may aid in the design of better human-centered outdoor navigation applications. Full article
Show Figures

Graphical abstract

25 pages, 18237 KiB  
Article
Use of Mamdani Fuzzy Algorithm for Multi-Hazard Susceptibility Assessment in a Developing Urban Settlement (Mamak, Ankara, Turkey)
by Tugce Yanar, Sultan Kocaman and Candan Gokceoglu
ISPRS Int. J. Geo-Inf. 2020, 9(2), 114; https://doi.org/10.3390/ijgi9020114 - 19 Feb 2020
Cited by 44 | Viewed by 5904
Abstract
Urban areas may be affected by multiple hazards, and integrated hazard susceptibility maps are needed for suitable site selection and planning. Furthermore, geological–geotechnical parameters, construction costs, and the spatial distribution of existing infrastructure should be taken into account for this purpose. Up-to-date land-use [...] Read more.
Urban areas may be affected by multiple hazards, and integrated hazard susceptibility maps are needed for suitable site selection and planning. Furthermore, geological–geotechnical parameters, construction costs, and the spatial distribution of existing infrastructure should be taken into account for this purpose. Up-to-date land-use and land-cover (LULC) maps, as well as natural hazard susceptibility maps, can be frequently obtained from high-resolution satellite sensors. In this study, an integrated hazard susceptibility assessment was performed for a developing urban settlement (Mamak District of Ankara City, Turkey) considering landslide and flood potential. The flood susceptibility map of Ankara City was produced in a previous study using modified analytical hierarchical process (M-AHP) approach. The landslide susceptibility map was produced using the logistic regression technique in this study. Sentinel-2 images were employed for generating LULC data with the random forest classification method. Topographical derivatives obtained from a high-resolution digital elevation model and lithological parameters were employed for the production of landslide susceptibility maps. For the integrated hazard susceptibility assessment, the Mamdani fuzzy algorithm was considered, and the results are discussed in the present study. The results demonstrate that multi-hazard susceptibility assessment maps for urban planning can be obtained by combining a set of expert-based and ensemble learning methods. Full article
(This article belongs to the Special Issue GI for Disaster Management)
Show Figures

Figure 1

20 pages, 8098 KiB  
Article
A Spatiotemporal Dilated Convolutional Generative Network for Point-Of-Interest Recommendation
by Chunyang Liu, Jiping Liu, Shenghua Xu, Jian Wang, Chao Liu, Tianyang Chen and Tao Jiang
ISPRS Int. J. Geo-Inf. 2020, 9(2), 113; https://doi.org/10.3390/ijgi9020113 - 19 Feb 2020
Cited by 11 | Viewed by 3330
Abstract
With the growing popularity of location-based social media applications, point-of-interest (POI) recommendation has become important in recent years. Several techniques, especially the collaborative filtering (CF), Markov chain (MC), and recurrent neural network (RNN) based methods, have been recently proposed for the POI recommendation [...] Read more.
With the growing popularity of location-based social media applications, point-of-interest (POI) recommendation has become important in recent years. Several techniques, especially the collaborative filtering (CF), Markov chain (MC), and recurrent neural network (RNN) based methods, have been recently proposed for the POI recommendation service. However, CF-based methods and MC-based methods are ineffective to represent complicated interaction relations in the historical check-in sequences. Although recurrent neural networks (RNNs) and its variants have been successfully employed in POI recommendation, they depend on a hidden state of the entire past that cannot fully utilize parallel computation within a check-in sequence. To address these above limitations, we propose a spatiotemporal dilated convolutional generative network (ST-DCGN) for POI recommendation in this study. Firstly, inspired by the Google DeepMind’ WaveNet model, we introduce a simple but very effective dilated convolutional generative network as a solution to POI recommendation, which can efficiently model the user’s complicated short- and long-range check-in sequence by using a stack of dilated causal convolution layers and residual block structure. Then, we propose to acquire user’s spatial preference by modeling continuous geographical distances, and to capture user’s temporal preference by considering two types of time periodic patterns (i.e., hours in a day and days in a week). Moreover, we conducted an extensive performance evaluation using two large-scale real-world datasets, namely Foursquare and Instagram. Experimental results show that the proposed ST-DCGN model is well-suited for POI recommendation problems and can effectively learn dependencies in and between the check-in sequences. The proposed model attains state-of-the-art accuracy with less training time in the POI recommendation task. Full article
Show Figures

Figure 1

35 pages, 4296 KiB  
Article
Smart Tour Route Planning Algorithm Based on Naïve Bayes Interest Data Mining Machine Learning
by Xiao Zhou, Mingzhan Su, Zhong Liu, Yu Hu, Bin Sun and Guanghui Feng
ISPRS Int. J. Geo-Inf. 2020, 9(2), 112; https://doi.org/10.3390/ijgi9020112 - 19 Feb 2020
Cited by 13 | Viewed by 3861
Abstract
A smart tour route planning algorithm based on a Naïve Bayes interest data mining machine learning is brought forward in the paper, according to the problems of current tour route planning methods. A machine learning model of Naïve Bayes interest data mining is [...] Read more.
A smart tour route planning algorithm based on a Naïve Bayes interest data mining machine learning is brought forward in the paper, according to the problems of current tour route planning methods. A machine learning model of Naïve Bayes interest data mining is set up by learning a mass of training data on tourists’ interests and needs. Through the recommended interest tourist site classifications from the machine learning module, the optimal tourist site mining algorithm based on the membership degree searching propagating tree of a tourist’s temporary accommodation is set up, which mines and outputs the optimal tourist sites. The mined optimal tourist sites are taken as seed points to set up a tour route planning algorithm based on the optimal propagating tree of a closed-loop structure. Through the proposed algorithm, an experiment is designed and performed to output optimal tour routes conforming to tourists’ needs and interests, including the propagating tree closed-loop structures, a minimum heap of propagating tree weight function value, and a weight function value complete binary tree. We prove that the proposed algorithm has the features of intelligence and accuracy, and it can learn tourists’ needs and interests to output optimal tourist sites and tour routes and ensure that tourists can get the best motive benefits and travel experience in the tour process, by analyzing the experiment data and results. Full article
(This article belongs to the Special Issue Smart Tourism: A GIS-Based Approach)
Show Figures

Graphical abstract

17 pages, 6458 KiB  
Article
Vegetation Phenological Changes in Multiple Landforms and Responses to Climate Change
by Hongzhu Han, Jianjun Bai, Gao Ma and Jianwu Yan
ISPRS Int. J. Geo-Inf. 2020, 9(2), 111; https://doi.org/10.3390/ijgi9020111 - 19 Feb 2020
Cited by 18 | Viewed by 3252
Abstract
Vegetation phenology is highly sensitive to climate change, and the phenological responses of vegetation to climate factors vary over time and space. Research on the vegetation phenology in different climatic regimes will help clarify the key factors affecting vegetation changes. In this paper, [...] Read more.
Vegetation phenology is highly sensitive to climate change, and the phenological responses of vegetation to climate factors vary over time and space. Research on the vegetation phenology in different climatic regimes will help clarify the key factors affecting vegetation changes. In this paper, based on a time-series reconstruction of Moderate-Resolution Imaging Spectroradiometer (MODIS) normalized difference vegetation index (NDVI) data using the Savitzky–Golay filtering method, the phenology parameters of vegetation were extracted, and the Spatio-temporal changes from 2001 to 2016 were analyzed. Moreover, the response characteristics of the vegetation phenology to climate changes, such as changes in temperature, precipitation, and sunshine hours, were discussed. The results showed that the responses of vegetation phenology to climatic factors varied within different climatic regimes and that the Spatio-temporal responses were primarily controlled by the local climatic and topographic conditions. The following were the three key findings. (1) The start of the growing season (SOS) has a regular variation with the latitude, and that in the north is later than that in the south. (2) In arid areas in the north, the SOS is mainly affected by the temperature, and the end of the growing season (EOS) is affected by precipitation, while in humid areas in the south, the SOS is mainly affected by precipitation, and the EOS is affected by the temperature. (3) Human activities play an important role in vegetation phenology changes. These findings would help predict and evaluate the stability of different ecosystems. Full article
Show Figures

Figure 1

18 pages, 4590 KiB  
Article
The Use of AHP to Prioritize Five Waste Processing Plants Locations in Krakow
by Monika Siejka
ISPRS Int. J. Geo-Inf. 2020, 9(2), 110; https://doi.org/10.3390/ijgi9020110 - 18 Feb 2020
Cited by 3 | Viewed by 2211
Abstract
The purpose of the paper is to use the analytic hierarchy process (AHP) to determine the prioritization of areas designated for infrastructure investments. The research was carried out using an example of a municipal solid waste incineration plant in Kraków. Based on research [...] Read more.
The purpose of the paper is to use the analytic hierarchy process (AHP) to determine the prioritization of areas designated for infrastructure investments. The research was carried out using an example of a municipal solid waste incineration plant in Kraków. Based on research tests conducted on actual field data, this paper proves that spatial information systems can be a useful source of information in decision-making processes related to the assessment of the location of an investment project with a function so important for the natural environment and maintaining the principle of sustainable development. Owing to the development of technologies such as remote sensing and GIS, the obtained data are of high quality, and the possibility for processing and making them available in real time makes them up to date. The research methodology for selecting areas for a well-defined purpose includes five separate stages: Defining the parameters, acquiring data from spatial information systems, data standardization, criteria weighting by the analytic hierarchy process (AHP), calculation of the coefficient of area suitability for the location of a particular facility, and its graphic representation on a map. The final result is the ranking of areas in terms of suitability for the implementation of an infrastructural project i.e., the construction of a municipal waste incineration plant. Full article
Show Figures

Figure 1

15 pages, 4186 KiB  
Article
Research on an Urban Building Area Extraction Method with High-Resolution PolSAR Imaging Based on Adaptive Neighborhood Selection Neighborhoods for Preserving Embedding
by Bo Cheng, Shiai Cui, Xiaoxiao Ma and Chenbin Liang
ISPRS Int. J. Geo-Inf. 2020, 9(2), 109; https://doi.org/10.3390/ijgi9020109 - 14 Feb 2020
Cited by 4 | Viewed by 2166
Abstract
Feature extraction of an urban area is one of the most important directions of polarimetric synthetic aperture radar (PolSAR) applications. A high-resolution PolSAR image has the characteristics of high dimensions and nonlinearity. Therefore, to find intrinsic features for target recognition, a building area [...] Read more.
Feature extraction of an urban area is one of the most important directions of polarimetric synthetic aperture radar (PolSAR) applications. A high-resolution PolSAR image has the characteristics of high dimensions and nonlinearity. Therefore, to find intrinsic features for target recognition, a building area extraction method for PolSAR images based on the Adaptive Neighborhoods selection Neighborhood Preserving Embedding (ANSNPE) algorithm is proposed. First, 52 features are extracted by using the Gray level co-occurrence matrix (GLCM) and five polarization decomposition methods. The feature set is divided into 20 dimensions, 36 dimensions, and 52 dimensions. Next, the ANSNPE algorithm is applied to the training samples, and the projection matrix is obtained for the test image to extract the new features. Lastly, the Support Vector machine (SVM) classifier and post processing are used to extract the building area, and the accuracy is evaluated. Comparative experiments are conducted using Radarsat-2, and the results show that the ANSNPE algorithm could effectively extract the building area and that it had a better generalization ability; the projection matrix is obtained using the training data and could be directly applied to the new sample, and the building area extraction accuracy is above 80%. The combination of polarization and texture features provide a wealth of information that is more conducive to the extraction of building areas. Full article
Show Figures

Figure 1

20 pages, 5352 KiB  
Article
Modeling the Optimal Baseline for a Spaceborne Bistatic SAR System to Generate DEMs
by Shijin Li, Shubi Zhang, Tao Li, Yandong Gao, Qianfu Chen and Xiang Zhang
ISPRS Int. J. Geo-Inf. 2020, 9(2), 108; https://doi.org/10.3390/ijgi9020108 - 14 Feb 2020
Cited by 2 | Viewed by 2072
Abstract
Interferometric synthetic aperture radar (InSAR) is one of the best methods for obtaining digital elevation models (DEMs). However, the problem of the uncertainty of DEM accuracy affected by the perpendicular baseline still persists, which should be as long as possible to ensure the [...] Read more.
Interferometric synthetic aperture radar (InSAR) is one of the best methods for obtaining digital elevation models (DEMs). However, the problem of the uncertainty of DEM accuracy affected by the perpendicular baseline still persists, which should be as long as possible to ensure the sensitivity of the phase to the height measurement, and as small as possible to ensure a high spatial coherence. Moreover, the baseline configuration design of bistatic SAR system lacks a more detailed model for reference to generate high-precision DEM. Therefore, in this paper, the optimal baseline is modeled to maximize the accuracy of height measurement. First, we analyze the influence of system parameters on the height measurement accuracy, and a propagation model from the parameter estimation error to the elevation error is derived. Then, the phase unwrapping error (PUE) that considers the spatial baseline coherence, terrain slope and phase unwrapping effectiveness is modeled and analyzed after interferometric phase simulation and adaptive unscented Kalman filter phase unwrapping. Combining the relationship between the height error and the PUE, the optimal baseline model is obtained by statistical analysis. Finally, weighted averages are used to calculate the average slope of the complex terrain and the validity and reliability of the proposed optimal baseline model are verified by two examples of complex terrains with uniformly and nonuniformly distributed positive and negative slope angles. Moreover, the optimal baseline ranges of different terrain types are also derived for reference. Full article
Show Figures

Figure 1

Previous Issue
Next Issue
Back to TopTop