Abstract
Positioning is an essential element in most Internet of Things (IoT) applications. Global Positioning System (GPS) chips have high cost and power consumption, making it unsuitable for long-range (LoRa) and low-power IoT devices. Alternatively, low-power wide-area (LPWA) signals can be used for simultaneous positioning and communication. We summarize previous studies related to LoRa signal-based positioning systems, including those addressing proximity, a path loss model, time difference of arrival (TDoA), and fingerprint positioning methods. We propose a LoRa signal-based positioning method that uses a fingerprint algorithm instead of a received signal strength indicator (RSSI) proximity or TDoA method. The main objective of this study was to evaluate the accuracy and usability of the fingerprint algorithm for large areas in the real world. We estimated the locations using probabilistic means based on three different algorithms that use interpolated fingerprint RSSI maps. The average accuracy of the three proposed algorithms in our experiments was 28.8 m. Our method also reduced the battery consumption significantly compared with that of existing GPS-based positioning methods.
1. Introduction
In recent years, the number of Internet of Things (IoT) devices has increased exponentially with the decreasing costs of hardware and communication technologies [1]. IoT devices need to communicate with each other to transmit data packets among themselves. Medium- and long-range IoT devices use both cellular- and noncellular-based communication technologies. Low-power wide-area (LPWA) communication, a noncellular-based communication technology, allows long-range communication among IoT devices with low power consumption and cost. Thus, LPWA communication is highly suitable for long-range wireless IoT devices despite its low bandwidth constraint. Figure 1 shows a comparison of common communication technologies including LPWA.
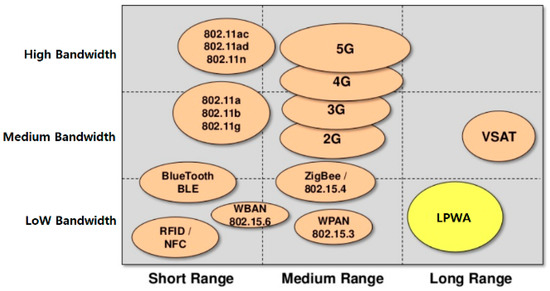
Figure 1.
Telecommunication methods [2].
Positioning is an essential element in most IoT applications. Global Positioning System (GPS) has been widely used for positioning in most IoT applications. However, GPS chips are rather expensive and have high power requirements, making them unsuitable for long-range and low-power IoT devices. For example, Fargas et al. found that a device equipped with GPS and Global System for Mobile communication (GSM) chips consumed around 30–40 times the power consumed by a device equipped with only a long-range (LoRa) chip [3]. Furthermore, GPS functions and communication functions need to be provided separately, making it difficult to miniaturize devices and greatly increasing their production costs.
Alternatively, LPWA signals can be used for both positioning and communication simultaneously. Therefore, in this study, we focused on LoRa, an LPWA communication technology, that uses Semtech Corporation’s proprietary CSS (chirp spread spectrum) modulation scheme. It trades off data rate and sensitivity within a fixed channel bandwidth. LoRa is a physical (PHY) layer implementation, and therefore, it is independent of higher-layer implementations. Thus, LoRa is interoperable with existing network architectures [4].
The LoRa Alliance released a Long-Range Wide Area Network (LoRaWAN) geolocation whitepaper. LoRaWAN uses the LoRa spectrum modulation method. Its system architecture and communication protocol influence battery life, network capacity, quality of service, security, and so on [5]. The whitepaper compared the cost, battery life, and positioning accuracy of GPS/assisted GPS (AGPS), Bluetooth Low Energy (BLE), Wi-Fi, and LoRaWAN. GPS/AGPS, BLE, and Wi-Fi were found to consume more power than LoRaWAN. The whitepaper also compared the LoRaWAN received signal strength indicator (RSSI) proximity and LoRaWAN time difference of arrival (TDoA) methods, as shown in Figure 2.
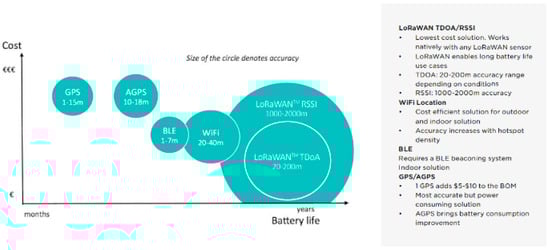
Figure 2.
Comparison of positioning technologies [6].
The LoRaWAN RSSI proximity method determines whether a LoRa gateway is located nearby by examining whether a signal can be received from it. The LoRa signal covers a wide area and complies with the log–distance path loss model [7]. The position can be calculated more precisely by measuring the decrease in signal intensity [6,7,8]. However, the LoRaWAN RSSI proximity method has a large error of approximately 1000–2000 m compared to that of the LoRaWAN TDoA method [6]; the error of the LoRaWAN TDoA method is more than 300 m because of the time resolution [9]. According to the LoRa Association’s whitepaper, LoRa gateways enable the accuracy of 20–200 m, which supports Semtech Corporation’s Geolocation Capability [6].
In this study, we propose a LoRa-signal-based positioning method that uses a fingerprint algorithm instead of the RSSI proximity or TDoA methods. We evaluate the accuracy and usability of this algorithm for large real-world areas. The remainder of this paper is organized as follows. Section 2 summarizes related works. Section 3 describes the proposed fingerprint algorithm. Section 4 presents an evaluation of the proposed methods using real-world data. Finally, Section 5 presents the conclusions of this study and discusses future works.
2. Related Work
In this section, we briefly outline current developments in positioning techniques in wireless IoT networks. Then, we with introduce the related works for LoRa signal based positioning using RSSI Proximity and the path-loss model, TDoA, and the fingerprint algorithm. The positioning techniques in IoT wireless network can be roughly divided into the following two categories: Time-based positioning such as time of arrival (ToA) and TDoA, and RSSI signal based positioning such as proximity, path-loss-model, and the fingerprint algorithm.
ToA can be measured when a signal is transmitted by an end-device and received at multiple gateways to estimate the distances from the corresponding gateways by multiplying the speed of light to the time. The location of an end-device can be calculated by the trilateration approach with the distances. TDoA can estimate the location by measuring the time differences at multiple pairs of gateways. To accomplish this, precise clocks at all gateways are required.
The proximity method estimates the location of an end-device by using the known location of the gateway; however, the positioning accuracy depends on the density of gateways in the network [10]. The path-loss model estimates the location of an end-device by mathematically formulating the characterization of radio wave propagation as a function of distance and other conditions. The fingerprint algorithm, also known as scene analysis, estimates the location of an end-device by matching the observed RSSI with the radio map containing RSSI data using a pattern matching method [10]. Usually, probabilistic methods, such as maximum likelihood estimator (MLE), are used for estimating the location [11,12]. The main drawback of the fingerprint algorithm is the need to generate radio map information for a target area and updating the radio map is also an issue.
These RSSI signal based approach and time-based approach can be combined together. Li studied a hybrid approach that fused RSSI and TDoA methods for the narrow-band ZigBee signal [13]. He recommended the fusion KNN-RF algorithm for the narrow-band LPWA signal such as LoRa and NB-IoT.
2.1. RSSI Proximity and Path-Loss-Model-Based Positioning
As shown in Figure 3, the link budget is the sum of signal power gains and losses from the transmitter to the receiver through a medium such as free air space, cable, waveguide, or optical fiber. The RSSI value is a measure of the received signal power [14].
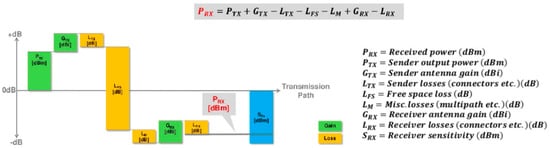
Figure 3.
Link budget calculation to measure RSSI values [2].
The RSSI proximity method requires the location of gateways to be known in advance. The location of an end-device can then be roughly calculated by examining whether it is within the service area. The location can be calculated more accurately by using the RSSI data and path loss model together.
Islam et al. experimentally measured the RSSI signal intensity over the distance in an indoor environment and investigated the relationship between the distribution and distance of RSSI values in non-line-of-sight and line-of-sight conditions using a path loss model [8]. Lam et al. studied gateway selection strategies for a LoRa-signal-based path loss model in an outdoor environment [7]. They found that positioning errors rapidly increased because of noise from gateways. To reduce these errors, they proposed a method for selecting optimal gateways based on k-means clustering.
2.2. TDoA-Based Positioning
The TDoA-based positioning method requires time synchronization only between gateways and not between a gateway and an end-device. Hyperbolas are formed by the set of locations for which the difference in distance from gateways is constant. The location of an end-device can be obtained by calculating their intersection point.
Figure 4 shows the TDoA-based positioning method. A LoRa end-device, indicated by the blue circle in the figure, sends an uplink packet to LoRa gateways. Each gateway records the packet arrival time by using a GPS time-synchronized gateway processor. The Geolocation Solver in the network calculates the differences between these arrival times. The location of the end-device is then determined by determining the point where hyperbolas overlap [6].
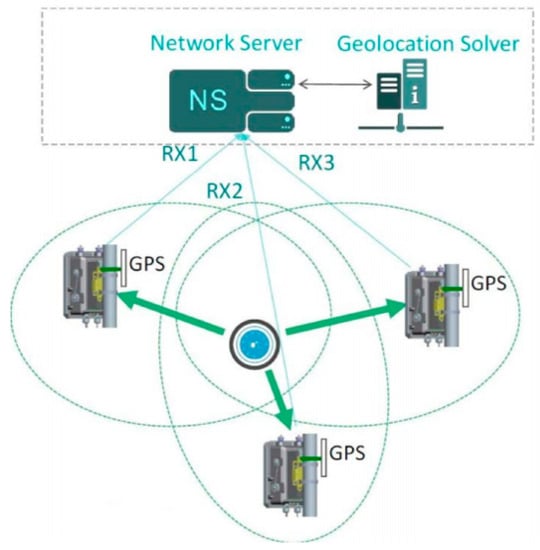
Figure 4.
Semtech Corporation’s TDoA-based geolocation architecture [6].
Semtech Corporation is the market-leading vendor of LoRa chips such as the SX1272 and SX1301 chips. These chipsets provide time information with microsecond-order accuracy only to licensed users. Semtech Corporation also offers a novel Geolocation Capability that provides encrypted nanosecond-order accuracy information using the Advanced Encryption Standard (AES) algorithm [6,15]. Only licensed gateway producers using the Geolocation Capability can provide nanosecond-order accuracy and precise positioning.
Kim et al. used Semtech Corporation’s SX1272 chips to apply the TDoA-based positioning method [9]. Although their study reported positioning error exceeding 300 m, it was meaningful in that it showed that TDoA-based positioning was possible with LoRa signals. Fargas et al. reduced the positioning error to ~100 m by adopting an iterative algorithm in their method [3].
2.3. Fingerprint-Algorithm-Based Positioning
Fingerprint-algorithm-based positioning consists of two phases. In the training (offline) phase, the characteristics of signals are collected and stored in a database for each sample point in the service area. In the positioning (online) phase, the location of an end-device is estimated and provided through a database search.
It is relatively easy to collect Wi-Fi signal strengths from many access points. Wi-Fi access points are present in most indoor environments, Wi-Fi signals of even private Wi-Fi networks can be freely measured [16]. The service area of Wi-Fi is smaller than that of LoRa, and therefore, it is unsuitable for outdoor positioning. Whereas a Wi-Fi signal can reach distances of only less than 100 m, a LoRa signal can reach distances of a few kilometers.
Smartphones receive downlink signals from access points for the positioning in Wi-Fi networks as shown in Figure 5a. Figure 5b shows that LoRa uplink signals are transmitted from an end-device to gateways and not vice versa, and therefore, only the owner of the LoRa network can access LoRa signal strength information. As a result, few studies have investigated positioning methods that used the fingerprint of LoRa RSSI.
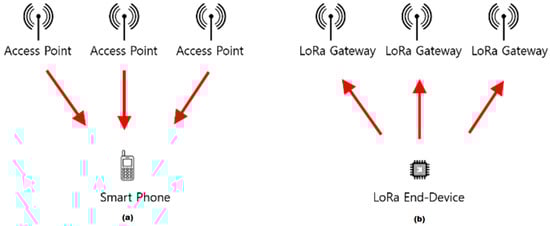
Figure 5.
Comparisons of packet flow between Wi-Fi and LoRa positioning methods: (a) downlink packet from AP to smartphone and (b) uplink packet from end-device to LoRa gateways.
Aernouts et al. constructed RSSI fingerprint data for SigFox and LoRaWAN and compared their positioning errors using a k-nearest neighbors (k-NN) method. As a result, they obtained an average accuracy of 398.4 m using 11 nearest neighbor gateways [17]. Their study used LoRa RSSI data measured at several gateways. However, they did not adopt interpolated fingerprint maps and an inference method for the maps.
Among various LPWA methods, we focused on LoRa fingerprint-based positioning methods because of their open standard and unlicensed band frequencies. SigFox is another LPWA method that uses unlicensed band frequencies; however, it is a closed network and is not available without permission from a network service provider.
In our positioning method, every uplink packet has a sequence number, timestamp, and device ID. The firmware of LoRa end-devices and gateways should be modified to send uplink packets and to process them for positioning. End-devices send uplink packets to gateways for positioning, following which RSSI information is accessed at the gateways. The LoRa positioning process is executed on the server because it requires considerable computing power.
3. Proposed Fingerprint Algorithm
This study aims to implement LPWA IoT services in which moving objects can be tracked in specific areas where LoRa networks can be built. Elderly people, children, pets, and livestock can be tracked and managed safely in service areas such as amusement parks, ski resorts, and pastures.
For realizing this scenario, the positioning accuracy for end-devices should be under 30 m; end-device size should be smaller than 3 cm (W) × 5 cm (H) × 2 cm (D); end-device weight should not exceed 50 g; and batteries should last for at least one month without recharge for stable service.
3.1. LoRa-Based Positioning
In this study, the LoRa-based positioning process using a fingerprint algorithm consisted of an online and an offline phase, as shown in Figure 6. In the offline phase, RSSI values of LoRa signals are measured and stored for each randomly selected sample point within the test area. In the online phase, the location of an end-device is estimated for arbitrary unknown locations.
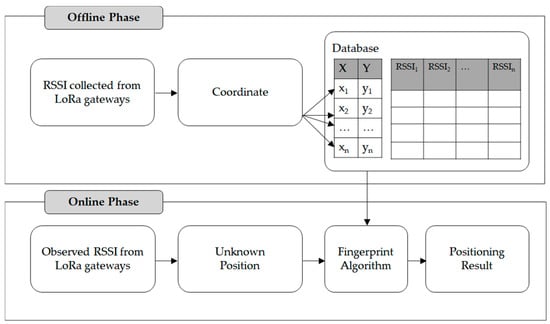
Figure 6.
Positioning using LoRa fingerprint.
A LoRa end-device sends uplink packets to LoRa gateways. The gateways receive the packets and measure the RSSI values. These values are saved in a database and fingerprint maps are generated from the RSSI data for the service area.
In the online phase, a LoRa end-device sends uplink packets that contain sequence information to LoRa gateways. When RSSI data are sent to the positioning server from gateways, gateway IDs are attached to the data for identification.
3.2. LoRa Fingerprint Map Generation
LoRa signals from an end-device cannot be measured for every location in the service area. Therefore, the fingerprint map should be interpolated using data from sample training points. Figure 7 shows the LoRa RSSI data acquisition and fingerprint map interpolation processes. Fingerprint maps can vary with the surrounding environment, and therefore, they must be updated periodically.
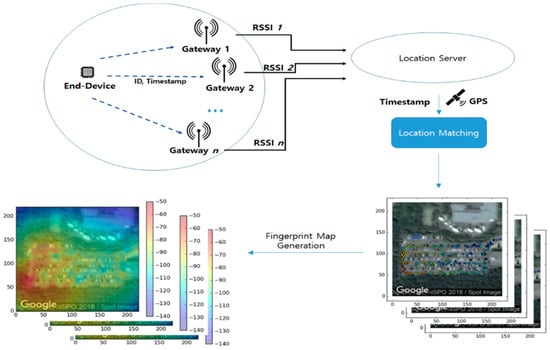
Figure 7.
LoRa RSSI data acquisition and fingerprint map generation.
A LoRa end-device transmits signals to several gateways simultaneously. Each signal includes an ID, timestamp, and GPS coordinates. GPS coordinates can be measured using the end-device or using external devices. Each gateway measures the intensity of the signals from end-devices. The measured RSSI values are then sent to the positioning server and stored with their corresponding GPS coordinates. When sample points are visualized with their RSSI values for each gateway, the results are represented on a map, as shown in the lower right part of Figure 7. The fingerprint maps (i.e., interpolated results) are represented as heat maps, as shown in the lower left part of Figure 7.
We needed to interpolate fingerprint maps from sample point data because complete RSSI measurements could not be obtained and were unnecessary for the entire service area. It is rather difficult to choose optimal two-dimensional interpolation methods to solve practical real-world problems. We used the radial basis function (RBF) interpolation method for interpolating fingerprint maps in this study. RBF interpolation is a traditional method that has been used for radio map generation [18]. RBF Interpolation can approximate an unknown value at a point by adding a linear combination of the RBFs [18,19]. Figure 8 shows the RBF interpolation with 2D scattered data. The advantage of RBF is that it can generate accurate and visually attractive surfaces, making it suitable for interpolated radio map generation [20]. Furthermore, it has low time complexity. We compared the interpolated results of LoRa signals with linear, cubic, quantic, Gaussian, and thin plate RBF functions included in the Python SciPy library.
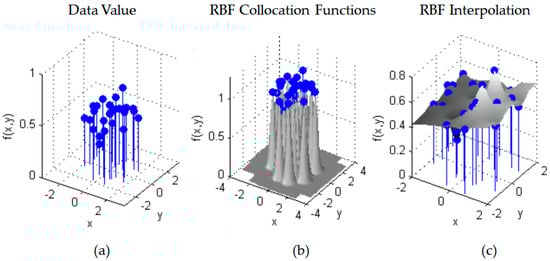
Figure 8.
Interpolation of f(x,y) using Gaussian RBF with 25 sample points: (a) Random data points. (b) the RBF centered at the collocation points (c) shows the interpolated surface [21].
We divided the data into training and test datasets. We generated interpolated fingerprint maps from the training dataset. We calculated residuals between the measured RSSI value and the interpolated value for each test data point. We compared the average and the standard deviation of residuals as shown in Table 1. The linear RBF interpolation method showed the lowest residuals. We also compared the results on the fingerprint maps as shown in Figure 9, and the linear RBF interpolation method showed the good distribution in extrapolation areas.

Table 1.
Average and Standard Deviation of Absolute Residual between interpolated and test value (dBm).
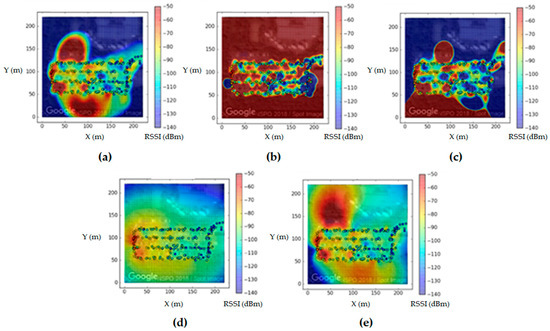
Figure 9.
Comparison of interpolated fingerprint maps: (a) cubic, (b) Gaussian, (c) quintic, (d) linear, and (e) thin plate interpolation methods.
3.3. Probability Map Generation and Positioning
The RSSI value of an end-device is compared to the value of each fingerprint map. Then, candidate regions are filtered and extracted for each fingerprint map. We combine these extracted regions with a weighting factor to create a probability map. The results of the probability map vary according to the weight assigned to the filtered grids for each gateway. We conducted experiments on three types of weighting factors. Figure 10 shows the probability map generation process.
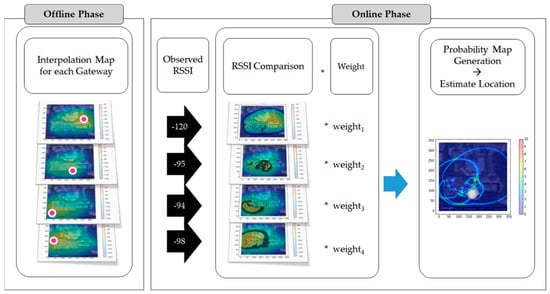
Figure 10.
Probability map generation.
We needed to create a buffer to extract candidate regions in the interpolation map, as shown in Figure 11, because of the unstable feature in the LoRa RF signals. The radio frequency (RF) signal strength fluctuates slightly over time, as shown in Figure 12. After we observed the signal strength distribution in the online phase, we assigned a 3 dBm buffer for the selection of candidate regions to include the actual location in the candidate region. For example, for −79 dBm RSSI in gateway 3, we set the candidate region as that in which RSSI was −82 to −76 dBm. We also tested varying buffer values for each signal and gateway. This buffer dBm could be changed depending on the training data.
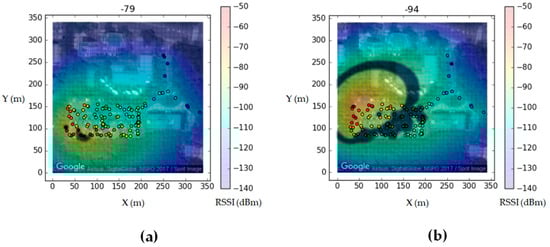
Figure 11.
Comparison of candidate regions. We filter candidate regions with 3 dBm. Dark areas represent candidates region with (a) strong and (b) weak RSSI signals.
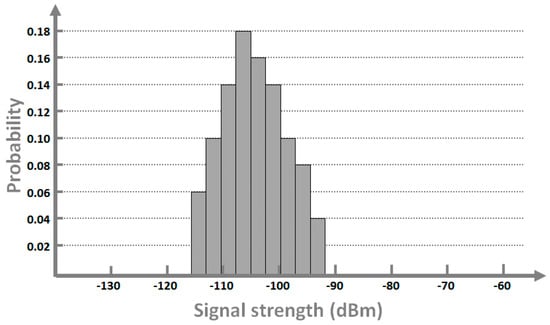
Figure 12.
Signal-strength distribution at a fixed location. [22].
We use a probabilistic method based on the Bayesian inference method [12,22] using the observed RSSI data to compute the conditional probability for positioning. We define grids for the experimental area, and we assign indexes from to for each grid cell, as shown in Figure 13. We constructed an experimental area of 340 × 340 cells, and the resolution of each cell was set to 1 m × 1 m. Then, we define as a set of locations with x, y coordinates as given by Equation (1).
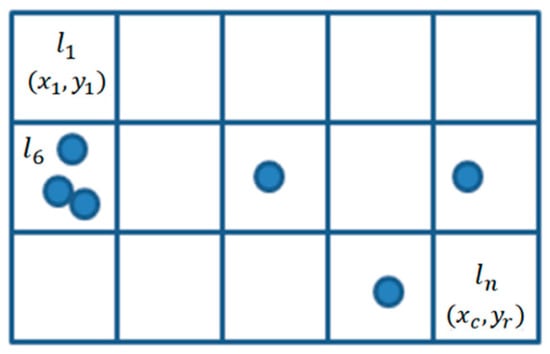
Figure 13.
Vector space RSSI data collection.
The LoRa end-device sends uplink packets. Then, k gateways measure the RSSI values of the signals. An observation o can be defined as k pairs of vectors [22]. We define the set of RSSI signal strengths received at k gateways as an observation for each transmission, as shown Equation (2). Each location has an observation vector . When there are more than two observations at the same location , their mean value is used. The linear RBF interpolated value is used for locations that have no observations. In the online phase, we measured the RSSI values from the gateways and transformed the RSSI array to the observation . Observation in the online phase can be defined as k pairs of vectors same as .
We adopted a Maximum Likelihood Estimation approach to estimate the locations of the end-device [11,12,22]. We can define a posterior probability and likelihood probability function as given by Equation (3). is the prior probability, and we set as a uniform distribution for experiments. We could ignore the marginal probability term and the prior during the calculation of the maximum likelihood. We considered only one sequence; hence, updating the prior was not necessary.
The estimated location in the Equation (4) was defined as the location where the likelihood value becomes the maximum. In given the interpolated fingerprint maps in advance, we could calculate the probability for all locations in the experimental area. Equation (5) represents the likelihood at each location.
is the function of likelihood, and the denominator makes Equation (5) to the form of probability distribution. The denominator can be ignored during the estimation of the location . The function of can be derived by summation of the probabilities for all gateways as given by Equation (6). We constructed the conditional probability , that is, the probability that gateway has RSSI measurement at location . This probability can be calculated by comparing the with on the interpolated fingerprint maps.
We conducted experiments with three different weighting methods. First, we assigned the same weighting factors to all gateways. Second, we assigned the weighting factors normalized with the number of cells in each candidate region. The gap in its values with distance increases when the signal strength is strong according to the characteristics of LoRa RSSI. However, the gap decreases when the signal strength is weak, as shown in Figure 11. The candidate region occupies a large area in the RSSI matching map for a weak RSSI signal (e.g., one of −120 dBm or less). Third, we formulated the general equation given in Equation (7) by using an exponential function to assign higher weights for stronger RSSI values. We estimated the coefficients using Equation (8) through brute force trials. In the trials, we increment variable by 0.1 (), by 0.0001 (0), and by 0.1 (10).
4. Experimental Results
We set up the 340 m × 340 m experimental area as shown in Figure 14. We installed four gateways equipped with Semtech Corporations’ SX1276 chipsets. The training and test datasets were collected separately in the same area. When the fingerprint maps were generated for each gateway, the test dataset was excluded. In total, 340 × 340 = 115,600 grid cells with 1 m × 1 m resolution were constructed for the test. We fixed the LoRa spreading factor as 7.
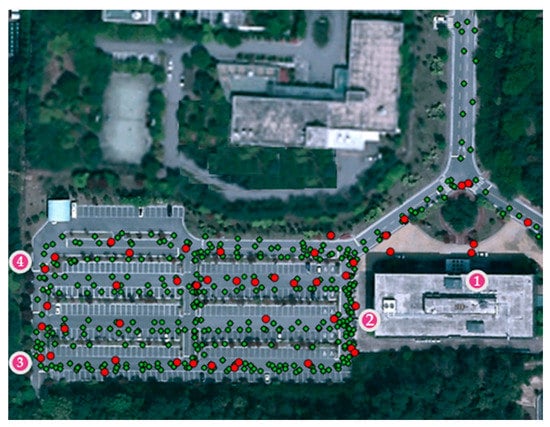
Figure 14.
Experimental area (pink: gateway; green: training dataset; red: test dataset).
When duplicate RSSI values existed in the same grid, their mean value was assigned in that grid. Interpolated values were used to fill grids that had no RSSI value. In the offline phase, a matrix with 340 × 340 cells was created and used for fingerprint map generation for each gateway.
Candidate regions were extracted from the interpolated fingerprint map in the online phase. Then, probability maps were generated using these regions as inputs, and the most probable region was derived as the estimated location.
Three different algorithms were applied to the probability map generation process. Algorithm 1 calculates the extracted candidate regions with the same weight factor. Algorithm 2 normalizes the weighting factors with the area of each region. Algorithm 3 calculates the factor by applying Equation (6); in this case, a higher weight is assigned to a stronger signal.
A total of 46 points were selected as the test dataset, and errors were calculated using each algorithm. Table 2 shows the obtained error results. The average error of Algorithms 1–3 was 32.5 m, 29.8 m, and 24.1 m, respectively. The standard deviation of error for each algorithm was 26.5 m, 24.1 m, and 17.8 m. Therefore, algorithm 3 showed the best result.
Table 2.
Estimation errors for test points (m) (AVG: Average, STD: Standard Deviation).
Figure 15 shows the cumulative probability distribution of errors for each algorithm, where the X-axis represents the error in meters and the Y-axis, the cumulative distribution function. Algorithms 1–3 are represented by red, green, and blue lines, respectively. Dashed lines indicate the average error over all test points for each algorithm. The solid vertical lines near 100 m indicate the maximum estimation errors. As seen in Table 2, Algorithm 1 (red) and Algorithm 2 (green) both showed maximum estimation errors of 107.7 m for sample point 18, and Algorithm 3 showed maximum estimation error of 91.7 m for sample point 15.
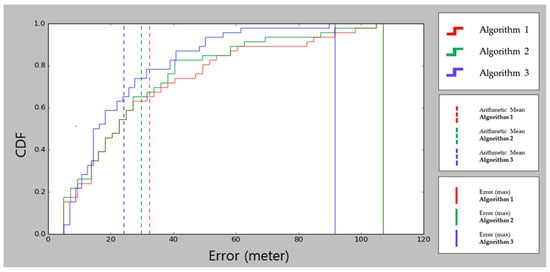
Figure 15.
Cumulative probability distribution of errors.
The example of positioning for point 1 is described as follows. Gateways 1–4 measure the RSSI values as −125, −97, −79, and −94 dBm, respectively, and these values are sent to the positioning server. The candidate regions with a constant buffer are displayed over the fingerprint maps, as shown in Figure 16. The probability maps and errors for the three algorithms are shown in Figure 17. The red circle represents the true location of the end device and the white circle, the estimated location.
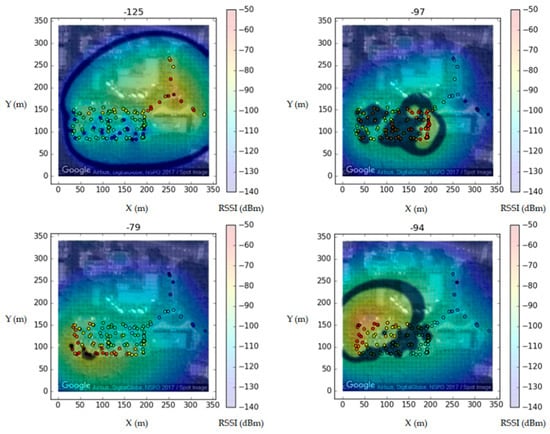
Figure 16.
Candidate regions extracted with buffer.
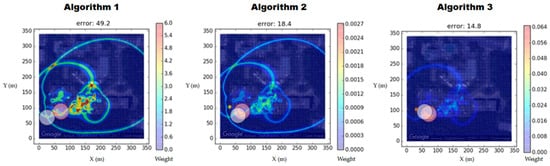
Figure 17.
Probability maps and errors for three algorithms.
5. Conclusions
We have proposed a LoRa signal-based positioning method that uses a fingerprint algorithm instead of the RSSI proximity or TDoA method. We experimentally evaluated this method by applying three different algorithms to interpolated fingerprint RSSI maps. We constructed a private LoRa network for the experiments and developed LoRa gateways, end-devices, and firmware. We also developed positioning server software to manipulate the packets received from the LoRa gateways. We set the test area to be 340 m × 340 m with four gateways. In the experiments, we obtained the best mean location error of 24.1 m with 46 validation points. Our results showed relatively high positioning accuracy without Semtech Corporation’s Geolocation Capability. We reduced the power consumption significantly compared to that of GPS-based positioning methods. We also reduced the hardware cost by using LoRa for communication and positioning simultaneously.
The limitations of this study were as follows. It was necessary to create interpolated maps in the offline phase. These interpolated maps should be updated periodically to reflect the changing radio signal environment. The firmware for gateways and end-devices should also be modified to apply our methods to existing private LoRa networks.
Future work may include the study of a sequential model to analyze continuous RSSI observations. We will investigate sophisticated methods that assign weighting factors to RSSI observation sequences. Fingerprint maps can vary with the surrounding environment, and therefore, we should also ensure that the fingerprint map update process can handle changing signal conditions. Furthermore, we will extend the experimental area and enable more reasonable validation.
Author Contributions
W.C. conceived and designed the methodology. W.C. wrote the original draft, and Y.-S.C. reviewed and edited it. W.C., Y.J. and J.S. implemented the methodology and developed the software. J.S. administrated the project.
Funding
This research received no external funding.
Conflicts of Interest
The authors declare no conflict of interest.
References
- Evans, D. The Internet of Things: How the Next Evolution of the Internet Is Changing Everything; Cisco Internet Business Solutions Group (IBSG): San Jose, CA, USA, 2011; pp. 3–4. [Google Scholar]
- Egli, P.R. LPWAN Technologies for Internet of Things (IoT) and M2M Scenarios. Available online: https://www.slideshare.net/PeterREgli/lpwan (accessed on 25 May 2018).
- Fargas, B.C.; Petersen, M.N. GPS-free geolocation using LoRa in low-power WANs. In Proceedings of the Global Internet of Things Summit (GIoTS), Geneva, Switzerland, 6–9 June 2017; pp. 1–6. [Google Scholar]
- LoRa Modulation Basics. Available online: https://www.semtech.com/uploads/documents/an1200.22.pdf (accessed on 25 May 2018).
- LoRa Alliance. White Paper: A Technical Overview of LoRa and LoRaWAN; The LoRa Alliance: San Ramon, CA, USA, 2015; pp. 7–11. [Google Scholar]
- LoRa Alliance™ Strategy Committee. LoRa Alliance Geolocation Whitepaper. Available online: https://lora-alliance.org/resource-hub/lora-alliance-geolocation-whitepaper (accessed on 25 May 2018).
- Lam, K.-H.; Cheung, C.-C.; Lee, W.-C. LoRa-based localization systems for noisy outdoor environment. In Proceedings of the 13th IEEE International Conference on Wireless and Mobile Computing, Networking and Communications (WiMob), Rome, Italy, 9–11 October 2017; pp. 278–284. [Google Scholar]
- Islam, B.; Islam, M.T.; Nirjon, S. Feasibility of LoRa for Indoor Localization. Available online: https://pdfs.semanticscholar.org/ab00/c1eacbdd76732b7438ec8e5653f7c875def4.pdf (accessed on 25 May 2018).
- Kim, S.; Ko, J. Low-complexity outdoor localization for long-range, low-power radios. In Proceedings of the 14th Annual International Conference on Mobile Systems, Applications, and Services Companion, Singapore, 26 June 2016; p. 44. [Google Scholar]
- Laoudias, C.; Moreira, A.; Kim, S.; Lee, S.; Wirola, L.; Fischione, C. A survey of enabling technologies for network localization, tracking, and navigation. IEEE Commun. Surv. Tutor. 2018, 6, 1. [Google Scholar] [CrossRef]
- Richter, P.; Toledano-Ayala, M. Revisiting Gaussian process regression modeling for localization in wireless sensor networks. Sensors 2015, 15, 22587–22615. [Google Scholar] [CrossRef] [PubMed]
- Bekkali, A.; Masuo, T.; Tominaga, T.; Nakamoto, N.; Ban, H. Gaussian processes for learning-based indoor localization. In Proceedings of the 2011 IEEE International Conference on Signal Processing, Communications and Computing, Xi’an, China, 14–16 September 2011; pp. 1–6. [Google Scholar]
- Li, Z.; Braun, T.; Zhao, X.; Zhao, Z.; Hu, F.; Liang, H. A narrow-band indoor positioning system by fusing time and received signal strength via ensemble learning. IEEE Access 2018, 6, 9936–9950. [Google Scholar] [CrossRef]
- RSSI. Available online: https://en.wikipedia.org/wiki/Received_signal_strength_indication (accessed on 25 May 2018).
- TDoA Algorithm Implementation. Available online: https://forum.loraserver.io/t/tdoa-algorithm-implementation/720/7 (accessed on 25 May 2018).
- Hernández, N.; Alonso, J.M.; Ocaña, M.; Kim, E. WiFi-based indoor localization using a continuous space estimator from topological information. In Proceedings of the International Conference on Indoor Positioning and Indoor Navigation, Calgary, AB, Canada, 13–16 October 2015; pp. 13–16. [Google Scholar]
- Aernouts, M.; Berkvens, R.; Van Vlaenderen, K.; Weyn, M. SigFox and LoRaWAN datasets for fingerprint localization in large urban and rural areas. Data 2018, 3, 13. [Google Scholar] [CrossRef]
- Redondi, A.E.C. Radio map interpolation using graph signal processing. IEEE Commun. Lett. 2018, 22, 153–156. [Google Scholar] [CrossRef]
- Radial Basis Function Interpolation. Available online: https://cs.fit.edu/~dmitra/SciComp/13Spr/KimJessie-rbf3.pdf (accessed on 25 September 2018).
- Reddy, K.B.; Venkatramana, P. Comparison of different spatial interpolation techniques of field measurements to construct radio environment map. Int. J. Future Gener. Commun. Netw. 2018, 11, 21–31. [Google Scholar] [CrossRef]
- A Mesh-free Method for Three-Dimensional Nonlinear Schrödinger Equation. Available online: https://people.maths.ox.ac.uk/siamstudentchapter/webpages/2011_Conference/ThomasY_Talk.ppt (accessed on 15 October 2018).
- Chai, X.; Yang, Q. Reducing the calibration effort for probabilistic indoor location estimation. IEEE Trans. Mob. Comput. 2007, 6, 649–662. [Google Scholar] [CrossRef]
© 2018 by the authors. Licensee MDPI, Basel, Switzerland. This article is an open access article distributed under the terms and conditions of the Creative Commons Attribution (CC BY) license (http://creativecommons.org/licenses/by/4.0/).