Next Issue
Volume 6, February
Previous Issue
Volume 5, December


ISPRS Int. J. Geo-Inf., Volume 6, Issue 1 (January 2017) – 32 articles

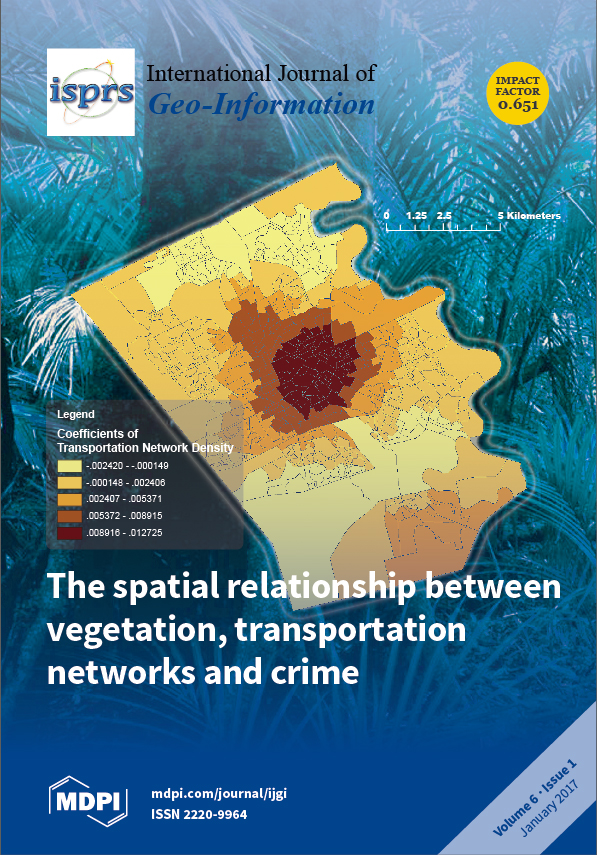
Cover Story (view full-size image): We investigated the spatial relationship between vegetation density, transportation network density and crime by using a quantitative method. Crimes against property and crimes against persons as well as four specific crime types were analyzed. Besides, the spatial variations of different relationships were explored across an urban central–peripheral gradient.
  • Issues are regarded as officially published after their release is announced to the table of contents alert mailing list.
  • You may sign up for e-mail alerts to receive table of contents of newly released issues.
  • PDF is the official format for papers published in both, html and pdf forms. To view the papers in pdf format, click on the "PDF Full-text" link, and use the free Adobe Reader to open them.
Order results
Result details
Select all
Export citation of selected articles as:
4028 KiB  
Article
Using Remote Sensing Products to Identify Marine Association Patterns in Factors Relating to ENSO in the Pacific Ocean
by Cunjin Xue, Xing Fan, Qing Dong and Jingyi Liu
ISPRS Int. J. Geo-Inf. 2017, 6(1), 32; https://doi.org/10.3390/ijgi6010032 - 23 Jan 2017
Cited by 5 | Viewed by 4498
Abstract
El Niño–Southern Oscillation (ENSO) and its relationships with marine environmental parameters comprise a very complicated and interrelated system. Traditional spatiotemporal techniques face great challenges in dealing with which, how, and where the marine environmental parameters in different zones help to drive, and respond [...] Read more.
El Niño–Southern Oscillation (ENSO) and its relationships with marine environmental parameters comprise a very complicated and interrelated system. Traditional spatiotemporal techniques face great challenges in dealing with which, how, and where the marine environmental parameters in different zones help to drive, and respond to, ENSO events. Remote sensing products covering a 15-year period from 1998 to 2012 were used to quantitatively explore these patterns in the Pacific Ocean (PO) by a prevail quantitative association rule mining algorithm, that is, a priori, within a mining framework. The marine environmental parameters considered were monthly anomaly of sea surface chlorophyll-a (CHLA), monthly anomaly of sea surface temperature (SSTA), monthly anomaly of sea level anomaly (SLAA), monthly anomaly of sea surface precipitation (SSPA), and monthly anomaly of sea surface wind speed (WSA). Four significant discoveries are found, namely: (1) Association patterns among marine environmental parameters and ENSO events were found primarily in five sub-regions of the PO: the western PO, the central and eastern tropical PO, the middle of the northern subtropical PO, offshore of the California coast, and the southern PO; (2) In the western and the middle and east of the equatorial PO, the association patterns are more complicated than other regions; (3) The following factors were found to be predicators of and responses to La Niña events: abnormal decrease of SLAA and WSA in the east of the equatorial PO, abnormal decrease of SSPA and WSA in the middle of the equatorial PO, abnormal decrease of SSTA in the eastern and central tropical PO, and abnormal increase of SLAA in the western PO; (4) Only abnormal decrease of CHLA in the middle of the equatorial PO was found to be a predicator of and response to El Niño events. These findings will help to improve our abilities to identify the marine association patterns in factors relating to ENSO events. Full article
Show Figures

Figure 1

6511 KiB  
Article
A Novel Divisive Hierarchical Clustering Algorithm for Geospatial Analysis
by Shaoning Li, Wenjing Li and Jia Qiu
ISPRS Int. J. Geo-Inf. 2017, 6(1), 30; https://doi.org/10.3390/ijgi6010030 - 23 Jan 2017
Cited by 6 | Viewed by 6207
Abstract
In the fields of geographic information systems (GIS) and remote sensing (RS), the clustering algorithm has been widely used for image segmentation, pattern recognition, and cartographic generalization. Although clustering analysis plays a key role in geospatial modelling, traditional clustering methods are limited due [...] Read more.
In the fields of geographic information systems (GIS) and remote sensing (RS), the clustering algorithm has been widely used for image segmentation, pattern recognition, and cartographic generalization. Although clustering analysis plays a key role in geospatial modelling, traditional clustering methods are limited due to computational complexity, noise resistant ability and robustness. Furthermore, traditional methods are more focused on the adjacent spatial context, which makes it hard for the clustering methods to be applied to multi-density discrete objects. In this paper, a new method, cell-dividing hierarchical clustering (CDHC), is proposed based on convex hull retraction. The main steps are as follows. First, a convex hull structure is constructed to describe the global spatial context of geospatial objects. Then, the retracting structure of each borderline is established in sequence by setting the initial parameter. The objects are split into two clusters (i.e., “sub-clusters”) if the retracting structure intersects with the borderlines. Finally, clusters are repeatedly split and the initial parameter is updated until the terminate condition is satisfied. The experimental results show that CDHC separates the multi-density objects from noise sufficiently and also reduces complexity compared to the traditional agglomerative hierarchical clustering algorithm. Full article
Show Figures

Figure 1

1639 KiB  
Article
Detection of Electronic Anklet Wearers’ Groupings throughout Telematics Monitoring
by Paulo Lima Machado, Rafael T. De Sousa, Robson De Oliveira Albuquerque, Luis Javier García Villalba and Tai-Hoon Kim
ISPRS Int. J. Geo-Inf. 2017, 6(1), 31; https://doi.org/10.3390/ijgi6010031 - 22 Jan 2017
Cited by 3 | Viewed by 5304
Abstract
Ankle bracelets (anklets) imposed by law to track convicted individuals are being used in many countries as an alternative to overloaded prisons. There are many different systems for monitoring individuals wearing such devices, and these electronic anklet monitoring systems commonly detect violations of [...] Read more.
Ankle bracelets (anklets) imposed by law to track convicted individuals are being used in many countries as an alternative to overloaded prisons. There are many different systems for monitoring individuals wearing such devices, and these electronic anklet monitoring systems commonly detect violations of circulation areas permitted to holders. In spite of being able to monitor individual localization, such systems do not identify grouping activities of the monitored individuals, although this kind of event could represent a real risk of further offenses planned by those individuals. In order to address such a problem and to help monitoring systems to be able to have a proactive approach, this paper proposes sensor data fusion algorithms that are able to identify such groups based on data provided by anklet positioning devices. The results from the proposed algorithms can be applied to support risk assessment in the context of monitoring systems. The processing is performed using geographic points collected by a monitoring center, and as result, it produces a history of groups with their members, timestamps, locations and frequency of meetings. The proposed algorithms are validated in various serial and parallel computing scenarios, and the correspondent results are presented and discussed. The information produced by the proposed algorithms yields to a better characterization of the monitored individuals and can be adapted to support decision-making systems used by authorities that are responsible for planning decisions regarding actions affecting public security. Full article
(This article belongs to the Special Issue Applications of Internet of Things)
Show Figures

Figure 1

1304 KiB  
Article
An Automatic Matcher and Linker for Transportation Datasets
by Ali Masri, Karine Zeitouni, Zoubida Kedad and Bertrand Leroy
ISPRS Int. J. Geo-Inf. 2017, 6(1), 29; https://doi.org/10.3390/ijgi6010029 - 22 Jan 2017
Cited by 3 | Viewed by 5443
Abstract
Multimodality requires the integration of heterogeneous transportation data to construct a broad view of the transportation network. Many new transportation services are emerging while being isolated from previously-existing networks. This leads them to publish their data sources to the web, according to linked [...] Read more.
Multimodality requires the integration of heterogeneous transportation data to construct a broad view of the transportation network. Many new transportation services are emerging while being isolated from previously-existing networks. This leads them to publish their data sources to the web, according to linked data principles, in order to gain visibility. Our interest is to use these data to construct an extended transportation network that links these new services to existing ones. The main problems we tackle in this article fall in the categories of automatic schema matching and data interlinking. We propose an approach that uses web services as mediators to help in automatically detecting geospatial properties and mapping them between two different schemas. On the other hand, we propose a new interlinking approach that enables the user to define rich semantic links between datasets in a flexible and customizable way. Full article
(This article belongs to the Special Issue Geospatial Semantics and Semantic Web)
Show Figures

Figure 1

2814 KiB  
Article
A Double-Smoothing Algorithm for Integrating Satellite Precipitation Products in Areas with Sparsely Distributed In Situ Networks
by Shuoben Bi, Shengjie Bi, Dongqi Chen, Jian Pan and Jun Wang
ISPRS Int. J. Geo-Inf. 2017, 6(1), 28; https://doi.org/10.3390/ijgi6010028 - 21 Jan 2017
Cited by 8 | Viewed by 4303
Abstract
The spatial distribution of automatic weather stations in regions of western China (e.g., Tibet and southern Xingjiang) is relatively sparse. Due to the considerable spatial variability of precipitation, estimations of rainfall that are interpolated in these areas exhibit considerable uncertainty based on the [...] Read more.
The spatial distribution of automatic weather stations in regions of western China (e.g., Tibet and southern Xingjiang) is relatively sparse. Due to the considerable spatial variability of precipitation, estimations of rainfall that are interpolated in these areas exhibit considerable uncertainty based on the current observational networks. In this paper, a new statistical method for estimating precipitation is introduced that integrates satellite products and in situ observation data. This method calculates the differences between raster data and point data based on the theory of data assimilation. In regions in which the spatial distribution of automatic weather stations is sparse, a nonparametric kernel-smoothing method is adopted to process the discontinuous data through correction and spatial interpolation. A comparative analysis of the fusion method based on the double-smoothing algorithm proposed here indicated that the method performed better than those used in previous studies based on the average deviation, root mean square error, and correlation coefficient values. Our results indicate that the proposed method is more rational and effective in terms of both the efficiency coefficient and the spatial distribution of the deviations. Full article
Show Figures

Figure 1

2317 KiB  
Article
An Adaptive Agent-Based Model of Homing Pigeons: A Genetic Algorithm Approach
by Francis Oloo and Gudrun Wallentin
ISPRS Int. J. Geo-Inf. 2017, 6(1), 27; https://doi.org/10.3390/ijgi6010027 - 21 Jan 2017
Cited by 11 | Viewed by 7839
Abstract
Conventionally, agent-based modelling approaches start from a conceptual model capturing the theoretical understanding of the systems of interest. Simulation outcomes are then used “at the end” to validate the conceptual understanding. In today’s data rich era, there are suggestions that models should be [...] Read more.
Conventionally, agent-based modelling approaches start from a conceptual model capturing the theoretical understanding of the systems of interest. Simulation outcomes are then used “at the end” to validate the conceptual understanding. In today’s data rich era, there are suggestions that models should be data-driven. Data-driven workflows are common in mathematical models. However, their application to agent-based models is still in its infancy. Integration of real-time sensor data into modelling workflows opens up the possibility of comparing simulations against real data during the model run. Calibration and validation procedures thus become automated processes that are iteratively executed during the simulation. We hypothesize that incorporation of real-time sensor data into agent-based models improves the predictive ability of such models. In particular, that such integration results in increasingly well calibrated model parameters and rule sets. In this contribution, we explore this question by implementing a flocking model that evolves in real-time. Specifically, we use genetic algorithms approach to simulate representative parameters to describe flight routes of homing pigeons. The navigation parameters of pigeons are simulated and dynamically evaluated against emulated GPS sensor data streams and optimised based on the fitness of candidate parameters. As a result, the model was able to accurately simulate the relative-turn angles and step-distance of homing pigeons. Further, the optimised parameters could replicate loops, which are common patterns in flight tracks of homing pigeons. Finally, the use of genetic algorithms in this study allowed for a simultaneous data-driven optimization and sensitivity analysis. Full article
Show Figures

Figure 1

6252 KiB  
Article
Bayesian Fusion of Multi-Scale Detectors for Road Extraction from SAR Images
by Rui Xu, Chu He, Xinlong Liu, Dong Chen and Qianqing Qin
ISPRS Int. J. Geo-Inf. 2017, 6(1), 26; https://doi.org/10.3390/ijgi6010026 - 20 Jan 2017
Cited by 9 | Viewed by 4577
Abstract
This paper introduces an innovative road network extraction algorithm using synthetic aperture radar (SAR) imagery for improving the accuracy of road extraction. The state-of-the-art approaches, such as fraction extraction and road network optimization, failed to obtain continuous road segments in separate successions, since [...] Read more.
This paper introduces an innovative road network extraction algorithm using synthetic aperture radar (SAR) imagery for improving the accuracy of road extraction. The state-of-the-art approaches, such as fraction extraction and road network optimization, failed to obtain continuous road segments in separate successions, since the optimization could not change the parts ignored by the fraction extraction. In this paper, the proposed algorithm integrates the fraction extraction and optimization procedure simultaneously to extract the road network: (1) the Bayesian framework is utilized to transfer the road network extraction to joint reasoning of the likelihood of fraction extraction and the priority of network optimization; (2) the multi-scale linear feature detector (MLFD) and the network optimization beamlet are introduced; (3) the conditional random field (CRF) is used to reason jointly. The result is the global optimum since the fraction extraction and network optimization are exploited at the same time. The proposed algorithm solves the problem that the fractions are bound to reduce in the process of network optimization and has demonstrated effectiveness in real SAR images applications. Full article
Show Figures

Figure 1

10074 KiB  
Article
Linkage of OGC WPS 2.0 to the e-Government Standard Framework in Korea: An Implementation Case for Geo-Spatial Image Processing
by Gooseon Yoon, Kwangseob Kim and Kiwon Lee
ISPRS Int. J. Geo-Inf. 2017, 6(1), 25; https://doi.org/10.3390/ijgi6010025 - 20 Jan 2017
Cited by 4 | Viewed by 5800
Abstract
There are many cases wherein services offered in geospatial sectors are integrated with other fields. In addition, services utilizing satellite data play important roles in daily life and in sectors such as environment and science. Therefore, a management structure appropriate to the scale [...] Read more.
There are many cases wherein services offered in geospatial sectors are integrated with other fields. In addition, services utilizing satellite data play important roles in daily life and in sectors such as environment and science. Therefore, a management structure appropriate to the scale of the system should be clearly defined. The motivation of this study is to resolve issues, apply standards related to a target system, and provide practical strategies with a technical basis. South Korea uses the e-Government Standard Framework, using the Java-based Spring framework, to provide guidelines and environments with common configurations and functions for developing web-based information systems for public services. This web framework offers common sources and resources for data processing and interface connection to help developers focus on business logic in designing a web system. In this study, a geospatial image processing system—linked with the Open Geospatial Consortium (OGC) Web Processing Service (WPS) 2.0 standard for real geospatial information processing, and based on this standard framework—was designed and built utilizing fully open sources. This is the first case of implementation based on WPS 2.0 running on the e-Government Standard Framework. Establishing a standard for its use will be important, and the system built in this study can serve as a reference for the foundational architecture in building geospatial web service systems with geodata-processing functionalities in government agencies. Full article
Show Figures

Figure 1

16350 KiB  
Article
Authoritative and Volunteered Geographical Information in a Developing Country: A Comparative Case Study of Road Datasets in Nairobi, Kenya
by Ron Mahabir, Anthony Stefanidis, Arie Croitoru, Andrew T. Crooks and Peggy Agouris
ISPRS Int. J. Geo-Inf. 2017, 6(1), 24; https://doi.org/10.3390/ijgi6010024 - 20 Jan 2017
Cited by 38 | Viewed by 11252
Abstract
With volunteered geographic information (VGI) platforms such as OpenStreetMap (OSM) becoming increasingly popular, we are faced with the challenge of assessing the quality of their content, in order to better understand its place relative to the authoritative content of more traditional sources. Until [...] Read more.
With volunteered geographic information (VGI) platforms such as OpenStreetMap (OSM) becoming increasingly popular, we are faced with the challenge of assessing the quality of their content, in order to better understand its place relative to the authoritative content of more traditional sources. Until now, studies have focused primarily on developed countries, showing that VGI content can match or even surpass the quality of authoritative sources, with very few studies in developing countries. In this paper, we compare the quality of authoritative (data from the Regional Center for Mapping of Resources for Development (RCMRD)) and non-authoritative (data from OSM and Google’s Map Maker) road data in conjunction with population data in and around Nairobi, Kenya. Results show variability in coverage between all of these datasets. RCMRD provided the most complete, albeit less current, coverage when taking into account the entire study area, while OSM and Map Maker showed a degradation of coverage as one moves from central Nairobi towards rural areas. Furthermore, OSM had higher content density in large slums, surpassing the authoritative datasets at these locations, while Map Maker showed better coverage in rural housing areas. These results suggest a greater need for a more inclusive approach using VGI to supplement gaps in authoritative data in developing nations. Full article
(This article belongs to the Special Issue Volunteered Geographic Information)
Show Figures

Figure 1

4539 KiB  
Communication
sgdm: An R Package for Performing Sparse Generalized Dissimilarity Modelling with Tools for gdm
by Pedro J. Leitão, Marcel Schwieder and Cornelius Senf
ISPRS Int. J. Geo-Inf. 2017, 6(1), 23; https://doi.org/10.3390/ijgi6010023 - 19 Jan 2017
Cited by 12 | Viewed by 9390
Abstract
Global biodiversity change creates a need for standardized monitoring methods. Modelling and mapping spatial patterns of community composition using high-dimensional remotely sensed data requires adapted methods adequate to such datasets. Sparse generalized dissimilarity modelling is designed to deal with high dimensional datasets, such [...] Read more.
Global biodiversity change creates a need for standardized monitoring methods. Modelling and mapping spatial patterns of community composition using high-dimensional remotely sensed data requires adapted methods adequate to such datasets. Sparse generalized dissimilarity modelling is designed to deal with high dimensional datasets, such as time series or hyperspectral remote sensing data. In this manuscript we present sgdm, an R package for performing sparse generalized dissimilarity modelling (SGDM). The package includes some general tools that add functionality to both generalized dissimilarity modelling and sparse generalized dissimilarity modelling. It also includes an exemplary dataset that allows for the application of SGDM for mapping the spatial patterns of tree communities in a region of natural vegetation in the Brazilian Cerrado. Full article
(This article belongs to the Special Issue Spatial Ecology)
Show Figures

Figure 1

163 KiB  
Erratum
Erratum: Dubois, G., et al. Integrating Multiple Spatial Datasets to Assess Protected Areas: Lessons Learnt from the Digital Observatory for Protected Areas (DOPA). ISPRS International Journal of Geo-Information 2016, 5, 242
by IJGI Editorial Office
ISPRS Int. J. Geo-Inf. 2017, 6(1), 22; https://doi.org/10.3390/ijgi6010022 - 19 Jan 2017
Viewed by 2611
Abstract
The editorial team of the journal IJGI would like to make the following corrections to the published paper [1]:[...] Full article
2415 KiB  
Article
A NoSQL–SQL Hybrid Organization and Management Approach for Real-Time Geospatial Data: A Case Study of Public Security Video Surveillance
by Chen Wu, Qing Zhu, Yeting Zhang, Zhiqiang Du, Xinyue Ye, Han Qin and Yan Zhou
ISPRS Int. J. Geo-Inf. 2017, 6(1), 21; https://doi.org/10.3390/ijgi6010021 - 19 Jan 2017
Cited by 28 | Viewed by 9006
Abstract
With the widespread deployment of ground, air and space sensor sources (internet of things or IoT, social networks, sensor networks), the integrated applications of real-time geospatial data from ubiquitous sensors, especially in public security and smart city domains, are becoming challenging issues. The [...] Read more.
With the widespread deployment of ground, air and space sensor sources (internet of things or IoT, social networks, sensor networks), the integrated applications of real-time geospatial data from ubiquitous sensors, especially in public security and smart city domains, are becoming challenging issues. The traditional geographic information system (GIS) mostly manages time-discretized geospatial data by means of the Structured Query Language (SQL) database management system (DBMS) and emphasizes query and retrieval of massive historical geospatial data on disk. This limits its capability for on-the-fly access of real-time geospatial data for online analysis in real time. This paper proposes a hybrid database organization and management approach with SQL relational databases (RDB) and not only SQL (NoSQL) databases (including the main memory database, MMDB, and distributed files system, DFS). This hybrid approach makes full use of the advantages of NoSQL and SQL DBMS for the real-time access of input data and structured on-the-fly analysis results which can meet the requirements of increased spatio-temporal big data linking analysis. The MMDB facilitates real-time access of the latest input data such as the sensor web and IoT, and supports the real-time query for online geospatial analysis. The RDB stores change information such as multi-modal features and abnormal events extracted from real-time input data. The DFS on disk manages the massive geospatial data, and the extensible storage architecture and distributed scheduling of a NoSQL database satisfy the performance requirements of incremental storage and multi-user concurrent access. A case study of geographic video (GeoVideo) surveillance of public security is presented to prove the feasibility of this hybrid organization and management approach. Full article
(This article belongs to the Special Issue Spatiotemporal Computing for Sustainable Ecosystem)
Show Figures

Figure 1

4047 KiB  
Article
SSIEGNOS: A New Asian Single Site Tropospheric Correction Model
by Liangke Huang, Shaofeng Xie, Lilong Liu, Junyu Li, Jun Chen and Chuanli Kang
ISPRS Int. J. Geo-Inf. 2017, 6(1), 20; https://doi.org/10.3390/ijgi6010020 - 17 Jan 2017
Cited by 8 | Viewed by 5061
Abstract
This paper proposes a new Asian single site tropospheric correction model called the Single Site Improved European Geostationary Navigation Overlay Service model (SSIEGNOS) by refining the European Geostationary Navigation Overlay Service (EGNOS) model at a single site. The performance of the SSIEGNOS model [...] Read more.
This paper proposes a new Asian single site tropospheric correction model called the Single Site Improved European Geostationary Navigation Overlay Service model (SSIEGNOS) by refining the European Geostationary Navigation Overlay Service (EGNOS) model at a single site. The performance of the SSIEGNOS model is analyzed. The results show that (1) the bias and root mean square (RMS) error of zenith tropospheric delay (ZTD) calculated from the EGNOS model are 0.12 cm and 5.87 cm, respectively; whereas those of the SSIEGNOS model are 0 cm and 2.52 cm, respectively. (2) The bias and RMS error show seasonal variation in the EGNOS model; however, little seasonal variation is observed in the SSIEGNOS model. (3) The RMS error decreases with increasing altitude or latitude in the two models; however, no such relationships were found in the bias. In addition, the annual predicted bias and RMS error in Asia are −0.08 cm and 3.14 cm for the SSIEGNOS model, respectively; however, the EGNOS and UNB3m (University of New Brunswick) models show comparable predicted results. Relative to the EGNOS model, the annual predicted bias and RMS error decreased by 55% and 48%, respectively, for the SSIEGNOS model. Full article
(This article belongs to the Special Issue Recent Advances in Geodesy & Its Applications)
Show Figures

Figure 1

7655 KiB  
Article
A Graph-Based Min-# and Error-Optimal Trajectory Simplification Algorithm and Its Extension towards Online Services
by Fan Wu, Kun Fu, Yang Wang and Zhibin Xiao
ISPRS Int. J. Geo-Inf. 2017, 6(1), 19; https://doi.org/10.3390/ijgi6010019 - 16 Jan 2017
Cited by 6 | Viewed by 4978
Abstract
Trajectory simplification has become a research hotspot since it plays a significant role in the data preprocessing, storage, and visualization of many offline and online applications, such as online maps, mobile health applications, and location-based services. Traditional heuristic-based algorithms utilize greedy strategy to [...] Read more.
Trajectory simplification has become a research hotspot since it plays a significant role in the data preprocessing, storage, and visualization of many offline and online applications, such as online maps, mobile health applications, and location-based services. Traditional heuristic-based algorithms utilize greedy strategy to reduce time cost, leading to high approximation error. An Optimal Trajectory Simplification Algorithm based on Graph Model (OPTTS) is proposed to obtain the optimal solution in this paper. Both min-# and min-ε problems are solved by the construction and regeneration of the breadth-first spanning tree and the shortest path search based on the directed acyclic graph (DAG). Although the proposed OPTTS algorithm can get optimal simplification results, it is difficult to apply in real-time services due to its high time cost. Thus, a new Online Trajectory Simplification Algorithm based on Directed Acyclic Graph (OLTS) is proposed to deal with trajectory stream. The algorithm dynamically constructs the breadth-first spanning tree, followed by real-time minimizing approximation error and real-time output. Experimental results show that OPTTS reduces the global approximation error by 82% compared to classical heuristic methods, while OLTS reduces the error by 77% and is 32% faster than the traditional online algorithm. Both OPTTS and OLTS have leading superiority and stable performance on different datasets. Full article
Show Figures

Graphical abstract

4598 KiB  
Article
An Improved Information Value Model Based on Gray Clustering for Landslide Susceptibility Mapping
by Qianqian Ba, Yumin Chen, Susu Deng, Qianjiao Wu, Jiaxin Yang and Jingyi Zhang
ISPRS Int. J. Geo-Inf. 2017, 6(1), 18; https://doi.org/10.3390/ijgi6010018 - 16 Jan 2017
Cited by 64 | Viewed by 6932
Abstract
Landslides, as geological hazards, cause significant casualties and economic losses. Therefore, it is necessary to identify areas prone to landslides for prevention work. This paper proposes an improved information value model based on gray clustering (IVM-GC) for landslide susceptibility mapping. This method uses [...] Read more.
Landslides, as geological hazards, cause significant casualties and economic losses. Therefore, it is necessary to identify areas prone to landslides for prevention work. This paper proposes an improved information value model based on gray clustering (IVM-GC) for landslide susceptibility mapping. This method uses the information value derived from an information value model to achieve susceptibility classification and weight determination of landslide predisposing factors and, hence, obtain the landslide susceptibility of each study unit based on the clustering analysis. Using a landslide inventory of Chongqing, China, which contains 8435 landslides, three landslide susceptibility maps were generated based on the common information value model (IVM), an information value model improved by an analytic hierarchy process (IVM-AHP) and our new improved model. Approximately 70% (5905) of the inventory landslides were used to generate the susceptibility maps, while the remaining 30% (2530) were used to validate the results. The training accuracies of the IVM, IVM-AHP and IVM-GC were 81.8%, 78.7% and 85.2%, respectively, and the prediction accuracies were 82.0%, 78.7% and 85.4%, respectively. The results demonstrate that all three methods perform well in evaluating landslide susceptibility. Among them, IVM-GC has the best performance. Full article
Show Figures

Figure 1

3519 KiB  
Article
3D Space Shift from CityGML LoD3-Based Multiple Building Elements to a 3D Volumetric Object
by Shen Ying, Renzhong Guo, Jie Yang, Biao He, Zhigang Zhao and Fengzan Jin
ISPRS Int. J. Geo-Inf. 2017, 6(1), 17; https://doi.org/10.3390/ijgi6010017 - 15 Jan 2017
Cited by 14 | Viewed by 6627
Abstract
In contrast with photorealistic visualizations, urban landscape applications, and building information system (BIM), 3D volumetric presentations highlight specific calculations and applications of 3D building elements for 3D city planning and 3D cadastres. Knowing the precise volumetric quantities and the 3D boundary locations of [...] Read more.
In contrast with photorealistic visualizations, urban landscape applications, and building information system (BIM), 3D volumetric presentations highlight specific calculations and applications of 3D building elements for 3D city planning and 3D cadastres. Knowing the precise volumetric quantities and the 3D boundary locations of 3D building spaces is a vital index which must remain constant during data processing because the values are related to space occupation, tenure, taxes, and valuation. To meet these requirements, this paper presents a five-step algorithm for performing a 3D building space shift. This algorithm is used to convert multiple building elements into a single 3D volumetric building object while maintaining the precise volume of the 3D space and without changing the 3D locations or displacing the building boundaries. As examples, this study used input data and building elements based on City Geography Markup Language (CityGML) LoD3 models. This paper presents a method for 3D urban space and 3D property management with the goal of constructing a 3D volumetric object for an integral building using CityGML objects, by fusing the geometries of various building elements. The resulting objects possess true 3D geometry that can be represented by solid geometry and saved to a CityGML file for effective use in 3D urban planning and 3D cadastres. Full article
Show Figures

Figure 1

1412 KiB  
Article
Joint Modeling of Multiple Crimes: A Bayesian Spatial Approach
by Hongqiang Liu and Xinyan Zhu
ISPRS Int. J. Geo-Inf. 2017, 6(1), 16; https://doi.org/10.3390/ijgi6010016 - 13 Jan 2017
Cited by 15 | Viewed by 5926
Abstract
A multivariate Bayesian spatial modeling approach was used to jointly model the counts of two types of crime, i.e., burglary and non-motor vehicle theft, and explore the geographic pattern of crime risks and relevant risk factors. In contrast to the univariate model, which [...] Read more.
A multivariate Bayesian spatial modeling approach was used to jointly model the counts of two types of crime, i.e., burglary and non-motor vehicle theft, and explore the geographic pattern of crime risks and relevant risk factors. In contrast to the univariate model, which assumes independence across outcomes, the multivariate approach takes into account potential correlations between crimes. Six independent variables are included in the model as potential risk factors. In order to fully present this method, both the multivariate model and its univariate counterpart are examined. We fitted the two models to the data and assessed them using the deviance information criterion. A comparison of the results from the two models indicates that the multivariate model was superior to the univariate model. Our results show that population density and bar density are clearly associated with both burglary and non-motor vehicle theft risks and indicate a close relationship between these two types of crime. The posterior means and 2.5% percentile of type-specific crime risks estimated by the multivariate model were mapped to uncover the geographic patterns. The implications, limitations and future work of the study are discussed in the concluding section. Full article
Show Figures

Graphical abstract

10150 KiB  
Article
How They Move Reveals What Is Happening: Understanding the Dynamics of Big Events from Human Mobility Pattern
by Jean Damascène Mazimpaka and Sabine Timpf
ISPRS Int. J. Geo-Inf. 2017, 6(1), 15; https://doi.org/10.3390/ijgi6010015 - 12 Jan 2017
Cited by 5 | Viewed by 4712
Abstract
The context in which a moving object moves contributes to the movement pattern observed. Likewise, the movement pattern reflects the properties of the movement context. In particular, big events influence human mobility depending on the dynamics of the events. However, this influence has [...] Read more.
The context in which a moving object moves contributes to the movement pattern observed. Likewise, the movement pattern reflects the properties of the movement context. In particular, big events influence human mobility depending on the dynamics of the events. However, this influence has not been explored to understand big events. In this paper, we propose a methodology for learning about big events from human mobility pattern. The methodology involves extracting and analysing the stopping, approaching, and moving-away interactions between public transportation vehicles and the geographic context. The analysis is carried out at two different temporal granularity levels to discover global and local patterns. The results of evaluating this methodology on bus trajectories demonstrate that it can discover occurrences of big events from mobility patterns, roughly estimate the event start and end time, and reveal the temporal patterns of arrival and departure of event attendees. This knowledge can be usefully applied in transportation and event planning and management. Full article
(This article belongs to the Special Issue Geospatial Big Data and Transport)
Show Figures

Figure 1

7226 KiB  
Article
UAV Low Altitude Photogrammetry for Power Line Inspection
by Yong Zhang, Xiuxiao Yuan, Yi Fang and Shiyu Chen
ISPRS Int. J. Geo-Inf. 2017, 6(1), 14; https://doi.org/10.3390/ijgi6010014 - 12 Jan 2017
Cited by 73 | Viewed by 8790
Abstract
When the distance between an obstacle and a power line is less than the discharge distance, a discharge arc can be generated, resulting in the interruption of power supplies. Therefore, regular safety inspections are necessary to ensure the safe operation of power grids. [...] Read more.
When the distance between an obstacle and a power line is less than the discharge distance, a discharge arc can be generated, resulting in the interruption of power supplies. Therefore, regular safety inspections are necessary to ensure the safe operation of power grids. Tall vegetation and buildings are the key factors threatening the safe operation of extra high voltage transmission lines within a power line corridor. Manual or laser intensity direction and ranging (LiDAR) based inspections are time consuming and expensive. To make safety inspections more efficient and flexible, a low-altitude unmanned aerial vehicle (UAV) remote-sensing platform, equipped with an optical digital camera, was used to inspect power line corridors. We propose a semi-patch matching algorithm based on epipolar constraints, using both the correlation coefficient (CC) and the shape of its curve to extract three dimensional (3D) point clouds for a power line corridor. We use a stereo image pair from inter-strip to improve power line measurement accuracy by transforming the power line direction to an approximately perpendicular to epipolar line. The distance between the power lines and the 3D point cloud is taken as a criterion for locating obstacles within the power line corridor automatically. Experimental results show that our proposed method is a reliable, cost effective, and applicable way for practical power line inspection and can locate obstacles within the power line corridor with accuracy better than ±0.5 m. Full article
Show Figures

Figure 1

10291 KiB  
Article
A Combinatorial Reasoning Mechanism with Topological and Metric Relations for Change Detection in River Planforms: An Application to GlobeLand30’s Water Bodies
by Liang Leng, Guodong Yang and Shengbo Chen
ISPRS Int. J. Geo-Inf. 2017, 6(1), 13; https://doi.org/10.3390/ijgi6010013 - 12 Jan 2017
Cited by 7 | Viewed by 5256
Abstract
Changes in river plane shapes are called river planform changes (RPCs). Such changes can impact sustainable human development (e.g., human habitations, industrial and agricultural development, and national border security). RPCs can be identified through field surveys—a method that is highly precise but time-consuming, [...] Read more.
Changes in river plane shapes are called river planform changes (RPCs). Such changes can impact sustainable human development (e.g., human habitations, industrial and agricultural development, and national border security). RPCs can be identified through field surveys—a method that is highly precise but time-consuming, or through remote sensing (RS) and geographic information system (GIS), which are less precise but more efficient. Previous studies that have addressed RPCs often used RS, GIS, or digital elevation models (DEMs) and focused on only one or a few rivers in specific areas with the goal of identifying the reasons underlying these changes. In contrast, in this paper, we developed a combinatorial reasoning mechanism based on topological and metric relations that can be used to classify RPCs. This approach does not require DEMs and can eliminate most false-change information caused by varying river water levels. First, we present GIS models of river planforms based on their natural properties and, then, modify these models into simple GIS river planform models (SGRPMs) using straight lines rather than common lines to facilitate computational and human understanding. Second, we used double straight line 4-intersection models (DSL4IMs) and intersection and difference models (IDMs) of the regions to represent the topological relations between the SGRPMs and used double-start-point 8-distance models (DS8DMs) to express the metric relations between the SGRPMs. Then, we combined topological and metric relations to analyse the changes in the SGRPMs. Finally, to compensate for the complexity of common river planforms in nature, we proposed three segmentation rules to turn common river planforms into SGRPMs and used combinatorial reasoning mechanism tables (CRMTs) to describe the spatial relations among different river planforms. Based on our method, users can describe common river planforms and their changes in detail and confidently reject false changes. Future work should develop a method to automatically or semi-automatically adjust the segmentation rules and the combinatorial reasoning mechanism. Full article
Show Figures

Figure 1

1552 KiB  
Article
Towards a Common Framework for the Identification of Landforms on Terrain Models
by Eric Guilbert and Bernard Moulin
ISPRS Int. J. Geo-Inf. 2017, 6(1), 12; https://doi.org/10.3390/ijgi6010012 - 12 Jan 2017
Cited by 20 | Viewed by 7531
Abstract
A landform is a physical feature of the terrain with its own recognisable shape. Its definition is often qualitative and inherently vague. Hence, landforms are difficult to formalise in a logical model that can be implemented. We propose for that purpose a framework [...] Read more.
A landform is a physical feature of the terrain with its own recognisable shape. Its definition is often qualitative and inherently vague. Hence, landforms are difficult to formalise in a logical model that can be implemented. We propose for that purpose a framework where these qualitative and vague definitions are transformed successively during different phases to yield an implementable data structure. Our main consideration is that landforms are characterised by salient elements as perceived by users. Hence, a common prototype based on an object-oriented approach is defined that shall apply to all landforms. This framework shall facilitate the definition of conceptual models for other landforms and relies on the use of ontology design patterns to express common elements and structures. The model is illustrated on examples from the literature, showing that existing works undertaken separately can be developed under a common framework. Full article
(This article belongs to the Special Issue Geospatial Semantics and Semantic Web)
Show Figures

Figure 1

689 KiB  
Editorial
Acknowledgement to Reviewers of IJGI in 2016
by IJGI Editorial Office
ISPRS Int. J. Geo-Inf. 2017, 6(1), 11; https://doi.org/10.3390/ijgi6010011 - 11 Jan 2017
Viewed by 4949
Abstract
The editors of IJGI would like to express their sincere gratitude to the following reviewers for assessing manuscripts in 2016.[...] Full article
264 KiB  
Article
Fuzzy GML Modeling Based on Vague Soft Sets
by Bo Wei, Qingqing Xie, Yuanyuan Meng and Yao Zou
ISPRS Int. J. Geo-Inf. 2017, 6(1), 10; https://doi.org/10.3390/ijgi6010010 - 11 Jan 2017
Cited by 3 | Viewed by 4105
Abstract
The Open Geospatial Consortium (OGC) Geography Markup Language (GML) explicitly represents geographical spatial knowledge in text mode. All kinds of fuzzy problems will inevitably be encountered in spatial knowledge expression. Especially for those expressions in text mode, this fuzziness will be broader. Describing [...] Read more.
The Open Geospatial Consortium (OGC) Geography Markup Language (GML) explicitly represents geographical spatial knowledge in text mode. All kinds of fuzzy problems will inevitably be encountered in spatial knowledge expression. Especially for those expressions in text mode, this fuzziness will be broader. Describing and representing fuzziness in GML seems necessary. Three kinds of fuzziness in GML can be found: element fuzziness, chain fuzziness, and attribute fuzziness. Both element fuzziness and chain fuzziness belong to the reflection of the fuzziness between GML elements and, then, the representation of chain fuzziness can be replaced by the representation of element fuzziness in GML. On the basis of vague soft set theory, two kinds of modeling, vague soft set GML Document Type Definition (DTD) modeling and vague soft set GML schema modeling, are proposed for fuzzy modeling in GML DTD and GML schema, respectively. Five elements or pairs, associated with vague soft sets, are introduced. Then, the DTDs and the schemas of the five elements are correspondingly designed and presented according to their different chains and different fuzzy data types. While the introduction of the five elements or pairs is the basis of vague soft set GML modeling, the corresponding DTD and schema modifications are key for implementation of modeling. The establishment of vague soft set GML enables GML to represent fuzziness and solves the problem of lack of fuzzy information expression in GML. Full article
(This article belongs to the Special Issue Recent Advances in Geodesy & Its Applications)
10594 KiB  
Article
Terrain Extraction in Built-Up Areas from Satellite Stereo-Imagery-Derived Surface Models: A Stratified Object-Based Approach
by Fritjof Luethje, Dirk Tiede and Clemens Eisank
ISPRS Int. J. Geo-Inf. 2017, 6(1), 9; https://doi.org/10.3390/ijgi6010009 - 10 Jan 2017
Cited by 10 | Viewed by 5424
Abstract
Very high spatial resolution (VHSR) stereo-imagery-derived digital surface models (DSM) can be used to generate digital elevation models (DEM). Filtering algorithms and triangular irregular network (TIN) densification are the most common approaches. Most filter-based techniques focus on image-smoothing. We propose a new approach [...] Read more.
Very high spatial resolution (VHSR) stereo-imagery-derived digital surface models (DSM) can be used to generate digital elevation models (DEM). Filtering algorithms and triangular irregular network (TIN) densification are the most common approaches. Most filter-based techniques focus on image-smoothing. We propose a new approach which makes use of integrated object-based image analysis (OBIA) techniques. An initial land cover classification is followed by stratified land cover ground point sample detection, using object-specific features to enhance the sampling quality. The detected ground point samples serve as the basis for the interpolation of the DEM. A regional uncertainty index (RUI) is calculated to express the quality of the generated DEM in regard to the DSM, based on the number of samples per land cover object. The results of our approach are compared to a high resolution Light Detection and Ranging (LiDAR)-DEM, and a high level of agreement is observed—especially for non-vegetated and scarcely-vegetated areas. Results show that the accuracy of the DEM is highly dependent on the quality of the initial DSM and—in accordance with the RUI—differs between the different land cover classes. Full article
Show Figures

Figure 1

8077 KiB  
Article
An On-Demand Retrieval Method Based on Hybrid NoSQL for Multi-Layer Image Tiles in Disaster Reduction Visualization
by Linyao Qiu, Qing Zhu, Zhiqiang Du, Meng Wang and Yida Fan
ISPRS Int. J. Geo-Inf. 2017, 6(1), 8; https://doi.org/10.3390/ijgi6010008 - 9 Jan 2017
Cited by 3 | Viewed by 5251
Abstract
Monitoring, response, mitigation and damage assessment of disasters places a wide variety of demands on the spatial and temporal resolutions of remote sensing images. Images are divided into tile pyramids by data sources or resolutions and published as independent image services for visualization. [...] Read more.
Monitoring, response, mitigation and damage assessment of disasters places a wide variety of demands on the spatial and temporal resolutions of remote sensing images. Images are divided into tile pyramids by data sources or resolutions and published as independent image services for visualization. A disaster-affected area is commonly covered by multiple image layers to express hierarchical surface information, which generates a large amount of namesake tiles from different layers that overlay the same location. The traditional tile retrieval method for visualization cannot distinguish between distinct layers and traverses all image datasets for each tile query. This process produces redundant queries and invalid access that can seriously affect the visualization performance of clients, servers and network transmission. This paper proposes an on-demand retrieval method for multi-layer images and defines semantic annotations to enrich the description of each dataset. By matching visualization demands with the semantic information of datasets, this method automatically filters inappropriate layers and finds the most suitable layer for the final tile query. The design and implementation are based on a two-layer NoSQL database architecture that provides scheduling optimization and concurrent processing capability. The experimental results reflect the effectiveness and stability of the approach for multi-layer retrieval in disaster reduction visualization. Full article
Show Figures

Figure 1

5480 KiB  
Article
Understanding the Representativeness of Mobile Phone Location Data in Characterizing Human Mobility Indicators
by Shiwei Lu, Zhixiang Fang, Xirui Zhang, Shih-Lung Shaw, Ling Yin, Zhiyuan Zhao and Xiping Yang
ISPRS Int. J. Geo-Inf. 2017, 6(1), 7; https://doi.org/10.3390/ijgi6010007 - 6 Jan 2017
Cited by 38 | Viewed by 7416
Abstract
The advent of big data has aided understanding of the driving forces of human mobility, which is beneficial for many fields, such as mobility prediction, urban planning, and traffic management. However, the data sources used in many studies, such as mobile phone location [...] Read more.
The advent of big data has aided understanding of the driving forces of human mobility, which is beneficial for many fields, such as mobility prediction, urban planning, and traffic management. However, the data sources used in many studies, such as mobile phone location and geo-tagged social media data, are sparsely sampled in the temporal scale. An individual’s records can be distributed over a few hours a day, or a week, or over just a few hours a month. Thus, the representativeness of sparse mobile phone location data in characterizing human mobility requires analysis before using data to derive human mobility patterns. This paper investigates this important issue through an approach that uses subscriber mobile phone location data collected by a major carrier in Shenzhen, China. A dataset of over 5 million mobile phone subscribers that covers 24 h a day is used as a benchmark to test the representativeness of mobile phone location data on human mobility indicators, such as total travel distance, movement entropy, and radius of gyration. This study divides this dataset by hour, using 2- to 23-h segments to evaluate the representativeness due to the availability of mobile phone location data. The results show that different numbers of hourly segments affect estimations of human mobility indicators and can cause overestimations or underestimations from the individual perspective. On average, the total travel distance and movement entropy tend to be underestimated. The underestimation coefficient results for estimation of total travel distance are approximately linear, declining as the number of time segments increases, and the underestimation coefficient results for estimating movement entropy decline logarithmically as the time segments increase, whereas the radius of gyration tends to be more ambiguous due to the loss of isolated locations. This paper suggests that researchers should carefully interpret results derived from this type of sparse data in the era of big data. Full article
Show Figures

Figure 1

3489 KiB  
Article
Kinematic Precise Point Positioning Using Multi-Constellation Global Navigation Satellite System (GNSS) Observations
by Xidong Yu and Jingxiang Gao
ISPRS Int. J. Geo-Inf. 2017, 6(1), 6; https://doi.org/10.3390/ijgi6010006 - 5 Jan 2017
Cited by 33 | Viewed by 6169
Abstract
Multi-constellation global navigation satellite systems (GNSSs) are expected to enhance the capability of precise point positioning (PPP) by improving the positioning accuracy and reducing the convergence time because more satellites will be available. This paper discusses the performance of multi-constellation kinematic PPP based [...] Read more.
Multi-constellation global navigation satellite systems (GNSSs) are expected to enhance the capability of precise point positioning (PPP) by improving the positioning accuracy and reducing the convergence time because more satellites will be available. This paper discusses the performance of multi-constellation kinematic PPP based on a multi-constellation kinematic PPP model, Kalman filter and stochastic models. The experimental dataset was collected from the receivers on a vehicle and processed using self-developed software. A comparison of the multi-constellation kinematic PPP and real-time kinematic (RTK) results revealed that the availability, positioning accuracy and convergence performance of the multi-constellation kinematic PPP were all better than those of both global positioning system (GPS)-based PPP and dual-constellation PPP. Multi-constellation kinematic PPP can provide a positioning service with centimetre-level accuracy for dynamic users. Full article
(This article belongs to the Special Issue Recent Advances in Geodesy & Its Applications)
Show Figures

Figure 1

2593 KiB  
Article
Combined Forecasting Method of Landslide Deformation Based on MEEMD, Approximate Entropy, and WLS-SVM
by Shaofeng Xie, Yueji Liang, Zhongtian Zheng and Haifeng Liu
ISPRS Int. J. Geo-Inf. 2017, 6(1), 5; https://doi.org/10.3390/ijgi6010005 - 1 Jan 2017
Cited by 14 | Viewed by 4973
Abstract
Given the chaotic characteristics of the time series of landslides, a new method based on modified ensemble empirical mode decomposition (MEEMD), approximate entropy and the weighted least square support vector machine (WLS-SVM) was proposed. The method mainly started from the chaotic sequence of [...] Read more.
Given the chaotic characteristics of the time series of landslides, a new method based on modified ensemble empirical mode decomposition (MEEMD), approximate entropy and the weighted least square support vector machine (WLS-SVM) was proposed. The method mainly started from the chaotic sequence of time-frequency analysis and improved the model performance as follows: first a deformation time series was decomposed into a series of subsequences with significantly different complexity using MEEMD. Then the approximate entropy method was used to generate a new subsequence for the combination of subsequences with similar complexity, which could effectively concentrate the component feature information and reduce the computational scale. Finally the WLS-SVM prediction model was established for each new subsequence. At the same time, phase space reconstruction theory and the grid search method were used to select the input dimension and the optimal parameters of the model, and then the superposition of each predicted value was the final forecasting result. Taking the landslide deformation data of Danba as an example, the experiments were carried out and compared with wavelet neural network, support vector machine, least square support vector machine and various combination schemes. The experimental results show that the algorithm has high prediction accuracy. It can ensure a better prediction effect even in landslide deformation periods of rapid fluctuation, and it can also better control the residual value and effectively reduce the error interval. Full article
(This article belongs to the Special Issue Recent Advances in Geodesy & Its Applications)
Show Figures

Figure 1

11362 KiB  
Article
Crustal and Upper Mantle Density Structure Beneath the Qinghai-Tibet Plateau and Surrounding Areas Derived from EGM2008 Geoid Anomalies
by Honglei Li and Jian Fang
ISPRS Int. J. Geo-Inf. 2017, 6(1), 4; https://doi.org/10.3390/ijgi6010004 - 30 Dec 2016
Cited by 4 | Viewed by 5458
Abstract
As the most active plateau on the Earth, the Qinghai-Tibet Plateau (TP) has a complex crust–mantle structure. Knowledge of the distribution of such a structure provides information for understanding the underlying geodynamic processes. We obtain a three-dimensional model of the density of the [...] Read more.
As the most active plateau on the Earth, the Qinghai-Tibet Plateau (TP) has a complex crust–mantle structure. Knowledge of the distribution of such a structure provides information for understanding the underlying geodynamic processes. We obtain a three-dimensional model of the density of the crust and the upper mantle beneath the TP and surrounding areas from height anomalies using the Earth Gravitational Model 2008 (EGM2008). We refine the estimated density in the model iteratively using an initial density contrast model. We confirm that the EGM2008 products can be used to constrain the crust–mantle density structures. Our major findings are: (1) At a depth of 300–400 km, high-D(ensity) anomalies terminate around the Jinsha River Suture (JRS) in the central TP, which suggests that the Indian Plate has reached across the Bangong Nujiang Suture (BNS) and almost reaches the JRS. (2) On the eastern TP, low-D(ensity) anomalies at a depth of 0–300 km and with high-D anomalies at 400–670 km further verified the current eastward subduction of the Indian Plate. The ongoing subduction process provides force that results in frequent earthquakes and volcanoes. (3) At a depth of 600 km, low-D anomalies inside the TP illustrate the presence of hot weak material beneath it, which contribute to the inward thrusting of external material. Full article
(This article belongs to the Special Issue Recent Advances in Geodesy & Its Applications)
Show Figures

Figure 1

4271 KiB  
Article
Evaluating the Impact the Weekday Has on Near-Repeat Victimization: A Spatio-Temporal Analysis of Street Robberies in the City of Vienna, Austria
by Philip Glasner and Michael Leitner
ISPRS Int. J. Geo-Inf. 2017, 6(1), 3; https://doi.org/10.3390/ijgi6010003 - 30 Dec 2016
Cited by 21 | Viewed by 5995
Abstract
The near-repeat phenomenon refers to the increased risk of repeat victimization not only at the same location but at nearby locations up to a certain distance and for a certain time period. In recent research, near-repeat victimization has been repeatedly confirmed for different [...] Read more.
The near-repeat phenomenon refers to the increased risk of repeat victimization not only at the same location but at nearby locations up to a certain distance and for a certain time period. In recent research, near-repeat victimization has been repeatedly confirmed for different crime types such as burglaries or shootings. In this article the near-repeat phenomenon is analyzed for each day of the week separately. That is, the near-repeat pattern is evaluated for all consecutive Mondays, Tuesdays, Wednesdays, etc. included in the dataset. These consecutive weekdays represent the fictive set of consecutive dates to allow for spatial and temporal analysis of crime patterns. Using these principles, it is hypothesized that street robberies cluster in space and time and by the same day of the week. This research analyzes street robberies from 2009 to 2013 in Vienna, Austria. The overall research goal investigates whether near-repeat patterns of robberies exist by weekdays and in an additional step by time of day, and whether these near-repeat patterns differ from each other and from purely spatial patterns. The results of this research confirm the existence of near-repeat patterns by weekday and especially by time of day. Distinctive locations have been identified that differ greatly per weekday and time of day. Based on this information, law enforcement agencies in Austria can optimize strategic planning of police resources in combating robberies. Full article
(This article belongs to the Special Issue Frontiers in Spatial and Spatiotemporal Crime Analytics)
Show Figures

Figure 1

Previous Issue
Next Issue
Back to TopTop