Abstract
Seismic disasters pose major challenges to urban resilience, particularly in high-density cities where the concentration of people, buildings, and infrastructure amplifies disaster risk. This study establishes a GIS-based analytical framework to evaluate the spatial distribution and fairness of seismic emergency shelters in Seoul, using built-up neighborhoods (called dongs in Korean) as the basic analytical unit. Three dimensions are assessed: (1) 500 m walking accessibility based on the road network; (2) redundancy, representing the number of shelters simultaneously reachable; and (3) fairness analysis, integrating spatial and population-based dimensions to reveal disparities between shelter provision and population demand. The results indicate that overall accessibility in Seoul is relatively high, with more than 50% of dongs achieving coverage levels above 50%. However, distinct spatial disparities remain. Central and mountainous areas, such as Jung-gu, Jongno-gu, and southern Seocho-gu, show coverage rates below 20%, while districts in the southwest and northeast exhibit higher redundancy. Fairness analysis further reveals inequality in shelter capacity relative to population: excluding null values, the median coverage ratio is 0.92 and the mean is 1.29, with only 44.97% of dongs achieving sufficient or surplus capacity (coverage ≥ 1). Notably, 44 dongs fall into the Low–High category, representing areas with large populations but limited shelter access, mainly concentrated in Jungnang-gu, Gangbuk-gu, and Yangcheon-gu. These dongs should be prioritized in future planning. Policy implications highlight strengthening shelter provision in high-population but low-coverage zones, incorporating evacuation functions into urban redevelopment, promoting inter-district resource sharing, and improving public awareness. The proposed framework provides a transferable model for optimizing seismic shelter systems in other high-density urban contexts.
1. Introduction
Natural disasters are among the most serious threats to human security and sustainable development worldwide. In alignment with the Sendai Framework for Disaster Risk Reduction 2015–2030, international policy emphasizes the transition from reactive response to proactive risk management to safeguard urban ecosystems [1]. The impacts of these disasters extend far beyond casualties, causing substantial economic losses, disrupting social systems, and resulting in long-term ecological consequences [2]. Among natural hazards, seismic disasters are especially critical due to their sudden onset, broad destructive scope, and inherent unpredictability [3]. When such events strike urban areas, factors such as the concentration of population, buildings, and infrastructure often amplify secondary risks and lead to more severe social and economic consequences [4].
Since seismic hazards cannot be prevented, developing a systematic and well-targeted urban disaster prevention framework has become the key approach to reducing losses [5]. Meanwhile, modern frameworks increasingly incorporate advanced analytical tools, such as geostatistical modeling for neighborhood-level risk analysis [6] and artificial intelligence for optimizing evacuation patterns [7]. Such a framework extends beyond engineering-based structures and includes multiple components such as early warning, evacuation, emergency shelters, rescue operations, health protection, and post-disaster reconstruction [8]. Within this system, emergency shelters play a crucial role: they provide temporary safe spaces and basic living conditions for affected residents, and serve as an essential link between the occurrence of a disaster and subsequent relief efforts [9].
In densely populated cities located in seismic zones, the spatial distribution of emergency shelters directly affects both the efficiency and resilience of disaster prevention. International studies in cities such as Nagoya [10], Bucharest [11], and Istanbul [12] have shown that well-planned shelters can form extensive and accessible networks, capable of accommodating large populations quickly after a disaster, thereby strengthening urban resilience and recovery capacity. Moreover, effective planning not only ensures wider coverage and better accessibility but also improves the balance between supply and demand, which is essential for protecting lives and property during seismic emergencies [13,14].
In the case of Korea and Seoul, most studies have concentrated on geological conditions [15,16], residents’ risk perception [17,18], infrastructure resilience [19,20], and seismic vulnerability assessments [21,22]. In recent years, several scholars have further expanded seismic studies in Korea by focusing on microseismic and slow-slip events. For instance, Choi et al. [23] and Naik et al. [24] examined the implications of microseismic and slow earthquakes for regional tectonic stability, while Park [25] investigated the seismic anisotropy of the Gyeonggi-do. Park et al. [26] also monitored S-waveforms in the capital region and identified anomalous fault activity near Pocheon, Gyeonggi-do. Specifically within Seoul, Choi et al. [27] conducted subsurface fault detection and confirmed the presence of an active fault in Seongbuk-gu. Building on this, Lee et al. [28] delineated micro-seismic zoning within Seoul, and Lee et al. [29] integrated seismic vulnerability and exposure indicators to characterize the city’s overall seismic risk profile. However, research directly addressing the spatial distribution and accessibility of shelters remains limited. This situation is partly related to the relatively low seismic risk of the Korean Peninsula [30]. Nevertheless, the rise of high-density housing and the increased seismic activity in recent years, particularly the 2016 Gyeongju seismic event (M = 5.8) [31] and the 2017 Pohang seismic event (M = 5.4) [32] have raised growing concerns about seismic preparedness. Notably, the number of recorded seismic events in Korea reached 77, 106, and 87 in 2022, 2023, and 2024, respectively, all exceeding the long-term annual average of 72.2 since 1999. These developments have brought renewed attention to the planning and spatial allocation of emergency shelters.
While seismic risk studies in Korea have matured, the issue of how effectively emergency shelters serve actual urban populations remains underexplored. The spatial configuration of shelters influences not only physical accessibility but also the redundancy of available choices and the fairness of distribution across different social and spatial contexts. Therefore, this study focuses on three interrelated dimensions: (1) 500 m walking accessibility, (2) shelter redundancy, and (3) spatial and population-based fairness: to build a more integrated understanding of seismic shelter systems. The 500 m threshold is derived from both Seoul’s shelter planning standards and empirical findings from high-density cities, ensuring methodological comparability. Redundancy is included to capture the resilience of the system under facility failure, while fairness links shelter distribution to demographic and spatial equity.
This study addresses this gap by proposing a methodological framework that evaluates the shelter system through three dimensions: walking accessibility, redundancy, and a dual-layer fairness framework. Unlike most previous works that either emphasize spatial proximity or simple capacity counts, this study introduces an analytical framework that combines network-based accessibility, redundancy, and fairness within built-up areas, explicitly excluding non-inhabitable spaces such as mountains and rivers. Moreover, it extends fairness analysis by integrating population-based coverage evaluation, providing a more realistic assessment of how well shelter capacity aligns with actual population distribution.
Against this background, this study examines the spatial distribution of emergency shelters in Seoul, with built-up areas as the analytical foundation. Specifically, the research aims to (1) evaluate shelter accessibility through road-network-based service areas, (2) measure redundancy as a resilience indicator, and (3) assess fairness by combining spatial equality and population adequacy. The ultimate goal is to identify spatial and population disparities in Seoul’s shelter system and to provide empirically grounded recommendations for improving urban seismic preparedness. This proposal represents a relevant contribution to the field by providing a replicable spatial analysis model that bridges the gap between theoretical accessibility and actual population-based coverage in complex urban environments.
2. Literature Review
Existing research on emergency shelters has largely focused on four main aspects: accessibility, redundancy, fairness, and comprehensive site selection. Regarding accessibility, Zhang et al. [33] applied the Gaussian two-step floating catchment area method combined with K-means clustering and particle swarm optimization; Liang et al. [34] refined this approach by incorporating shelter usability and population density into the catchment radius; and Jin et al. [35] proposed a minimum-cost maximum-flow model based on pedestrian networks to better meet walking accessibility requirements. Together, these studies highlight accessibility as a critical factor for ensuring that large populations can efficiently reach shelters during emergencies.
In terms of redundancy, Wang et al. [36] measured service overlap ratios to represent redundancy, Gao et al. [37] integrated redundant shelters into a university campus evaluation framework, and Tago et al. [38] employed micro-server and mobile agent technologies to improve redundancy in evacuation systems. These contributions collectively underscore redundancy as an essential indicator of system resilience, ensuring that alternative shelters are available in case individual facilities fail.
With respect to fairness, Zhong et al. [39] proposed a multi-objective optimization model to maximize fairness in shelter site selection, Lee et al. [40] examined differences in shelter coverage between census and floating populations, and Wang et al. [41] extended the concept of fairness by including the variation in residents’ subjective evaluations. Such works indicate that fairness goes beyond physical accessibility, encompassing both demographic differences and perceptions of shelter adequacy.
For comprehensive site selection, Jiao et al. [42] used ArcGIS 10.7 network analysis to optimize shelter allocation, Eelagh et al. [43] applied multi-criteria decision-making combined with network-based analysis, Anjomshoa et al. [44] used complex decision-making to select temporary shelter sites during the pre-disaster phase, and Amiran et al. [45] developed models using support vector machines, Gaussian process classifiers, and artificial neural networks to map potential shelters in seismically active regions. This body of research reflects a growing interest in integrated approaches that combine spatial analysis, decision-support tools, and machine learning to improve shelter planning.
Overall, these four streams of research provide complementary perspectives: accessibility ensures basic reachability, redundancy enhances resilience, fairness emphasizes equity in allocation, and comprehensive site selection seeks optimal integration of multiple factors. However, most previous studies remain limited in two aspects. First, they tend to focus either on spatial accessibility or on theoretical fairness without connecting these to actual population coverage. Second, few studies have analyzed shelter systems within high-density Asian cities at a fine-grained neighborhood scale while explicitly constraining the analysis to built-up areas.
This study addresses these gaps by introducing a dual-layer fairness framework that integrates spatial fairness (based on accessibility and redundancy) and population fairness (based on actual coverage-to-population ratios). This approach bridges the gap between spatial planning metrics and demographic realities, providing a more comprehensive assessment of shelter adequacy in complex urban environments.
3. Study Area and Data Sources
3.1. Overview of Seoul
Seoul, the capital of South Korea, is the most densely populated, economically developed, and urbanized city on the Korean Peninsula. As the nation’s political, economic, and cultural hub, Seoul plays a central role in Korea’s development [46]. The city is located in the northwest of the country, spanning the Han River, and is administratively divided into 25 autonomous districts (gu) and 467 neighborhoods (dong). These districts differ significantly in terms of urban functions, population density, and building structures (Figure 1b).
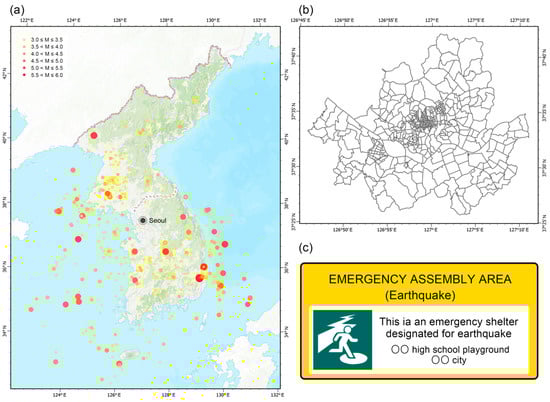
Figure 1.
(a) Seismic events of magnitude 3.0 or higher in Korea since 1975 (source: Korea Meteorological Administration); (b) Administrative divisions of Seoul at the dong level; (c) Seismic shelter sign in Korea (source: Korea National Disaster and Safety Portal).
Although Seoul and its surrounding areas have historically experienced relatively few large-scale seismic events (Figure 1a), both the Korean government and the Seoul Metropolitan Government have in recent years placed increasing emphasis on seismic disaster prevention. A relatively comprehensive shelter system has been gradually established, primarily by designating and managing open spaces such as subway stations, parks, school playgrounds, and large public facilities as seismic shelters. This system forms a citywide network of shelters with broad coverage and diverse functions [47] (Figure 1c).
3.2. Data Sources
This study draws on five main categories of spatial data: shelter locations, land-use types, road networks, resident populations, and administrative boundaries. All datasets were obtained from official platforms of the Seoul Metropolitan Government and the Korean government. Shelter location data were obtained from Seoul Open Data Plaza, which provides the geographic coordinates, spatial distribution and area of outdoor seismic shelters in Seoul (Seoul Open Data Plaza, Seoul City Outdoor Earthquake Shelter, https://data.seoul.go.kr/dataList/OA-21063/S/1/datasetView.do, accessed on 5 August 2025). Land-use data were also obtained from Seoul Open Data Plaza, covering the distribution of various land-use categories across Seoul (Seoul Open Data Plaza, Geospatial Information of Use Area in Seoul, https://data.seoul.go.kr/dataList/OA-21136/S/1/datasetView.do, accessed on 14 August 2025).
For transportation infrastructure, we used road segment data provided by V-World Digital Twin Nation, which are of sufficient precision to support road network–based accessibility and service area analyses (V-World Digital Twin Nation, Road Section Seoul, https://www.vworld.kr/dtmk/dtmk_ntads_s002.do?dsId=30055, accessed on 13 August 2025). For resident populations, we use the resident registration population data for each dong, sourced from the Seoul Data Hub, which includes dong codes and resident population figures (Seoul Data Hub, Number of resident registration population by gender and age by region (Legal-status neighborhood), https://data.seoul.go.kr/bsp/wgs/dataView/data300View/10049.do, accessed on 22 September 2025). Administrative boundary data were likewise obtained from V-World Digital Twin Nation, including dong-level boundary polygons and administrative codes, enabling neighborhood-scale spatial overlay and statistical analysis (V-World Digital Twin Nation, Administrative boundary, https://www.vworld.kr/dtmk/dtmk_ntads_s002.do?dsId=30017, accessed on 13 August 2025).
The reference year for the shelter, land-use, road, population, and administrative boundary datasets is 2025, ensuring temporal consistency across all data sources. Overall, these datasets are authoritative and publicly available geospatial resources, characterized by high accuracy and reliability, which ensure the scientific robustness and credibility of subsequent accessibility, redundancy, and fairness analyses of seismic shelters based on road networks and built-up areas.
3.3. Data Preprocessing
In the preprocessing stage, seismic shelter point data (Figure 2a) and road network data (Figure 2b) were imported into ArcGIS Pro 3.4.3 and unified under the WGS 1984 projection to ensure spatial consistency and comparability.
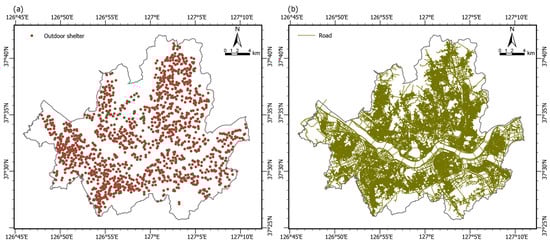
Figure 2.
(a) Distribution of seismic shelters in Seoul; (b) Road network of Seoul.
To guarantee accurate matching across datasets, administrative boundary data were aligned with corresponding attribute information based on administrative codes, ensuring reliability in neighborhood-level spatial statistics.
Since this study focuses on evaluating accessible residential areas, non-built-up land such as mountains and water bodies was excluded [48]. Specifically, the classification of land use followed the Seoul Metropolitan Government’s official land-use zoning schema, which includes six major categories: residential, commercial, industrial, transportation, green space, and water area. Among these, residential, commercial, industrial, and transportation zones were collectively defined as built-up areas, while green and water zones were defined as non-built-up areas.
Using Seoul’s land-use dataset, green spaces and water bodies were first merged into a single non-built-up layer through the Dissolve tool in ArcGIS Pro. The remaining urban-use categories were merged into a built-up area layer (Figure 3a). To quantify the extent of exclusion, the total non-built-up area accounted for approximately 38.4% of Seoul’s administrative surface, primarily distributed along the Han River and northern and southern mountainous zones.
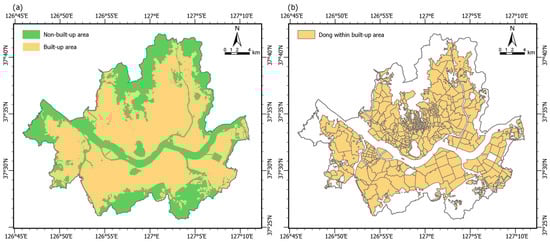
Figure 3.
(a) Built-up and non-built-up areas in Seoul, derived from land-use data; (b) Dong boundaries located within built-up areas.
Regarding the land-use classification, transportation zones were retained as part of the built-up area because they function as the essential structural skeleton of the urban fabric and are directly linked to the accessibility of residents. While green spaces were excluded from the analysis units to ensure that population statistics accurately reflect actual inhabited areas, all seismic shelters located within these zones were preserved as destination points in the accessibility model. This distinction ensures that the analysis captures the functional accessibility of the entire shelter network while avoiding overestimation caused by uninhabited open spaces.
Subsequently, the Intersect tool was applied to extract neighborhood polygons (dong) located within built-up areas, which serve as the basic spatial analysis units in this study (Figure 3b). Each resulting polygon represents the inhabited, accessible portion of a dong, ensuring that subsequent analyses reflect only the functionally usable urban surface rather than uninhabited open space. All subsequent accessibility and redundancy analyses were conducted within these built-up neighborhood areas.
4. Methodology
4.1. Accessibility Analysis Method
Accessibility measures the likelihood that residents can reach emergency shelters within a defined walking distance, and it is one of the key indicators for evaluating an emergency shelter system [49]. In this study, the analysis was conducted at the scale of built-up dong areas, excluding mountains and water bodies. Considering the potential disruption of urban transportation infrastructure caused by seismic events [50], the actual walking ability of the elderly and children [51,52], the spatial density of shelters in Seoul, and empirical practices from other high-density urban studies [53,54], a 500 m walking threshold was adopted as a reasonable limit of accessibility.
Moreover, previous international studies have also widely applied the 500 m threshold in seismic shelter planning. For instance, Liu et al. [55] adopted 500 m as the effective walking distance for evacuees to reach shelters immediately after seismic alarms in Nanjing; Ding et al. [56] set a 500 m service radius for temporary shelters in Tianjin; and You et al. [57] used the same threshold to define emergency shelter coverage in Beijing. These cities, like Seoul, are high density East Asian metropolises with comparable urban morphology and population characteristics, which supports the suitability of adopting a 500 m threshold in this study.
Service area polygons were generated based on the road network and overlaid with the built-up boundaries of each dong. For each dong, accessibility was calculated as the proportion of road length within the built-up area of the dong that fell inside the service area. The indicator is defined as:
where Ai is the accessibility of dong i, Li is the total length of roads within the built-up portion of dong i covered by the service area, and Ti is the total road length within the built-up portion of dong i. A higher value of Ai indicates that a larger share of the neighborhood’s built-up road network is within 500 m walking distance to a shelter, reflecting stronger accessibility.
4.2. Redundancy Analysis Method
Redundancy represents the degree of choice available to residents, indicating whether a neighborhood can access more than one shelter [58]. To capture this, the independent service areas of each shelter were preserved, rather than merged, allowing overlapping coverage to be explicitly identified. For each built-up dong area, redundancy was determined by counting the number of distinct shelters whose 500 m network-based service areas spatially intersected the built-up portion of the dong. This operation was conducted using the Intersect tool in ArcGIS Pro, which ensures that only service areas with a non-zero intersection area are counted, thereby avoiding double-counting at shared or boundary edges. In cases where multiple shelters share partial overlap within the same dong, each unique shelter is counted once, reflecting the effective number of independent shelter options available to residents. The redundancy indicator is defined as:
where Ri is the redundancy of dong i, denotes the number of shelters meeting the condition, Sj represents the service area of shelter j, and Dj denotes the built-up portion of dong i. This formulation ensures that redundancy reflects the count of distinct, spatially valid shelter connections rather than the geometric extent of overlapping zones. Higher redundancy indicates that residents have multiple shelter options, which reduces dependence on a single facility and enhances overall seismic resilience.
4.3. Fairness Analysis Method
Fairness analysis evaluates the equity of emergency shelter distribution from both spatial and population-based perspectives. To provide a comprehensive understanding of shelter provision in Seoul, this study integrates two complementary approaches: (1) Spatial Fairness Analysis, which assesses accessibility and redundancy patterns across neighborhoods; and (2) Population Fairness Analysis, which examines the adequacy of shelter capacity relative to residential population.
4.3.1. Spatial Fairness Analysis Method
Spatial fairness was first examined through a two-dimensional matrix combining accessibility and redundancy. Both indicators were normalized, and their medians were used as thresholds to distinguish high and low values. Based on this, a two-dimensional matrix was constructed, classifying all built-up dongs into four categories:
- High accessibility–High redundancy (resource-concentrated);
- High accessibility–Low redundancy (single-choice dependent);
- Low accessibility–High redundancy (potentially compensatory);
- Low accessibility–Low redundancy (vulnerable).
The classification logic is expressed as:
where and are the median values of accessibility and redundancy across all built-up dongs, and Si denotes the classification of dong i. This method allows the spatial fairness of shelters to be visualized directly at the neighborhood level.
4.3.2. Population Fairness Analysis Method
While the two-dimensional matrix classification captures the spatial distribution of accessibility and redundancy, it does not directly reflect the balance between shelter capacity and population demand. To address this limitation, this study introduces a population-weighted fairness analysis, which evaluates the adequacy of shelter resources relative to the residential population at the dong level.
The population fairness indicator measures how well the total accessible shelter capacity meets the actual population within the built-up portion of each dong. The indicator is defined as:
where Fi represents the shelter coverage ratio of dong i, Pi is the effective residential population of dong i, and denotes the weighted contribution of shelter j to dong i. The weighted contribution is calculated as:
where Cj is the total capacity that shelter j can accommodate, is the intersected area between the 500 m network-based service area of shelter j and the built-up portion of dong i, and Aj is the total area of the 500 m service zone of shelter j.
This formulation proportionally allocates each shelter’s capacity to the built-up neighborhoods it covers, ensuring that the population coverage ratio reflects both spatial accessibility and the actual scale of demand. A higher Fi value indicates a greater adequacy of available shelter capacity relative to the population of the corresponding dong, while lower values signify potential shortages.
To address data and interpretability issues, the following adjustments were applied:
- Dongs with no residential population were excluded from the analysis, as shelter demand is not applicable.
- Dongs without any overlapping shelter service areas were assigned Fi = 0, representing a complete lack of access.
- Extreme coverage values caused by very small population baselines, such as commercial areas with few registered residents, were truncated to the range [0.05, 3.0]. Values below 0.05 indicate severe undersupply, those between 0.05 and 1.0 indicate partial insufficiency, and values above 1.0 represent adequate or surplus shelter capacity. The selection of 0.05 and 3.0 as cut-off values was determined empirically based on the actual distribution of the data (where a total of 88 extreme values were truncated, accounting for approximately 17.5% of the total), as extremely low and high values are statistically insignificant and do not convey meaningful differences in shelter adequacy.
Through this indicator, population fairness is evaluated as a complement to spatial fairness, revealing mismatches between shelter availability and residential demand that may not be captured by accessibility or redundancy alone. Together, the two indicators, spatial fairness and population fairness, form a comprehensive framework for assessing the equity of seismic shelter distribution in high-density urban environments. The technical roadmap is shown in Figure 4.
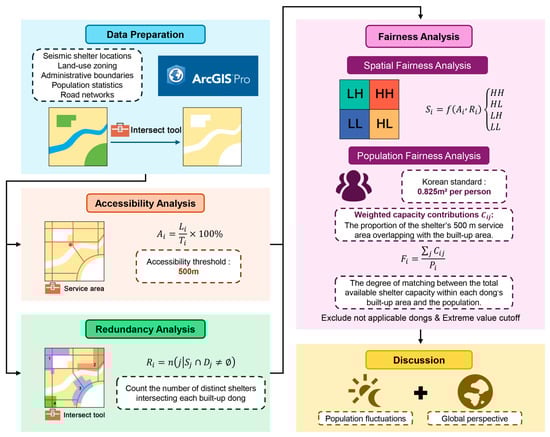
Figure 4.
Technical roadmap.
Meanwhile, to ensure consistency and comparability across all visual analyses, the classification of choropleth maps in this study was conducted using the equal interval method.
5. Results
5.1. Accessibility Analysis
Using the road network, 500 m walking service areas were generated and overlaid with built-up dong polygons to calculate the proportion of accessible coverage for each dong (Figure 5a). The results show that in most parts of Seoul, more than 50% of the built-up areas within each dong fall within the service area, indicating generally high accessibility levels. In particular, Yeongdeungpo, Mangwon, Changsin, and Sajik achieved average coverage rates above 90%, reflecting favorable shelter conditions.
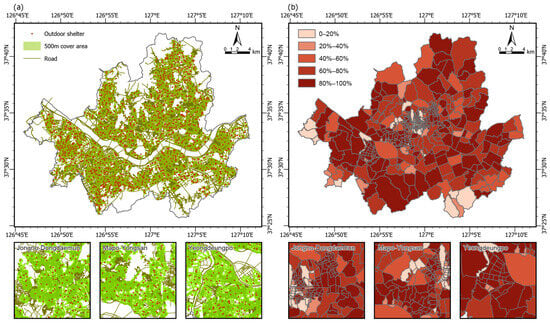
Figure 5.
(a) 500 m walking service areas of seismic shelters based on the road network; (b) Accessibility coverage ratio of built-up dongs (visualized at full dong boundaries).
However, in Jung-gu, several small dongs, such as Sogong-dong, Bukchang-dong, and Suha-dong, recorded a coverage of 0. Moreover, a considerable number of dongs in this district had coverage rates below 20%. This outcome can be attributed to the prevalence of older, small-scale detached housing, the scarcity of public open space, and the small land area of these dongs, which limits actual coverage. In the southern mountainous part of Seocho-gu, including Naegok-dong, Yeomgok-dong, and Wonji-dong, coverage was below 10%. These areas are located in valley terrain, geographically isolated and less connected to surrounding transport networks, resulting in clear accessibility deficits. Similarly, in Seodaemun-gu, dongs such as Bongwon-dong, Hyeonjeo-dong, and Sinchon-dong recorded coverage rates below 20%, forming a local gap in western Seoul (Figure 5b).
5.2. Redundancy Analysis
Redundancy was measured by preserving the independent service areas of each shelter and counting the number of shelters accessible within each built-up dong (Figure 6a). Results show considerable variation across Seoul. Higher redundancy was observed in the northeastern and southwestern parts of the city, while areas along the Han River and in Gangdong-gu showed moderate redundancy. By contrast, redundancy was markedly low in the Jongno–Euljiro corridor, the mountain valleys at the southern foot of Bukhansan, and the southern part of Seocho-gu (Figure 6b).
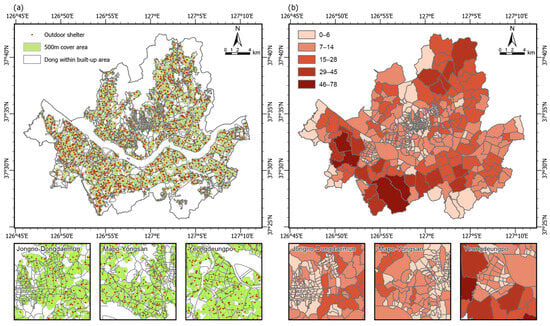
Figure 6.
(a) Redundancy of seismic shelters within 500 m walking distance; (b) Spatial distribution of redundancy across built-up dongs (visualized at full dong boundaries).
5.3. Fairness Analysis
5.3.1. Spatial Fairness Analysis
After normalizing accessibility and redundancy results for each built-up dong, the median accessibility was found to be 0.85, while the median redundancy was 0.08. Overall, Seoul shows a characteristic pattern of high accessibility but low redundancy. Using the medians as thresholds, the 467 dongs were classified into four categories: High–High (138 dongs), High–Low (96 dongs), Low–High (120 dongs), and Low–Low (113 dongs) (Figure 7a).
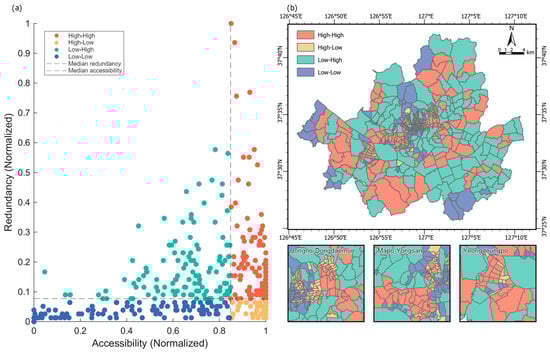
Figure 7.
(a) Scatter plot of accessibility–redundancy two-dimensional classification; (b) Spatial distribution of dong-level classifications (based on built-up areas, visualized at full dong boundaries).
The spatial distribution of these categories shows distinct clustering. High–High dongs, the most numerous, were concentrated in the western and southern parts of Seoul, including the Hwagok–Sinwol and Deungchon–Mokdong areas of Gangseo-gu and Yangcheon-gu, non-Yeouido parts of Yeongdeungpo, southern Gwanak-gu, much of Mapo-gu, the Nonhyeon area of Gangnam-gu, the Dongdaemun–Wangsimni corridor, the Myeonmok area of Jungnang-gu, the Suyu–Ssangmun area of Gangbuk-gu and Dobong-gu, and the western part of Eunpyeong-gu.
High–Low dongs, the least common, were concentrated in central Seoul, including Jongno, Euljiro, and Myeong-dong, with scattered cases in Donam-dong (Seongbuk-gu), Dangsan-dong (Yeongdeungpo-gu), and the Samgakji area of Yongsan-gu. Notably, these dongs are generally small in area, so although their count is not much lower than other categories, the total land area covered is significantly less.
Low–High dongs were more evenly distributed across the city, particularly in the northwest, northeast, and southern Seoul, including the Seocho–Gangnam–Songpa corridor.
Low–Low dongs showed a dual distribution in both central and peripheral areas. In the city center, they were located in Jongno, Namdaemun, and along the Han River in Yongsan-gu. At the periphery, they appeared in the mountain valleys of northern Bukhansan, the northern slopes of Cheonggyesan in southern Seocho-gu, and around Gimpo Airport and Onsu in the west (Figure 7b).
5.3.2. Population Fairness Analysis
The shelter dataset includes information on the physical area of each emergency site. According to the Development on Designation and Operation Standard of Earthquake Evacuation Shelter issued by the Korean government, the required area per person in an outdoor seismic shelter is 0.825 m2 [59]. Based on this standard, the capacity of each shelter (Cj) was calculated by dividing its total area by 0.825 m2.
Since the effective service area of each shelter can extend across multiple dongs, the contribution of each shelter to a specific dong was computed using a weighted capacity approach. This weighting accounts for the proportion of the shelter’s 500 m network-based service area that overlaps with the built-up portion of each dong. The resulting indicator represents the population-based shelter coverage ratio, which reflects the adequacy of accessible shelter capacity relative to the local population in built-up areas.
To ensure interpretability, the calculated coverage ratios were truncated within the range [0.05, 3.0], where values below 0.05 indicate severe undersupply, values between 0.05 and 1.0 represent partial insufficiency, and values above 1.0 denote adequate or surplus capacity (Figure 8a).
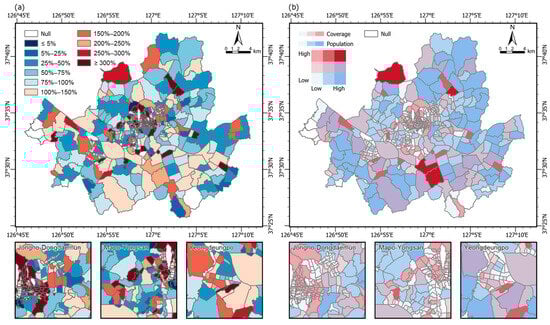
Figure 8.
(a) Population-based shelter coverage ratio for each dong; (b) Two-dimensional color map of shelter coverage ratio and population size.
Considering the spatial heterogeneity of population distribution, the relationship between shelter coverage and population size was further visualized through a two-dimensional color map (Figure 8b). This representation allows a clearer understanding of how population concentration interacts with the adequacy of shelter provision across different neighborhoods, highlighting areas where large populations coincide with limited shelter capacity. Detailed results of the population-based shelter coverage ratio for all dongs in Seoul are provided in Supplementary Materials file Table S1.
Overall, the results reveal clear spatial disparities in population-based shelter coverage between the northern and southern parts of the Han River. The northern districts generally exhibit lower coverage ratios, while the southern districts display higher and more balanced values. Among the northern areas, coverage levels vary widely across dongs: exceptionally high ratios (≥300%) are concentrated in central Seoul, particularly in Jung-gu, Jongno-gu, and Yongsan-gu, where numerous shelters overlap within small administrative areas. In contrast, several dongs in Mapo-gu show extremely low coverage (≤5%), reflecting localized undersupply.
On the southern side of the Han River, the variation in coverage is relatively moderate. Districts such as Dongjak-gu, Seocho-gu, and Gangnam-gu demonstrate generally adequate levels of shelter capacity, indicating a more proportionate relationship between available shelter space and residential population.
When shelter coverage is examined together with population size, several areas emerge as critical zones where large populations coincide with low coverage, notably Jungnang-gu, Gangbuk-gu, and Yangcheon-gu. These neighborhoods face higher potential risk during seismic emergencies, as a significant number of residents may lack sufficient access to designated shelters within a 500 m walking distance. Therefore, these areas should be prioritized in future shelter planning and capacity enhancement efforts, either through the establishment of additional shelters or the reallocation and optimization of existing ones to better match local population demand.
To further quantify the spatial distribution of population-based shelter coverage, statistical analysis was conducted for all 467 dongs (Figure 9a). Excluding null values, the median coverage ratio was 0.9246, and the mean value was 1.2865, indicating that overall shelter provision is slightly higher than the minimum requirement. A total of 210 dongs exhibited coverage ratios equal to or greater than 1.0, accounting for 44.97% of all dongs (including null cases). This means that slightly less than half of Seoul’s neighborhoods currently have sufficient or surplus shelter capacity relative to their population. The remaining dongs fall below this threshold, revealing substantial spatial variation and potential inequities in shelter accessibility.
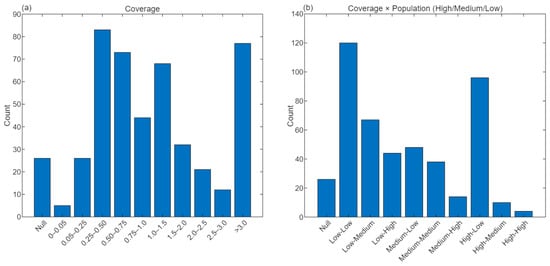
Figure 9.
(a) Statistical distribution of population-based shelter coverage ratio for each dong; (b) Two-dimensional classification of shelter coverage ratio and population size.
A two-dimensional classification combining coverage ratio and population size (Figure 9b) provides a more nuanced understanding of the population–capacity relationship. Among the valid samples, 26 dongs were identified as null cases due to missing population or shelter data. The distribution across the remaining categories is as follows: Low–Low: 120, Low–Medium: 67, Low–High: 44, Medium–Low: 48, Medium–Medium: 38, Medium–High: 14, High–Low: 96, High–Medium: 10, and High–High: 4.
Particular attention should be paid to the Low–High group (44 dongs), which represents neighborhoods with large populations but insufficient shelter coverage—areas that face elevated risk during seismic emergencies. In addition, the Low–Low (120) and Low–Medium (67) categories also signal regions where both coverage and population accessibility are limited and require improvement. These findings underscore the spatial mismatch between shelter capacity and residential demand, calling for targeted planning interventions such as the addition of new shelters or the functional upgrading of existing ones in densely populated but under-served zones.
6. Discussion
This study analyzed the accessibility, redundancy, and fairness of seismic emergency shelters in Seoul, revealing both overall strengths and local deficiencies in their spatial distribution. Based on the findings, the discussion is organized from three perspectives, theoretical, methodological, and empirical, followed by directions for future research.
From theoretical perspective, this study advances the concept of fairness in seismic shelter planning by integrating both spatial and population dimensions. Traditionally, fairness has been narrowly defined in terms of population coverage or demand satisfaction, assessing adequacy by comparing total shelter capacity with population size. However, such a one-dimensional view overlooks the spatial heterogeneity of urban form and the unequal distribution of accessibility within built-up areas. These issues have been noted in international studies such as those by Hao et al. [60] on urban resilience in Tallahassee, USA and Tsai et al. [61] in Taipei’s evacuation network modeling. By jointly analyzing spatial accessibility and population-adjusted shelter capacity, this study builds upon and extends these approaches, demonstrating how areas with similar physical coverage may differ substantially in population adequacy. The integrated fairness framework proposed here thus aligns with broader global efforts to operationalize disaster prevention equity through multilayer spatial assessment [62,63], contributing a transferable model for other high density cities.
From a methodological perspective, this research moves beyond conventional single-indicator analyses by linking network-based accessibility, redundancy, and population-weighted fairness within a unified spatial system. While pioneering studies [64,65] have provided essential insights into service area coverage, this framework enriches the analysis by incorporating both shelter capacity and the proportional overlap between service areas and built-up neighborhoods. This approach allows for the detection of two types of vulnerability: (1) spatially underserved areas with limited reachability, and (2) demographically underserved areas where shelter capacity per resident is critically low. Such a distinction enhances the explanatory robustness of fairness evaluation. Nevertheless, two methodological constraints merit attention. First, the weighting of population coverage assumes that shelter capacity is proportionally distributed according to the spatial overlap of service areas, which may not fully reflect actual overcrowding or localized unavailability of shelters. Second, while the 500 m threshold is empirically justified, future sensitivity tests across varying distances (e.g., 1000 m and 1500 m) would help assess model stability.
From an empirical perspective, the integration of spatial and population fairness reveals a complex but interpretable spatial–demographic mismatch in Seoul’s shelter system, while offering opportunities for comparison with global cases. The accessibility–redundancy matrix highlights Jung-gu and Jongno-gu as core low-access and low-redundancy zones, patterns consistent with findings in other compact historical districts such as Nanjing [55] and Yazd [66], where dense urban fabric and heritage preservation constraints hinder the provision of large-scale shelters. In contrast, southern districts such as Dongjak-gu, Seocho-gu, and Gangnam-gu demonstrate more balanced spatial accessibility. However, population fairness analysis based on registered residential data indicates that only 44.97% of Seoul’s neighborhoods achieve sufficient per capita capacity (coverage ≥ 1.0), while approximately 25% remain below 0.5. This echoes international patterns found in Guangzhou [67] and Jinan [68], where population concentration intensifies inequities even under high spatial accessibility.
Nevertheless, spatial and population fairness are not static attributes but context-dependent measures that can shift with temporal population dynamics. Considering Seoul’s strong daytime population mobility, we additionally compared maximum and minimum population counts for each district (Seoul Open Data Plaza, Seoul Living Population by Autonomous Region, https://data.seoul.go.kr/dataList/OA-15379/S/1/datasetView.do, accessed on 22 December 2025) on a typical weekday: 10 September 2025 (mean temperature 24.8 °C, total precipitation 0 mm) (KMA National Climate Data Center, Climate Statistics, https://data.kma.go.kr/stcs/grnd/grndTaList.do?pgmNo=70, accessed on 22 December 2025). The resulting Population Fluctuation Rate highlights Jung-gu and Jongno-gu as the top two districts (136.49% and 95.48%), followed by Gangnam-gu (61.75%) and Seocho-gu (53.00%). This finding explains the apparent discrepancy: although Jung-gu and Jongno-gu show low accessibility and redundancy under static residential data, their shelters are relatively concentrated within compact urban blocks adjacent to major employment and tourism clusters, which temporarily alleviates population-pressure imbalance during daytime hours. In contrast, Gangnam-gu and Seocho-gu, while also serving as major employment hubs, experience far larger daytime inflows due to high corporate density and commuting concentration, leading to potential undercapacity during peak working hours despite their relatively balanced spatial structure.
This temporal complementarity demonstrates that spatial disadvantage does not always equate to functional vulnerability; rather, fairness should be understood as a dynamic equilibrium between spatial configuration and population fluctuation. Other districts display low fluctuation rates and are therefore not discussed in detail (Table 1). This analysis underscores that incorporating dynamic population patterns could further refine fairness evaluation, particularly in metropolitan cores with pronounced daily commuting flows.

Table 1.
Population Fluctuation Rate and Average Population Fairness across Seoul’s districts (10 September 2025).
From a policy perspective, several implementable pathways emerge from the findings. Specifically, for areas with low population coverage, municipal authorities should prioritize land identification and the adaptive reuse of underutilized open spaces as temporary shelters to improve per capita capacity. To address deficiencies in accessibility and redundancy, integrating shelter functions into urban renewal projects or creating multi-purpose disaster plazas can enhance coverage within constrained built environments. Furthermore, to enhance cross-district fairness, Seoul should establish a real-time digital shelter management system that allows residents to identify the nearest available facility, thereby facilitating the dynamic redistribution of evacuees when local capacities are exceeded. Finally, public engagement can be bolstered through neighborhood-based evacuation drills and mobile applications integrated with the Seoul Disaster Safety Portal, which would significantly improve shelter awareness and utilization efficiency. These targeted strategies directly correspond to the empirical findings and provide actionable guidance for municipal disaster-prevention planning.
7. Conclusions
This study proposed an integrated spatial and population fairness framework for evaluating seismic emergency shelters in high-density urban environments, demonstrated through the case of Seoul. The framework combined (1) network-based accessibility within a 500 m walking range, (2) redundancy of simultaneously reachable shelters, and (3) fairness assessment encompassing both spatial equality and population adequacy.
The main findings are as follows. First, overall accessibility in Seoul is relatively high, with over half of the dongs achieving at least 50% coverage, while central and mountainous districts such as Jung-gu and Jongno-gu show relatively limited spatial accessibility under static residential conditions, though their fairness improves temporarily during daytime hours due to concentrated shelter locations near major employment and tourism zones. Second, redundancy patterns show inequality: higher in the northeast and southwest but notably deficient in the central corridor and southern Seocho-gu. Third, population fairness reveals significant disparities, only 44.97% of neighborhoods reach sufficient per capita shelter capacity, while about 24% fall below 0.5, underscoring severe underprovision in high-density districts.
Based on these findings, several planning and management implications can be drawn:
- Shelter capacity adjustment: new shelters should be strategically added or existing facilities expanded in low-coverage and high-population areas identified by the population fairness analysis.
- Functional integration: future urban redevelopment should embed shelter functions into public and community infrastructure, such as underground parking spaces, sports fields, and schools.
- Smart management and awareness: digital shelter maps and mobile alert systems should be strengthened to guide residents dynamically toward available shelters during seismic emergencies.
By integrating spatial and demographic metrics, this research advances beyond conventional one-dimensional assessments, offering a reproducible methodology applicable to other high-density cities. The Seoul case demonstrates that spatial proximity alone cannot ensure equitable disaster protection, capacity adequacy relative to population patterns must also be considered.
The primary contribution of this study lies in establishing a dual-layer fairness evaluation model that bridges spatial planning and demographic equity, offering both theoretical advancement and practical transferability.
Despite its contributions, this study has limitations that provide avenues for future refinement. While the current model assumes uniform shelter usability and relies on official population data, it may not fully capture real-world accessibility during temporary restrictions or account for day–night population fluctuations in commercial hubs. Furthermore, although the 500 m walking threshold and service area-based capacity weighting reflect practical seismic conditions, they may not fully encompass localized overcrowding or complex physical barriers. These constraints do not invalidate the findings but underscore the need for methodological enhancements. Consequently, future research should integrate floating population datasets and behavioral evacuation modeling to improve fairness evaluations. Additionally, incorporating time-sensitive accessibility simulations and scenario-based sensitivity analyses will be essential to validate the robustness of fairness indicators and provide a more nuanced understanding of shelter utilization dynamics.
In conclusion, this study provides a data-driven, adaptable, and internationally relevant framework that simultaneously integrates spatial accessibility, service redundancy, and population-based capacity adequacy. This integrated approach enables a more precise identification of inequities within the urban shelter system and provides empirical evidence for targeted improvements in disaster governance. Ultimately, it contributes to the global discourse on developing equitable and resilient urban disaster-prevention systems.
Supplementary Materials
The following supporting information can be downloaded at: https://www.mdpi.com/article/10.3390/ijgi15010016/s1, Table S1: Population-Based Shelter Coverage Ratio for All Dongs in Seoul.
Author Contributions
Conceptualization, Jiyeong Kang; methodology, Juncheng Zeng; software, Juncheng Zeng; validation, Hwanyong Kim; formal analysis, Juncheng Zeng; investigation, Hwanyong Kim; resources, Jiyeong Kang; data curation, Juncheng Zeng; writing—original draft preparation, Juncheng Zeng; writing—review & editing, Hwanyong Kim; visualization, Juncheng Zeng; supervision, Jiyeong Kang; project administration, Jiyeong Kang; funding acquisition, Hwanyong Kim. All authors have read and agreed to the published version of the manuscript.
Funding
This research was funded by the Basic Research Program through the National Research Foundation of Korea (NRF), grant number RS-2023-00220751.
Data Availability Statement
The original data presented in the study are openly available in Seoul Open Data Plaza at https://data.seoul.go.kr/, accessed on 5 August 2025 and V-World Digital Twin Nation at https://www.vworld.kr/v4po_main.do, accessed on 13 August 2025.
Acknowledgments
The authors would like to thank the editor and anonymous reviewers for their comments and suggestions, which helped a lot in improving this paper. The authors also wish to express their gratitude to Alekseeva Kseniia from Hanyang University ERICA for her valuable contributions during the revision and refinement stage of the manuscript.
Conflicts of Interest
The authors declare no conflicts of interest.
References
- Aitsi-Selmi, A.; Egawa, S.; Sasaki, H.; Wannous, C.; Murray, V. The Sendai framework for disaster risk reduction: Renewing the global commitment to people’s resilience, health, and well-being. Int. J. Disaster Risk Sci. 2015, 6, 164–176. [Google Scholar] [CrossRef]
- Depietri, Y. The social–ecological dimension of vulnerability and risk to natural hazards. Sustain. Sci. 2020, 15, 587–604. [Google Scholar] [CrossRef]
- Bai, Y.; Li, Y. More suffering, more involvement? The causal effects of seismic disasters on social capital. World Dev. 2021, 138, 105221. [Google Scholar] [CrossRef]
- Satir, O.; Kemec, S.; Yeler, O.; Akin, A.; Bostan, P.; Mirici, M.E. Simulating the impact of natural disasters on urban development in a sample of earthquake. Nat. Hazards 2023, 116, 3839–3855. [Google Scholar] [CrossRef]
- Chai, J.; Wu, H.-Z. Prevention/mitigation of natural disasters in urban areas. Smart Constr. Sustain. Cities 2023, 1, 4. [Google Scholar] [CrossRef]
- García-Ayllón, S.; Tomás, A.; Ródenas, J.L. The spatial perspective in post-earthquake evaluation to improve mitigation strategies: Geostatistical analysis of the seismic damage applied to a real case study. Appl. Sci. 2019, 9, 3182. [Google Scholar] [CrossRef]
- Acharya, T.; Gharekhan, D.; Samal, D. Harnessing ML and GIS for Seismic Vulnerability Assessment and Risk Prioritization. Rev. Int. Géomatique 2024, 33, 111. [Google Scholar] [CrossRef]
- Zhang, J.; Zhang, M.; Li, G. Multi-stage composition of urban resilience and the influence of pre-disaster urban functionality on urban resilience. Nat. Hazards 2021, 107, 447–473. [Google Scholar] [CrossRef]
- Beatini, V.; Rajanayagam, H.; Poologanathan, K. Structural and spatial minimal requirement efficacy of emergency shelters for different emergencies. Buildings 2023, 13, 32. [Google Scholar] [CrossRef]
- Zhang, W.; Wu, J.; Yun, Y. Strategies for increasing tsunami shelter accessibility to enhance hazard risk adaptive capacity in coastal port cities: A study of Nagoya city, Japan. Nat. Hazards Earth Syst. Sci. 2019, 19, 927–940. [Google Scholar] [CrossRef]
- Paunescu, M.; Luca, O.; Stanescu, A.A.; Gaman, F. Digital Mapping and Resilience Indicators, as Pillars of Bucharest’s Seismic Resilience Strategy. Infrastructures 2025, 10, 39. [Google Scholar] [CrossRef]
- Eriskin, L.; Karatas, M. Applying robust optimization to the shelter location–allocation problem: A case study for Istanbul. Ann. Oper. Res. 2024, 339, 1589–1635. [Google Scholar] [CrossRef]
- Twigg, J. The evolution of shelter “self-recovery”: Adapting thinking and practice for post-disaster resilience. J. Br. Acad. 2021, 9, 5–22. [Google Scholar] [CrossRef]
- Okay, N.; Inal, E.; Yücel, G.; Rashem, O.A. Improving Resilience Capacity of the Policies and Planning for Temporary Shelters in Crises and Disasters. In Disaster Risk Reduction for Resilience: Disaster Economic Vulnerability and Recovery Programs; Springer: Berlin/Heidelberg, Germany, 2022; pp. 111–129. [Google Scholar]
- Park, S.; Hong, T.K.; Kim, B.; Lee, J. Role of backbone fault system on earthquake spawning and geohazards in the Seoul metropolitan area. Earth Space Sci. 2023, 10, e2022EA002686. [Google Scholar] [CrossRef]
- Hong, T.K.; Chung, D.; Lee, J.; Park, S.; Kim, B.; Kim, W. Earthquake-spawning faults in the Seoul metropolitan area and their seismic implications. Earth Space Sci. 2021, 8, e2021EA001662. [Google Scholar] [CrossRef]
- Han, J.; Nur, A.S.; Syifa, M.; Ha, M.; Lee, C.-W.; Lee, K.-Y. Improvement of earthquake risk awareness and seismic literacy of Korean citizens through earthquake vulnerability map from the 2017 pohang earthquake, South Korea. Remote Sens. 2021, 13, 1365. [Google Scholar] [CrossRef]
- Li, W.Y.; Paudel, T. Risk perception, policy efficacy, and policy support in earthquake risk management: Empirical insights from South Korea. Prog. Disaster Sci. 2024, 23, 100349. [Google Scholar] [CrossRef]
- Yoo, D.G.; Jung, D.; Kang, D.; Kim, J.H.; Lansey, K. Seismic hazard assessment model for urban water supply networks. J. Water Resour. Plan. Manag. 2016, 142, 04015055. [Google Scholar] [CrossRef]
- Sun, C.-G.; Kim, H.-S.; Chung, C.-K.; Chi, H.-C. Spatial zonations for regional assessment of seismic site effects in the Seoul metropolitan area. Soil Dyn. Earthq. Eng. 2014, 56, 44–56. [Google Scholar] [CrossRef]
- Han, J.; Park, S.; Kim, S.; Son, S.; Lee, S.; Kim, J. Performance of logistic regression and support vector machines for seismic vulnerability assessment and mapping: A case study of the 12 September 2016 ML5. 8 Gyeongju Earthquake, South Korea. Sustainability 2019, 11, 7038. [Google Scholar] [CrossRef]
- Han, J.; Kim, J.; Park, S.; Son, S.; Ryu, M. Seismic vulnerability assessment and mapping of Gyeongju, South Korea using frequency ratio, decision tree, and random forest. Sustainability 2020, 12, 7787. [Google Scholar] [CrossRef]
- Choi, S.; Kim, S.-W.; Choi, E.-K.; Lee, K.-H.; Lee, D.-W. The Hualien Earthquake Triggered Seismic Activity in South Korea. KSCE J. Civ. Eng. 2025, 100440. [Google Scholar] [CrossRef]
- Prasanajit Naik, S.; Shin, H.C.; Jeong, S.H.; Park, K.; Hategekimana, F.; Lee, J.; Kim, Y.S.; Choi, J.H.; Takao, K. Comprehensive Analysis of Late Quaternary Faulting and Earthquake Potential on the Cheongun-Dong Fault, Southeast Korea: Implications for Intraplate Seismic Hazards in a Slow Tectonic Regime. Bull. Seismol. Soc. Am. 2025, 115, 1979–2001. [Google Scholar] [CrossRef]
- Park, M. Seismic anisotropies of the Yugu peridotites (Gyeonggi Massif, South Korea) and their seismic implications in mantle shear zones. Geosci. J. 2024, 28, 453–463. [Google Scholar] [CrossRef]
- Park, S.; Chang, S.-J.; Lee, J.; Chung, D.; Kim, B.; Park, S.; Hong, T.-K. Crustal and uppermost mantle S-velocity structure of the Seoul metropolitan area on the Korean Peninsula from Helmholtz tomography. Tectonophysics 2024, 891, 230518. [Google Scholar] [CrossRef]
- Choi, S.; Kim, S.-W.; Choi, E.-K.; Go, D.-H. Concealed fault in Seoul, capital of the South Korea, estimated by gravity field interpretation. Geophys. J. Int. 2025, 242, ggaf161. [Google Scholar] [CrossRef]
- Lee, Y.; Lee, Y.-G.; Park, D. Geotechnical data based seismic microzonation in Seoul using region-specific and code-based site amplification models. Bull. Earthq. Eng. 2024, 22, 2375–2403. [Google Scholar] [CrossRef]
- Lee, Y.; Yoo, J.-K. High-Resolution Seismic Susceptibility Assessment Integrating Vulnerability and Exposure Indicators: Application to Seoul. Appl. Sci. 2025, 15, 11942. [Google Scholar] [CrossRef]
- Han, S.-W.; Choi, Y.-S. Seismic hazard analysis in low and moderate seismic region-Korean peninsula. Struct. Saf. 2008, 30, 543–558. [Google Scholar] [CrossRef]
- Son, M.; Cho, C.S.; Shin, J.S.; Rhee, H.M.; Sheen, D.H. Spatiotemporal distribution of events during the first three months of the 2016 Gyeongju, Korea, earthquake sequence. Bull. Seismol. Soc. Am. 2018, 108, 210–217. [Google Scholar] [CrossRef]
- Grigoli, F.; Cesca, S.; Rinaldi, A.P.; Manconi, A.; Lopez-Comino, J.A.; Clinton, J.; Westaway, R.; Cauzzi, C.; Dahm, T.; Wiemer, S. The November 2017 M w 5.5 Pohang earthquake: A possible case of induced seismicity in South Korea. Science 2018, 360, 1003–1006. [Google Scholar] [CrossRef]
- Zhang, Z.; Hu, Y.; Lu, W.; Cao, W.; Gao, X. Spatial accessibility analysis and location optimization of emergency shelters in Deyang. Geomat. Nat. Hazards Risk 2023, 14, 2213809. [Google Scholar] [CrossRef]
- Liang, Y.; Xie, Z.; Chen, S.; Xu, Y.; Xin, Z.; Yang, S.; Jian, H.; Wang, Q. Spatial accessibility of urban emergency shelters based on Ga2SFCA and Its improved method: A case study of Kunming, China. J. Urban Plan. Dev. 2023, 149, 05023013. [Google Scholar] [CrossRef]
- Jin, J.G.; Shen, Y.; Hu, H.; Fan, Y.; Yu, M. Optimizing underground shelter location and mass pedestrian evacuation in urban community areas: A case study of Shanghai. Transp. Res. Part A Policy Pract. 2021, 149, 124–138. [Google Scholar] [CrossRef]
- Wang, X.; Guan, M.; Dong, C.; Wang, J.; Fan, Y.; Xin, F.; Lian, G. A multi-indicator evaluation method for spatial distribution of urban emergency shelters. Remote Sens. 2022, 14, 4649. [Google Scholar] [CrossRef]
- Gao, H.; Han, Y.; Zhang, J.; Song, Y.; Zhang, T.; Tang, F.; Sun, S. A Supply–Demand-Driven Framework for Evaluating Service Effectiveness of University Campus Emergency Shelter: Evidence from Central Tianjin Under Earthquake Scenarios. Land 2025, 14, 1411. [Google Scholar] [CrossRef]
- Tago, I.; Konishi, K.; Takimoto, M.; Kambayashi, Y. Providing efficient redundancy to an evacuation support system using remote procedure calls. In Agents and Multi-Agent Systems: Technologies and Applications 2020: KES International Conference, KES-AMSTA 2020, June 2020 Proceedings; Springer: Singapore, 2020; pp. 47–56. [Google Scholar]
- Zhong, G.; Lu, Y.; Chen, W.; Zhai, G. Multi-objective optimization approach of shelter location with maximum equity: An empirical study in Xin Jiekou district of Nanjing, China. Geomat. Nat. Hazards Risk 2023, 14, 2165973. [Google Scholar] [CrossRef]
- Lee, Y.H.; Lee, J.S.; Baek, S.C.; Hong, W.H. Spatial equity with census population data vs. floating population data: The distribution of earthquake evacuation shelters in Daegu, South Korea. Sustainability 2020, 12, 8046. [Google Scholar] [CrossRef]
- Wang, Y.; Xu, Z. A multi-objective location decision making model for emergency shelters giving priority to subjective evaluation of residents. Int. J. Comput. Commun. Control 2022, 17. [Google Scholar] [CrossRef]
- Jiao, H.; Feng, S. Towards resilient cities: Optimizing shelter site selection and disaster prevention life circle construction using GIS and supply-demand considerations. Sustainability 2024, 16, 2345. [Google Scholar] [CrossRef]
- Eelagh, M.D.; Abbaspour, R.A. A location-allocation optimization model for post-earthquake emergency shelters using network-based multi-criteria decision-making. Decis. Anal. J. 2024, 10, 100430. [Google Scholar] [CrossRef]
- Anjomshoa, E.; Heravi, G. Pre-disaster planning and preparedness for urban seismic Resilience: Evaluating critical influential factors for temporary shelter site selection. Habitat Int. 2025, 163, 103478. [Google Scholar] [CrossRef]
- Amiran, A.; Behnam, B.; Seyedin, S. AI-Based model for site-selecting earthquake emergency shelters. Sci. Rep. 2024, 14, 29033. [Google Scholar] [CrossRef] [PubMed]
- Joo, Y.-M. Developmentalist smart cities? The cases of Singapore and Seoul. Int. J. Urban Sci. 2023, 27, 164–182. [Google Scholar] [CrossRef]
- Kim, N.-Y.; Chung, J.-B. Disaster resilience of Korean cities using data envelopment analysis. Nat. Hazards Rev. 2024, 25, 04024003. [Google Scholar] [CrossRef]
- Li, C.; Wang, X.; Wu, Z.; Dai, Z.; Yin, J.; Zhang, C. An improved method for urban built-up area extraction supported by multi-source data. Sustainability 2021, 13, 5042. [Google Scholar] [CrossRef]
- Yao, Y.; Zhang, Y.; Yao, T.; Wong, K.; Tsou, J.Y.; Zhang, Y. A GIS-based system for spatial-temporal availability evaluation of the open spaces used as emergency shelters: The case of Victoria, British Columbia, Canada. ISPRS Int. J. Geo-Inf. 2021, 10, 63. [Google Scholar] [CrossRef]
- Zhong, G.; Zhai, G.; Chen, W.; Lin, X.; Zhai, W. Spatial allocation of shelters considering the blockage effect on roads during an earthquake. Nat. Hazards Rev. 2024, 25, 04023050. [Google Scholar] [CrossRef]
- Li, W.; Zhai, G.; Hu, M.; Zhou, S. Perceptions of living environment among the elderly based on an assumed earthquake scenario: Case of Hefei, China. J. Hous. Built Environ. 2023, 38, 2707–2728. [Google Scholar] [CrossRef]
- Hsu, C.-H.; Lee, H.-C.; Liao, K.-M.; Wu, C.C. Proposing a Special Evacuation Mode after a Large-Scale Earthquake in an Aged Society. KSCE J. Civ. Eng. 2025, 100418. [Google Scholar] [CrossRef]
- Tang, B.; Li, Z.; Chen, Y. Spatial suitability evaluation and layout optimization of emergency shelter: A case study in Tianhe District of Guangzhou City. Heliyon 2025, 11, e41122. [Google Scholar] [CrossRef] [PubMed]
- Cetin, M.; Kaya, A.Y.; Elmastas, N.; Adiguzel, F.; Siyavus, A.E.; Kocan, N. Assessment of emergency gathering points and temporary shelter areas for disaster resilience in Elazıg, Turkey. Nat. Hazards 2024, 120, 1925–1949. [Google Scholar] [CrossRef]
- Liu, W.; Xu, H.; Wu, J.; Li, W.; Hu, H. Measuring spatial accessibility to refuge green space after earthquakes: A case study of Nanjing, China. PLoS ONE 2022, 17, e0270035. [Google Scholar] [CrossRef] [PubMed]
- Ding, Z.; Dong, H.; Yang, L.; Xue, N.; He, L.; Yao, X. A study on the emergency shelter spatial accessibility based on the adaptive catchment size 2SFCA method. ISPRS Int. J. Geo-Inf. 2022, 11, 593. [Google Scholar] [CrossRef]
- You, D.; Wang, S.; Wang, F.; Zhou, Y.; Wang, Z.; Wang, Y.; Wang, J.; Xiong, Y.; Ji, J. Monitoring and Analyzing the Effectiveness of the Effective Refuge Area of Emergency Shelters by Using Remote Sensing: A Case Study of Beijing’s Fifth Ring Road. Remote Sens. 2023, 15, 3646. [Google Scholar] [CrossRef]
- Zhang, R.; Li, Y.; Li, C.; Chen, T. A complex network approach to quantifying flood resilience in high-density coastal urban areas: A case study of Macau. Int. J. Disaster Risk Reduct. 2025, 119, 105335. [Google Scholar] [CrossRef]
- Lee, J.; Son, M.; Park, D.; Jung, T.; Lee, B.; Kim, H.; Kim, D.; Lim, K.; Park, K.; Kang, H.; et al. Development on Designation and Operation Standard of Earthquake Evacuation Shelter; National Disaster Management Research Institute: Ulsan, Republic of Korea, 2017; p. 178. [Google Scholar]
- Hao, H.; Wang, Y. Disentangling relations between urban form and urban accessibility for resilience to extreme weather and climate events. Landsc. Urban Plan. 2022, 220, 104352. [Google Scholar] [CrossRef]
- Tsai, M.-T.; Chang, H.-W. Contribution of accessibility to urban resilience and evacuation planning using spatial analysis. Int. J. Environ. Res. Public Health 2023, 20, 2913. [Google Scholar] [CrossRef]
- Liu, B.; Wei, R.; Tang, J.; Hong, J.; Lu, Q.; Guo, C.; Wu, H. Human-Centric Disaster Resilience: Uncovering Social Inequity in Climate Change. Risk Anal. 2025, 45, 4704–4725. [Google Scholar] [CrossRef]
- Del Pinto, M.; Chmutina, K.; Palaiologou, F.; Bosher, L. The role of the Spatial Network in Urban Disaster Risk variations: Reimagining the notion of spatial vulnerability at the Urban Scale. Int. J. Disaster Risk Sci. 2024, 15, 303–316. [Google Scholar] [CrossRef]
- Arreeras, S.; Phonsitthangkun, S.; Arreeras, T.; Arimura, M. Spatial Analysis on the Service Coverage of Emergency Facilities for Fire Disaster Risk in an Urban Area Using a Web Scraping Method: A Case Study of Chiang Rai City, Thailand. Urban Sci. 2024, 8, 140. [Google Scholar] [CrossRef]
- Cvetković, V.M.; Tanasić, J.; Renner, R.; Rokvić, V.; Beriša, H. Comprehensive risk analysis of emergency medical response systems in Serbian healthcare: Assessing systemic vulnerabilities in disaster preparedness and response. Healthcare 2024, 12, 1962. [Google Scholar] [CrossRef] [PubMed]
- Moayedfar, S.; Mohebbi, H.; Mozaffaree Pour, N.; Sharifi, A. Developing a localized resilience assessment framework for historical districts: A case study of Yazd, Iran. PLoS ONE 2025, 20, e0317088. [Google Scholar] [CrossRef] [PubMed]
- Chen, W.; Zhai, G.; Ren, C.; Shi, Y.; Zhang, J. Urban resources selection and allocation for emergency shelters: In a multi-hazard environment. Int. J. Environ. Res. Public Health 2018, 15, 1261. [Google Scholar] [CrossRef]
- Chang, J.; Yin, Z.; Zhang, Z.; Xu, X.; Zhao, M. Multi-disaster integrated risk assessment in city range—A case study of jinan, China. Int. J. Environ. Res. Public Health 2023, 20, 3483. [Google Scholar] [CrossRef]
Disclaimer/Publisher’s Note: The statements, opinions and data contained in all publications are solely those of the individual author(s) and contributor(s) and not of MDPI and/or the editor(s). MDPI and/or the editor(s) disclaim responsibility for any injury to people or property resulting from any ideas, methods, instructions or products referred to in the content. |
© 2025 by the authors. Published by MDPI on behalf of the International Society for Photogrammetry and Remote Sensing. Licensee MDPI, Basel, Switzerland. This article is an open access article distributed under the terms and conditions of the Creative Commons Attribution (CC BY) license.