Abstract
Traffic violations, the primary cause of road accidents, threaten public safety by disrupting traffic flow and causing substantial casualties and economic losses. Accurate spatiotemporal prediction of violations offers critical insights for proactive traffic management. While Graph Attention Network (GAT) methods excel in spatiotemporal forecasting, their practical deployment is hindered by prohibitive computational costs when handling dynamic large-scale data. To address this issue, we propose a Lightweight Traffic Violation Prediction with Graph Attention Distillation (LTVPGA) model, transferring spatial topology comprehension from a complex GAT to an efficient multilayer perceptron (MLP) via knowledge distillation. Our core contribution lies in topology-invariant knowledge transfer, where spatial relation priors distilled from the teacher’s attention heads enable the MLP student to bypass explicit graph computation. This approach achieves significant efficiency gains for large-scale data—notably accelerated inference time and reduced memory overhead—while preserving modeling capability. We conducted a performance comparison between LTVPGA, Conv-LSTM, and GATR (teacher model). LTVPGA achieved revolutionary efficiency: consuming merely 15% memory and 0.6% training time of GATR while preserving nearly the same accuracy. This capacity enables practical deployment without sacrificing fidelity, providing a scalable solution for intelligent transportation governance.
1. Introduction
Traffic violations, which severely disrupt traffic order and road safety, are considered the primary cause of catastrophic traffic accidents [1], leading to significant casualties and economic losses. Consequently, accurately predicting traffic violations has emerged as a cornerstone of proactive traffic governance, enabling targeted deployment of law enforcement and dynamic policy calibration [2].
Early research on traffic violation prediction primarily used statistical methods, quantifying transportation system risk factors to build predictive models. These efforts encompassed clustering [3], regression [4], frequent pattern trees [5], and non-negative matrix factorization [6]. In recent years, deep learning approaches have gained prominence in spatiotemporal violation forecasting. Methods involving backpropagation (BP) [7] and soft attention-based recurrent neural networks (RNNs) [8] have been used to model nonlinear interactions. To address the spatiotemporal nature of traffic violations, researchers have employed Convolutional Neural Networks (CNNs) and Long Short-Term Memory (LSTM) networks for prediction [9]. CNNs capture the regional spatial dependencies of violations [10]. LSTMs model temporal patterns by learning to recognize the inherent time-series characteristics of violations [11,12]. However, as violations exhibit both spatial and temporal correlations, single-scale modeling cannot comprehensively represent these intertwined features. The Convolutional LSTM (Conv-LSTM) framework integrates multi-source features to perform joint spatiotemporal forecasting [13,14].
CNNs rely on globally shared kernels, which require input data to exhibit translation invariance and are thus limited to Euclidean space for feature extraction [15]. However, real-world scenarios often involve non-Euclidean data structures (e.g., road networks), and CNNs fail to capture complex topological relationships. Graph neural networks (GNNs) have emerged as powerful deep learning frameworks for processing graph-structured data [16] and can effectively model local spatial correlations and multi-scale dependencies in non-grid data [17].
Graph Convolutional Networks (GCNs) effectively capture complex relationships and dependencies in graph-structured data, demonstrating superior performance in handling graphs with extensive nodes and edges [18]. This architecture has gained prominence in traffic prediction tasks [19,20]. Spatiotemporal Graph Convolutional Networks (STGCNs) were designed to tackle the time-series prediction problem in the traffic domain [15]. Dynamic factors influencing traffic accidents endow road networks with dynamic spatiotemporal dependencies, often resulting in biased prediction outcomes. Wu et al. proposed a Multi-Attention Dynamic Graph Convolution Network integrated with cost-sensitive learning to model the dynamic spatial correlations between roads [21]. Liu et al. captured dynamic traffic correlations and represented them as low-dimensional embeddings [22]. As an enhanced variant of a GCN, a Graph Attention Network (GAT) integrates attention mechanisms to dynamically adjust the weights of neighboring nodes, enabling adaptive aggregation of spatial features [23]. However, in most studies, study areas are partitioned into uniform spatial grids of equal distance, so the spatial constraints of traffic violations occurring on road networks are not preserved. To address this issue, researchers have employed road networks as the structural carrier for traffic violations [24], utilizing graph structures to refine spatial distribution modeling. By incorporating multihead attention mechanisms within a GNN framework, a GATR (Graph Attention Network Based on Road Network) [25] enhances the accuracy of spatiotemporal violation prediction.
GCNs achieve feature propagation through the multiplication of a graph’s Laplacian matrix and the node feature matrix, a process involving dense matrix computations that increase memory bandwidth demand [26]. Urban road networks constantly evolve, with traffic violation patterns shifting daily. This causes significant accuracy degradation in static models over time, necessitating frequent retraining—a process severely challenged by large-scale, dynamic big data. Conventional GATs models falter here due to excessive memory demands and protracted training cycles. The methods used to accelerate the training of neural networks include model pruning, parameter quantization, and transfer learning. Model pruning discards insignificant parameters in graph neural networks, reducing the number of parameters and accelerating model training [27]. Parameter quantization reduces the storage space occupied by parameters through quantizing various parameters in GNNs, thereby lowering model complexity and improving training speed. Although model pruning and quantization can reduce resource consumption and accelerate training to some extent, they cannot address the fundamental challenges related to the high resource overhead and slow training speed of GNNs, as the complex dependencies within graphs persist. GATs introduce dynamic weight calculations via attention mechanisms, imposing higher requirements on GPU parallel logic and video memory management [23]. Transfer learning migrates pre-learned graph structures from GNNs to simpler models, eliminating the need for complex relational reasoning inherent in graph structures [28]. Knowledge distillation (KD) enables GCN-based recommenders to balance performance and efficiency by training a compact student model to inherit knowledge from a complex teacher [29], thereby overcoming computational limitations while maintaining remarkable recommendation accuracy [30]. Existing methods exhibit distinct emphases: G-CRD [31] employs local structure preservation by matching the local structural relationships of node embeddings between teacher and student models. However, real-world graphs often contain latent interactions and noisy edges, where the degree of global topology preservation significantly impacts model performance. GLNN [32] proposes a KD framework that eliminates the need for graph structure during inference. It utilizes soft label distillation to transfer knowledge to a multilayer perceptron (MLP) student model, significantly accelerating inference speed. Graph-MLP [33], conversely, captures graph structural information by designing a neighbor contrastive loss, while simultaneously extracting discriminative node features via a classification loss, achieving a model that is both efficient for inference and high-performing. To enable efficient traffic predictions, Izadi et al. leverage spatial–temporal correlations from a teacher network, allowing the student model to learn complex patterns, and use a cost function to calculate pruning scores, jointly fine-tuning the network from each pruning stage using KD [34].
Although Graph Attention Network-based models such as GATR have demonstrated promising performance in traffic violation prediction [25], their prohibitive computational costs—stemming from structural complexity, intensive resource consumption, and prolonged training duration—hinder practical deployment. The large-scale and dynamically evolving nature of traffic violation and associated factor data exacerbates this limitation, ultimately rendering these models incapable of adapting to scenario reasoning or effective model updates in this context. To overcome these constraints, in this study, we introduce knowledge distillation to transfer complex inter-node relationships from the GATR framework to an MLP network, constructing a Lightweight Traffic Violation Prediction with Graph Attention Distillation (LTVPGA) model. This approach maintains high prediction fidelity while achieving accelerated training and updating, thereby meeting the demands of dynamically evolving traffic violations and enhancing the model’s operational applicability.
The remainder of this paper is organized as follows: Section 2 presents the study area and data sources, including the spatiotemporal characteristics of the traffic violation data and the road network and environmental factor datasets. Section 3 introduces our lightweight framework, where a novel knowledge-distillation-driven retraining mechanism is used to compress computational overhead while preserving accuracy. Section 4 describes how we validated our methodology through comparative experiments involving dynamic urban scenarios. Section 5 discusses practical implications and limitations. Finally, Section 6 concludes this study, providing research contributions and future extensions toward edge-computing applications.
2. Research Area and Materials
2.1. Research Area
The research area, City H, is on the north bank of the Qiantang River, encompassing eight towns, four subdistricts, and two provincial-level economic development zones (as shown in Figure 1). It spans 863 km2 and houses a permanent population of 1.107 million. City H has a northern subtropical monsoon climate with distinct seasons and synchronous rain–heat patterns: warm seasons bring moderate temperatures and abundant precipitation, while cold seasons are characterized by dry, chilly conditions with reduced rainfall.
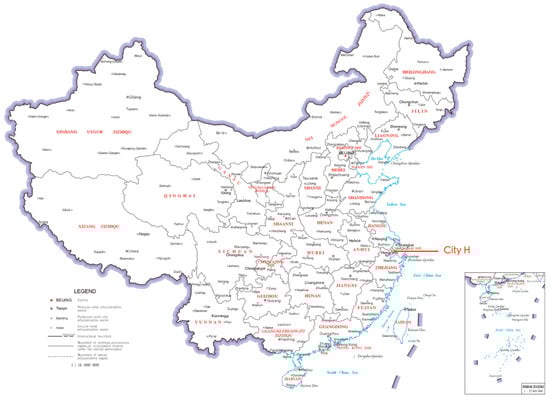
Figure 1.
The location of City H in China.
City H boasts robust economic vitality, registering a GDP of CNY 139.716 billion in 2024 and ranking 16th among China’s top 100 county-level economies. There is dynamic transportation activity in the city, featuring a road-dominated multimodal network leveraging its strategic position in the Shanghai–Hangzhou Economic Corridor. This system integrates major urban centers such as Hangzhou and Shanghai. In 2024, the volume of freight exceeded 29 million tons, and passenger trips surpassed 3.4 million. The number of private vehicles owned reached 362,500 (with 89.4% of the cars in the area being privately owned), equivalent to over 500 cars per 1000 residents. This heavy reliance on private cars strains the region’s road infrastructure, increasing the risk of road violations.
2.2. Data Sources and Preprocessing
High-quality multi-source data served as the foundation for our construction of spatiotemporal violation prediction models. We integrated datasets spanning traffic violations, road network topology, and environmental factors (e.g., weather and POI distributions) to support model training and evaluation. Critically, feature engineering was employed to transform these raw inputs into predictive representations aligned with graph-based learning paradigms. Traffic violation features encapsulate influential factors governing occurrence patterns. Systematically characterizing these features revealed violation mechanisms and enabled spatiotemporal forecasting.
- (1)
- Road Network Graph
As the spatial substrate for traffic violations and environmental factor integration, the road network constitutes the topological foundation of our graph structure. The dataset—sourced from OpenStreetMap—covers all road hierarchies in City H, classified into eight types: highways, national roads (G-series), provincial roads (S-series), primary roads, secondary roads, county roads, village roads, and others.
- (1)
- Preprocessing Pipeline:
- Segmentation: Following traffic safety guidelines, we partitioned the network into 500 m long fundamental units, converting 8550 raw segments into 12,580 spatial units.
- Graph Construction: These units form nodes, with edges connecting spatially adjacent units.
- Adjacency Representation: The graph was encoded as a symmetric adjacency matrix of the order [N, N] (N = 12,580), where entry denotes connectivity (Figure 2 provides an example of an 11-node subgraph).
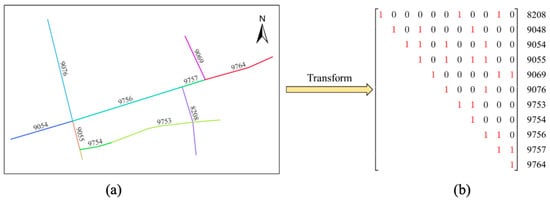 Figure 2. Traffic road graph and adjacency matrix: (a) an example of a sub-road graph. Lines in different colors denote different road segments; (b) the adjacency matrix transformed from (a).
- (2)
- Feature Engineering:
- Road Classification: This serves as a composite proxy for lane count, speed limits, and traffic volume.
- Intersection Presence: This identifies elevated violation risks from conflict points and operational complexity.
- These topological features directly modulate the graph attention mechanisms in our model.
- (2)
- Traffic Violation Dataset
The traffic violation data utilized in this study comprises law enforcement records spanning from 1 January 2016 to 31 December 2020. The dataset contains 2,422,311 violation records. Each record has only two attributes employed for this analysis, including the type of violation (e.g., speeding and illegal parking) and location (textual address descriptions). No personal identifiers or sensitive information was retained, and only anonymized spatial–temporal features were used in all the analyses.
The locations in traffic violation records are textual descriptions and cannot be directly projected onto road networks for analysis. We employed the forward geocoding API from the Amap Open Platform API (https://lbs.amap.com/ (accessed on 11 June 2022)) to convert address information into geographic coordinates (latitude and longitude). Records that failed geocoding or fell outside the study area were excluded, resulting in a final dataset of 1,950,405 validated entries. Their spatial distribution is visualized in Figure 3.
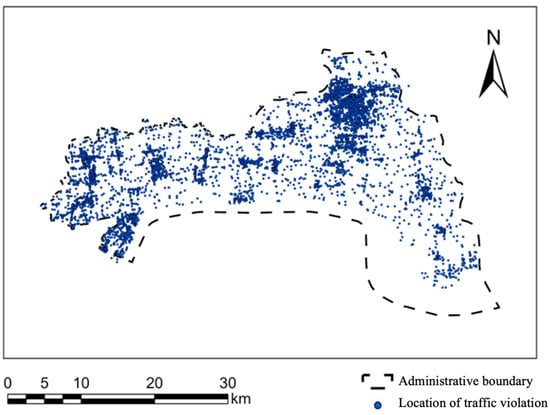
Figure 3.
The spatial distribution of traffic violations.
Temporal analysis of traffic violation data revealed distinct patterns across scales: Over the long term (2016–2020), the data exhibit temporal stationarity with consistent statistical characteristics and continuity, enabling reliable prediction of future violation volumes through learned historical patterns. Conversely, the short-term data (1–2 weeks) display non-stationarity characterized by cyclical and trending behaviors. The high correlation coefficients between randomly sampled biweekly periods indicate consistent developmental patterns and pronounced weekly periodicity. Autocorrelation analysis further confirmed the strong short-term dependencies, where violation counts at any time t correlate significantly with preceding observations, supporting prediction from prior data. The peak autocorrelation at lag-7 (ρ = 0.82) establishes a dominant 7-day cycle, leading to the adoption of a 7-day prediction horizon in our framework, using historical behavioral features from the preceding six days to forecast day-seven violations.
- (3)
- Historical Meteorological Dataset
Meteorological conditions significantly impact vehicle performance and driving behavior, constituting critical external factors for traffic systems. We selected temperature and weather as key meteorological features for traffic violation analysis. The historical meteorological records cover daily observations from 1 January 2016 to 31 December 2020, including temperature and weather conditions (sunny/cloudy/rainy/snowy). The data were sourced from http://lishi.tianqi.com/ (accessed on 23 May 2022).
- (4)
- Historical Calendar Dataset
Analysis reveals there are significantly higher violation volumes on Friday–Sunday than on weekdays, indicating strong weekly patterns. Seasonal impacts mirror weather effects: summer heat induces driver fatigue and distraction, while the winter brings snow/fog, reducing visibility and road traction, resulting in distinct seasonal violation distributions. Holidays further elevate violation risks via increased traffic volume and frequent speeding/drunk driving incidents. Temporal context attributes were extracted from daily calendar entries spanning 2016–2020. They are day-of-the-week-encoded (Monday–Sunday), with holiday flags. The data were sourced from https://wannianrili.bmcx.com/ (accessed on 23 May 2022). We selected day-of-the-week, season, and holiday status as date-related features for traffic violations.
- (5)
- Point-of-Interest Dataset
As forms of social behavior, traffic violations are profoundly influenced by societal factors. This study incorporates urban functional characteristics as representative social features into the traffic violation feature set. Urban functional zones—areas dedicated to specific purposes—shape residents’ travel patterns and induce distinct spatiotemporal traffic flows between zones. Analyzing these functional contexts elucidates spatiotemporal violation patterns and enhances predictive accuracy.
Point-of-Interest (POI) distributions reflect urban functionality. We classified POIs into six types: residential, public amenities, commercial services, industrial, transportation facilities, and green spaces/squares. There are 63,009 georeferenced POIs across City H, all of which were acquired via the Amap API (https://lbs.amap.com/ (accessed on 6 June 2022)). The research area was partitioned into 128 × 128 m grids, with each grid’s functional type determined by TF-IDF-weighted POI dominance. Seven functional zones were identified: residential, public service, commercial, industrial, transportation, green space, and mixed-use areas.
3. Methods
While GAT-based models deliver higher performance in capturing spatiotemporal dependencies, their quadratic complexity and static graph assumptions hinder their deployment in real-world traffic violation prediction, where rapid road network evolution and sub-second inference demands necessitate lightweight, adaptive solutions. To bridge this gap, we employed KD to construct a lightweight yet adaptive graph architecture.
3.1. Knowledge Distillation
KD can be regarded as a specific form of transfer learning [28]. It extracts knowledge from a high-performance, well-generalized complex model (termed the teacher) to guide the learning of a compact model (termed the student). The trained student model achieves performance comparable to that of the teacher while also requiring significantly fewer parameters, thereby compressing the original model, reducing training resource demands, and accelerating training speed [30].
The KD framework operates via a teacher–student paradigm comprising two components [35], as shown in Figure 4. The teacher model serves as an unrestricted knowledge source—without constraints on architecture, parameter scale, or model type—that outputs logits processed by a softmax layer to generate label probability distributions [30]. The student model, a lightweight knowledge receiver with a simplified architecture and reduced parameters, similarly incorporates softmax-processed outputs to generate label probability distributions [36].
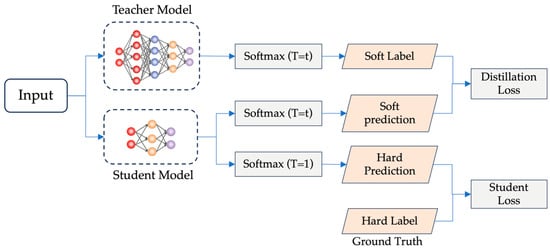
Figure 4.
The generic teacher–student framework for knowledge distillation (modified from [37]).
In KD training, the ground-truth labels serve as hard targets, while the label probability distribution output by the teacher model functions as a soft target. Hard targets only provide maximum-likelihood results, whereas soft targets convey richer information through probabilistic distributions over labels. KD further introduces the temperature parameter (T) into the softmax function, calculated as follows:
Here, denotes the logit value for the class; represents the logit value for the class; and indicates the temperature parameter.
KD enhances information transfer by modulating the temperature parameter. When , the softmax output is identical to a conventional computation. When , the softmax produces a smoothed probability distribution. The information on high-probability classes is relatively suppressed, while information on low-probability classes is amplified. This approach increases the information entropy of the distribution, enabling the student model to learn from non-dominant labels.
The student model learns jointly from hard targets (ground-truth labels) and soft targets (probability distributions from the teacher). The loss function is computed as follows:
In the formula above, denotes the weighting coefficient for the loss computed from the teacher model’s output; represents the weighting coefficient for the loss computed against the ground truth; indicates the output of the teacher model; refers to the ground-truth labels; and signifies the output of the student model.
3.2. LTVPGA Model
3.2.1. Overview of LTVPGA
To address the limitations of the GAT model—specifically its high resource consumption during training and slow inference speed—we propose a joint framework integrating a road-network-constrained Graph Attention Network (GATR [25]) with a multilayer perceptron (MLP), termed the LTVPGA model. Fundamentally, the LTVPGA model operates as an MLP architecture that acquires node relational knowledge from the GATR model through knowledge distillation, thereby eliminating reliance on explicit graph structures. The LTVPGA model exhibits significantly reduced training resource overhead and can be trained much faster, simultaneously achieving traffic violation prediction performance comparable to that of the original GATR model. The overall architecture of LTVPGA is depicted in Figure 5.
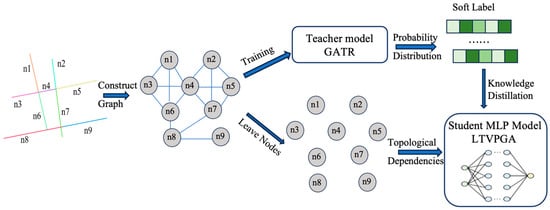
Figure 5.
Overall architecture of LTVPGA.
We constructed a road-constrained spatial graph for traffic violation prediction modeling. As detailed in Section 2.2, the road network is partitioned into fundamental units abstracted as graph nodes. Edges connect nodes representing spatially adjacent units. Traffic violation records are mapped to their nearest road units via k-Nearest Neighbors, with the violation count per unit assigned as node labels.
Critical factors influencing violation occurrence—categorized into historical behavior, road environment, and urban functional features—form the violation feature set. Each node carries a fixed-length feature vector integrating these attributes, ensuring homogeneous representation across the graph.
The attributed graph (features + labels) is fed into the GATR model (the teacher), which employs multihead self-attention to extract multi-perspective features. The mechanism dynamically learns attention weights for edges between nodes and neighbors. After prescribed training cycles, this process yields a trained violation prediction model.
The LTVPGA model processes node features independently from the traffic violation spatial graph, intentionally bypassing explicit edge processing to avoid complex relational computations inherent in graph structures. It retains the original input features of traffic violations, including historical behavior features, road environment characteristics, and urban functional attributes.
During training, LTVPGA utilizes probability distributions output by the teacher model as the soft targets and ground-truth labels as hard targets.
The model optimizes parameters by minimizing a hybrid loss feature combining both targets. This distillation mechanism effectively transfers learned topological dependencies between nodes from the GATR to LTVPGA. Consequently, LTVPGA achieves significant reductions in training resource consumption and accelerates training speed while maintaining prediction accuracy.
3.2.2. LTVPGA Algorithm
The knowledge distillation training procedure comprises four key stages:
Step 1: Teacher Model Initialization
A high-capacity GATR model is pre-trained to capture complex spatiotemporal violation patterns, serving as the knowledge source.
Step 2: High-Temperature Soft-Target Generation
The teacher processes training data at an elevated temperature :
High temperatures amplify implicit spatial relationships (e.g., functionally similar commercial zones across distant road units).
Step 3: Dual-Supervision Student Training
The lightweight student (MLP) learns from complementary targets:
- Soft targets: The teacher’s probabilistic distributions.
- Hard targets: Ground-truth violation labels.
The hybrid loss function combines two parts, as presented in Formula (2).
Step 4: Deployment
The student operates at a standard temperature (T = 1) for sub-second violation risk inference.
The dual-supervision paradigm (Step 3) serves as the methodological foundation, allowing the student model to absorb the teacher model’s spatial intelligence. The LTVPGA model transfers spatial graph knowledge from the GATR framework to a lightweight MLP architecture. During training, LTVPGA spends multiple epochs on the training dataset. In each epoch, the model randomly iterates through all the training data, calculating loss values between the model’s predictions, the true values, and the teacher model’s predictions—these serve as hard loss and soft loss. By comprehensively considering both hard and soft loss, the model updates its parameters through backpropagation. The pseudocode for LTVPGA training is as follows Algorithm 1:
| Algorithm 1 LTVPGA Training |
| 1: Input: 2: Output: 3: function () 4: 5: 6: 7: 8: 9: 10: 11: 12: 13: 14: 15: 16: 17: 18: 19: 20: end function |
4. Experiments and Results
The teacher model, GATR, employs a GAT architecture, which leverages adjacency-matrix-constrained attention mechanisms to dynamically aggregate node features across graph structures, enabling effective spatiotemporal dependency modeling for traffic violation risk prediction. In contrast, the student model adopts a lightweight three-layer MLP design that progressively compresses feature dimensions through two linear transformations interspersed with ReLU activations, ultimately generating one-dimensional regression outputs for efficient deployment in resource-constrained environments.
4.1. Parameter Configuration
The experimental parameter configuration spans four critical dimensions:
- (1)
- Train–test partitioning: Here, the initial 1747 days (≈4.8 years) are allocated for training, and the subsequent 70 days (10 weeks) are reserved for testing to maintain temporal continuity.
- (2)
- Training parameters: More than 95% of the loss reduction occurred during the first 25 epochs, followed by progressive refinement of marginal gains until epoch 40 (Figure 6). Training beyond 40 epochs yields no significant improvement. Thus, 50 epochs are selected as the saturation point where the validation loss plateaus. The temperature hyperparameter T softens the teacher’s output probability distribution, primarily to preserve critical “dark knowledge”. Since the teacher and student models are trained on data from the same source, their predictive distributions exhibit high similarity. We set , as empirically referenced in [36,38], which benefits from “dark knowledge” while suppressing noise from over-smoothing. For deployment, the temperature is reset to to output deterministic predictions.
- (3)
- Distillation Loss: Here, dual-supervision is integrated:
- Soft loss: Kullback–Leibler divergence transfers the teacher’s inductive biases (e.g., feature correlations, uncertainty awareness). We set to prioritize learning from the teacher’s soft targets, which transfer critical “dark knowledge” about class similarities [36], avoiding local optima caused by the student’s limited capacity.
- Hard loss: Cross-entropy anchors predictions to ground-truth labels and mitigates teacher-related overfitting risks. We set to impose minimally sufficient boundary constraints and maximize dark knowledge transfer efficiency. This ratio is a de facto standard in knowledge distillation, whose efficacy has been consistently demonstrated in lightweight models [36,38].
- (4)
- Optimization specification: The Adam optimizer is employed with a fixed learning rate (lr = 0.001) and unit batch size (batch size = 1) to prevent temporal information leakage while preserving topological dependency integrity.

Figure 6.
Loss curve changes with training.
4.2. Evaluation Metrics
We adopted three metrics to quantify LTVPGA’s traffic violation prediction accuracy: RMSE (Root Mean Square Error), MAE (Mean Absolute Error), and MAPE (Mean Absolute Percentage Error).
To address the primary objective of LTVPGA—addressing the high computational overhead and slow training speed of the GATR model—the following efficiency metrics were also evaluated:
- Memory consumption during training (GB);
- Average training time per epoch (s);
- Total training duration (min).
4.3. Results
The traffic violation feature sets of basic road units were fed into LTVPGA, with a pre-trained GATR model serving as the teacher. The key resource metrics under identical experimental conditions are summarized in Table 1.

Table 1.
Training resource consumption and duration.
On the test dataset, LTVPGA achieved an RMSE = 1.7653, an MAE = 0.1492, and an MAPE = 0.32%. As exemplified in Figure 7 (28 November 2020 case study), the predicted values closely align with the ground-truth traffic violation records.
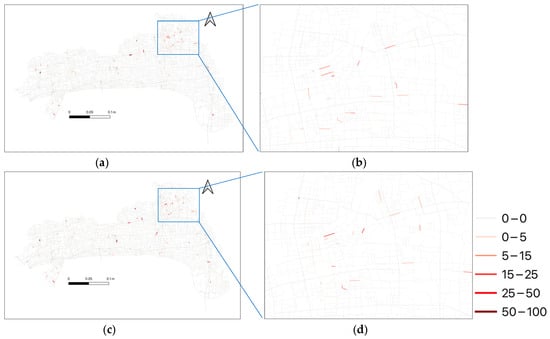
Figure 7.
Comparison between LTVPGA prediction and ground-truth of traffic violation records. (a) is the prediction of LTVPGA; (b) detailed view of the blue box in (a); (c) is the ground truth; (d) detailed view of the blue box in (c).
Compared to the GATR, LTVPGA exhibited marginally lower accuracy (RMSE: 1.7078; MAE: 0.1371; MAPE: 0.29%) but consistently outperformed the Conv-LSTM baseline (RMSE: 1.9815; MAE: 0.1623; MAPE: 0.41%). Comprehensive metric comparisons are provided in Table 2.
Table 2.
Comparison of prediction performance.
LTVPGA exhibited remarkable efficiency gains—reducing memory consumption by 85% and the total training time by 99.4%. Also, there was a performance gap with respect to the GATR. The 5.4% higher MAE (0.1492 vs. 0.1388) and 3.3% increase in MAPE primarily stem from LTVPGA’s inability to explicitly model spatial correlations. In contrast, the GATR model’s graph attention mechanism inherently captures dynamic dependencies in road topology, enabling it to encode intricate spatial interactions between connected road segments. This architectural limitation of LTVPGA becomes most pronounced in complex urban environments, where traffic violation patterns exhibit strong cross-region spillover effects (e.g., congestion cascades between commercial hubs and residential areas).
Notably, LTVPGA’s MAPE of 0.32% is still superior to that of Conv-LSTM by 13.5%, confirming that distilled knowledge from the teacher model (GATR) partially offsets the structural simplicity of the student architecture. In large-scale data scenarios, the GATR model’s high computational costs make its deployment impractical, underscoring the critical significance of the efficiency–accuracy tradeoff.
5. Discussion
Based on the results of the experiments comparing the LTVPGA and GATR models, it can be concluded that the LTVPGA model has significant advantages in terms of training resource utilization and training speed. The LTVPGA model has such significant training advantages because it replaces the GAT network with an MLP network, transforming the processed objects from complex graph structures to independent basic road units. In terms of resource utilization, the memory usage of the LTVPGA model is only 15.08% of that of the GATR model. Since the LTVPGA model is not required to read a large graph adjacency matrix, it occupies fewer resources. In terms of training speed, this model’s average training duration per training cycle is only 2.33% of that of the GATR model, and the total training duration is only 0.58% of that of the GATR model. As the LTVPGA model no longer needs to aggregate nodes in the graph one by one during training, it does not extract features based on complex adjacency relationships, resulting in a significant improvement in training speed.
In terms of predicting traffic violations, the accuracy of the LTVPGA model is slightly lower than that of the GATR model. The LTVPGA model does not directly refer to the spatial correlation of traffic violations; instead, it transfers the generalization ability of the GATR model and implicitly learns to recognize the spatial distribution patterns of traffic violations. Therefore, its predictive performance is inferior to that of the GATR model. The GATR model comprehensively considers the spatial correlations of traffic violations throughout the road network, resulting in improved prediction performance for traffic violations. Therefore, the LTVPGA model’s prediction performance after knowledge transfer is still superior to that of the widely used Conv-LSTM model.
We acknowledge that LTVPGA’s batch-mode retraining paradigm currently limits its practical utility in dynamic traffic scenarios. By relying on scheduled full-model updates rather than streaming data processing, the framework cannot immediately respond to sudden events caused by environmental anomalies. This latency (corresponding to the duration from data collection to model deployment) compromises prediction performance under rapidly evolving conditions, particularly in metropolitan areas where traffic states change within minute-scale intervals.
Moreover, due to the scarcity of traffic violation data, cross-regional generalization experiments were not conducted. In the future, public datasets (such as US_Accidents) can be utilized to build on the Flink stream computing framework for near-real-time traffic prediction.
6. Conclusions
As the primary cause of 90% traffic accidents, violations necessitate precise spatiotemporal forecasting to enable proactive governance. Though GATs-based models improve prediction accuracy by enhancing spatial topology modeling, their resource-intensive training impedes their practical deployment. We propose LTVPGA, a lightweight knowledge distillation framework designed for big data scenarios. It distills spatial correlation knowledge from the GATR model into an MLP student, eliminating complex spatial feature extraction. This achieves significant reductions in training resource consumption and accelerates model convergence. Crucially, LTVPGA achieves a favorable accuracy–efficiency tradeoff, validated on real-world violation datasets; it reduces memory usage by 38% and total training time by 45% compared to GAT baselines while maintaining higher predictive performance than Conv-LSTM models.
Despite its efficiency gains, LTVPGA is hindered by two critical constraints in practical deployment: Firstly, the impact of environmental factors on traffic violations has not been quantitatively assessed or thoroughly examined in our modeling framework. The rationality of representing certain influential elements—such as characterizing social influence solely through urban functional features derived from POI clustering—requires scrutiny. Secondly, batch-mode retraining introduces prediction latency, failing to meet the practical needs of real-time traffic management. Moreover, it has a weak capacity to respond to traffic anomalies caused by emergencies.
To address the limitations identified above, we will focus on two key directions. Firstly, efforts will be made to improve the model’s prediction capability. We will incorporate qualitative error decomposition, analyzing specific conditions under which the model underperforms (e.g., by road topology, time-sensitive contexts, or environmental extremes). This diagnostic approach will substantially improve model robustness. Meanwhile, a more efficient real-time data-streaming processing framework will be developed to enhance the model’s responsiveness to short-term changes, enabling it to provide timely and accurate predictions for traffic management practices, thus offering more effective support for practical traffic regulation.
With the rapid advancement of large-language-model technologies, the capabilities of domain-specific foundation models continue to push boundaries. The large-scale foundation model Aurora comprehensively surpasses traditional forecasting systems in tasks such as predicting air quality, monitoring ocean waves, tracking tropical cyclones, and making high-resolution predictions of weather while significantly reducing computational costs [39]. However, this model relies on training with over a million hours of multi-source geophysical data, and its enormous computational and data requirements far exceed the capacity of most research institutions. Future efforts should explore diverse technical pathways—such as miniaturized model distillation, federated learning frameworks, and government–corporate data collaboration mechanisms—to lower the barriers for intelligent models and strengthen broader practices to optimize living spaces.
Author Contributions
Conceptualization, Yingzhi Wang and Yuquan Zhou; methodology, Yuquan Zhou; resources, Yingzhi Wang; writing—original draft preparation, Yingzhi Wang and Yuquan Zhou; writing—review and editing, Feng Zhang; visualization, Yuquan Zhou; supervision, Feng Zhang; project administration, Feng Zhang; funding acquisition, Feng Zhang. All authors have read and agreed to the published version of the manuscript.
Funding
This research was funded by the National Natural Science Foundation of China (42171412).
Data Availability Statement
The traffic violation dataset was provided by the Public Security Informatization Application Based on Big Data Architecture; the raw data are not available to the public because of privacy protection requirements. Processed feature sets may be accessible for verification purposes upon making a reasonable request. All the supporting datasets are publicly available: historical road networks: OpenHistoricalMap (https://www.openhistoricalmap.org (accessed on 14 November 2022)); meteorological records: Tianqi Historical Weather (http://lishi.tianqi.com (accessed on 23 May 2022)); date attribute annotations: WanNianRiLi Calendar (https://wannianrili.bmcx.com (accessed on 23 May 2022)); POI distributions: AMap API (https://lbs.amap.com/ (accessed on 6 June 2022)).
Acknowledgments
During the preparation of this manuscript, the authors used DeepSeek-V3 for English editing. The authors have reviewed and edited the output and take full responsibility for the content of this publication.
Conflicts of Interest
The authors declare no conflicts of interest.
References
- Wang, F.; Lin, Y.; Ioannou, P.A.; Vlacic, L.; Liu, X.; Eskandarian, A.; Lv, Y.; Na, X.; Cebon, D.; Ma, J.; et al. Transportation 5.0: The DAO to Safe, Secure, and Sustainable Intelligent Transportation Systems. IEEE Trans. Intell. Transp. Syst. 2023, 24, 10262–10278. [Google Scholar] [CrossRef]
- Zhang, G.; Yau, K.K.; Chen, G. Risk factors associated with traffic violations and accident severity in China. Accid. Anal. Prev. 2013, 59, 18–25. [Google Scholar] [CrossRef]
- Anderson, T.K. Kernel density estimation and K-means clustering to profile road accident hotspots. Accid. Anal. Prev. 2009, 41, 359–364. [Google Scholar] [CrossRef]
- Caliendo, C.; Guida, M.; Parisi, A. A crash-prediction model for multilane roads. Accid. Anal. Prev. 2007, 39, 657–670. [Google Scholar] [CrossRef]
- Lin, L.; Wang, Q.; Sadek, A.W. A novel variable selection method based on frequent pattern tree for real-time traffic accident risk prediction. Transp. Res. Part C Emerg. Technol. 2015, 55, 444–459. [Google Scholar] [CrossRef]
- Chen, Q.; Song, X.; Fan, Z.; Xia, T.; Yamada, H.; Shibasaki, R. A context-aware nonnegative matrix factorization framework for traffic accident risk estimation via heterogeneous data. In Proceedings of the 2018 IEEE Conference on Multimedia Information Processing and Retrieval (MIPR), Miami, FL, USA, 10–12 April 2018. [Google Scholar]
- Yu, R.; Liu, X.Q. Study on Traffic Accidents Prediction Model Based on RBF Neural Network. In Proceedings of the International Conference on Information Engineering & Computer Science, Xi’an, China, 22 October 2010. [Google Scholar]
- Zeng, K.H.; Chou, S.H.; Chan, F.H.; Niebles, J.C.; Sun, M. Agent-centric risk assessment: Accident anticipation and risky region localization. In Proceedings of the IEEE Conference on Computer Vision and Pattern Recognition, Hawaii, HI, USA, 21–26 July 2017. [Google Scholar]
- Xiao, T.; Lu, H.; Wang, J.; Wang, K. Predicting and interpreting spatial accidents through MDLSTM. Int. J. Environ. Res. Public Health 2021, 18, 1430. [Google Scholar] [CrossRef]
- Najjar, A.; Kaneko, S.I.; Miyanaga, Y. Combining satellite imagery and open data to map road safety. In Proceedings of the Thirty-First AAAI Conference on Artificial Intelligence, San Francisco, CA, USA, 4–9 February 2017. [Google Scholar]
- Li, P.; Abdel-Aty, M.; Yuan, J. Real-time crash risk prediction on arterials based on LSTM-CNN. Accid. Anal. Prev. 2019, 135, 105371. [Google Scholar] [CrossRef]
- Li, W.S.; Zou, T.T.; Wang, H.Y.; Huang, H. Traffic accident quantity prediction model based on dual-scale long short-term memory network. J. Zhejiang Univ. (Eng. Sci.) 2020, 54, 1613–1619. [Google Scholar]
- Yuan, Z.; Zhou, X.; Yang, T. Hetero-convlstm: A deep learning approach to traffic accident prediction on heterogeneous spatio-temporal data. In Proceedings of the 24th ACM SIGKDD International Conference on Knowledge Discovery & Data Mining, New York, NY, USA, 19–23 August 2018. [Google Scholar]
- Liu, Y.; Zheng, H.; Feng, X.; Chen, Z. Short-term traffic flow prediction with Conv-LSTM. In Proceedings of the 2017 9th International Conference on Wireless Communications and Signal Processing (WCSP), Nanjing, China, 11–13 October 2017. [Google Scholar]
- Yu, B.; Yin, H.; Zhu, Z. Spatio-temporal graph convolutional networks: A deep learning framework for traffic forecasting. In Proceedings of the 27th International Joint Conference on Artificial Intelligence (IJCAI), Stockholm, Sweden, 13–19 July 2018. [Google Scholar]
- Lecun, Y.; Bottou, L.; Bengio, Y.; Haffner, P. Gradient-based learning applied to document recognition. Proc. IEEE 1998, 86, 2278–2324. [Google Scholar] [CrossRef]
- Li, M.; Zhu, Z. Spatial-Temporal Fusion Graph Neural Networks for Traffic Flow Forecasting. AAAI Tech. Track Data Min. Knowl. Manag. 2021, 35, 4189–4196. [Google Scholar] [CrossRef]
- Zhao, L.; Song, Y.; Zhang, C.; Liu, Y.; Wang, P.; Lin, T.; Deng, M.; Li, H. T-GCN: A Temporal Graph Convolutional. Network for Traffic Prediction. IEEE Trans. Intell. Transp. Syst. 2020, 21, 3848–3858. [Google Scholar] [CrossRef]
- Sheng, Z.; Xu, Y.; Xue, S.; Li, D. Graph-based spatial-temporal convolutional network for vehicle trajectory prediction in autonomous driving. IEEE Trans. Intell. Transp. Syst. 2023, 23, 17654–17665. [Google Scholar] [CrossRef]
- Chen, B.; Ma, Y.; Wang, J.; Jia, T.; Liu, X.; Lam, W.H.K. Graph convolutional networks with learnable spatial weightings for traffic forecasting applications. Transp. A Transp. Sci. 2025, 21, 2239377. [Google Scholar] [CrossRef]
- Wu, M.; Jia, H.; Luo, D.; Luo, H.; Zhao, F.; Li, G. A multi-attention dynamic graph convolution network with cost-sensitive learning approach to road-level and minute-level traffic accident prediction. IET Intell. Transp. Syst. 2023, 17, 270–284. [Google Scholar] [CrossRef]
- Liu, Z.; Chen, Y.; Xia, F.; Bian, J.; Zhu, B.; Shen, G.; Kong, X. TAP: Traffic Accident Profiling via Multi-Task Spatio-Temporal Graph Representation Learning. ACM Trans. Knowl. Discov. Data 2023, 17, 1–25. [Google Scholar] [CrossRef]
- Veličković, P.; Cucurull, G.; Casanova, A.; Romero, A.; Liò, P.; Bengio, Y. Graph attention networks. In Proceedings of the 6th International Conference on Learning Representations (ICLR), Vancouver, BC, Canada, 30 April–3 May 2018. [Google Scholar]
- Bai, J.; Zhu, J.; Song, Y.; Zhao, L.; Hou, Z.; Du, R.; Li, H. A3T-GCN: Attention Temporal Graph Convolutional Network for Traffic Forecasting. ISPRS Int. J. Geo-Inf. 2021, 10, 485. [Google Scholar] [CrossRef]
- Zhou, Y.; Wang, Y.; Zhang, F.; Zhou, H.; Sun, K.; Yu, Y. GATR: A Road Network Traffic Violation Prediction Method Based on Graph Attention Network. Int. J. Environ. Res. Public Health 2023, 20, 3432. [Google Scholar] [CrossRef]
- Qin, J.; Wang, Q.; Tao, T. Structural reinforcement-based graph convolutional networks. Connect. Sci. 2022, 34, 2807–2821. [Google Scholar] [CrossRef]
- You, J.; Ying, Z.; Leskovec, J. Optimizing memory efficiency for graph convolutional networks on edge computing platforms. In Proceedings of the 2021 IEEE International Symposium on High-Performance Computer Architecture (HPCA), Seoul, Republic of Korea, 27 February–3 March 2021. [Google Scholar]
- Pan, S.J.; Yang, Q. A survey on transfer learning. IEEE Trans. Knowl. Data Eng. 2010, 22, 1345–1359. [Google Scholar] [CrossRef]
- Wang, J.; Gao, M.; Zhai, W.; Rida, I.; Zhu, X.; Li, Q. Knowledge Generation and Distillation for Road Segmentation in Intelligent Transportation Systems. IEEE Trans. Intell. Transp. Syst. 2025, 6, 1–13. [Google Scholar] [CrossRef]
- Yi, P.; Li, Z.X.; Chen, L.; Yang, C.; Cai, X. Prune and Distill: A Novel Knowledge Distillation Method for GCNs-Based Recommender Systems. IEEE Access 2025, 13, 92365–92375. [Google Scholar] [CrossRef]
- Joshi, C.; Liu, F.; Xun, X.; Lin, J.; Sheng, C. On Representation Knowledge Distillation for Graph Neural Networks. arXiv 2021, arXiv:2111.04964. [Google Scholar] [CrossRef]
- Zhang, S.; Liu, Y.; Sun, Y.; Shah, N. Graph-less neural networks: Teaching old mlps new tricks via distillation. In Proceedings of the Tenth International Conference on Learning Representations, Virtual Event, 25–29 April 2022. [Google Scholar]
- Hu, Y.; You, H.; Wang, Z.; Zhou, E.; Gao, Y. Graph-MLP: Node classification without message passing in graph. arXiv 2021, arXiv:2106.04051. [Google Scholar] [CrossRef]
- Izadi, M.; Safayani, M.; Mirzaei, A. Knowledge Distillation on Spatial-Temporal Graph Convolutional Network for Traffic Prediction. arXiv 2024, arXiv:2401.11798. [Google Scholar] [CrossRef]
- Franco, M.N.; Cosimo, R.; Salvatore, T.; Rossano, V. Distilled Neural Networks for Efficient Learning to Rank. IEEE Trans. Knowl. Data Eng. 2023, 35, 4695–4712. [Google Scholar]
- Gou, J.; Yu, B.; Maybank, S.; Tao, D. Knowledge Distillation: A Survey. Int. J. Comput. Vis. 2021, 129, 1789–1819. [Google Scholar] [CrossRef]
- Hinton, G.; Vinyals, O.; Dean, J. Distilling the Knowledge in a Neural Network. arXiv 2015, arXiv:1503.02531. [Google Scholar] [CrossRef]
- Hugo, T.; Matthieu, C.; Matthijs, D.; Francisco, M.; Alexandre, S.; Hervé, J. Training data-efficient image transformers & distillation through attention. arXiv 2021, arXiv:2012.12877. [Google Scholar] [CrossRef]
- Bodnar, C.; Bruinsma, W.P.; Lucic, A.; Stanley, M.; Allen, A.; Brandstetter, J.; Garvan, P.; Riechert, M.; Weyn, J.A.; Dong, H.; et al. A foundation model for the Earth system. Nature 2025, 641, 1180–1187. [Google Scholar] [CrossRef]
Disclaimer/Publisher’s Note: The statements, opinions and data contained in all publications are solely those of the individual author(s) and contributor(s) and not of MDPI and/or the editor(s). MDPI and/or the editor(s) disclaim responsibility for any injury to people or property resulting from any ideas, methods, instructions or products referred to in the content. |
© 2025 by the authors. Published by MDPI on behalf of the International Society for Photogrammetry and Remote Sensing. Licensee MDPI, Basel, Switzerland. This article is an open access article distributed under the terms and conditions of the Creative Commons Attribution (CC BY) license (https://creativecommons.org/licenses/by/4.0/).