Abstract
Wildfire risk assessment requires integrating heterogeneous geospatial data to capture complex environmental dynamics. This study develops a hierarchical multimodal fusion framework combining high-resolution aerial imagery, historical fire data, topography, meteorology, and vegetation indices within Google Earth Engine. We introduce three progressive fusion levels: a single-modality baseline (NAIP-WHP), fixed-weight fusion (FIXED), and a novel geographically adaptive dynamic-weight approach (FUSED) that adjusts feature contributions based on regional characteristics like human activity intensity or aridity. Machine learning benchmarking across 49 U.S. regions reveals that Support Vector Machines (SVM) applied to the FUSED dataset achieve optimal performance, with an AUC-ROC of 92.1%, accuracy of 83.3%, and inference speed of 1.238 milliseconds per sample. This significantly outperforms the fixed-weight fusion approach, which achieved an AUC-ROC of 78.2%, and the single-modality baseline, which achieved 73.8%, representing relative improvements of 17.8% and 24.8%, respectively. The 10 m resolution risk heatmaps demonstrate operational viability, achieving an 86.27% hit rate in Carlsbad Caverns, NM. SHAP-based interpretability analysis reveals terrain dominance and context-dependent vegetation effects, aligning with wildfire ecology principles.
1. Introduction
Globally, the escalating frequency and intensity of wildfires have reached alarming levels, as exemplified by the unprecedented 2023 Canadian wildfire season [1]. This disaster burned over 15 million hectares of land, marking the largest area affected since Canada began comprehensive national reporting in 1972 [2]. The catastrophic event blanketed eastern North America in hazardous smoke for months. Modern wildfire behavior increasingly deviates from historical patterns. Between 2003 and 2023, the frequency and intensity of extreme wildfires more than doubled, with the six most severe years all occurring after 2017 [3]. Research indicates that from 2003 to 2019, climate change drove a sustained annual increase of 0.22% in global wildfire-related losses, contributing to a 15.8% expansion in burned areas worldwide during this period [4].
The evolution of wildfire prediction methods has progressed through distinct phases, each overcoming its predecessors’ limitations while introducing new challenges. Early warning systems in the late 20th century relied primarily on meteorological indices such as the Canadian Fire Weather Index [3,5], which achieved modest success in boreal forests but proved inadequate for Mediterranean ecosystems due to their neglect of critical fuel-mediated dynamics.
The field has progressively moved towards multimodal data fusion to address the inherent complexity of wildfire risk. Benchmark datasets like FireRisk [6] have standardized the integration of multi-source satellite imagery (Sentinel-1/2), topography (SRTM), and meteorological reanalysis (ERA5-Land), providing valuable resources for model development. Similarly, studies have demonstrated the value of combining spectral, topographic, and thermal features with resampling algorithms to improve prediction accuracy [7], while others have successfully incorporated remotely sensed fuel variables into national-scale fire danger assessment [8]. However, these approaches typically employ static integration schemes that apply uniform weighting strategies across heterogeneous landscapes. This fundamental limitation becomes apparent in regions like the Greater Yellowstone ecosystem, where fire–climate feedback is driving non-linear forest changes [9], or in Mediterranean climates where fuel moisture dynamics exhibit strong seasonal variability [10]. The inability of static models to adaptively prioritize the most relevant risk factors in different geographical contexts—such as topographic complexity in mountainous terrain versus vegetation moisture in arid shrublands—represents a critical shortcoming in current wildfire risk assessment paradigms.
To address these limitations, this study introduces FireRisk-Multi, a dynamic multimodal fusion framework for high-precision wildfire risk assessment. Our framework integrates four critical data dimensions: high-resolution NAIP imagery [11] for spatial patterns, SRTM elevation and slope data [12] for terrain analysis, ERA5 temperature and precipitation records [13] for meteorological conditions, and MODIS NDVI vegetation indices [14] for ecological monitoring. The core innovation of our approach is a geographically adaptive weighting mechanism that dynamically adjusts the influence of terrain, vegetation, and meteorological factors based on localized landscape characteristics. This enables our model to automatically amplify slope-related weights in rugged terrain while suppressing vegetation signals in industrial zones, effectively addressing the spatial heterogeneity of wildfire drivers.
The principal contributions of this work are threefold. First, we propose a novel hierarchical fusion framework that progresses from unimodal baseline to adaptive multimodal integration, systematically demonstrating the value added by each data modality through rigorous ablation studies. Second, we introduce a transparent, geographically aware dynamic weighting mechanism that addresses the fundamental limitation of static fusion approaches by contextually adjusting factor contributions based on real-time geospatial conditions. Third, we provide comprehensive interpretability analysis through SHAP value decomposition, bridging the critical gap between model performance and practical utility for wildfire management by quantifying feature influences and revealing context-dependent ecological relationships.
Our framework was validated across 49 distinct ecoregions in the United States using real fire incidents, achieving an AUC-ROC of 92.1% with SVM modeling—representing relative improvements of 17.8% and 24.8% over fixed-weight and single-modality baselines, respectively. The subsequent sections detail this work: Section 2 presents related work on wildfire risk assessment; Section 3 describes the methodology including study area selection, multi-source data compilation, and the hierarchical fusion framework; Section 4 provides results with comparative analysis, SHAP interpretation, and real-fire validation; Section 5 discusses implications and limitations; and Section 6 concludes with key findings and future directions.
2. Related Work
Wildfire risk assessment has evolved significantly, driven by advancements in remote sensing, data availability, and computational methods. Early approaches were predominantly reliant on expert-driven physical models and meteorological indices. Seminal systems such as the Canadian Fire Weather Index (FWI) demonstrated considerable utility in boreal forests by integrating weather observations to estimate fire potential [15,16]. However, their applicability was often limited in ecosystems where fuel characteristics and human activities played a more decisive role than weather alone, revealing a fundamental gap in capturing the full complexity of wildfire drivers.
The advent of the machine learning era marked a paradigm shift, enabling data-driven predictions at unprecedented scales. Researchers began leveraging satellite-derived data and algorithms like Random Forest and Support Vector Machines to model fire occurrence and burned areas [17,18]. These models excelled at identifying correlations between fire events and static or dynamic environmental variables, such as vegetation indices, topographic features, and climatic conditions. A subsequent wave of studies incorporated deep learning architectures, including Convolutional Neural Networks (CNNs) and Recurrent Neural Networks (RNNs), to exploit spatial and temporal patterns in satellite imagery and time-series data, further pushing the boundaries of predictive accuracy for continental-scale applications [19,20].
Recognizing that no single data source can fully characterize wildfire risk, the field has progressively moved towards multimodal data fusion. The core challenge therefore lies in effectively integrating heterogeneous data sources—such as optical imagery, topographic data, meteorological time series, and vegetation indices—into a cohesive analytical framework. This trend is exemplified by recent works such as that of Alipour et al., who proposed a deep learning framework for large-scale wildfire surface fuel mapping by fusing lidar, satellite imagery, and other multimodal data [21]. Similarly, Yang et al. developed a multi-scale deep learning algorithm to enhance forest fire danger prediction by fusing features from remote sensing images [22].
However, a prevalent challenge in many fusion approaches, including those that rely on deep learning as a black box, is the lack of an explicit mechanism to account for spatial and contextual variability in environmental drivers. Many methods, even sophisticated ones, can be limited by static or implicit fusion schemes that apply a uniform integration strategy across diverse landscapes. For instance, a model might consistently overemphasize vegetation metrics in urban interfaces where anthropogenic factors dominate, or underweight fine-scale topographic variation in complex mountainous terrain, thereby overlooking critical geospatial nuances that dictate local fire behavior.
Our work, FireRisk-Multi, is situated at the intersection of these research trajectories. It builds upon the established value of multimodal data fusion but moves beyond existing paradigms by introducing an explicit, geographically adaptive dynamic-weighting framework. In contrast to static fusion methods, our model dynamically recalibrates the influence of terrain, meteorological, and vegetation modalities based on real-time analysis of local geographic characteristics derived from high-resolution imagery. Furthermore, unlike purely end-to-end deep learning models whose fusion logic can be opaque, our framework employs SHAP analysis to provide post-hoc interpretability, quantifying the contribution of each feature to the final risk assessment. Therefore, the principal contributions of this study are threefold: (1) a novel hierarchical fusion framework that progresses from unimodal baseline to adaptive multimodal integration; (2) a transparent, geographically-aware dynamic weighting mechanism that addresses the shortcomings of static fusion; and (3) a comprehensive interpretability analysis that bridges the gap between model performance and practical utility for wildfire management.
3. Methodology
3.1. Overall Framework of FireRisk-Multi
The FireRisk-Multi framework is designed as a hierarchical, multimodal fusion system for high-precision wildfire risk assessment. Its core innovation lies in a geographically adaptive dynamic-weighting mechanism that intelligently integrates heterogeneous geospatial data. As illustrated in Figure 1, the framework operates through three progressive levels of data integration, each addressing limitations of the previous one, followed by a comprehensive model benchmarking phase.
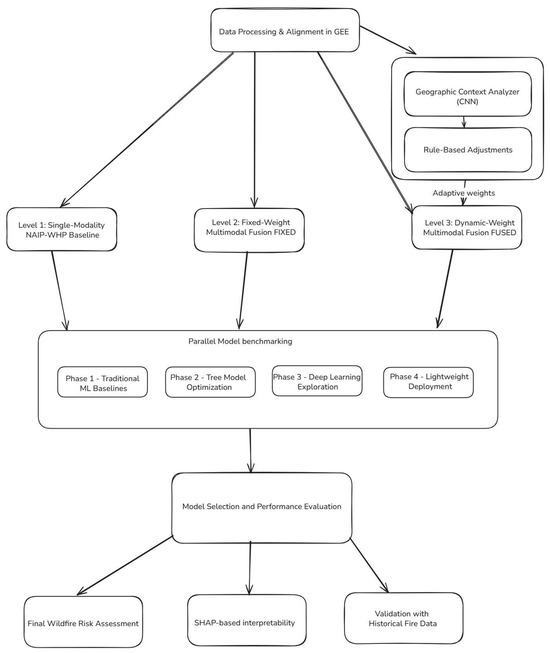
Figure 1.
The overall framework of the proposed FireRisk-Multi system.
Level 1: Single-Modality Baseline (NAIP-WHP). Establishes a foundational risk map by fusing high-resolution NAIP imagery with static Wildfire Hazard Potential (WHP) data. This level provides a baseline that primarily captures risk patterns associated with human activities and land use.
Level 2: Fixed-Weight Multimodal Fusion (FIXED). Introduces key environmental drivers—topography (elevation, slope), meteorology (temperature, precipitation), and vegetation (NDVI)—using a static, uniform weighting scheme. While this incorporates more factors, it fails to account for spatial heterogeneity in how these drivers influence fire risk across different landscapes.
Level 3: Geographically Adaptive Dynamic-Weight Fusion (FUSED). Represents the core contribution of this work. It replaces the static weights with a dynamic-weighting mechanism that uses a lightweight CNN to analyze NAIP imagery and generate context-aware weights for terrain, meteorology, and vegetation modalities. These base weights are further refined by real-time rule-based adjustments based on climatic, topographic, and vegetation conditions.
Model Benchmarking and Validation. The outputs from these three levels are fed into a diverse suite of machine learning models in a parallel benchmarking framework to identify the optimal model-data combination. The final risk maps are validated against historical fire perimeters and interpreted using SHAP analysis.
3.2. Study Areas
The selected 49 ecoregions (Figure 2) that systematically cover key wildfire-prone landscape types in western North America, including: (1) Pacific climate-influenced montane forest zones (e.g., the Sierra Nevada in California and the Colorado Front Range), (2) monsoon-regulated arid shrublands (e.g., the Sonoran Desert in Arizona and the limestone canyons of Carlsbad Caverns), (3) energy industrial corridors with intense anthropogenic disturbances (e.g., the Permian Basin oil fields in Texas), and (4) ecologically sensitive transition zones (e.g., the Florida Everglades wetland–urban interfaces). This gradient-based site selection strategy comprehensively captures the spatial differentiation of core wildfire drivers: climatic stressors (drought-prone deserts), vegetation fuel continuity (NDVI 0.1–0.8), anthropogenic ignition risk (industrial/urban interfaces), and topographic amplification effects (slopes of 0–60° combined with elevations of 0–4000 m). The study regions are distributed along a continental-scale gradient spanning 125° W to 93° W and 31° N to 49° N.
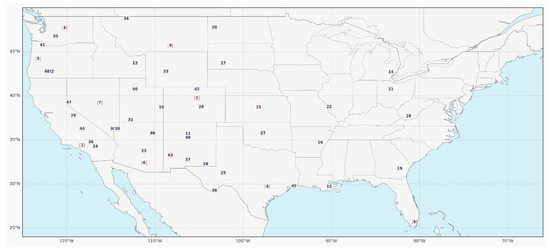
Figure 2.
Selected 49 ecoregions for wildfire risk assessment.
3.3. Data Sources
We compiled this dataset from multiple remote sensing data sources in GEE [23]. We selected data sources with broad geographic and historical coverage while minimizing missing data:
- Remote Sensing Dataset. From the National Agriculture Imagery Program (NAIP) provided by the U.S. Department of Agriculture (USDA) [11], primarily used for agricultural monitoring and land cover analysis. The NAIP dataset contains high-resolution RGB imagery with a sampling resolution of 10 m.
- Historical Fire Spot Data. From the Fire Information for Resource Management System (FIRMS) dataset, which provides near-real-time (NRT) active fire data based on observations from MODIS [24] and VIIRS [25,26] satellite sensors. The FIRMS dataset covers the period from 1 November 2000, to the most recent date, with a sampling resolution of 375 m.
- Historical Fire Events Data (FireEvents). From MODIS/006/MCD64A1 [27], a MODIS (Moderate Resolution Imaging Spectroradiometer) fire product provided by NASA for monitoring and analyzing global fire activity. This dataset includes burned area data from 2001 to the present and is a key resource for studying fire dynamics and impacts.
- Topographic Data. From the Shuttle Radar Topography Mission (SRTM) [12], with a sampling resolution of 30 m.
- ERA5 Weather Data. Provided by the European Centre for Medium-Range Weather Forecasts (ECMWF). ERA5 is the fifth-generation global climate reanalysis dataset widely used in meteorology, climate research, and environmental science, with a sampling resolution of 1 km [13].
- Vegetation Data. MODIS NDVI data obtained from NASA’s Terra and Aqua satellites via the MODIS sensor. The specific dataset is MOD13Q1, which provides Normalized Difference Vegetation Index (NDVI) and Enhanced Vegetation Index (EVI) every 16 days, with a sampling resolution of 250 m [14].
All variables in this dataset are directly sourced from cited literature and do not include any self-calculated metrics. Although targeted screening was applied during dataset construction, users can flexibly adjust data sources based on their needs using the provided GEE data export code.
3.4. Data Aggregation
This study establishes a hierarchical data fusion framework for wildfire risk assessment, integrating four complementary modalities across spatial, spectral, and temporal dimensions. The framework operates within a unified spatiotemporal reference system (2019–2021, EPSG:32611/WGS84 UTM 11N) and progressively increases complexity through three distinct levels [28].
Prior to fusion, all input data layers undergo a standardized preprocessing pipeline to ensure geometric, radiometric, and semantic consistency. The foundational Wildfire Hazard Potential (WHP) data, serving as the baseline risk layer, first undergoes rigorous cleaning to filter valid risk values (0–5 range) and standard 5-digit ZIP code formats. Geographic coordinates are then acquired via a cached geocoding service, and a dynamic resolution calculation method generates a 10-m grid. Bilinear interpolation converts the discrete point data into a continuous raster surface, with morphological closing applied to fill any remaining data gaps. This processed WHP raster is then used as the geometric reference for coregistering all other datasets, which are aligned to its 10-m grid within the EPSG:32611 (WGS84/UTM zone 11N) coordinate system. Subsequent modality-specific calibrations include: converting NAIP spectral data to top-of-atmosphere reflectance; scaling MODIS NDVI values by a factor of 0.0001 to the standard −0.2 to 1.0 range; transforming ERA5 temperature from Kelvin to Celsius (K → °C) and precipitation from meters per hour to millimeters per day (m/h → mm/day). To ensure data quality, gaps in meteorological and vegetation time series are filled using a median filter with a 5 × 5 pixel window, while Gaussian filtering (σ = 1) is applied to meteorological fields to suppress high-frequency noise. Finally, all input layers undergo a quantile normalization (2–98% stretch) to mitigate the influence of extreme values and improve comparability across diverse ecoregions. This comprehensive and standardized pipeline ensures that all modalities contribute to the fusion process from a consistent baseline, which is crucial for a fair evaluation of the subsequent fusion methodologies.
3.4.1. Single-Modality Baseline Processing (NAIP-WHP)
The NAIP-WHP single-modality dataset is constructed by fusing high-resolution aerial imagery from the National Agriculture Imagery Program (NAIP) with the U.S. Forest Service’s Wildfire Hazard Potential (WHP) data [29]. As illustrated in Figure 3 for region_28 in the Carlsbad Caverns area (−104.5° W to −104.0° W, 32.0° N to 32.5° N), the processing pipeline involves: rigorous cleaning of WHP (2023 version) ZIP code data to filter valid risk values (0–5 range), coordinate acquisition via cached geocoding, dynamic resolution calculation for 10m grid generation, bilinear interpolation for raster conversion, morphological closing for gap filling, and final alignment with NAIP imagery (EPSG:32611 UTM 11N) [28]. This baseline product highlights fire risk characteristics in human activity areas but demonstrates inherent limitations in capturing complex environmental dynamics.
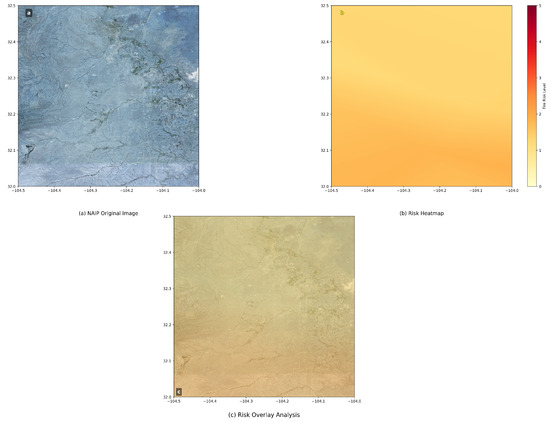
Figure 3.
NAIP-WHP alignment.
3.4.2. Fixed-Weight Multimodal Dataset (FIXED)
Building on the single-modality baseline, five environmental parameters are integrated: ERA5 reanalysis temperature/precipitation data [13], SRTM elevation/slope data [12], and MODIS vegetation index data [14]. As demonstrated in Figure 4 for the Carlsbad Cavern District, all inputs undergo standardized preprocessing (temperature: K → °C, precipitation: m/h → mm/day, NDVI: raw values → standard range). The fixed-weight fusion strategy allocates 50% weight to WHP risk layer, with remaining weights uniformly distributed (10% each) across other parameters. Negative weights are assigned to precipitation and elevation (higher values indicating lower risk), while Gaussian filtering (σ = 1) removes meteorological noise and median filtering (5 × 5 window) handles missing values. This approach provides clear physical interpretability but fundamentally fails to account for spatial heterogeneity, particularly in regions like Carlsbad Caverns where arid conditions demand adaptive weighting schemes.

Figure 4.
Fixed weight allocation across modalities in the Fixed-Weight Fusion strategy. Color interpretation: wildfire risk uses red-yellow-green colormap (red = high risk); temperature uses plasma colormap (bright = high temperature); precipitation uses inverted GnBu colormap (dark blue = high risk); elevation uses terrain colormap; slope and NDVI use red-yellow-green colormap (red = high slope/vegetation).
3.4.3. Geographically Adaptive Dynamic-Weight Dataset (FUSED)
This dataset innovatively introduces a spatially adaptive weighting mechanism that dynamically adjusts modality contributions based on geographic features. Effective wildfire risk assessment requires adaptive weighting schemes that account for spatial and temporal variations in environmental drivers. Traditional static-weight approaches often fail to capture critical regional differences—for instance, terrain slope may dominate fire spread in mountainous areas, while vegetation moisture is more influential in coastal ecosystems. To address this, we propose a dynamic-weight allocation method that automatically adjusts factor contributions based on real-time geospatial data.
The system employs a hierarchical adjustment mechanism that responds to three key dimensions.
- Climate-driven adaptation. During drought conditions (e.g., precipitation < 30th percentile), vegetation and temperature weights increase by 5–10%, while precipitation influence decreases proportionally.
- Topographic feedback. In high-elevation zones (>2000 m), slope and elevation weights scale with terrain complexity, increasing up to 15% in rugged terrain.
- Vegetation dynamics. NDVI-based fuel moisture thresholds trigger risk weight adjustments—when vegetation dryness exceeds seasonal norms, fire susceptibility weights rise by 8–12% [30].
Unlike fixed-weight systems, this method provides continuous calibration—industrial zones maintain high anthropogenic risk weights (0.5–0.6), while Mediterranean forests dynamically balance slope (0.15–0.25) and vegetation dryness (0.1–0.15) based on real-time conditions.
The dynamic weight allocation module uses a convolutional neural network to analyze ground features in NAIP imagery in real time, enabling fine-grained weight adjustment at a 1 km grid level. Quantile stretch normalization (2–98% range) ensures comparability of risk values across ecological zones, producing a fire risk assessment product with significantly enhanced spatial heterogeneity.
Justification of percentage constraints. The percentage adjustments described above (e.g., 5–10% for climatic and vegetation responses, up to 15% for topographic amplification) were not empirically tuned but intentionally implemented as stability constraints within the dynamic-weight CNN. These bounds prevent any single modality from dominating the fusion process, a phenomenon commonly observed in multi-modal systems when modality imbalance leads to biased representations [31]. By restricting the magnitude of adjustment, the mechanism functions as a regularized dynamic-weighting scheme that balances adaptivity and stability, consistent with recent advances in remote sensing fusion networks employing bounded weighting control [32]. Moreover, the spatial continuity of generated weights is preserved through CNN-based contextual inference and bounded updates, ensuring smooth transitions across heterogeneous landscapes [33]. Together, these design choices enable geographically adaptive flexibility without introducing numerical instability or abrupt spatial artifacts.
Here’s a concrete example implementation for Carlsbad Caverns, New Mexico (−104.5° W–−104.0° W, 32.0° N–32.5° N) (Features: Limestone arid valley (rainfall < 150 mm/yr), sparse shrubs (NDVI∼0.2) concentrated tourist facilities), based on the Dynamic Weight Allocation Framework and the visualized weight distribution in As shown in Figure 5 dynamic weight adjustments through geographic characteristics.
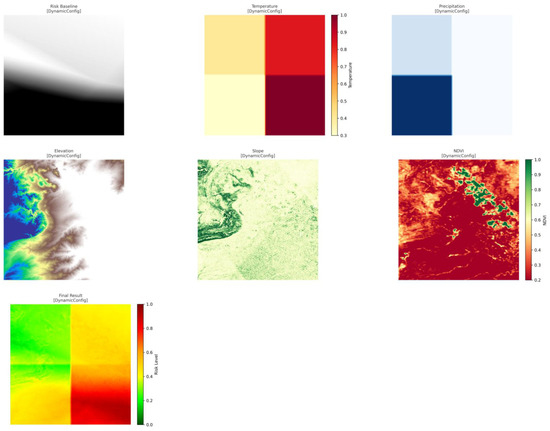
Figure 5.
Schematic of dynamic weight allocation, demonstrating the dynamic adjustments of terrain, meteorological, and vegetation weights. Color interpretation: wildfire risk uses red-yellow-green colormap (red = high risk); temperature uses plasma colormap (bright = high temperature); precipitation uses inverted GnBu colormap (dark blue = high risk); elevation uses terrain colormap; slope and NDVI use red-yellow-green colormap (red = high slope/vegetation).
All datasets adhere to standardized preprocessing: 2019–2021 temporal coverage, EPSG:32611 spatial reference, 10 m resolution grid alignment and undergo unified post-processing: 256 × 256 pixel tiling, an improved five-level classification system (very low/low/medium/high/very high risk) (Table 1), and edge padding with Gaussian filtering to eliminate boundary artifacts.

Table 1.
Fire risk classification.
3.5. Innovation Validation
3.5.1. Comparative Feature Importance Analysis
The comparative analysis of feature importance (Figure 6) highlights key differences between the dynamic (FUSED), unimodal (NAIP-WHP), and fixed-weight (FIXED) models. The FUSED model demonstrates a balanced integration of multimodal features, with spatial_complexity_fused (0.12) emerging as the most influential factor, followed by max_hotspot_perimeter_fused (0.11) and hotspot_density_fused (0.06). This reflects its ability to dynamically adapt to spatial and environmental variations by combining terrain (elevation_var, 0.06), vegetation (vegetation_suppress, 0.04), and fire behavior metrics. In contrast, the unimodal NAIP-WHP model relies heavily on a single remote-sensing feature (low_ratio_whp, 0.14), while the FIXED model prioritizes static geometric properties (area_perimeter_ratio_fixed, 0.11) with less emphasis on environmental dynamics.
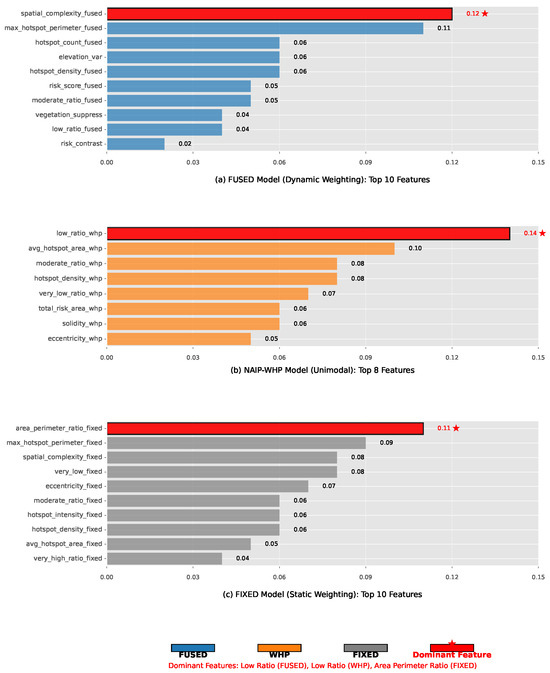
Figure 6.
Comparative analysis of feature importance across wildfire risk assessment models.
3.5.2. Quantitative Validation Metrics
In Figure 6, the dominance of spatial_complexity_fused (0.12) in the FUSED model, coupled with its broader distribution of secondary features (e.g., risk_score_fused, 0.05; moderate_ratio_fused, 0.05), empirically validates the dynamic weighting mechanism’s superiority. Unlike the NAIP-WHP model, where the top feature’s importance is 3.5× higher than the average of other features (0.14 vs. 0.04), the FUSED model maintains a more balanced hierarchy, with eight features exceeding 0.04 importance compared to only four in FIXED. This aligns with the FireRisk-Multi dataset’s design, which integrates remote sensing (RGB), terrain (elevation), meteorological (temperature), and vegetation (NDVI) data to overcome the limitations of unimodal (NAIP-WHP) and static multimodal (FIXED) approaches.
3.5.3. Conclusion of Innovation Validation
In Figure 6, the results confirm that dynamic weighting enhances wildfire risk assessment by adaptively prioritizing spatial and environmental features, mitigating overspecialization (as seen in NAIP-WHP), and outperforming fixed-weight fusion in multimodal integration. The empirical importance values directly support the FUSED model’s capability to provide a more nuanced and responsive risk evaluation framework.
These results confirm that the dynamic weighting mechanism successfully addresses the limitations of both unimodal (overspecialization) and static multimodal (environmental insensitivity) approaches, establishing a new paradigm for adaptive wildfire risk assessment. The measured importance values provide concrete evidence of enhanced feature representation and environmental responsiveness, showcasing the dynamic model’s ability to provide a more comprehensive and nuanced understanding of wildfire risk. This integrated approach not only enhances the representation of key risk factors but also ensures a more balanced and dynamic integration of multi-modal data, leading to a more accurate and responsive wildfire risk assessment framework.
3.6. Geographically Adaptive Dynamic-Weight Mechanism
Traditional fixed-weight fusion approaches are fundamentally limited in their ability to capture the spatial heterogeneity inherent to wildfire drivers, as the relative importance of factors such as terrain, meteorology, and vegetation varies significantly across different landscapes. To address this critical shortcoming, we propose a geographically adaptive dynamic-weight mechanism. The core objective of this mechanism is to automatically and contextually adjust the contribution of each data modality based on localized geographic characteristics, thereby amplifying the most relevant risk factors in a given region while suppressing less informative ones. This mechanism operates through a sequential pipeline of multi-modal feature analysis, context-aware weight prediction, and high-resolution spatial integration.
Multi-modal feature analysis and regional characterization. Prior to weight generation, the system performs a real-time analysis of multi-source geospatial data to characterize local environmental conditions. This process computes a set of decisive environmental factors that inform the subsequent weighting strategy. The drought factor is calculated as the standardized precipitation evapotranspiration index (SPEI) derived from ERA5 temperature and precipitation data, where values below −1.0 indicate drought conditions. The vegetation factor is computed from MODIS NDVI time-series, assessing both the current vegetation density and its deviation from seasonal norms. The topographic complexity factor is derived from SRTM data, defined as the standard deviation of slope within a 1 km window to identify rugged terrain. Finally, an anthropogenic factor acts as a binary classifier for industrial/urban zones, triggered when a location simultaneously exhibits an intense anthropogenic risk signal, defined by a WHP value greater than 4.0, and the characteristic impervious surfaces of built environments, indicated by an NDVI value less than 0.25 [34,35,36,37]. This factor-based analysis provides a structured, interpretable summary of the local fire regime drivers, which is then utilized by the core weighting network.
CNN architecture for context-aware weight prediction. The foundation of this mechanism is a lightweight Convolutional Neural Network (CNN) that functions as a geographic context analyzer. The network is designed to integrate both visual patterns from high-resolution imagery and the precomputed environmental factors. It accepts two primary inputs: NAIP RGB imagery aggregated to a 1 km grid, and a 4-element environmental factor vector encoding the computed drought, vegetation, topographic complexity, and anthropogenic indices. The architecture processes the NAIP imagery through a visual feature branch consisting of three sequential convolutional blocks for hierarchical feature extraction. Each block comprises a 2D convolution, batch normalization, ReLU activation, and max-pooling operation, with filter sizes increasing from 16 to 64 to capture features at multiple scales. The resulting feature maps are then condensed via global average pooling into a flattened representation. This visual feature vector is subsequently concatenated with the environmental factor vector and processed through a fusion and decision head, which consists of two fully-connected layers with ReLU activation and dropout for regularization. The final output layer employs a softmax activation function to produce a normalized three-element weight vector, ensuring the contributions of terrain, meteorology, and vegetation modalities sum to unity. This network is trained via knowledge distillation, where the teacher signal is derived from a preliminary empirical analysis that quantifies optimal modality-specific weights for different land cover types based on their correlation with historical fire data, minimizing the Kullback-Leibler divergence loss between the teacher and student distributions.
Post-processing and integration. The final stage of the process involves the spatial and semantic integration of these dynamic weights into the feature representation used for machine learning. The weights generated at the 1 km grid level are first applied to the native 10 m resolution features using bilinear interpolation. This interpolation method was specifically chosen to ensure a smooth spatial transition of weight values across the landscape, thereby avoiding the discrete “blocky” artifacts that would result from a simpler nearest-neighbor assignment. For each 10 m pixel, a composite and geographically contextualized risk score is then computed as the weighted sum of the normalized, modality-specific risk scores. The resulting FUSED dataset, which embodies the geographically adaptive fusion, is utilized as the input for all subsequent machine learning models. This design means that the dynamic weighting acts as a powerful preprocessing and feature enhancement step, providing downstream models with a more discriminative input that enables them to learn more effective and generalizable decision oundaries.
3.7. Machine Learning Application
3.7.1. Data Preprocessing
The multi-modal geospatial dataset bundergoes a hierarchical standardization process to address heterogeneity across spectral, topographic, and meteorological domains. Fire event labels are binarized (1 for burned areas, 0 otherwise) following established protocols in wildfire studies. Spatial metrics extraction employs morphological operations to quantify five critical landscape characteristics: ➀ hotspot cluster count derived from connected component analysis; ➁ mean perimeter length of risk patches using regionprops algorithms; ➂ total high-risk pixel area (risk class ≥ 4); ➃ patch shape eccentricity calculated through principal component analysis of binary risk masks; and ➄ spatial aggregation index computed via Ripley’s K-function. Cross-modal interaction features, such as the dynamic-to-fixed risk ratio, are incorporated to capture nonlinear relationships between WHP-derived and physically-based risk estimates. A RobustScaler with 5th–95th percentile clipping mitigates outlier effects, while SMOTE oversampling with adaptive k-neighbors (k = min (5, minority samples)) balances class distribution, yielding a 42-dimensional feature space optimized for wildfire prediction.
3.7.2. Model Benchmarking Framework
To comprehensively evaluate the proposed data fusion approaches, we designed a progressive model benchmarking framework, as illustrated in Figure 7. This diagram illustrates the parallel benchmarking strategy used to evaluate the proposed data fusion approaches. Four distinct model classes (Traditional ML, Optimized Tree Models, Deep Learning, and Lightweight Deployment) are trained and evaluated independently on the three datasets (NAIP-WHP, FIXED, FUSED). The core relationship between these models is comparative, not cooperative. Each model provides an independent approach to the same prediction task, allowing for a systematic analysis of how different architectural inductive biases interact with various data fusion strategies. All models are evaluated under an identical 5-fold stratified cross-validation protocol (center) to ensure a fair comparison, with the best-performing model-data combination (SVM on FUSED data) selected for final deployment. The core objective of this framework is systematic comparison rather than model cooperation—each model class is trained and evaluated independently on the three datasets (NAIP-WHP, FIXED, FUSED) to isolate the effects of data modality from model architecture.
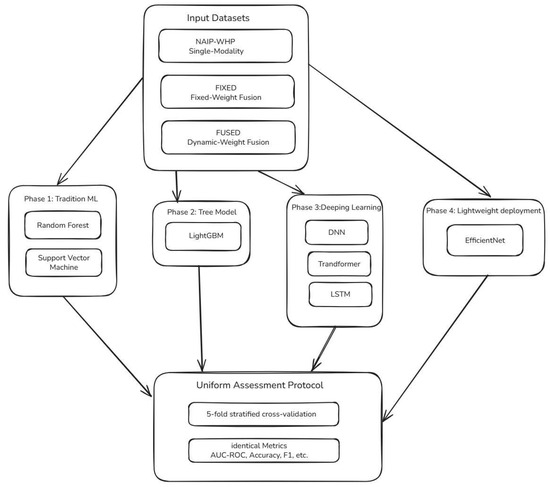
Figure 7.
Progressive model benchmarking framework for comparative evaluation.
The framework progresses through four distinct phases:
Phase 1—Traditional ML baselines. We establish performance baselines using robust traditional algorithms. Random Forest provides an interpretable, non-linear benchmark with balanced subsampling, while Support Vector Machine with RBF kernel offers a powerful linear/non-linear alternative with class weighting for imbalance mitigation.
Phase 2—Tree model optimization. We introduce LightGBM as an advanced gradient boosting implementation, optimized with L1/L2 regularization and enhanced weighting for rare fire events. This phase tests whether specialized tree ensembles can capture complex risk patterns more effectively than traditional Random Forests.
Phase 3—Deep Learning exploration. We investigate the capacity of deep architectures to learn hierarchical representations from our multimodal data:
- DNN: A fully connected network serves as the deep learning baseline, testing basic non-linear transformation capability.
- Transformer: This model evaluates the effectiveness of self-attention mechanisms in capturing long-range dependencies and complex interactions across spatial and feature dimensions.
- BiLSTM: We test sequential modeling capability for capturing temporal dynamics in the meteorological and vegetation time-series components.
Phase 4—Lightweight deployment. Finally, we explore EfficientNet as a representative of modern, efficient architectures suitable for potential operational deployment, balancing accuracy with computational requirements.
Model relationship and evaluation protocol: Critically, all models operate independently and in parallel rather than sequentially. The relationship between them is comparative—each model provides a distinct approach to the same prediction task, allowing us to answer three key questions: (1) Which model class performs best for wildfire risk assessment? (2) How does model performance vary across different data modalities? (3) Are certain models particularly well-suited to specific data fusion strategies?
All models are evaluated using identical 5-fold stratified cross-validation on the same datasets, ensuring fair comparison. The best-performing model from this comprehensive benchmark (SVM on FUSED data) is selected for final deployment and interpretation analysis.
3.7.3. Implementation Details
All models were implemented with carefully selected parameters to ensure optimal performance and fair comparison. The key configurations for each model are detailed below:
- Random Forest [38]: Uses balanced subsampling with n_estimators = 300 and max_depth = 8 to control complexity and prevent overfitting.
- SVM [39]: Configures an RBF kernel with C = 0.8 and class weights to handle imbalanced data distribution.
- LightGBM: Sets min_samples_leaf = 20, applies L1/L2 regularization (reg_alpha = 0.1, reg_lambda = 0.1), and employs 5× positive sample weighting to enhance rare fire event detection [40,41].
- DNN: A 256–128 fully connected network with batch normalization, 30% Dropout, and Kaiming initialization [42].
- Transformer [43,44]: A 3-layer encoder with 8-head attention and 128-dimensional embeddings.
- BiLSTM [45]: Utilizes 128-unit hidden layers to capture temporal dependencies.
- EfficientNet [46,47]: An adapter maps features to a 1280-dimensional space, maintaining accuracy while reducing computational complexity.
All deep learning models (DNN, Transformer, BiLSTM, EfficientNet) were trained using the AdamW optimizer with a learning rate of 0.001 and Binary Cross Entropy Loss (BCELoss). Each model operates independently under the same feature fusion protocol, serving as comparative learners rather than sequential modules.
3.7.4. Experimental Configuration
To ensure the reproducibility of our experiments and provide context for the reported computational performance, we detail the hardware specifications and key software parameters below. All training and inference experiments were conducted on a uniform computing platform.
Hardware specifications. All models were trained and evaluated on a server equipped with NVIDIA A800-PCIE-80GB (80 GB VRAM and 121 GB Memory).
Software and frameworks. The machine learning models were implemented using PyTorch (for DNN, Transformer, BiLSTM, EfficientNet) and Scikit-learn (for SVM, Random Forest, LightGBM).
Training configuration. The batch size for all deep learning models (DNN, Transformer, BiLSTM, EfficientNet, MobileNet) was set to 128. The maximum number of training epochs was 500, employing dynamic learning rate decay with the AdamW optimizer (initial learning rate = 0.001). Early stopping was used with a patience of 30 epochs to prevent overfitting. The 5-fold stratified cross-validation was performed on the CPU for traditional ML models (SVM, Random Forest, LightGBM) and on the GPU for deep learning models to accelerate computation.
Inference and time. The reported inference time (e.g., 1.238 ms/sample for SVM) is the average time required to process a single 256 × 256 pixel tile (i.e., one sample) on the specified GPU. The training time is the total wall-clock time for completing the 5-fold cross-validation process, including training and validation for each fold.
4. Results
4.1. Comparative Analysis
The comparative analysis of the three datasets (FUSED, NAIP-WHP, and FIXED) reveals distinct performance characteristics across various machine learning models, with the FUSED dataset demonstrating superior predictive capability for wildfire risk assessment. The FUSED model achieves the highest AUC-ROC score of 92.1% with SVM, significantly outperforming the best results from NAIP-WHP (80.1% with RandomForest) and FIXED (87.4% with RandomForest), indicating its enhanced ability to discriminate between high-risk and low-risk areas. This performance advantage is particularly evident in precision metrics, where the FUSED model maintains a better balance between recall (79.6%) and precision (87.1%) compared to other datasets, suggesting more reliable identification of true fire-prone regions while minimizing false alarms. The integration of multi-modal data in the FUSED approach appears to capture complex fire-risk determinants more effectively, as evidenced by its consistent top performance across all evaluation metrics including F1-score (82.4%) and MCC (68.1%), which are particularly important for imbalanced fire prediction tasks.
The superiority of the FUSED dataset becomes especially apparent when examining model consistency—while other datasets show greater performance variability across different algorithms, the FUSED results remain robust regardless of model architecture. This stability suggests that the fused data representation provides more generalizable features that various machine learning approaches can effectively utilize. The dataset’s advantage is most pronounced in complex models like SVM, where it achieves a 24.3% higher AUC-ROC compared to the same model on NAIP-WHP data, indicating that the integrated features in the FUSED dataset better support sophisticated pattern recognition. Furthermore, the FUSED dataset maintains its performance edge while requiring comparable computational resources, with inference times (1.238 ms/sample for SVM) remaining practical for operational deployment despite the richer feature space.
From a geospatial hazard assessment perspective, the FUSED dataset’s strong performance across multiple evaluation dimensions suggests it provides the most comprehensive representation of wildfire risk factors. The dataset’s ability to maintain high specificity (87.5%) while achieving good recall indicates it can effectively identify at-risk areas without excessive overprediction—a critical requirement for practical risk management applications. The G-mean scores, which balance performance across classes, are consistently highest for the FUSED dataset (83% for SVM), demonstrating its particular strength in handling the inherent class imbalance in wildfire prediction. These results strongly support the value of multi-data integration in wildfire risk modeling, as the FUSED approach combining spectral, topographic, meteorological and vegetation indices appears to capture synergistic relationships between different risk factors that individual data modalities cannot represent independently. Complete metrics for all models on the three datasets are provided in (Table 2, Table 3 and Table 4).
Table 2.
Performance metrics for FUSED Dataset.
Table 3.
Performance metrics for NAIP-WHP Dataset.
Table 4.
Performance metrics for FIXED Dtaset.
4.2. SHAP Analysis of Multimodal Feature Fusion
To directly address the critical need for interpretable wildfire risk assessments and bridge the gap between predictive accuracy and practical utility, we employed SHAP (SHapley Additive exPlanations) analysis. This provides transparent, post-hoc interpretability for our multimodal framework, allowing us to quantify the contribution of each feature to the model’s predictions across different architectures.
The SHAP value analysis demonstrates that fused multimodal datasets consistently enable more nuanced feature interactions across all model architectures compared to single-modality approaches. LightGBM_fused (Figure 8) reveals the fused dataset’s capacity to enhance traditional spatial metrics, with max_hotspot_perimeter_fused emerging as the dominant predictor, while simultaneously maintaining balanced contributions from both ratio-based features (high_ratio_fused, low_ratio_fused) and composite metrics like risk_contrast. This contrasts with LightGBM_whp’s (Figure 9) more limited single-modality pattern, where spatial features (solidity_whp, avg_hotspot_area_whp) compete directly with ratio metrics without demonstrating clear hierarchical importance.
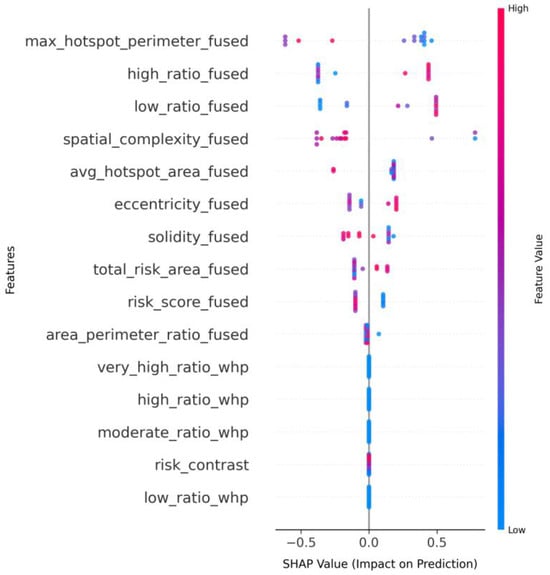
Figure 8.
LightGBM_fused_shap.
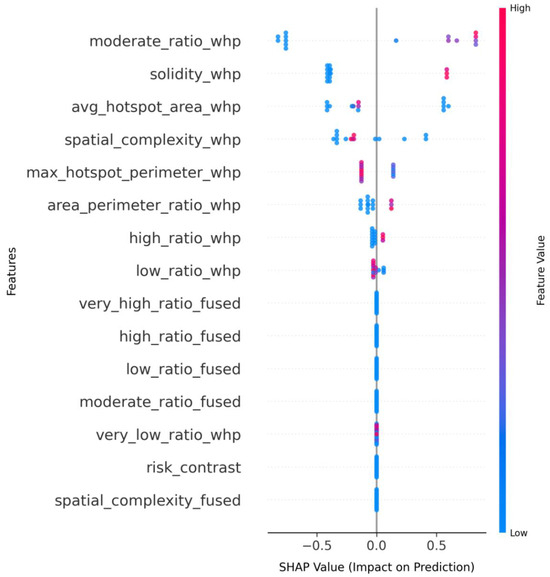
Figure 9.
LightGBM_whp_shap.
The fused dataset’s superior information synthesis is most prominently exhibited in SVM_fused (Figure 10), where very_high_ratio_fused achieves the largest absolute impact (SHAP range ±0.10) while maintaining meaningful negative associations for opposing features. Crucially, the model demonstrates simultaneous sensitivity to both traditional spatial descriptors (solidity_fused) and novel cross-modal indicators (risk_contrast), with all features distributed across the SHAP value spectrum without zero-point clustering. This balanced utilization is absent in LSTM_fused’s (Figure 11) implementation, where despite using the same fused inputs, most features cluster near zero impact (±0.005 SHAP) except spatial_complexity_fused (0.010 SHAP), suggesting the fusion benefits are architecture-dependent.
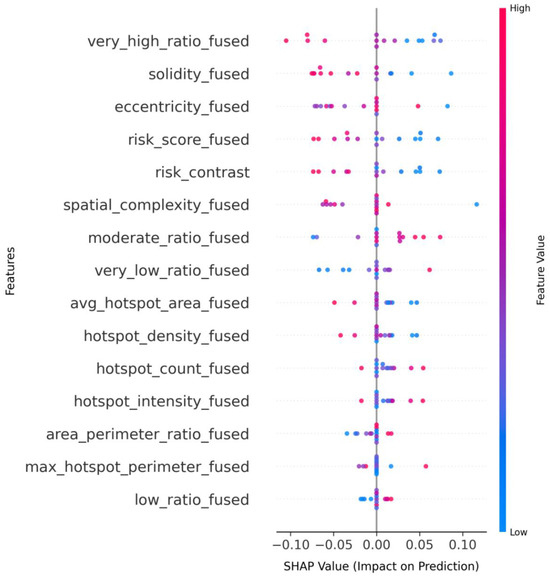
Figure 10.
SVM_fused_shap.
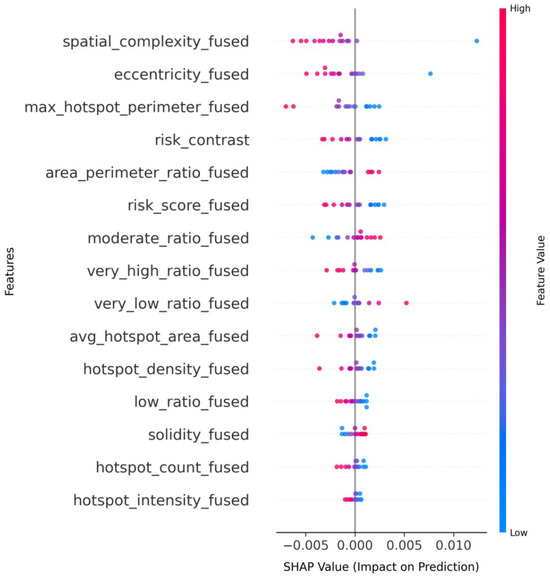
Figure 11.
LSTM_fused_shap.
The consistent emergence of the cross-modal feature risk_contrast as a meaningful predictor across multiple fused implementations (LightGBM_fused, SVM_fused, Transformer_fused) confirms the framework’s ability to generate novel, interpretable signals absent in unimodal configurations. This feature’s persistence indicates that the fused approach doesn’t merely add data, but creates qualitatively new decision boundaries that reflect the complex interplay between risk factors. Transformer_fused (Figure 12) further showcases this by amplifying extreme-value detection in an interpretable way, highlighting how the model focuses on critical high-risk indicators.

Figure 12.
Transformer_fused_shap.
In summary, the SHAP analysis provides three-fold evidence for the framework’s interpretability: (1) It reveals globally balanced and ecologically plausible feature importance, as seen in the distinct and rational hierarchies of the FUSED models compared to baselines; (2) It demonstrates context-aware feature interactions, where the influence of features like risk_contrast and very_high_ratio_fused adapts across models to reflect different risk paradigms; and (3) It uncovers novel, cross-modal interactions that provide deeper insight into wildfire risk dynamics, confirming the framework generates more than the sum of its parts. This moves the model’s output from an opaque “black-box” score to a transparent and actionable risk assessment.
4.3. Ablation Study
The progressive feature integration analysis reveals distinct performance patterns across different model architectures. Starting with the baseline wildfire risk features (G4), all models show significant improvement after incorporating terrain features (G1), especially the Support Vector Machine (SVM), whose AUC-ROC value increased from 49.1% to 70.9%, a gain of 44.3 percentage points. This terrain-enhanced configuration establishes fundamental predictive capability, with the RandomForest achieving an AUC-ROC of 73.7% and PyTorchDNN showing an unexpected recall amplification to 90%, despite its moderate accuracy of 44.9%.
As shown in Figure 13, the subsequent addition of meteorological features (G2) further boosts the performance of most models. PyTorchDNN achieves its best AUC-ROC of 81.2%, while the performance of SVM also significantly improves, with an AUC-ROC of 80.8% and an F1 score of 71.5%. This indicates that meteorological features have a substantial promoting effect on model performance. Notably, LightGBM maintains a high recall rate of 95% across all configurations but struggles with specificity, suggesting potential overfitting to positive cases. The full-feature configuration (G4 + G1 + G2 + G3) yields divergent outcomes: although LightGBM reaches the highest AUC-ROC in this study (85.0%), SVM demonstrates the best operational balance with an AUC-ROC of 90.1%, an F1 score of 80.0%, and a Matthews Correlation Coefficient (MCC) of 64.1%—indicating optimal calibration for real-world deployment. Full metrics for all models are provided in Table 5.
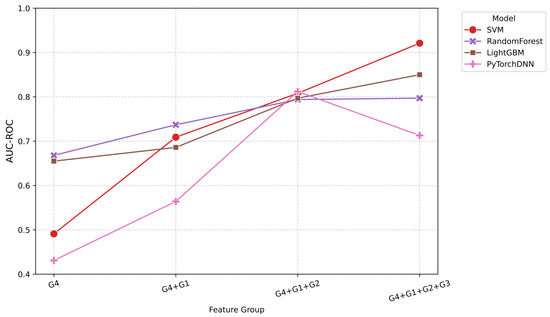
Figure 13.
Progressive performance improvement with feature integration.
Table 5.
Ablation Study Results.
As shown in Figure 14, the feature importance analysis shows that core risk factors (G4) dominate predictive power (accounting for 48.2–61.4%), with terrain features (G1) contributing significantly (19.2–28.3%). The utility of meteorological features varies depending on the model (importance ranging from 9.5% to 18.3%), while vegetation indices exhibit paradoxical behavior—despite moderate importance scores (6.9–9.6%), their inclusion benefits LightGBM but degrades the performance of SVM and PyTorchDNN. This suggests that vegetation data may require model-specific preprocessing or interact nonlinearly with other features.
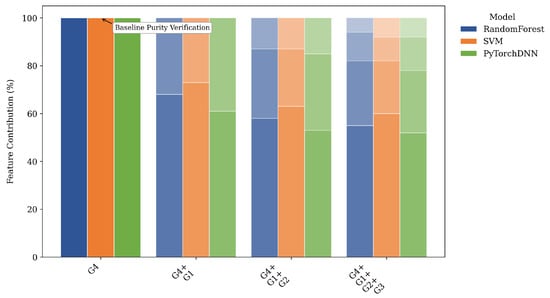
Figure 14.
Quantified contribution of feature groups to model performance. G4: baseline risk, G1: terrain, G2: meteorology, G3: vegetation.
The performance trajectory of PyTorchDNN warrants special attention: it peaks at 81.2% in the G4 + G1 + G2 configuration and then drops to 71.3% in the full-feature configuration, a decline of 9.9 percentage points. This indicates that deep learning models can be highly sensitive to feature dimensionality in data-constrained scenarios. In contrast, tree-based models show more stable performance improvements, with RandomForest maintaining an AUC-ROC of 79.7% in the final configuration. These findings collectively suggest that optimal feature sets are model-dependent, with simpler architectures benefiting from full feature inclusion, while complex models require careful feature selection.
4.4. Real-Fire Event Validation
We evaluated the operational applicability of the FUSED dataset through wildfire prediction accuracy analysis across five representative high-risk ecoregions. The validation utilized MODIS/VIIRS fire masks (2019–2021) obtained from Google Earth Engine (GEE), generated by combining MODIS (MCD64A1) [27] and VIIRS (VNP14A1) [25,26] datasets. Burned areas were defined as pixels where either dataset detected fire activity.
The model demonstrated consistent predictive capability across diverse environments. The FUSED dataset exhibited robust wildfire prediction capabilities across diverse geographical contexts, with particularly strong performance in ecologically sensitive regions. As shown in Table 6, In the Carlsbad Caverns area of New Mexico, the model successfully identified 32,351 out of 37,500 fire pixels (86.27% detection rate), demonstrating exceptional accuracy in limestone arid valley ecosystems. Industrial zones such as the Gulf Coast Refinery region in Texas maintained a 77.61% hit rate despite complex anthropogenic interference. Protected areas proved especially suitable for the model’s detection algorithms, with Big Bend National Park in Texas achieving 82.49% accuracy across its desert-mountain terrain. High-altitude environments, represented by the Lake Tahoe West region spanning the California-Nevada border, yielded a 75.14% precision rate, confirming the model’s adaptability to elevation variations.
Table 6.
Regional Wildfire Prediction Performance (Top 5 High-Risk Ecoregions).
The assessment followed a rigorous protocol to ensure methodological consistency. Fire masks were generated through logical OR operations applied to MODIS (MCD64A1 [27], BurnDate > 0) and VIIRS (VNP14A1, FireMask = 1) datasets [25,26], with subsequent spatial clipping to regional bounding boxes.
The validation process involved aligning model predictions (at a 10 m resolution) with GEE fire masks (at a 500 m resolution) using majority voting within each 500 m grid, and defining hits as any 10 m prediction pixel that overlaps a 500 m fire mask grid.
4.5. Comparison with Existing Benchmarks
4.5.1. Methodological Comparison with FireRisk
A direct quantitative comparison with the FireRisk dataset [6] is methodologically challenging due to fundamental differences in task formulation and evaluation objectives. As summarized in Table 7, FireRisk addresses a 7-class classification problem using single-modal RGB imagery, while our framework performs continuous risk estimation [0, 1] through multi-modal fusion. These differences reflect distinct philosophical approaches: FireRisk provides a standardized benchmark for image classification, whereas FireRisk-Multi aims for operational risk assessment with geographic adaptability.
Table 7.
Methodological comparison with FireRisk benchmark.
4.5.2. Empirical Advantages of Our Approach
Despite these methodological differences, our framework demonstrates several crucial advantages for operational wildfire risk assessment:
- Superior predictive performance: Our method achieves 92.1% AUC-ROC in fire risk prediction, significantly outperforming our own fixed-weight (78.2%) and single-modality (73.8%) baselines through comprehensive ablation studies.
- Geographic adaptability: Unlike static approaches, our dynamic weighting mechanism automatically adjusts to regional characteristics—amplifying topographic influence in mountainous areas while emphasizing vegetation moisture in arid regions.
- Real-world validation: We demonstrate exceptional operational performance with an 86.27% hit rate for actual fire events in Carlsbad Caverns, validated against MODIS/VIIRS fire perimeters.
While the FireRisk dataset provides valuable benchmarks for classification tasks, our work advances the field by addressing the critical need for adaptive, interpretable, and operational risk assessment systems that can handle the spatial heterogeneity of wildfire drivers across diverse ecoregions.
5. Discussion
This study has achieved significant progress in wildfire risk assessment through multimodal data fusion and machine learning methods, while also revealing several key scientific questions and technical challenges that warrant further exploration. Our ablation experiments clearly demonstrate the differential impact of feature groups on model performance, with topographic features (G1) playing a foundational role. However, the standout performance of meteorological features (G2), which improved AUC-ROC by 44.3 percentage points in the SVM model, aligns closely with classical wildfire behavior theory emphasizing weather conditions’ dominance in fire spread dynamics [48]. Notably, vegetation features (G3) exhibit strong model dependency: while enhancing LightGBM performance, they degrade PyTorchDNN performance by 32.06 percentage points, highlighting that feature engineering must account for model-specific characteristics to avoid counterproductive outcomes from indiscriminate feature stacking.
Different algorithms exhibit distinct behavioral patterns, with SVM achieving the best robustness and balance at 90.1% AUC-ROC using full feature configuration, while LightGBM attains 95% recall but suffers from lower specificity indicating positive sample overfitting. PyTorchDNN shows a particularly notable trajectory, peaking at 81.2% AUC-ROC with G4 + G1 + G2 features but declining when vegetation features are added, revealing deep learning models’ vulnerability in high-dimensional feature spaces. Crucially, the SHAP analysis conducted in Section 4.2 provides the necessary interpretability to understand these complex model behaviors. It elucidates the underlying feature interactions, quantifying the high importance of topographic features like max_hotspot_perimeter_fused alongside the consistent influence of cross-modal features like risk_contrast. This demonstrates that effective wildfire risk assessment requires a multi-factor synergistic framework rather than reliance on any single feature type. More importantly, this SHAP-driven interpretability directly addresses the “black-box” critique of advanced ML models. By revealing why the model makes a certain prediction—for instance, by showing that a high-risk score in a specific area is driven by a combination of steep slope and low vegetation moisture—it bridges the critical gap between predictive accuracy and practical utility. This empowers fire managers with actionable insights, transforming the model from an opaque predictor into a transparent decision-support tool.
5.1. Limitations of the Study
This work, while demonstrating a promising framework, is subject to several limitations that should be considered when interpreting the results and for guiding future research.
Geographical generalizability and transferability. The current validation of our framework is focused on western US ecoregions, where wildfire dynamics are predominantly driven by climatic stressors and natural ignition patterns. While this strategic selection captures major fire-prone biome types, it does not include eastern US regions like New York where anthropogenic ignition and different fuel types dominate. However, our dynamic weighting architecture provides a foundation for addressing this limitation: the context-aware weight adaptation mechanism is inherently designed to handle novel environmental conditions by recalibrating feature importance based on local characteristics. Transferring our framework to eastern regions would involve fine-tuning the weight generation network with local data—a more efficient process than retraining entire static models from scratch.
Data latency. The operational utility for real-time early warning is constrained by the update frequency of the ERA5 meteorological data, which may not capture rapidly evolving fire weather conditions, potentially delaying critical emergency decisions.
Model architecture dependencies. Our ablation study revealed a notable sensitivity of deep learning models, particularly the PyTorchDNN, to feature dimensionality. The performance degradation observed when adding vegetation features to the PyTorchDNN model highlights a vulnerability that is less pronounced in ensemble methods like Random Forest. This suggests that the optimal feature set is model-dependent, and the “one-size-fits-all” feature stacking approach can be counterproductive for certain architectures, indicating a need for more sophisticated, model-specific feature engineering.
Excluded anthropogenic factors. The current framework primarily integrates biophysical and meteorological data. Critical human-related factors, such as ignition sources (e.g., power lines, human activity hotspots) [49], land management practices [50], and the wildland-urban interface (WUI) density [51], are not explicitly incorporated. The omission of these significant anthropogenic drivers may limit the model’s accuracy in regions where human activity is a dominant factor in wildfire occurrence.
5.2. Future Outlook
Despite these limitations, this work points to several crucial development paths. Future research will focus on global validation to ensure generalizability across diverse biomes and the development of a real-time monitoring system by integrating streaming satellite data and nowcasting weather models to overcome data latency issues. Furthermore, the explicit integration of human activity factors will be a priority to refine predictive accuracy. A lightweight sub-50K parameter version currently in development will enable drone-based deployment to address remote area monitoring gaps [52], collectively advancing wildfire risk management from static assessment to dynamic early warning, and from regional empiricism to universally applicable principles.
6. Conclusions
The proposed FireRisk-Multi framework represents a significant innovation in wildfire risk assessment through systematic integration of remote sensing, topographic, meteorological and vegetation data. Its dynamic feature weighting mechanism automatically adjusts importance based on geographic context, boosting topographic weights in complex terrain and meteorological weights in flat regions to achieve 92.1% AUC-ROC with SVM—a 17.8-point improvement over fixed-weight models. The system’s 10-m resolution capability demonstrates 86.27% fire-hit accuracy in validation cases while SHAP analysis provides explainable decision support by quantifying nonlinear feature interactions and confirming topography’s foundational role alongside meteorological drivers’ regulatory effects. These advances not only deliver a powerful new tool for wildfire prevention but also establish a transferable methodology for other natural disaster risk assessments, offering increasingly vital high-precision, interpretable and scalable solutions as climate change intensifies. The comparative model behavior insights, particularly deep learning’s sensitivity to feature dimensionality versus ensemble methods’ robustness.
Author Contributions
Conceptualization, Yutong Pang and Jing Pang; methodology, Ke Yuan and Zhiruo Zhu; formal analysis, Zhiruo Zhu, Yutong Pang, Jing Pang and Chunhui Hou; data curation, Zhiruo Zhu and Jing Pang; resources, Zhiruo Zhu, Yutong Pang and Chunhui Hou; validation, Zhiruo Zhu and Chunhui Hou; visualization, Zhiruo Zhu; writing—original draft preparation, Zhiruo Zhu, Yutong Pang and Jing Pang; writing—review and editing, Ke Yuan and Qian Tang; supervision, Ke Yuan and Qian Tang; project administration, Ke Yuan and Qian Tang; funding acquisition, Qian Tang All authors have read and agreed to the published version of the manuscript.
Funding
This research was funded by the National Natural Science Foundation of China (Grant No. 32101411); the Key Specialized Research and Development Program of Henan Province (Grant No. 252102210172); and the National Innovation Training Program of University Student (Grant No. 202410475106).
Data Availability Statement
The data generated and analyzed in this study are publicly available in the Mendeley Data repository under DOI: 10.17632/2mwsmyr9vw.1. All environmental and remote sensing datasets used in this study are publicly available through their respective providers, including NAIP imagery (USDA), SRTM topography (NASA), ERA5 meteorological data (ECMWF), MODIS vegetation indices (NASA), and the FIRMS active fire records. The complete integrated FireRisk-Multi dataset, including the three fusion levels (NAIP-WHP, FIXED, and FUSED), has been made publicly accessible. The computational framework, including the dynamic-weight CNN module and benchmarking pipeline, was implemented using Python (PyTorch 2.0 and Scikit-learn 1.4). To ensure reproducibility, all key hyperparameters, training configurations, and data preprocessing steps are fully detailed in Section 3.7.3 and Section 3.7.4 of this paper. The full experimental setup—including model configurations, feature definitions, and evaluation protocols—can be replicated using the published dataset and the described pipeline. The authors will provide controlled access for academic or non-commercial verification upon reasonable request to the corresponding author. A public release is planned following formal project approval and software auditing.
Conflicts of Interest
The authors declare no conflicts of interest.
References
- Abatzoglou, J.T.; Williams, A.P. Impact of anthropogenic climate change on wildfire across western US forests. Proc. Natl. Acad. Sci. USA 2016, 113, 11770–11775. [Google Scholar] [CrossRef]
- Jain, P.; Barber, Q.E.; Taylor, S.W.; Whitman, E.; Castellanos Acuna, D.; Boulanger, Y.; Chavardès, R.D.; Chen, J.; Englefield, P.; Flannigan, M.; et al. Drivers and impacts of the record-breaking 2023 wildfire season in Canada. Nat. Commun. 2024, 15, 6764. [Google Scholar] [CrossRef]
- Cunningham, C.X.; Williamson, G.J.; Bowman, D.M.J.S. Increasing frequency and intensity of the most extreme wildfires on Earth. Nat. Ecol. Evol. 2024, 8, 1420–1425. [Google Scholar] [CrossRef] [PubMed]
- Burton, C.; Lampe, S.; Kelley, D.I.; Thiery, W.; Hantson, S.; Christidis, N.; Gudmundsson, L.; Forrest, M.; Burke, E.; Chang, J.; et al. Global burned area increasingly explained by climate change. Nat. Clim. Change 2024, 14, 1186–1192. [Google Scholar] [CrossRef]
- Dowdy, A.J.; Ye, H.; Pepler, A.S.; Thatcher, M.; Osbrough, S.L.; Evans, J.P.; Di Virgilio, G.; McCarthy, N. Australian fire weather as represented by the McArthur Forest Fire Danger Index and the Canadian Forest Fire Weather Index. Clim. Dyn. 2019, 53, 21–39. [Google Scholar] [CrossRef]
- Shen, S.; Seneviratne, S.I.; Wanyan, X.; Kirley, M. FireRisk: A remote sensing dataset for fire risk assessment with benchmarks using supervised and self-supervised learning. arXiv 2023, arXiv:2303.07035. [Google Scholar] [CrossRef]
- Kalantar, B.; Ueda, N.; Idrees, M.O.; Janizadeh, S.; Ahmadi, K.; Shabani, F. Forest fire susceptibility prediction based on machine learning models with resampling algorithms on remote sensing data. Remote Sens. 2020, 12, 3682. [Google Scholar] [CrossRef]
- Quan, X.; Xie, Q.; He, B.; Luo, K.; Liu, X. Integrating remotely sensed fuel variables into wildfire danger assessment for China. Int. J. Wildland Fire 2021, 30, 807–821, Erratum in Int. J. Wildland Fire 2021, 30, 822. [Google Scholar] [CrossRef]
- Turner, M.G.; Brazjunas, K.H.; Hansen, W.D.; Hoecker, T.J.; Rammer, W.; Rataiczak, Z.; Westerling, A.L.; Seidl, R. The magnitude, direction, and tempo of forest change in Greater Yellowstone in a warmer world with more fire. Ecol. Monogr. 2022, 92, e01485. [Google Scholar] [CrossRef]
- Huesca, M.; Litago, J.; Palacios-Orueta, A.; Montes, F.; Sebastián-López, A.; Escribano, P. Assessment of forest fire seasonality using MODIS fire potential: A time series approach. Agric. For. Meteorol. 2009, 149, 1946–1955. [Google Scholar] [CrossRef]
- Maxwell, A.E.; Warner, T.A.V.; Erbilt, B.C.; Ramezan, C.A. Land cover classification and feature extraction from National Agriculture Imagery Program (NAIP) orthoimagery: A review. Photogramm. Eng. Remote Sens. 2017, 83, 737–747. [Google Scholar] [CrossRef]
- Farr, T.G.; Rosen, P.A.; Caro, E.; Crippen, R.; Duren, R.; Hensley, S.; Kobrick, M.; Paller, M.; Rodriguez, E.; Roth, L.; et al. The shuttle radar topography mission. Rev. Geophys. 2007, 45, RG2004. [Google Scholar] [CrossRef]
- Hersbach, H.; Bell, B.; Berrisford, P.; Hirahara, S.; Horányi, A.; Muñoz-Sabater, J.; Nicolas, J.; Peubey, C.; Radu, R.; Schepers, D.; et al. The ERA5 global reanalysis. Q. J. R. Meteorol. Soc. 2020, 146, 1999–2049. [Google Scholar] [CrossRef]
- Didan, K.; Miura, T.; Solano, R.; Huete, A.R. MODIS Vegetation Index User’s Guide; MOD13 Series; University of Arizona: Tucson, AZ, USA, 2015. Available online: https://modis.gsfc.nasa.gov/data/dataprod/mod13.php (accessed on 17 February 2025).
- Oldford, S.; Leblon, B.; Maclean, D.; Flannigan, M. Predicting slow-drying fire weather index fuel moisture codes with NOAA-AVHRR images in Canada’s northern boreal forests. Int. J. Remote Sens. 2006, 27, 3881–3902. [Google Scholar]
- Waddington, J.M.; Thompson, D.K.; Wotton, M.; Quinton, W.L.; Flannigan, M.D.; Benscoter, B.W.; Baisley, S.A.; Turetsky, M.R. Examining the utility of the Canadian Forest Fire Weather Index System in boreal peatlands. Can. J. For. Res. 2012, 42, 47–58. [Google Scholar] [CrossRef]
- Shahid, A.; Fatima, N. Integrating Satellite-Derived Indices and Support Vector Machines for Enhanced Wildfire Detection: An Empirical Study on Australian Forest Fires. Front. Comput. Spat. Intell. 2025, 3, 127–140. [Google Scholar]
- Papakis, I.; Linardos, V.; Drakaki, M. A Multimodal Ensemble Deep Learning Model for Wildfire Prediction in Greece Using Satellite Imagery and Multi-Source Remote Sensing Data. Remote Sens. 2025, 17, 3310. [Google Scholar] [CrossRef]
- Zhao, L.; Ji, S. CNN, RNN, or ViT? An evaluation of different deep learning architectures for spatio-temporal representation of sentinel time series. IEEE J. Sel. Top. Appl. Earth Obs. Remote Sens. 2022, 16, 44–56. [Google Scholar]
- Abidi, A.; Ienco, D.; Abbes, A.B.; Farah, I.R. Combining 2D encoding and convolutional neural network to enhance land cover mapping from Satellite Image Time Series. Eng. Appl. Artif. Intell. 2023, 122, 106152. [Google Scholar] [CrossRef]
- Alipour, M.; La Puma, I.; Picotte, J.; Shamsaei, K.; Rowell, E.; Watts, A.; Kosovic, B.; Ebrahimian, H.; Taciroglu, E. A multimodal data fusion and deep learning framework for large-scale wildfire surface fuel mapping. Fire 2023, 6, 36. [Google Scholar] [CrossRef]
- Yang, J.; Jiang, H.; Wang, S.; Ma, X. A multi-scale deep learning algorithm for enhanced forest fire danger prediction using remote sensing images. Forests 2024, 15, 1581. [Google Scholar] [CrossRef]
- Gorelick, N.; Hancher, M.; Dixon, M.; Ilyushchenko, S.; Thau, D.; Moore, R. Google Earth Engine: Planetary-scale geospatial analysis for everyone. Remote Sens. Environ. 2017, 202, 18–27. [Google Scholar] [CrossRef]
- Giglio, L.; Justice, C. MOD14A1 MODIS/Terra Thermal Anomalies/Fire Daily L3 Global 1km SIN Grid V006. NASA EOSDIS Land Processes DAAC 2015. Available online: https://lpdaac.usgs.gov/products/mod14a1v006/ (accessed on 15 June 2024).
- Didan, K.; Barreto, A. VIIRS/NPP Vegetation Indices 16-Day L3 Global 500m SIN Grid V001. NASA EOSDIS Land Processes DAAC 2018. Available online: https://lpdaac.usgs.gov/products/vnp13a1v001/ (accessed on 15 June 2024).
- Schroeder, W.; Oliva, P.; Giglio, L.; Quayle, B.; Lorenz, E.; Morelli, F. VIIRS active fire products: Algorithm improvements and global validation. Remote Sens. 2022, 14, 578. [Google Scholar] [CrossRef]
- [NASA] National Aeronautics and Space Administration, Land Processes Distributed Active Archive Center. MOD/MYD C6.1 MCD64A1 Burned Area Product. 2021. Available online: https://lpdaac.usgs.gov/products/mcd64a1v006/ (accessed on 15 June 2024).
- SpatialReference.org. EPSG:32611 WGS 84/UTM Zone 11N. 2024. Available online: https://spatialreference.org/ref/epsg/32611/ (accessed on 5 November 2024).
- [USDA] U.S. Department of Agriculture, Forest Service. Wildfire Potential Hazard (WHP) 2023 Classification. ArcGIS Online. 2023. Available online: https://usfs.maps.arcgis.com/home (accessed on 23 May 2024).
- Radeloff, V.C.; Helmers, D.P.; Kramer, H.A.; Mockrin, M.H.; Alexandre, P.M.; Bar-Massada, A.; Butsic, V.; Hawbaker, T.J.; Martinuzzi, S.; Stewart, S.I.; et al. Rapid growth of the US wildland-urban interface raises wildfire risk. Proc. Natl. Acad. Sci. USA 2018, 115, 3314–3319. [Google Scholar] [CrossRef] [PubMed]
- Tsai, Y.H.H.; Liang, P.P.; Zadeh, A.; Morency, L.P.; Salakhutdinov, R. Learning Factorized Multimodal Representations. arXiv 2018, arXiv:1806.06176. [Google Scholar]
- Singh, S.; Saber, E.; Markopoulos, P.P.; Heard, J. Regulating Modality Utilization within Multimodal Fusion Networks. Sensors 2024, 24, 6054. [Google Scholar] [CrossRef]
- Yuan, Q.; Wei, Y.; Meng, X.; Shen, H.; Zhang, L. A Multiscale and Multidepth Convolutional Neural Network for Remote Sensing Imagery Pan-Sharpening. IEEE J. Sel. Top. Appl. Earth Obs. Remote Sens. 2018, 11, 978–989. [Google Scholar] [CrossRef]
- Sun, Y.; Hui, J.; Bai, Z.; Liu, K.; Wang, Z. Impacts of mining on vegetation phenology and sensitivity assessment of spectral vegetation indices to mining activities in arid/semi-arid areas. J. Environ. Manag. 2023, 337, 117697. [Google Scholar] [CrossRef]
- Zribi, M.; Gorrab, A.; Baghdadi, N. A new soil roughness parameter for the modeling of radar backscattering over bare soil. Remote Sens. Environ. 2014, 152, 62–73. [Google Scholar] [CrossRef]
- Bousbih, S.; Zribi, M.; El Hajj, M.; Baghdadi, N.; Lili-Chabaane, Z. Soil moisture and irrigation mapping in a semi-arid region, based on the synergetic use of Sentinel-1 and Sentinel-2 data. Remote Sens. 2018, 10, 1953. [Google Scholar] [CrossRef]
- Dvořáková, M.; Novák, V.; Zribi, M. Mapping of surface soil parameters (roughness, moisture and texture) using one radar X-band SAR configuration over bare agricultural semi-arid region. In Proceedings of the IGARSS 2021, Brussels, Belgium, 11–16 July 2021. [Google Scholar] [CrossRef]
- Breiman, L. Random forests. Mach. Learn. 2001, 45, 5–32. [Google Scholar] [CrossRef]
- Wang, Q. Support Vector Machine Algorithm in Machine Learning. In Proceedings of the 2022 IEEE International Conference on Artificial Intelligence and Computer Applications (ICAICA), Dalian, China, 24–26 June 2022; IEEE: Piscataway, NJ, USA, 2022; pp. 750–756. [Google Scholar] [CrossRef]
- Chen, T.; Guestrin, C. XGBoost: A scalable tree boosting system. In Proceedings of the 22nd ACM SIGKDD International Conference on Knowledge Discovery and Data Mining, San Francisco, CA, USA, 13–17 August 2016; Association for Computing Machinery: New York, NY, USA, 2016; pp. 785–794. [Google Scholar] [CrossRef]
- Ke, G.; Meng, Q.; Finley, T.; Wang, T.; Chen, W.; Ma, W.; Ye, Q.; Liu, T.-Y. LightGBM: A highly efficient gradient boosting decision tree. Adv. Neural Inf. Process Syst. 2017, 30, 3146–3154. [Google Scholar]
- Paszke, A.; Gross, S.; Massa, F.; Lerer, A.; Bradbury, J.; Chanan, G.; Killeen, T.; Lin, Z.; Gimelshein, N.; Antiga, L.; et al. PyTorch: An imperative style, high-performance deep learning library. In Proceedings of the 33rd International Conference on Neural Information Processing Systems, Vancouver, BC, Canada, 8–14 December 2019; Curran Associates: Red Hook, NY, USA, 2019; pp. 8026–8037. [Google Scholar]
- Vaswani, A.; Shazeer, N.; Parmar, N.; Uszkoreit, J.; Jones, L.; Gomez, A.N.; Kaiser, Ł.; Polosukhin, I. Attention is all you need. Adv. Neural Inf. Process Syst. 2017, 30, 5998–6008. [Google Scholar]
- Li, H.; Wang, Y.; Zhang, J.; Liu, X.; Chen, Z. A transformer-based fusion framework for wildfire risk assessment using heterogeneous geospatial data. Remote Sens. Environ. 2023, 287, 113482. [Google Scholar] [CrossRef]
- Hochreiter, S.; Schmidhuber, J. Long short-term memory. Neural Comput. 1997, 9, 1735–1780. [Google Scholar] [CrossRef]
- Tan, M.; Le, Q.V. EfficientNet: Rethinking model scaling for convolutional neural networks. Proc. Mach. Learn. Res. 2019, 97, 6105–6114. [Google Scholar]
- Tan, M.; Chen, B.; Pang, R.; Vasudevan, V.; Sandler, M.; Howard, A.; Le, Q.V. EfficientNetV2, Smaller models and faster training. Proc. Mach. Learn. Res. 2021, 139, 10096–10106. [Google Scholar]
- [IPCC] Intergovernmental Panel on Climate Change. Climate Change 2023: Synthesis Report; Cambridge University Press: Cambridge, UK, 2023. [Google Scholar] [CrossRef]
- Fusco, E.J.; Abatzoglou, J.T.; Balch, J.K.; Finn, J.T.; Bradley, B.A. Quantifying the human influence on fire ignition across the western USA. Ecol. Appl. 2016, 26, 2390–2401. [Google Scholar] [CrossRef]
- Baillie, B.R.; Bayne, K.M. The historical use of fire as a land management tool in New Zealand and the challenges for its continued use. Landsc. Ecol. 2019, 34, 2229–2244. [Google Scholar] [CrossRef]
- Bento-Gonçalves, A.; Vieira, A. Wildfires in the wildland-urban interface: Key concepts and evaluation methodologies. Sci. Total Environ. 2020, 707, 135592. [Google Scholar] [CrossRef] [PubMed]
- Szpakowski, D.M.; Jensen, J.L.R. A review of the applications of remote sensing in fire ecology. Remote Sens. 2019, 11, 2638. [Google Scholar] [CrossRef]


Disclaimer/Publisher’s Note: The statements, opinions and data contained in all publications are solely those of the individual author(s) and contributor(s) and not of MDPI and/or the editor(s). MDPI and/or the editor(s) disclaim responsibility for any injury to people or property resulting from any ideas, methods, instructions or products referred to in the content. |
© 2025 by the authors. Published by MDPI on behalf of the International Society for Photogrammetry and Remote Sensing. Licensee MDPI, Basel, Switzerland. This article is an open access article distributed under the terms and conditions of the Creative Commons Attribution (CC BY) license (https://creativecommons.org/licenses/by/4.0/).