Abstract
The positive and negative terrains (P–N terrains) of the Loess Plateau of China are important geographical topography elements for measuring the degree of surface erosion and distinguishing the types of landforms. Loess shoulder-lines are an important terrain feature in the Loess Plateau and are often used as a criterion for distinguishing P–N terrains. The extraction of shoulder lines is important for predicting erosion and recognising a gully head. However, existing extraction algorithms for loess shoulder-lines in areas with insignificant slopes need to be improved. This study proposes a regional fusion (RF) method that integrates the slope variation-based method and region-growing algorithm to extract loess shoulder-lines based on a Digital Elevation Model (DEM) at a spatial resolution of 5 m. The RF method introduces different terrain factors into the growth standards of the region-growing algorithm to extract loess-shoulder lines. First, we employed a slope-variation-based method to build the initial set of loess shoulder-lines and used the difference between the smoothed and real DEMs to extract the initial set for the N terrain. Second, the region-growing algorithm with improved growth standards was used to generate a complete area of the candidate region of the loess shoulder-lines and the N terrain, which were fused to generate and integrate contours to eliminate the discontinuity. Finally, loess shoulder-lines were identified by detecting the edge of the integrated contour, with results exhibiting congregate points or spurs, eliminated via a hit-or-miss transform to optimise the final results. Validation of the experimental area of loess ridges and hills in Shaanxi Province showed that the accuracy of the RF method based on the Euclidean distance offset percentage within a 10-m deviation range reached 96.9% compared to the manual digitalisation method. Based on the mean absolute error and standard absolute deviation values, compared with Zhou’s improved snake model and the bidirectional DEM relief-shading methods, the proposed RF method extracted the loess shoulder-lines highly accurately.
1. Introduction
The Loess Plateau of China has received widespread attention because of its strong water loss and soil erosion [1,2,3,4]. Any terrain can be abstracted into three types of elements: points, lines, and surfaces with accurate spatial coordinates. Not only does the extraction of topographic feature lines have important applications in automatic geomorphological synthesis, hydrological analysis, and geographical information system (GIS) analysis, but it is also of great significance for managing soil erosion, guiding ecological restoration of the Loess Plateau, and regional sustainable development [5]. Given the importance of terrain feature lines, several studies have explored extraction methods for terrain feature lines. Yanan et al. [6] fused a digital orthophoto model (DOM) with slope data to extract terrace edges using the Canny edge operator. Mao et al. [7] used the U-Net model as an intermediate step in the extraction of drainage networks. As an important topographic line in the Loess Plateau, the shoulder-line separates the complicated landform of the Loess Plateau into inter-gully and inner-gully areas, also known as positive and negative terrains (P–N terrain), respectively, in terms of the formation of landforms [8,9]. The shoulder-line can also be used to recognise the gully head and prevent gully erosion [10,11]. A typical terrain profile near the loess shoulder-line is shown in Figure 1, which also indicates the boundary between the positive (AB) and negative (BC) terrains. The position of the shoulder-line on a typical terrain is shown in Figure 2.
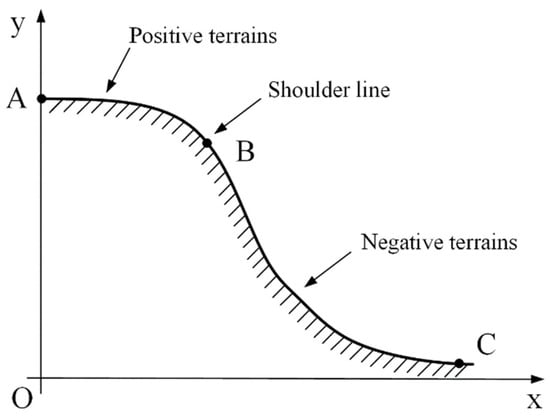
Figure 1.
Illustration of a typical terrain profile near the loess shoulder-line [9].
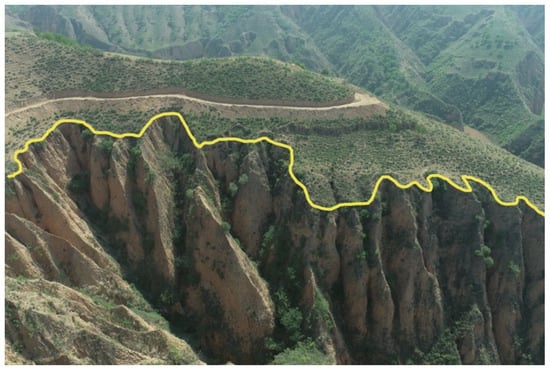
Figure 2.
Location of the shoulder-line in the Loess Plateau of China.
The extraction of loess shoulder-lines along complex and broken loess landforms is a challenging but significant research area [12]. In the 1990s, owing to the diverse surface information contained in high-resolution remote sensing images and topography maps, the manual extraction of loess shoulder-lines provided a great advantage, but is however a low-efficiency and time-consuming method [13].
For nearly two decades, with the development of GIS technology and widespread application of digital elevation models (DEM), algorithms for the automatic extraction of loess shoulder-lines have become increasingly popular. Lu et al. [14] and Tang et al. [15] developed a method to distinguish shoulder-line points by using slope variation near the shoulder-lines. Zhou et al. [8] summarised the different features and characteristics of points on the loess shoulder-lines to extract candidate points and used the aspect and slope matrix derived from 5-m resolution DEM data to expand the candidate points to reduce the disconnect of the shoulder-line. Yan [16] compared the difference between the edge detectors and used a Laplacian of Gaussian (LoG) detector to achieve an effective performance in the extraction of the shoulder-lines. Chen et al. [17] used a principal component analysis (PCA) to extract the shoulder-lines. These methods cannot extract a complete shoulder-line and require a window filter whose size can significantly change the accuracy of the results.
To solve the shoulder-line discontinuity problem, the snake model was adopted with acceptable accuracy [9,18], where the initial contour line was set to iterate over the candidate points to generate a complete loess shoulder-line once the candidate point was calculated using an appropriate method. Zhou et al. [19] used the hillslope flow direction field instead of the gradient vector flow field in a snake model to obtain improved results with acceptable accuracies. The limitation of the snake extraction method is that the topographical features of the break area are not considered, and the extraction accuracy is adversely affected unless the number of iterations is appropriately set. Jiang et al. [20] used an efficient Marr–Hildreth operator and terrain mask to extract the shoulder-lines. Inspired by this method, Na et al. [21] developed a bidirectional DEM hillshade model to extract the loess shoulder-lines. This method fuses two sources of illumination orientations of hillshades calculated using DEM data and uses a certain threshold to turn the fused image into a binary image to extract the shoulder-lines, which reduces the running time of the algorithm. Although studies have extensively explored methods to extract the loess shoulder-lines, these extraction algorithms do not perform well in areas with gentle slopes along the shoulder lines and remain to be improved in terms of extraction accuracy. The region-growing algorithm is a process of region-merging based on the similarity between image elements and which provides advantages in raster image segmentation and boundary extraction. Sun et al. [22] used a region-growing algorithm for the segmentation of valleys in the DEM and remote sensing images. Luo et al. [23] used a regional-growing algorithm to extract terraces of the Loess Plateau. Using this algorithm, Li et al. [24] identified the erosion area on the slope of a tailings dam. Simultaneously, the employment of a digital terrain analysis through multiple terrain factors is becoming mainstream [25]. These studies provide new insights into introducing the region-growing algorithms into the extraction process of shoulder-lines.
This study aimed to present a new and accurate approach to extract loess shoulder-lines, which integrated the region-growing algorithm and slope variation-based method. We optimised the growth standards of the region-growing algorithm by incorporating topographic feature factors into the growth standards so that this algorithm could be applied to extract loess shoulder-lines. The region-growing algorithm was used to generate the candidate region of the shoulder-lines and the negative region [26]. The two regions were then fused to form a complete area, and noise and terraces were eliminated. Edge detection was used to extract the edges of the shoulder-lines. Finally, the hit-or-miss transform (HMT) was employed to eliminate the spur and congregate points of the loess shoulder-lines. The results showed that our proposed method could achieve a more accurate extraction of the loess shoulder-lines than other methods.
2. Materials and Methods
2.1. Study Area
The study area is situated on the Loess Plateau, China, as shown in Figure 3a. Representative loess ridges and hill landforms, the two test areas of Suide and Yan’an, were chosen in this study, as shown in Figure 3b,c. Erosion of the loess tableland forms loess ridges and long strips of hilly loess. Loess hills are conical dunes mainly located in the northern Loess Plateau.
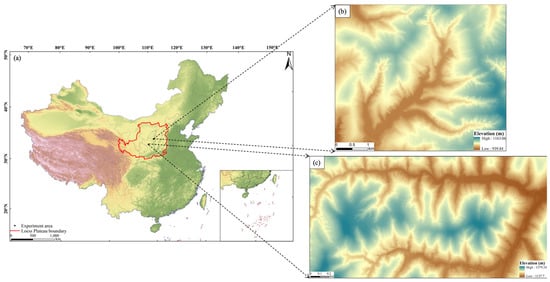
Figure 3.
Location of the shoulder line in the Loess Plateau of China. (a) The Loess Plateau and the location of the study area in China; (b) DEM of the Suide study area; (c) DEM of the Yan’an study area.
To obtain highly accurate DEM data, we undertook fieldwork and used a DJI drone to capture photos with a 60% overlap. We processed the captured photos using Photoscan software by importing them into the software and selecting the appropriate coordinate system and projection method. The photos were then aligned based on the alignment accuracy and filter parameters to produce point cloud data. We selected the desired DEM resolution and interpolation method to create and generate the corresponding DEM. Both Yan’an and Suide datasets were produced in 2021, generating DEMs with a 5-m resolution.
In addition, the DOM data at a spatial resolution of 0.1 m of the corresponding area were used in the manual interpretation to outline the shoulder lines, which served as a criterion to evaluate the algorithm accuracy.
2.2. The Proposed Extraction Method
2.2.1. Extraction Process
The proposed extraction method based on regional fusion (RF) consists of the following four major steps (Figure 4): First, preparing the dataset and calculating the flow direction, curvature, topographic position index (TPI), slope, hillshade, and smoothing-processed DEM using a no-depression DEM. Second, selecting the candidate points by using the water flow direction simulated using the routine algorithm of the hydrological water flow and slope calculated using the DEM data, and then using the region-growing algorithm to generate the candidate region of shoulder lines. The deterministic 8 (D8) algorithm was used to determine one of the eight flow directions in each grid [27,28]. Third, extracting the initial negative set by calculating the difference between the DEM and smooth-processed DEM and using the region-growing algorithm to generate the negative region. Finally, merging the two regions and eliminating noise. After the edge detection algorithm was used to extract the shoulder line, the HMT was adopted to optimise the extraction results.
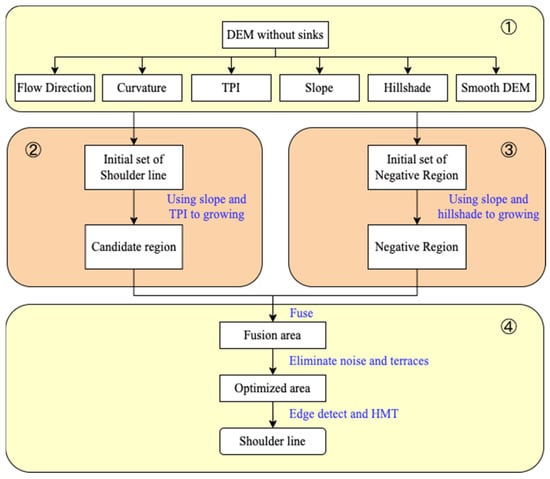
Figure 4.
Flowchart of the proposed extraction method of loess shoulder-lines.
2.2.2. Extraction of Candidate Region
The region-growing algorithm is the process of aggregating similar grids or sub-regions into larger areas according to growing standards. The idea of region growing was to start with a set of initial points and merge the eight grids around the starting points if the neighbor grids exhibited similar or identical properties (Figure 5); this process was repeated until there were no points to be merged.
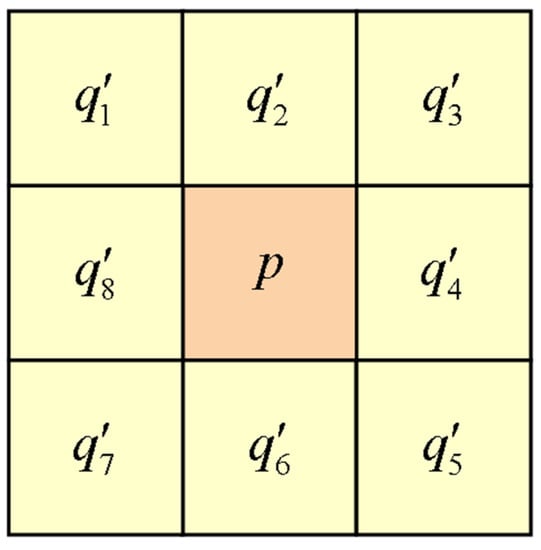
Figure 5.
The eight neighbors of grids.
The traditional growing standard is based on the difference in grey values between the candidate point and eight neighbors, as shown in Figure 6. If the difference is less than a certain threshold, then the final region can be expanded. Owing to the complexity of the topography of the Loess Plateau, the results extracted from the traditional growing standard using a single characteristic value had low accuracy.
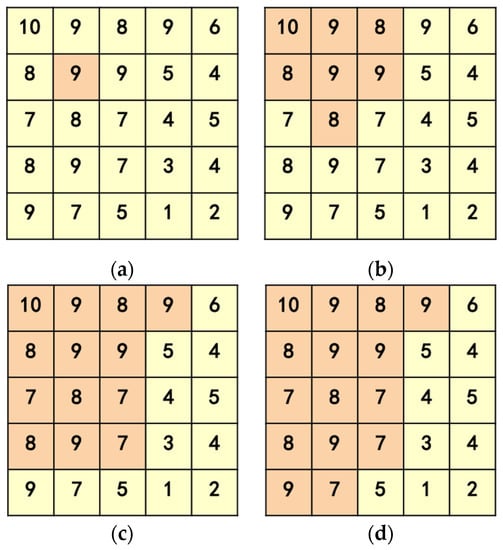
Figure 6.
The different stages of region growing algorithm. (a) Initial growth points; (b) first eight directional growth; (c) second eight directional growth; (d) meet termination conditions.
Therefore, we propose a new method that uses multiple factors of topographical features to set the growing standard as follows:
where is the location of each pixel in the matrix, and are different topographical feature factors, and and are the weights of each terrain feature factor. Subsequently, the region can be expanded as
where is the result for the centre pixel calculated using Equation (1), and refers to the difference between the centre cell and its eight neighbours. If the result is less than a certain threshold, a neighbour can be added to the region. The region-growing method was used to extract the candidate and negative regions.
To obtain a set of candidate points for the shoulder-lines, the flow direction matrix was calculated using the D8 algorithm [27]. The flow direction represented the steepest descending direction of the current point along the eight neighbours, and each point could obtain the upstream and downstream information according to the flow direction. The slope matrix was then calculated using the DEM data. If the slope of the current point is larger than the slope threshold, then the mean slope downstream must be larger than that upstream. The discrepancy must be larger than a certain value so that the current point can be added to the initial set [8]. A region-growing algorithm was then used to expand the initial set. The growing standard equation considered the feature factors of the slope terrain and TPI of the elevations and grew into the final candidate region. The topographic position index is the difference between the centre grid elevation and the average elevation of its local window around the pixel, which reflects variations in the elevation [7,29]. The extraction steps for the candidate regions of the shoulder-lines are shown in Algorithm 1.
| Algorithm 1 Iterative calculation of Shoulder-line candidate region | |
| Input: Grids.DEM | |
| Output: Grids.CandidateRegion | |
| 1: | for |
| 2: | for do |
| 3: | if then |
| 4: | |
| 5: | if then |
| 6: | Queue include candidate points of shoulderline |
| 7: | end if |
| 8: | end if |
| 9: | end for |
| 10: | end for |
| 11: | while |
| 12: | |
| 13: | |
| 14: | for do |
| 15: | Equations(1) and (2) |
| 16: | if then |
| 17: | |
| 18: | end if |
| 19: | end for |
| 20: | |
| 21: | end while |
2.2.3. Extraction of Negative Region
The candidate regions extracted in the previous step are scattered. To simply extract the loess shoulder-line, the negative region must be extracted to generate a complete region. As shown in Figure 7, a highly continuous value is calculated after the smoothing process [30,31]. The processed terrain has a lower positive terrain and a higher negative terrain than the real terrain. The real terrain DEM was subtracted from the smoothing-processed DEM, and cells were selected as the initial seed of the region-growing algorithm if the value was less than zero. Then, the ortho hillshade and slope calculated using the DEM were adopted to determine the growing guidelines. The hillshade model, also known as the shaded relief, has been adopted in many studies and is a terrain visualisation technique which utilises light for simulation [32,33]. Hillshade creates hypothetical illumination of a surface by setting a position for a light source, computed as a grey value of 0–255. After the initial negative region expanded, most of the negative terrain was extracted.
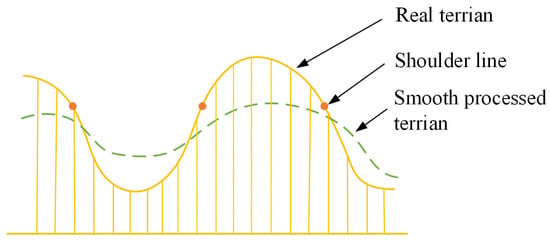
Figure 7.
Illustration of smoothed terrain and the position of shoulder line.
2.2.4. Extraction of Shoulder Lines and Optimisation
After expanding the candidate region of the shoulder line and the negative region using the region-growing algorithm, we merged the two into a larger area and reclassified it into a matrix with a 0–1 value. An area with a value of 1 represents the integration of the negative terrain, also called the inner-gully area. An area with a value of 0 denotes a positive terrain or an inter-gully area. There could be some holes or isolated areas called noise, and the edges of the terraces could be extracted because the features of the terraces were highly similar to those of the shoulder-lines, which affected the extraction accuracy. The search algorithm of the octree was used to eliminate the isolated area in the positive terrain and fill the holes in the negative area [34], which could also be eliminated. Subsequently, the shoulder-line was extracted using a 3 × 3-window edge detector, whose value was 1 for the centre point and 0 for any of the eight neighbours. If the merged region matched this detector, the grid was marked as a shoulder-line. Therefore, we extracted a continuous and complete shoulder-line.
Since we are using an edge detection operator that scans along the eight directions of a point, it may result in clustered points and spurs that are not originally part of the shoulder-line, which could affect the vectorisation and extraction accuracy. As shown in Figure 8, the coloured points are represented as partially extracted loess shoulder-lines, the yellow points represent the correctly classified points of the shoulder-line, the green and orange points represent the clustered points and spurs that need to be removed via the HMT, because of incorrect classification due to edge detection, respectively. Morphological HMT is the localisation operator in mathematical morphology; it finds the occurrences of an object and its nominal surroundings in a set or an image and uses template matching to select pixels with certain geometric properties [35].

Figure 8.
A part of extracted shoulder line.
The hit-or-miss transform of A by B is denoted by A ⊗ B. As shown in Figure 9, A is the original binary value of the image or set and B is the structuring element pair consisting of C and D. The black grids represent the value of 0, the white grids represent the value of 1, and the grey grids do not need to be considered.
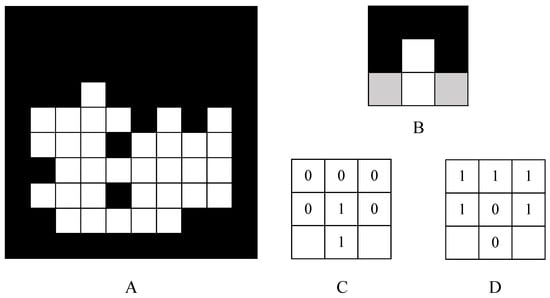
Figure 9.
Hit-or-miss transform. (A) Original region needs to be improved; (B) structure element; (C) denotes each pixel value of B; (D) complement set of B.
The hit or miss transform is defined as follows.
where is the complement set of A and is the erosion operator. The results of the HMT were all locations that matched the pixels in C and none of the pixels in D. The structural elements, as shown in Figure 10, needed to be flipped up, down, left, and right. If they could match the original image, the centre grid needed to be set to 0.
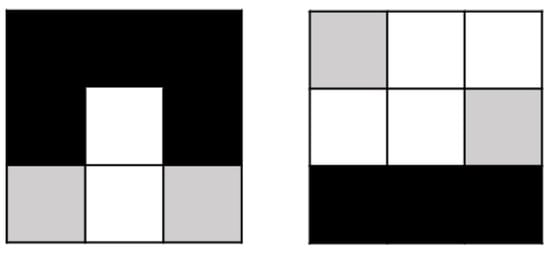
Figure 10.
Structure elements.
2.3. Experiment and Assessment
2.3.1. The Reference of Shoulder Line
For comparison, we used manual interpretation to extract the real loess shoulder-lines via the DOM data at a spatial resolution of 0.1 m, as shown in Figure 11. In the DOM data, the loess shoulder-lines were easy to recognise, and the extraction error was negligible. Manual interpretation of the loess shoulder-lines based on the DOM data required more experience with the interpretation of remote sensing images and could clearly distinguish different loess geomorphic features. Different land types and degrees of soil sensitivity to erosion were used to extract the loess-shoulder line, which was considered the reference and standard for assessing the extraction accuracy of the method.
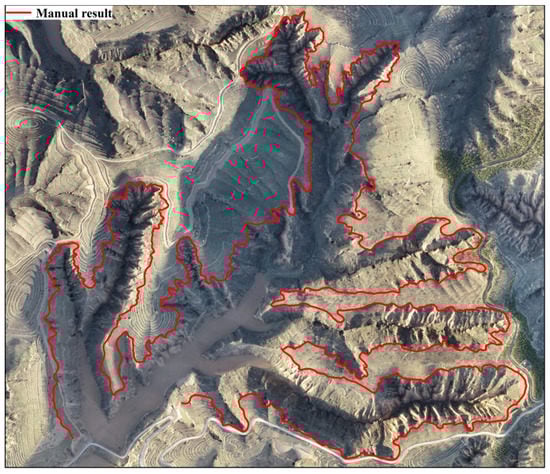
Figure 11.
Manual interpretation of shoulder-line.
2.3.2. Selection of Algorithms for Comparison
This study presented the comparisons of the proposed method with Zhou’s [8] improved snake model (ISM) [19] and bidirectional DEM relief-shading (BRS) methods [21]. Zhou’s method uses the following quantitative characteristics of points on loess shoulder-lines: (1) the points on the shoulder-line must be larger than the slope threshold; (2) the slope below the fracture line should be greater than that above the fracture line; and (3) the discrepancy must be greater than the mean slope difference threshold [8]. The variations in the slopes between locations on either side of the shoulder-lines are influenced by the type of landform present. Each landform has distinctive topographical features that impact the gradient of the terrain. In the loess tableland region, the slope differences tend to be more significant due to the rugged terrain. On the other hand, in the loess ridges and hills region, where the hills gently roll, the differences in slope may be less pronounced. In the experiment, the slope threshold of Zhou’s method (St) was set to 35°, and its mean slope difference threshold (MSDt) was set to 11° to achieve high accuracy. The ISM method uses the candidate points of the shoulder-line extracted from Zhou’s method and the hillslope flow direction matrix in the snake model to generate continuous shoulder-lines by continuously approximating the candidate points using the snake model. The number of iterations for the snake model in the experiment was set to 30. The BRS method simulated two hillshade images with an appropriate altitude and symmetric direction of light, fusing the two images and setting a threshold to extract the final result [21]. In our experiment, the BRS method used two sources of illumination orientations of 135° and 315° because they are often used to simulate shaded relief images.
2.3.3. Assessment
Except for the visual evaluation of the loess shoulder-line, the Euclidean distance offset percentage (EDOP), mean absolute error (MAE), and standard absolute deviation (SAD) values were employed to quantify the accuracy of the different extraction methods of the loess shoulder-lines (Jiang, Tang, and Liu 2015). First, the Euclidean distance raster layer (EDRLσ) with a certain distance (σ) (5, 10, and 15 m) was calculated using manually extracted loess shoulder-lines. Subsequently, the shoulder lines with different distance values intersect with the EDRL. If a pixel was within the EDRL buffer, it was regarded as a part of the shoulder-line. Finally, the ratio of the pixels within the EDRL buffer to the total pixels is the extraction accuracy of the loess shoulder-line. The larger the EDOP value, the higher the accuracy of the extraction method.
Otherwise, the MAE value was derived from the difference between the calculated shoulder-line and the reference data and the mean deviation of the extracted shoulder-line and the real shoulder-line. The smaller the MAE value, the closer the extracted shoulder-line is to the reference shoulder-line. The MAE value is estimated as follows:
In addition, the SAD was adopted to evaluate the similarity to the contour profile of the manually extracted references of the loess shoulder-line. The smaller the SAD value, the more consistent is the contour between the extracted shoulder-line and the reference shoulder-line. The value of the SAD is estimated as follows:
3. Results and Discussion
3.1. Results
The results of fusion for the negative regions and candidate regions for different experimental regions are shown in Figure 12a,b. Some of the noise generated in the previous step was eliminated. The final extraction of the loess shoulder-line in the two test areas is illustrated in Figure 12c,d and is used in this step to optimise the final extraction.
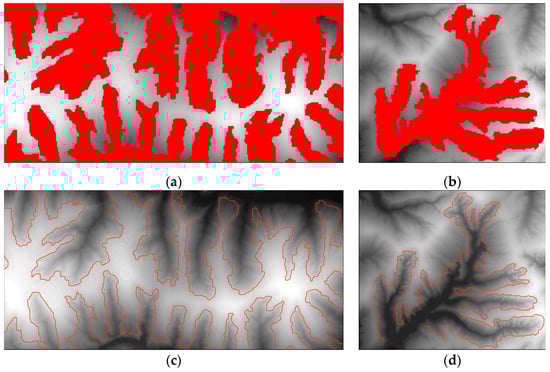
Figure 12.
Extraction process of the two test sites. (a) Region fusion result of Yan’an area; (b) region fusion result of Suide area; (c) shoulder-line of Yan’an area; (d) shoulder-line of Suide area.
The extraction results of Zhou’s method are compared with the manual results in Figure 13a. The shoulder-lines extracted using Zhou’s method were incomplete, and there were areas of disconnection. In some areas, the difference in the slope below and above the shoulder-line was subtle; therefore, this method could not extract the shoulder-lines in this region, which resulted in the discontinuity of the shoulder-line. In some areas with pronounced slope changes, the extracted shoulder-line was thick and rough, which also caused noise that did not belong to this line. The ISM method uses the candidate points of the shoulder-line extracted via Zhou’s method, and the snake model is used to extract the complete shoulder-line. The ISM method did not consider the topographic features of the disconnected areas, resulting in an insufficient extraction effect (Figure 13b). The shoulder-line extraction results of the BRS method are shown in Figure 13c, showing a complete shoulder-line compared to that of Zhou’s method. The extraction of the BRS method was not sufficient to generate a hillshade by simulating the different sources of illumination orientations because the extracted shoulder-lines in some complex areas significantly deviated from the reference shoulder-line. The results of the proposed method are shown in Figure 13d. Because the region-growing algorithm was adopted to expand similar pixels of the candidate points, the proposed method could adapt to slight slope changes and complex terrains. As shown in the extraction results in Figure 14 and Figure 15, compared with the other extraction methods, the proposed method yielded an accurate estimation of the real shoulder-lines, even in areas with insignificant slope changes.
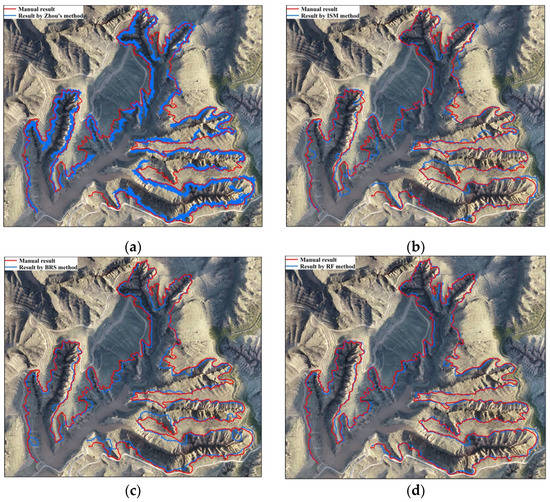
Figure 13.
Results of the different extraction methods. (a) Result of Zhou’s method; (b) result of ISM method; (c) result of BRS method; (d) result of RF method.
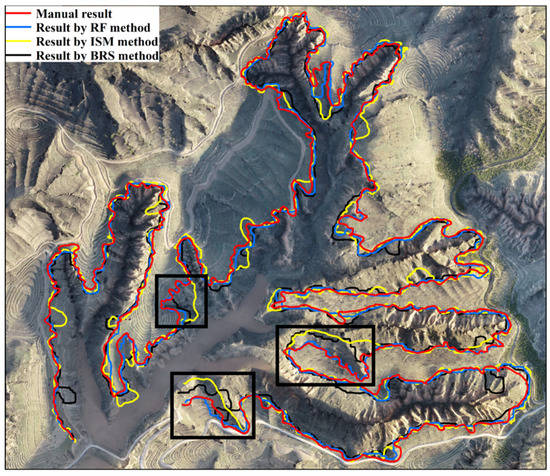
Figure 14.
Comparisons of the proposed method with the three extraction methods.
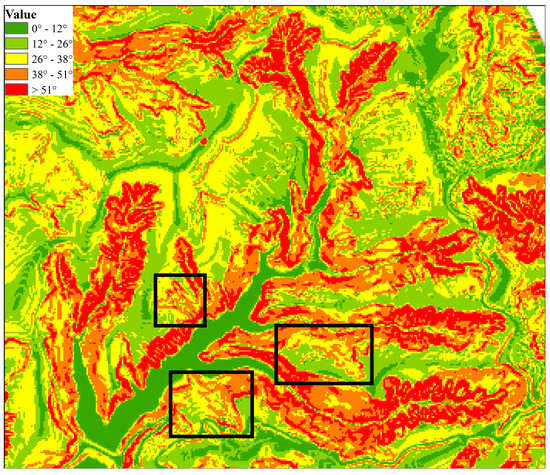
Figure 15.
Slope of the experimental areas.
3.2. Accuracy Assessment
In the experiment, a growing standard was used to expand the initial set of the candidate regions. The parameters α and β proposed in the growing standard influence the extraction accuracy. As shown in Figure 16, when α = 0.7 and β = 0.3, the highest accuracy was achieved. In other words, the feature factors of the terrain slope appear to affect the growth results more than the TPI values. The purpose of extracting the negative region was to merge it with the candidate region to obtain a continuous line and extract the shoulder by using edge detection, so that the extraction precision would not be sensitive to the different parameters of the growing standard of the negative region. Thus, 0.5 was selected as a proper value for both parameters α and β.
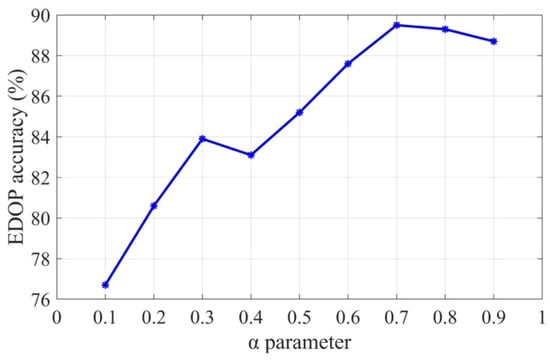
Figure 16.
Relationship between the parameter of α and EDOP accuracy.
Table 1 illustrates the EDOP accuracy of all four methods under the three distances and shows that, under the condition of 10 m of deviation, the EDOP accuracy of the proposed RF method achieved the highest value, which was 96.9%. Compared with 19.5% for Zhou’s method, 9.6% for the ISM method, and 9.4% for the BRS method, only 3.2% of the pixels in the proposed method differed from those in the reference shoulder line, with a deviation of 15 m.

Table 1.
A comparison of EDOP accuracy of the four extraction methods under the three distances.
All four methods were compared based on MAE and SAD. As shown in Table 2, the MAE value of the proposed method is smaller than those of the other methods. In other words, the loess shoulder-lines extracted using the RF method were closer to the reference data than those obtained using the other methods. The mean deviation of the RF method was no more than one pixel compared to that of the Zhou, ISM, and BRS methods. The SAD value indicated that the shoulder-line contour estimated using the RF method was morphologically closer to the reference data than the other methods. Overall, the proposed RF method achieved the highest accuracy and best fit with the reference data of the loess shoulder-lines.
Table 2.
MAE and SAD values of the four extraction methods.
4. Conclusions
Based on the previous extraction algorithms of loess shoulder-lines, this study proposed an integrative extraction method by which a region-growing algorithm based on a variety of terrain feature factors of the growing standard was employed to generate a complete shoulder-line. The octree search algorithm was adopted to eliminate noise and terraces. A hit-or-miss transform was used to remove the spurs and improve the extraction accuracy. The sensitivity analysis showed that the proposed extraction method achieved the highest EDOP accuracy when α = 0.7 and β = 0.3. The validation analysis showed that the proposed method outperformed the Zhou, ISM, and BRS methods, with the highest performance accuracy in both qualitative and quantitative terms.
Nevertheless, the following four main issues warrant further exploration. First, uncertainties were associated with some regions near the ridgeline, which need to be minimised. Second, this study only used two terrain feature factors to generate the growing standard, and more terrain feature factors need to be considered in the proposed algorithm. Third, the study area was mainly located on loess ridges and hill landforms, and the generalisability of the proposed method needs to be tested on loess tableland landforms. Finally, this study only used the DEM at a spatial resolution of 5 m, with different DEM resolutions remaining to be taken into account in the future studies.
Author Contributions
Conceptualization, Hongming Zhang and Zihan Liu; methodology, Zihan Liu and Liang Dong; software, Zhitong Sun and Linlin Yuan; validation, ZihanLiu and Liang Dong; investigation, Zhenfei Wang and Qimeng Jia; data curation, Shufang Wu and Biao Zhang; writing, Zihan Liu and Hongming Zhang; visualization, Zihan Liu and Zhitong Sun; funding acquisition, Hongming Zhang. All authors have read and agreed to the published version of the manuscript.
Funding
This research received no external funding.
Data Availability Statement
Data available on request due to restrictions eg privacy or ethical. The data presented in this study are available on request from the corresponding author.
Acknowledgments
This research was supported by Key Research and Development Program of Shaanxi Province (2023-YBNY-217, 2023-ZDLNY-69, 2022GD-TSLD-46), National Natural Science Foundation of China (41771315, 42125705).
Conflicts of Interest
The authors declare no conflict of interest.
References
- Wen, X.; Zhen, L. Soil erosion control practices in the Chinese Loess Plateau: A systematic review. Environ. Dev. 2020, 34, 100493. [Google Scholar] [CrossRef]
- Wen, X.; Deng, X. Current soil erosion assessment in the Loess Plateau of China: A mini-review. J. Clean. Prod. 2020, 276, 123091. [Google Scholar] [CrossRef]
- Feng, S.; Wu, L.; Liang, B.; Wang, H.; Liu, H.; Zhu, C.; Li, S. Forestation does not necessarily reduce soil erosion in a karst watershed in southwestern China. Prog. Phys. Geogr. Earth Environ. 2021, 45, 82–97. [Google Scholar] [CrossRef]
- Wei, H.; Li, S.; Li, C.; Zhao, F.; Xiong, L.; Tang, G. Quantification of Loess Landforms from Three-Dimensional Landscape Pattern Perspective by Using DEMs. ISPRS Int. J. Geo-Inf. 2021, 10, 693. [Google Scholar] [CrossRef]
- Cheng, J.; Yin, Y. A Ridge-Valley Line Extraction Method on Hole Filling of Groove Point Cloud. J. Phys. Conf. Ser. 2020, 1601, 042002. [Google Scholar] [CrossRef]
- Yanan, Y.; Yang, K.; Xiao, F.; Yadong, C.; Hanwen, Z.; Hongming, Z. Edge extraction method of remote sensing UAV terrace image based on topographic feature. Smart Agric. 2019, 1, 50–61. [Google Scholar] [CrossRef]
- Mao, X.; Chow, J.K.; Su, Z.; Wang, Y.-H.; Li, J.; Wu, T.; Li, T. Deep learning-enhanced extraction of drainage networks from digital elevation models. Environ. Model. Softw. 2021, 144, 105135. [Google Scholar] [CrossRef]
- Zhou, Y.; Tang, G.; Yang, X.; Xiao, C.; Zhang, Y.; Luo, M. Positive and negative terrains on northern Shaanxi Loess Plateau. J. Geogr. Sci. 2010, 20, 64–76. [Google Scholar] [CrossRef]
- Yan, S.; Tang, G.; Li, F.; Zhang, L. Snake model for the extraction of loess shoulder-line from DEMs. J. Mt. Sci. 2014, 11, 1552–1559. [Google Scholar] [CrossRef]
- Jiang, C.; Fan, W.; Yu, N.; Nan, Y. A New Method to Predict Gully Head Erosion in the Loess Plateau of China Based on SBAS-InSAR. Remote Sens. 2021, 13, 421. [Google Scholar] [CrossRef]
- Li, Z.; Zhang, Y.; Zhu, Q.; Yang, S.; Li, H.; Ma, H. A gully erosion assessment model for the Chinese Loess Plateau based on changes in gully length and area. Catena 2017, 148, 195–203. [Google Scholar] [CrossRef]
- Cao, J.; Na, J.; Li, J.; Tang, G.; Fang, X.; Xiong, L. Topographic Spatial Variation Analysis of Loess Shoulder Lines in the Loess Plateau of China Based on MF-DFA. ISPRS Int. J. Geo-Inf. 2017, 6, 141. [Google Scholar] [CrossRef]
- Zhang, L.; Tang, G.; Li, F.; Xiong, L. A review on research of loess shoulder-line. Geogr. Geo-Inf. Sci. 2012, 28, 44–48. [Google Scholar] [CrossRef]
- Lu, Z.; Qian, G.; Chen, Y. Study of automated extraction of shoulder line of valley from grid digital elevation data. Sci. Geogr. Sin. 1998, 18, 567–573. [Google Scholar] [CrossRef]
- Tang, G.; Xiao, C.; Jia, D.; Yang, X. DEM based investigation of loess shoulder-line. In Proceedings of the Geoinformatics 2007: Geospatial Information Science, Nanjing, China, 25–27 May 2007; pp. 854–865. [Google Scholar]
- Yan, S.; Tang, G.; Li, F.; Dong, Y. An Edge Detection Based Method for Extraction of Loess Shoulder-Line from Grid DEM. Geomat. Inf. Sci. Wuhan Univ. 2011, 36, 363–367. [Google Scholar] [CrossRef]
- Chen, Y.; Tang, G.; Zhou, Y.; Li, F.; Yan, S.; Zhang, L. The positive and negative terrain of loess plateau extraction based on the multi-azimuth DEM shaded relief. Sci. Geogr. Sin. 2012, 32, 105–109. [Google Scholar] [CrossRef]
- Song, X.; Tang, G.; Li, F.; Jiang, L.; Zhou, Y.; Qian, K. Extraction of loess shoulder-line based on the parallel GVF snake model in the loess hilly area of China. Comput. Geosci. 2013, 52, 11–20. [Google Scholar] [CrossRef]
- Zhou, Y.; Tang, G.; Xi, Y.; Tian, J. A shoulder-lines connection algorithm using improved Snake model. Geomat. Inf. Sci. Wuhan Univ. 2013, 38, 82–85. [Google Scholar] [CrossRef]
- Jiang, S.; Tang, G.; Liu, K. A new extraction method of loess shoulder-line based on Marr-Hildreth operator and terrain mask. PLoS ONE 2015, 10, e0123804. [Google Scholar] [CrossRef]
- Na, J.; Yang, X.; Dai, W.; Li, M.; Xiong, L.; Zhu, R.; Tang, G. Bidirectional DEM relief shading method for extraction of gully shoulder line in loess tableland area. Phys. Geogr. 2017, 39, 368–386. [Google Scholar] [CrossRef]
- Sun, X.; Wang, B.; Liu, K. Dem and valley segmentation in remote sensing image based on region growing algorithm. J. Phys. Conf. Ser. 2020, 1693, 012174. [Google Scholar] [CrossRef]
- Luo, L.; Li, F.; Dai, Z.; Yang, X.; Liu, W.; Fang, X. Terrace extraction based on remote sensing images and digital elevation model in the loess plateau, China. Earth Sci. Inform. 2020, 13, 433–446. [Google Scholar] [CrossRef]
- Li, Q.; Geng, J.; Song, D.; Nie, W.; Saffari, P.; Liu, J. Automatic recognition of erosion area on the slope of tailings dam using region growing segmentation algorithm. Arab. J. Geosci. 2022, 15, 438. [Google Scholar] [CrossRef]
- Lazzari, M. High-resolution LiDAR-derived DEMs in hydrografic network extraction and short-time landscape changes. In Proceedings of the Computational Science and Its Applications–ICCSA 2020: 20th International Conference, Cagliari, Italy, 1–4 July 2020; pp. 723–737. [Google Scholar]
- Vo, A.V.; Truong-Hong, L.; Laefer, D.F.; Bertolotto, M. Octree-based region growing for point cloud segmentation. ISPRS J. Photogramm. Remote Sens. 2015, 104, 88–100. [Google Scholar] [CrossRef]
- O’Callaghan, J.F.; Mark, D.M. The extraction of drainage networks from digital elevation data. Comput. Vis. Graph. Image Process. 1984, 28, 323–344. [Google Scholar] [CrossRef]
- Wilson, J.P.; Aggett, G.; Yongxin, D.; Lam, C.S. Water in the landscape: A review of contemporary flow routing algorithms. In Advances in Digital Terrain Analysis; Springer: Berlin/Heidelberg, Germany, 2008; pp. 213–236. [Google Scholar] [CrossRef]
- De Reu, J.; Bourgeois, J.; Bats, M.; Zwertvaegher, A.; Gelorini, V.; De Smedt, P.; Chu, W.; Antrop, M.; De Maeyer, P.; Finke, P. Application of the topographic position index to heterogeneous landscapes. Geomorphology 2013, 186, 39–49. [Google Scholar] [CrossRef]
- Cheng, Y. Mean shift, mode seeking, and clustering. IEEE Trans. Pattern Anal. Mach. Intell. 1995, 17, 790–799. [Google Scholar] [CrossRef]
- Comaniciu, D.; Meer, P. Mean shift: A robust approach toward feature space analysis. IEEE Trans. Pattern Anal. Mach. Intell. 2002, 24, 603–619. [Google Scholar] [CrossRef]
- Davis, O. Processing and working with LiDAR data in ArcGIS: A practical guide for archaeologists. R. Comm. Anc. Hist. Monum. Wales 2012, 1–23. [Google Scholar]
- Pecsmány, P.; Hegedűs, A.; Vágó, J.; Németh, N. Directional analysis of drainage network and morphotectonic features in the south-eastern part of Bükk Region. Hung. Geogr. Bull. 2021, 70, 175–187. [Google Scholar] [CrossRef]
- Wang, M.; Baartman, J.E.; Zhang, H.; Yang, Q.; Li, S.; Yang, J.; Cai, C.; Wang, M.; Ritsema, C.J.; Geissen, V. An integrated method for calculating DEM-based RUSLE LS. Earth Sci. Inform. 2018, 11, 579–590. [Google Scholar] [CrossRef]
- Bansal, R.; Sehgal, P.; Bedi, P. Effective morphological extraction of true fingerprint minutiae based on the hit or miss transform. Int. J. Biom. Bioinform. (IJBB) 2010, 4, 71–85. [Google Scholar]


Disclaimer/Publisher’s Note: The statements, opinions and data contained in all publications are solely those of the individual author(s) and contributor(s) and not of MDPI and/or the editor(s). MDPI and/or the editor(s) disclaim responsibility for any injury to people or property resulting from any ideas, methods, instructions or products referred to in the content. |
© 2023 by the authors. Licensee MDPI, Basel, Switzerland. This article is an open access article distributed under the terms and conditions of the Creative Commons Attribution (CC BY) license (https://creativecommons.org/licenses/by/4.0/).