Article

A New Urban Space Analysis Method Based on Space Syntax and Geographic Information System Using Multisource Data

School of Design, Jiangnan University, Wuxi 214122, China
*
Author to whom correspondence should be addressed.
ISPRS Int. J. Geo-Inf. 2022, 11(5), 297; https://doi.org/10.3390/ijgi11050297
Submission received: 15 March 2022 / Revised: 16 April 2022 / Accepted: 2 May 2022 / Published: 4 May 2022

Abstract

:
With large-scale urban demolition, the spatial pattern of the urban area in many cities has been destroyed, leading to the loss of urban regional identity; therefore, these urban spaces need to be urgently studied and protected. Previous studies on the spatial pattern of urban areas focused on spatial morphology or urban texture. However, due to difficulties in obtaining field survey data, such studies cannot comprehensively analyze the space; thus, the proposed conservation strategies are also more one-sided. In order to study the urban space more scientifically and systematically, and to propose a more operable spatial conservation strategy, this paper conducts a new urban space analysis method based on space syntax and the geographic information system using multisource data. With the help of software such as Depthmap and ArcGIS, as well as theories and methods such as space syntax and regression analysis, this article conducted a visual and quantitative analysis of the spatial information data such as integration of urban road networks, building height, architectural style, points of interest, number of lanes, and maximum road speed. Taking the old city of Wuxi as an example, the method’s feasibility was verified. The regression model analysis revealed that, when the integration of the area was higher, the buildings distributed around were multilane, fast lane, modern buildings, taller buildings, commercial buildings, and vice versa, which gives a scientific basis for the proposed strategy of creating regional characteristics of urban space. This new analysis method of urban space is of great significance for the study of urban problems, the exploration of urban characteristics, and the proposal of urban strategies.

1. Introduction

Creating an urban space with regional characteristics is a fundamental goal of urban development, which is very important for promoting cities’ sustainable economic and cultural development. However, with large-scale urban demolition and construction, the spatial pattern of the urban area in many cities has been destroyed, leading to the loss of urban regional identity and reducing the residents’ sense of urban identity; these urban spaces need to be urgently studied and protected. Many early studies analyzed urban areas and proposed conservation strategies based on fieldwork. However, most focused on the geometric characteristics, physical attributes, and spatial distribution of space, including studies on spatial morphology [1], urban structure and form [2], urban texture [3], and planar patterns [4]. These studies conducted a qualitative analysis of spatial patterns from historical development. However, due to specific difficulties in obtaining field survey data, such studies often could not comprehensively and systematically analyze the current space; hence, the proposed conservation strategies were often more one-sided and lacked systematicity and scientificity. A more scientific and visual analysis method is needed to analyze the urban space to propose a more scientific, systematic, and operable spatial conservation strategy.
The emergence of massive and multisource urban data provides the basis for a more systematic and scientific study of urban space. Meanwhile, data analysis and integration methods such as space syntax and the geographic information system have provided critical theoretical and technical support for the analysis of urban space. Many researchers have recently changed from a traditional mechanical thinking mode to thinking mode based on big data, integrating emerging research such as urban computing, artificial intelligence, and big data research with urban research [5]. Li et al. [6] used space syntax analysis and the geographic information system to understand the tourism space of the historical sites in Gulangyu Island and explored the relationship between street network integration and urban structure. Yue et al. [7] developed a series of indicators using the numbers of cell phone subscribers in a 24 h period and point-of-interest data, resulting in a new method for studying the relationship between neighborhood vibrancy and point-of-interest data. Xu et al. [8] explored the relationship between street networks and visitors’ spatial perceptions, thus assisting designers and managers in identifying where cognitive experiences can be improved. Liu et al. [9] analyzed the driving mechanism of urban dynamics using human activity data, geospatial data, and internet-contributed big data. Liu et al. [10] proposed a novel framework for visualizing and exploring POIs on the semantic space of POI types, which provides ideas for exploring and developing the functions and dynamics of urban areas. Askarizad et al. [11] implemented a combination of empirical axial line and visibility graph analysis using the space syntax technique. They investigated the influence of social interactions on people’s behavior patterns in urban spaces and evaluated the consistency of the research results using ArcGIS software. Şen et al. [12] conducted a comparative study of the spatial integration values obtained by the accessibility graphs and the visual integration values obtained by the visibility graphs in 15 traditional houses plans in Turkey, providing a basis for interpreting the social and cultural information that exists behind the space configuration of Bitlis traditional houses. Chen et al. [13] used Depthmap software based on space syntax to study the relationship between the wayfinding system of the outpatient areas and the behavior of patients in a hospital, giving suggestions on the location, format, and content of the wayfinding system. Andrakakou et al. [14] investigated the configurational centralities in metropolitan Copenhagen created by the road network on the basis of space syntax analysis and active centralities of land-use patterns with a geographical approach using data from Open Street Map, exploring the significance of the centralities in terms of pedestrian and cyclist accessibility and the role of configurational centralities in shaping land-use patterns. However, the existing literature tends to focus on urban dynamics or urban tourism, while very few studies have analyzed urban space to preserve the original regional characteristics of the space using multisource data. Therefore, this paper attempted to innovate the approach of spatial research and conservation from the perspective of using multisource data analysis to propose strategies for preserving the regional characteristics of cities.
In summary, multisource information and quantitative analysis methods enable the research on urban space to be no longer limited to field research and qualitative analysis, which can effectively improve the systematicity and scientificity of the research. This paper constructs a more macro and systematic urban spatial analysis method based on the geographic information system. Firstly, the data on architectural style, building age, number of lanes, and maximum road speed obtained from fieldwork, the data on building outline, points of interest, and building height obtained from big urban data, and the data on urban road network analysis based on space syntax were integrated into the geographic information system and visualized and quantified for analysis. Secondly, the current characteristics of urban space were explored through the analysis of visual maps and influence mechanisms. Lastly, the protection methods of regional spatial characteristics were put forward on the basis of the urban space’s current characteristics. Taking the old city of Wuxi as an example, the feasibility of the above method was verified. This new research practice provides a methodological reference for similar urban space research and provides theoretical support for the sustainable development of urban spatial characteristics.

2. Methods and Data

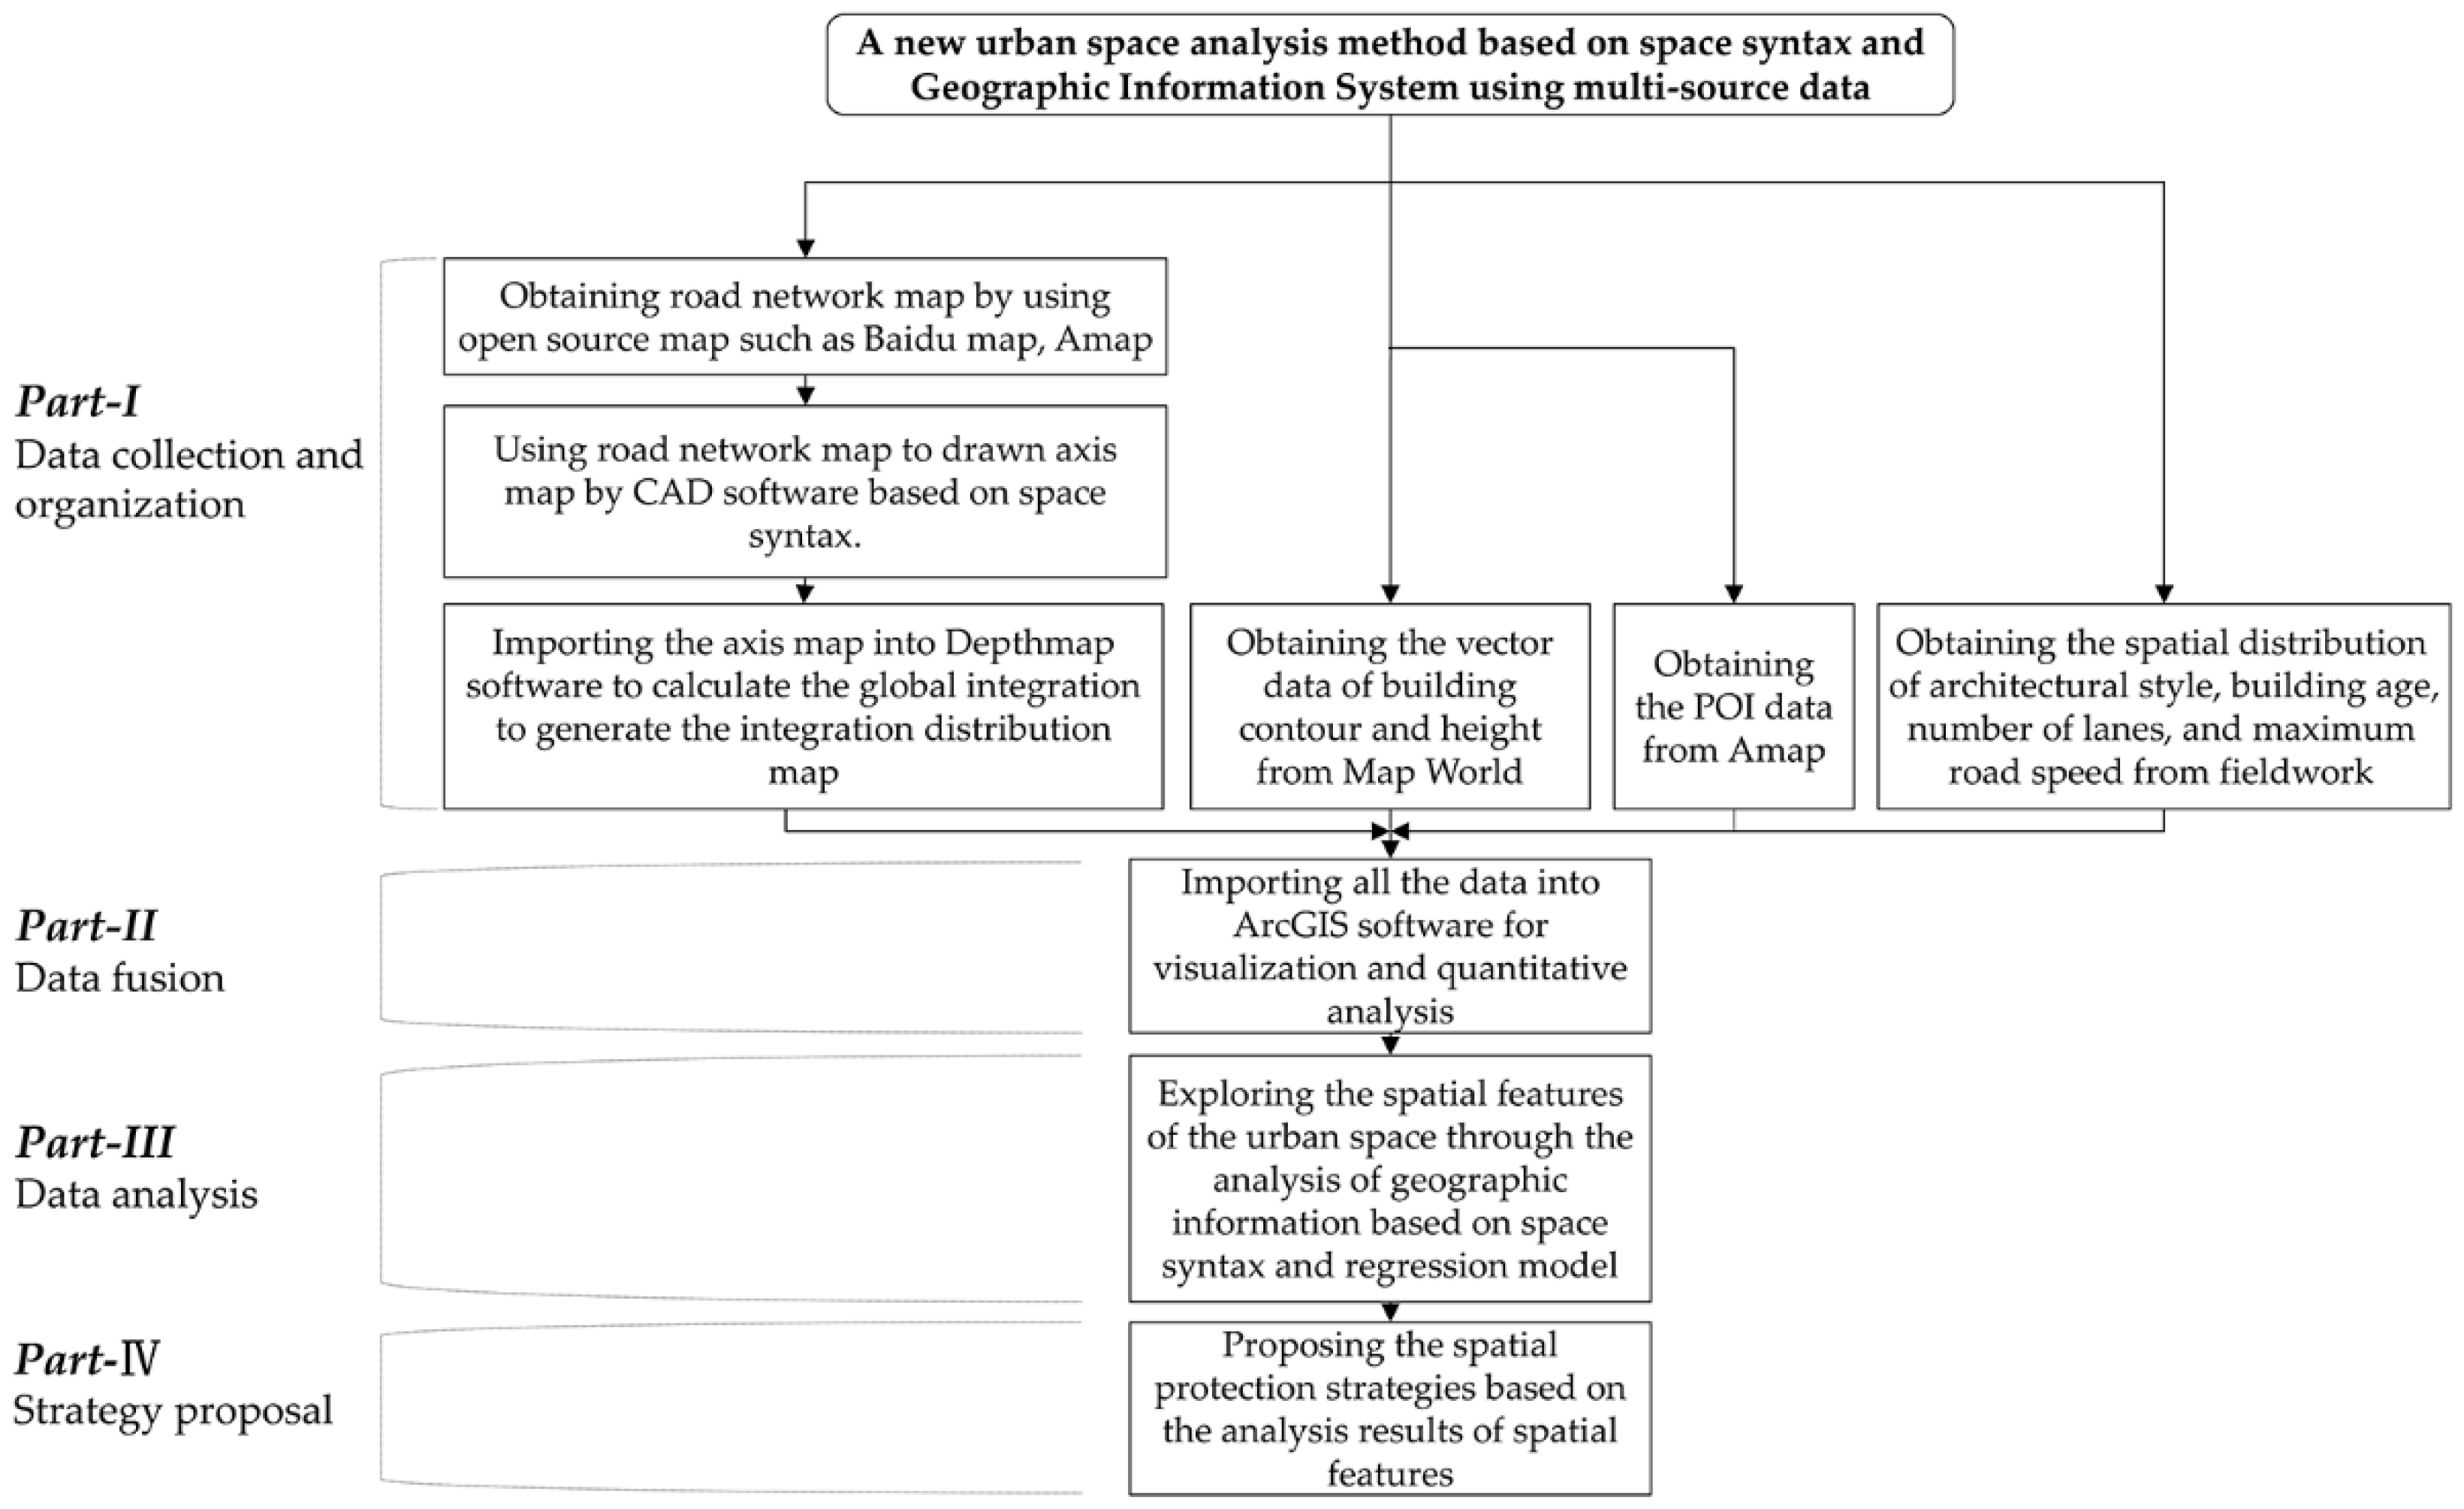
2.1. Conceptual Framework

The framework of the new urban space analysis method proposed in this paper is divided into four parts: data collection and organization, data fusion, data analysis, and strategy proposal based on data analysis results (Figure 1).

2.2. Multisource Data Fusion

With the development of modern technology such as aerospace, many satellites provide us with high-definition map images, while multisource map data sources such as Map World and Amap (similar to Open Street Map) also provide us with significant analysis data.
Map World is collected and published by China’s State Bureau of Surveying and Mapping and related navigation data companies. It is a national platform for common geospatial information services, providing data such as image maps, traffic road networks, water networks, building contours, building heights, and building functions for city residents. Meanwhile, the accurate vector data of the public version of Map World is open-source, enabling a more in-depth study of the spatial pattern of the urban area.
Amap is a provider of digital map content, as well as navigation and location services, in China. Its best feature is its ability to provide destination search and navigation services as a function of the company’s mastery of a vast amount of geographic information data. One of the essential items of the company’s geographic information is represented by the points of interest in the city, reflecting the functional attributes of different city areas and their density, making it convenient to analyze the urban space. Amap provides users with an API interface in which the point-of-interest data are open-source. These data have the characteristics of comprehensive coverage and real-time updating. The research conducted with these data can improve the scientificity and timeliness of studies on the spatial pattern of the old urban area.
The geographic information system [15] provides the key technical support for integrating a massive amount of big data. Using the geographic information system, we can integrate the data obtained from fieldwork with a vast amount of big urban data for data visualization and comparative analysis.
In this paper, the vector data of building height obtained from Map World, the point-of-interest data obtained from Amap, and the spatial distribution data on building age, architectural style, number of lanes, and maximum road speed obtained from fieldwork were integrated into ArcGIS software.

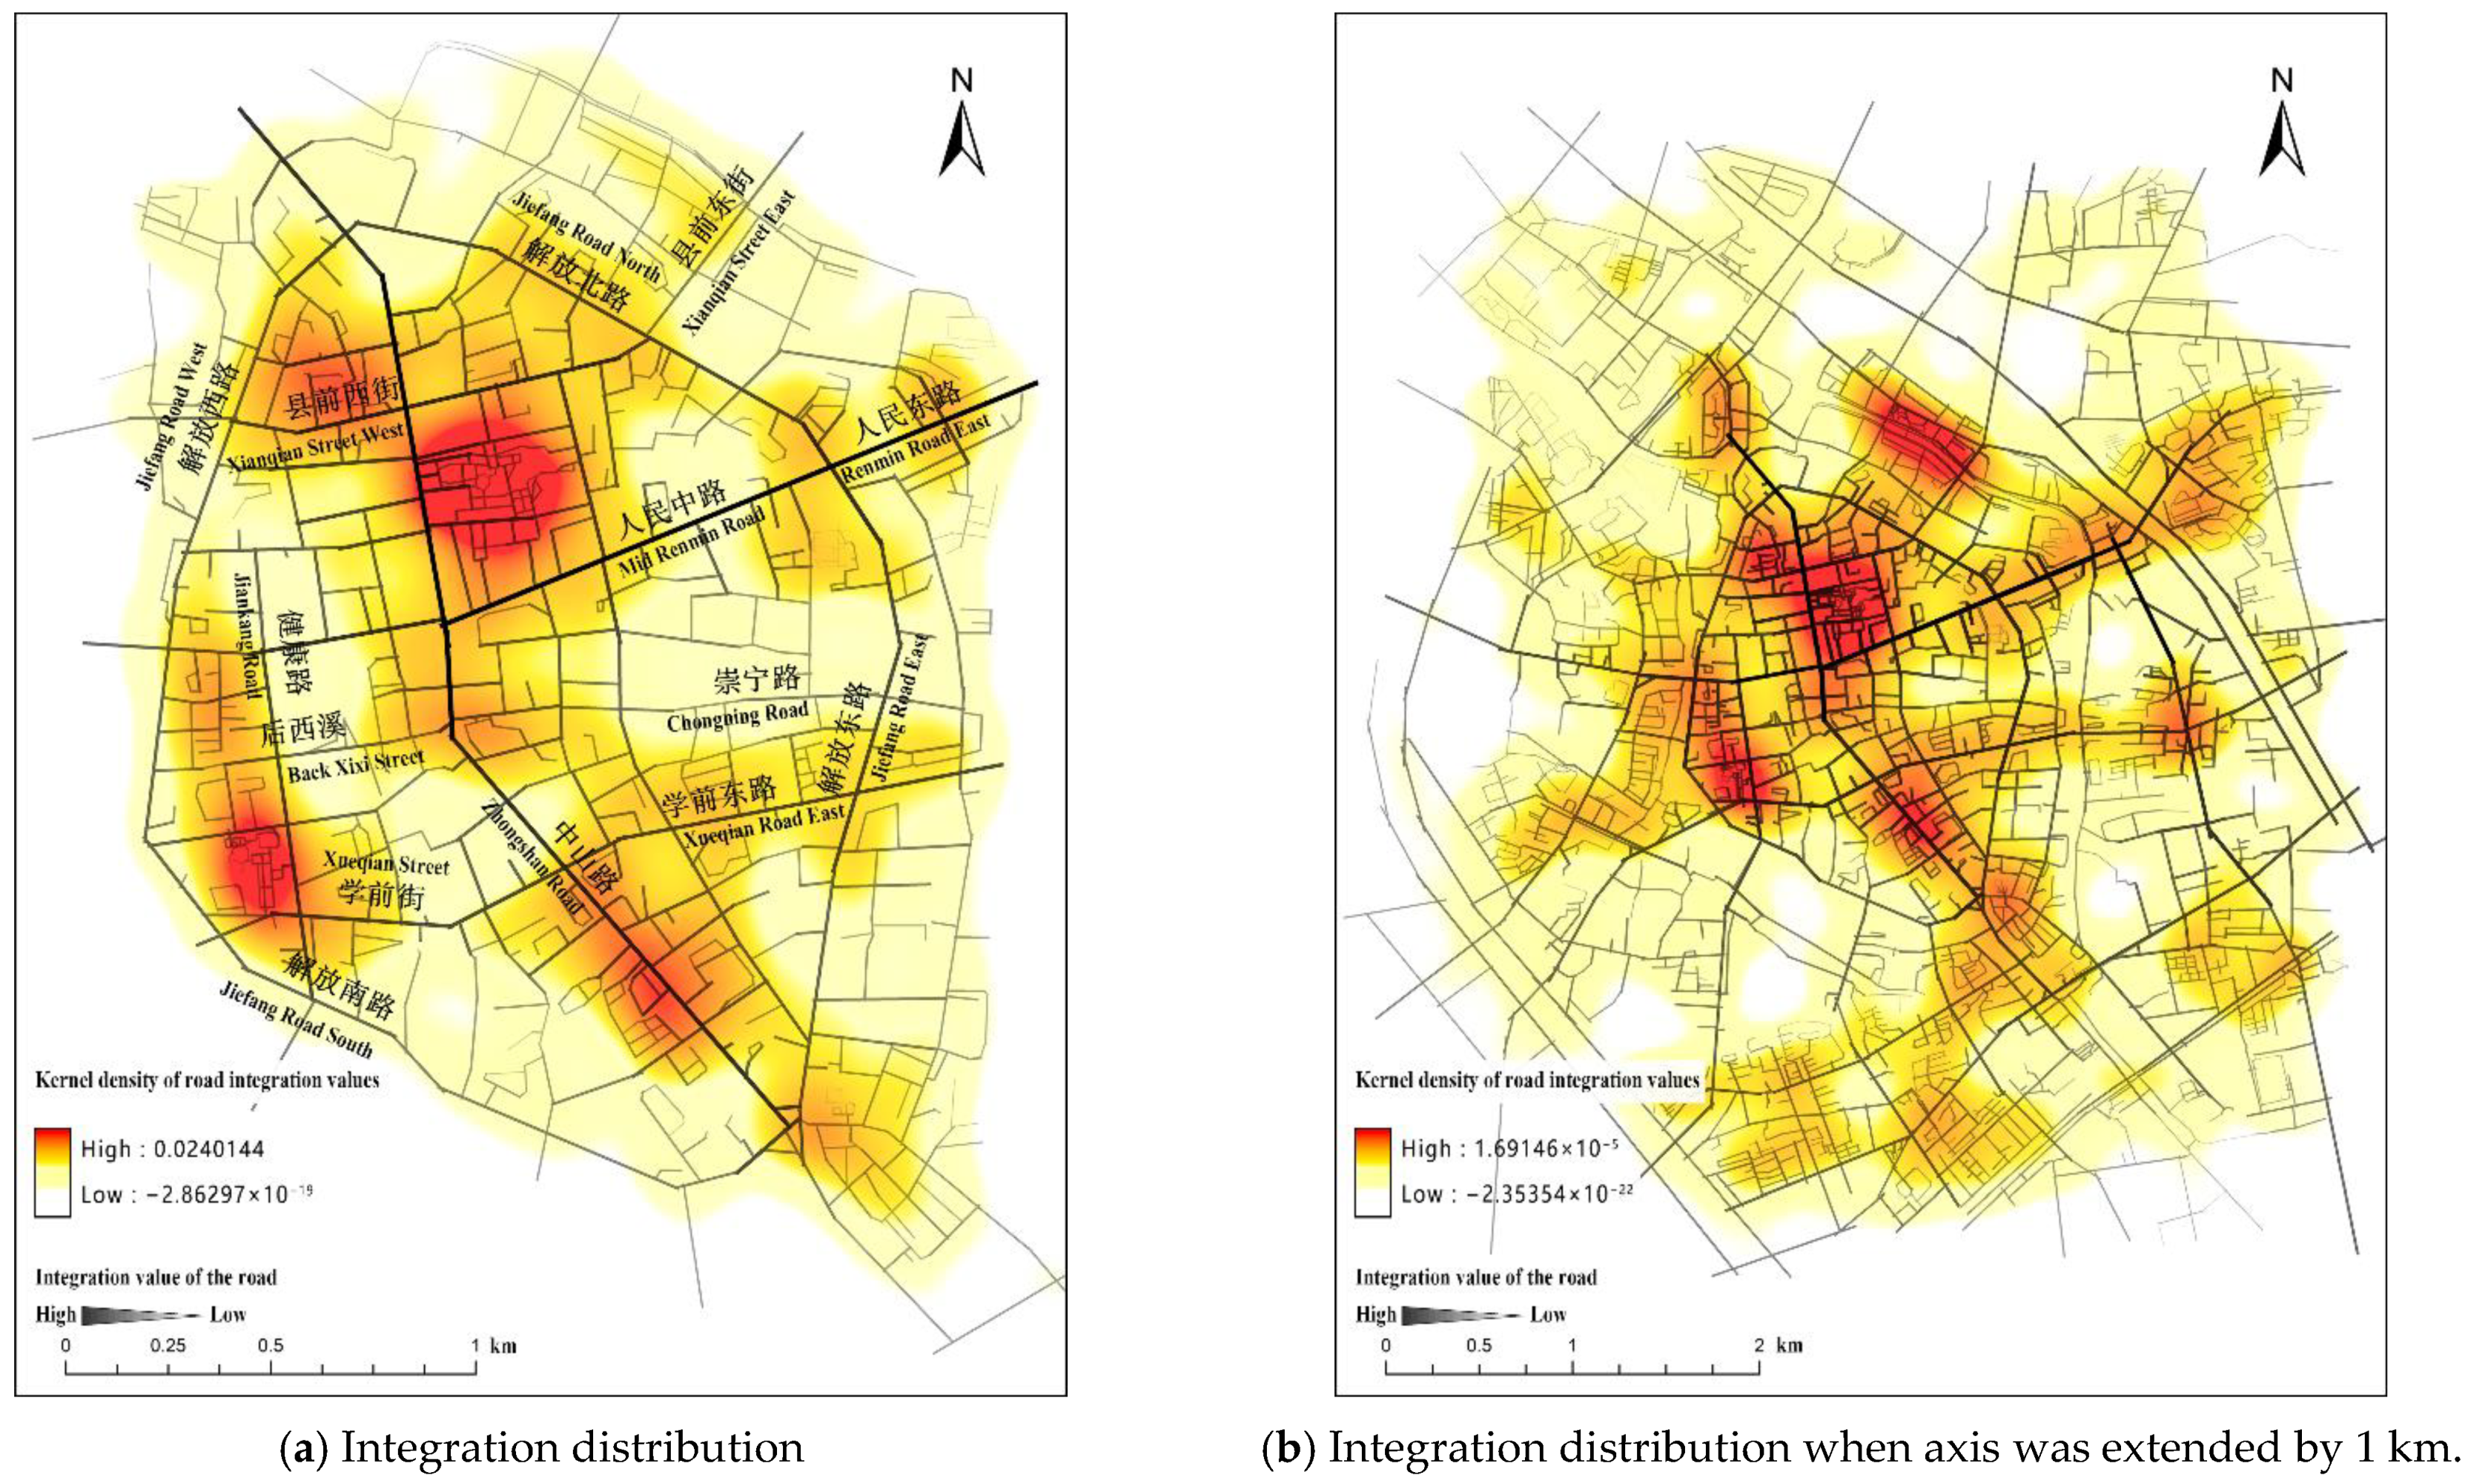
2.3. Space Syntax-Based Analysis

Space syntax is a theory and method for investigating the society–space relationship. Through a new definition of spatial order, space syntax establishes a method for analyzing spatial patterns that emphasize the relationship between local morphological relations and global patterns for discovering and quantifying the existence of different local and global morphological features and ultimately achieving the mathematization of the research result from intuitive formal principles through a mathematical model [16,17]. Space syntax has become a fundamental method for studying urban morphology and the behavior of urban residents. It can help architects to explain and predict forms, as well as visualize the existing deep structures of architectural and urban space [18]. The complexity of topology and geometry plays a crucial role in how people navigate the urban grid [19,20]. Space syntax internalizes the geometric and metric properties of space into its structure through a “line graph”, allowing the graph analysis to pick up the nonlocal or extrinsic properties of the space to analyze the relationship between urban space and social factors [21,22].
With the help of computer software such as Depthmap, it is possible to visualize and quantify the spatial hierarchy of street networks on the basis of space syntax theory, thus achieving a deeper understanding of the structure of urban grids and how these structures relate to urban functions [23,24]. DepthmapX developed by University College London, with the measurement of axial graph analysis and angular segment analysis by metric distance inside the software, was applied to our case to measure the spatial configuration of street networks in the morphological structure of the old urban area of Wuxi. We mainly focused on two metrics. The first was the integration (including global integration and local integration) in the results of axial map analysis, and the second was the street network closeness under different metric distances in the results of angular segment analysis. Both axial map analysis and angular segment analysis were divided into two types: global-scale and local-scale analysis. The global-scale analysis measured the average depth of an axial line or segment with respect to all other axial lines or segments in whole street networks, while the local-scale analysis calculated a limited radius [6].
The global integration value Ii refers to the degree of spatial aggregation or dispersion between the ‘i’ space and other spaces, and the local integration value Ii(K) refers to the relationship between the ‘i’ space and other spaces within K steps. Usually, K is 3, and this term is named radius-3 integration. The equations for global and local integration are shown below. The integration value is the most commonly used and vital analysis variable. A higher integration value indicates a higher accessibility and commonality of the space [8].
I i = n ( log 2 ( ( n + 2 ) / 3 ) 1 ) + 1 ( n 1 ) ( D i 1 ) .
I i ( K ) = n ( log 2 ( ( n + 2 ) / 3 ) 1 ) + 1 ( n 1 ) ( D i 1 ) .
The street network closeness reflects how close each segment is to all others under different types of distances. Paths between all segments and others can be assessed in terms of least length, fewest turns, and fewest angle paths [25,26]. We mainly use the least length for angular segment analysis to study the street network closeness. The equation for closeness is shown below, where dik refers to the length of a geodesic (least length) between node Pi and Pk [6].
C C ( p i ) = ( k d i k ) 1 .

2.4. Regression Model-Based Analysis of Geographic Information
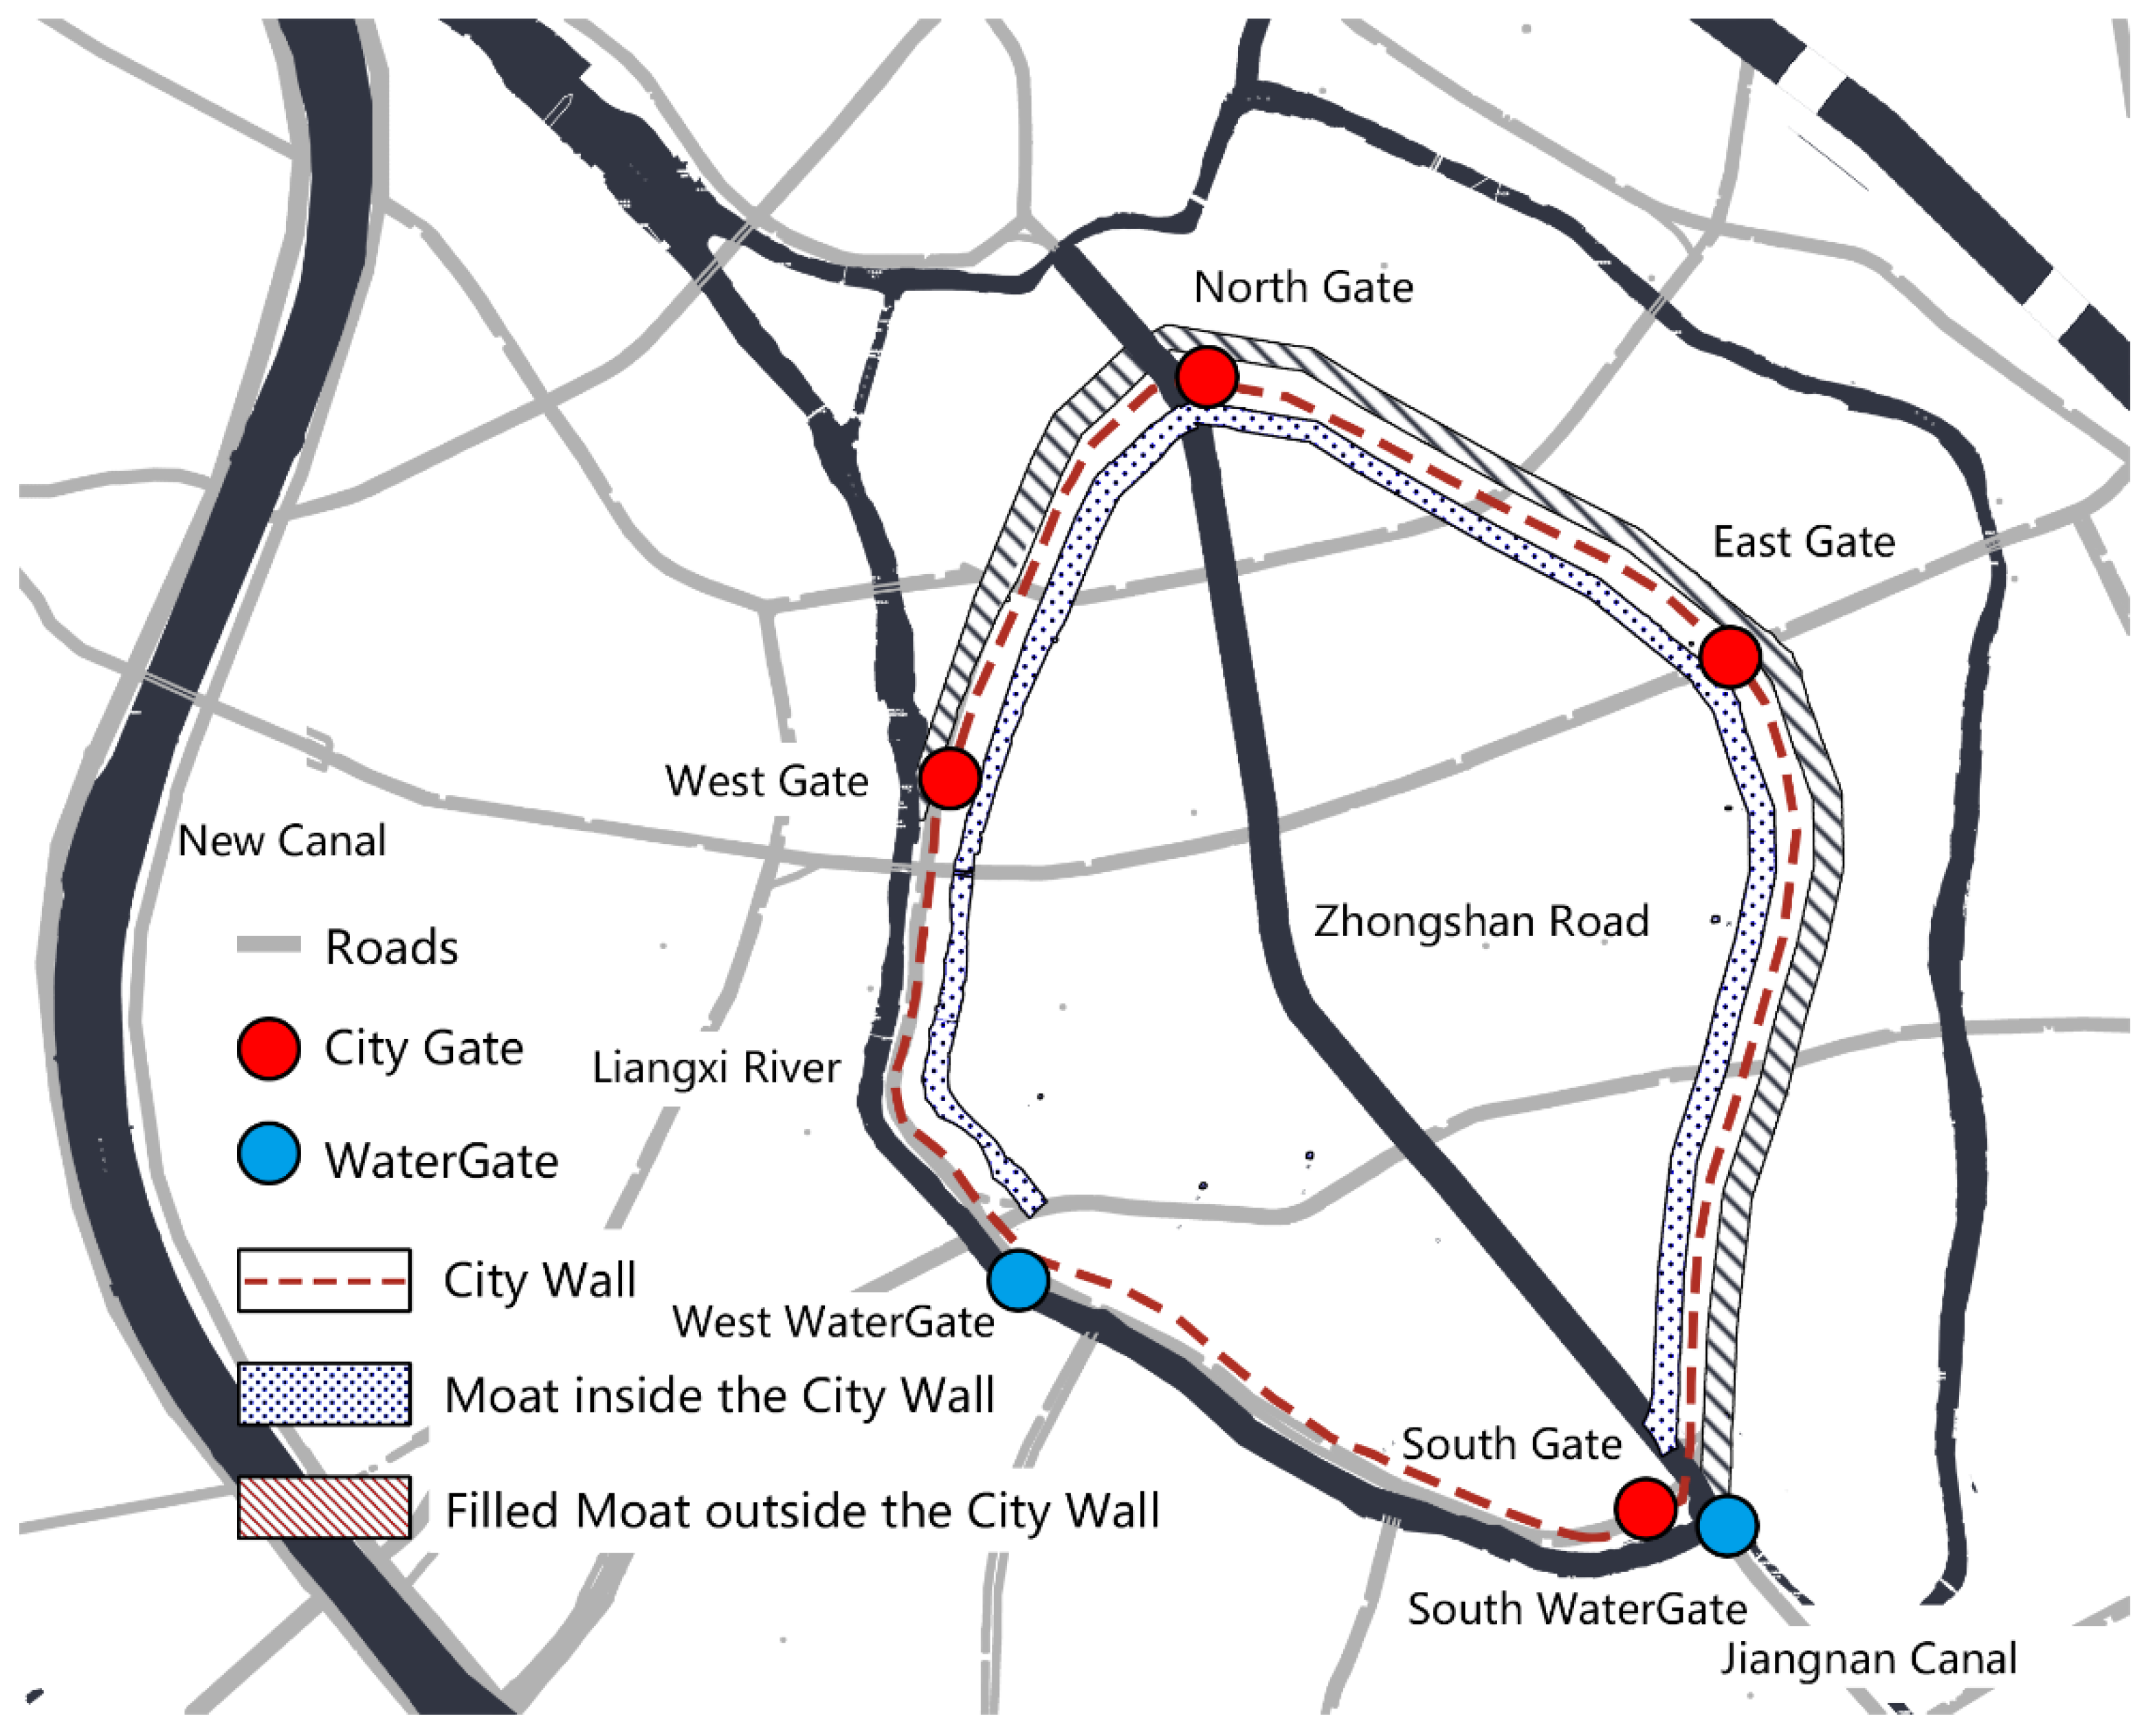
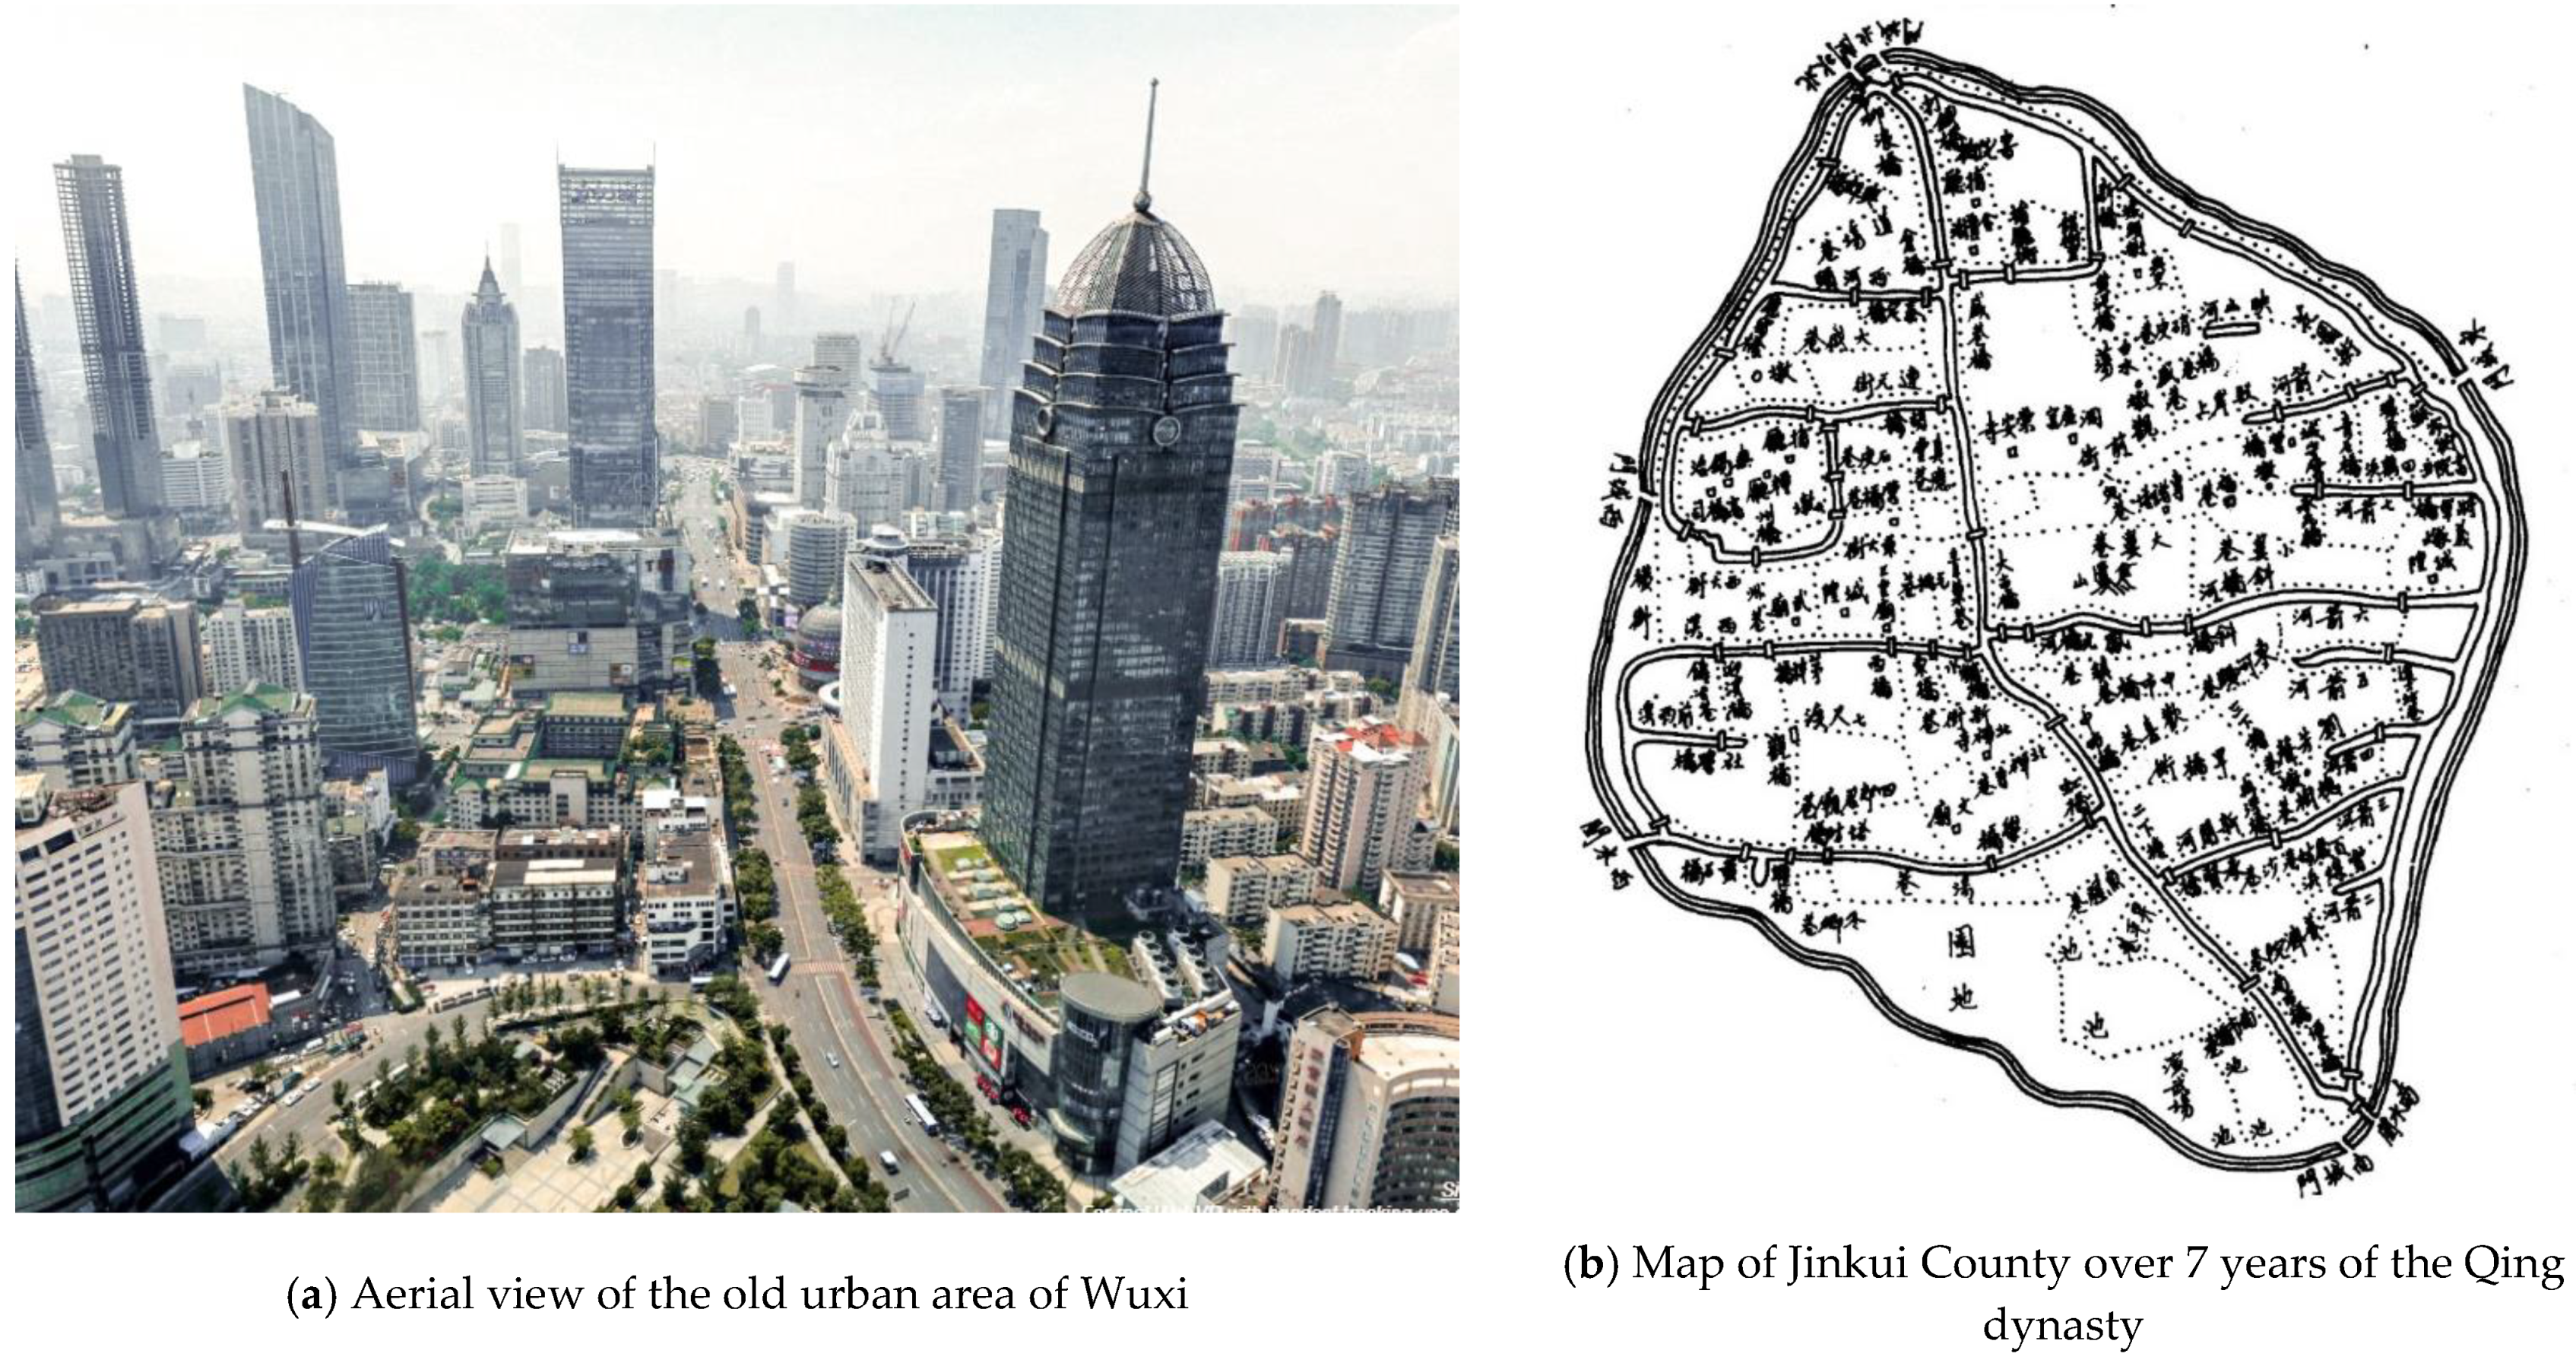
The integration results of the urban road network calculated in Depthmap software were imported into ArcGIS software. First, the road network axial map was connected with the values of the number of lanes and the maximum speed in the ArcGIS software. Second, the values of the integration data from the axial map were connected to the buildings by connecting the integration data to the buildings using the Spatial Join tool. The building height data were numerical data obtained from Map World, corresponding to the buildings, and could be calculated directly. The building style data were textual and, hence, needed to be virtualized to be calculated mathematically. As for the point-of-interest data, we mainly calculated the points of interest related to shopping services. The kernel density of the points of interest was calculated in ArcGIS, and then the calculation results were assigned to the points using the Extract by Points tool, before connecting the data of the assigned points with the building through the Spatial Join tool. Finally, the analysis between integration and geographic information was realized by establishing regression models between integration and building height, architectural style, points of interest, number of lanes, and maximum road speed. Before the above regression model calculation, the Z-score was calculated to standardize all data. The final regression model was based on the R-squared value and significance to determine the correlation, and all data are presented in tables and visual figures. A positive standardized coefficient denotes that the variables involved in the calculation are positively correlated, and vice versa. The R-squared value represents the degree of correlation between the variables.

2.5. Case Selection

The case study was based on the old urban area of Wuxi (in Jiangsu Province, southeastern China). The reason for choosing it as a case study is that Wuxi is an important historic city in China’s South Yangtze River region. In ancient times, the river system in the old urban area of Wuxi was very well developed (Figure 2), and people lived on the river, used the water for their daily use, and traveled by the river; thus, the old urban area had a unique spatial pattern. However, in the process of urban construction, renovation methods such as filling in the river to build roads and tearing down the city wall to build roads have significantly changed the original spatial pattern of the old urban area. The spatial pattern of the old urban area of Wuxi can hardly reflect its regional characteristics due to the wide roads and large-scale modern buildings (Figure 3a).
Taking the old city of Wuxi as a typical case, the new urban space analysis method based on space syntax and the geographic information system using multisource data was put into practice, providing a reference for the research and protection of similar urban spaces.

3. Results

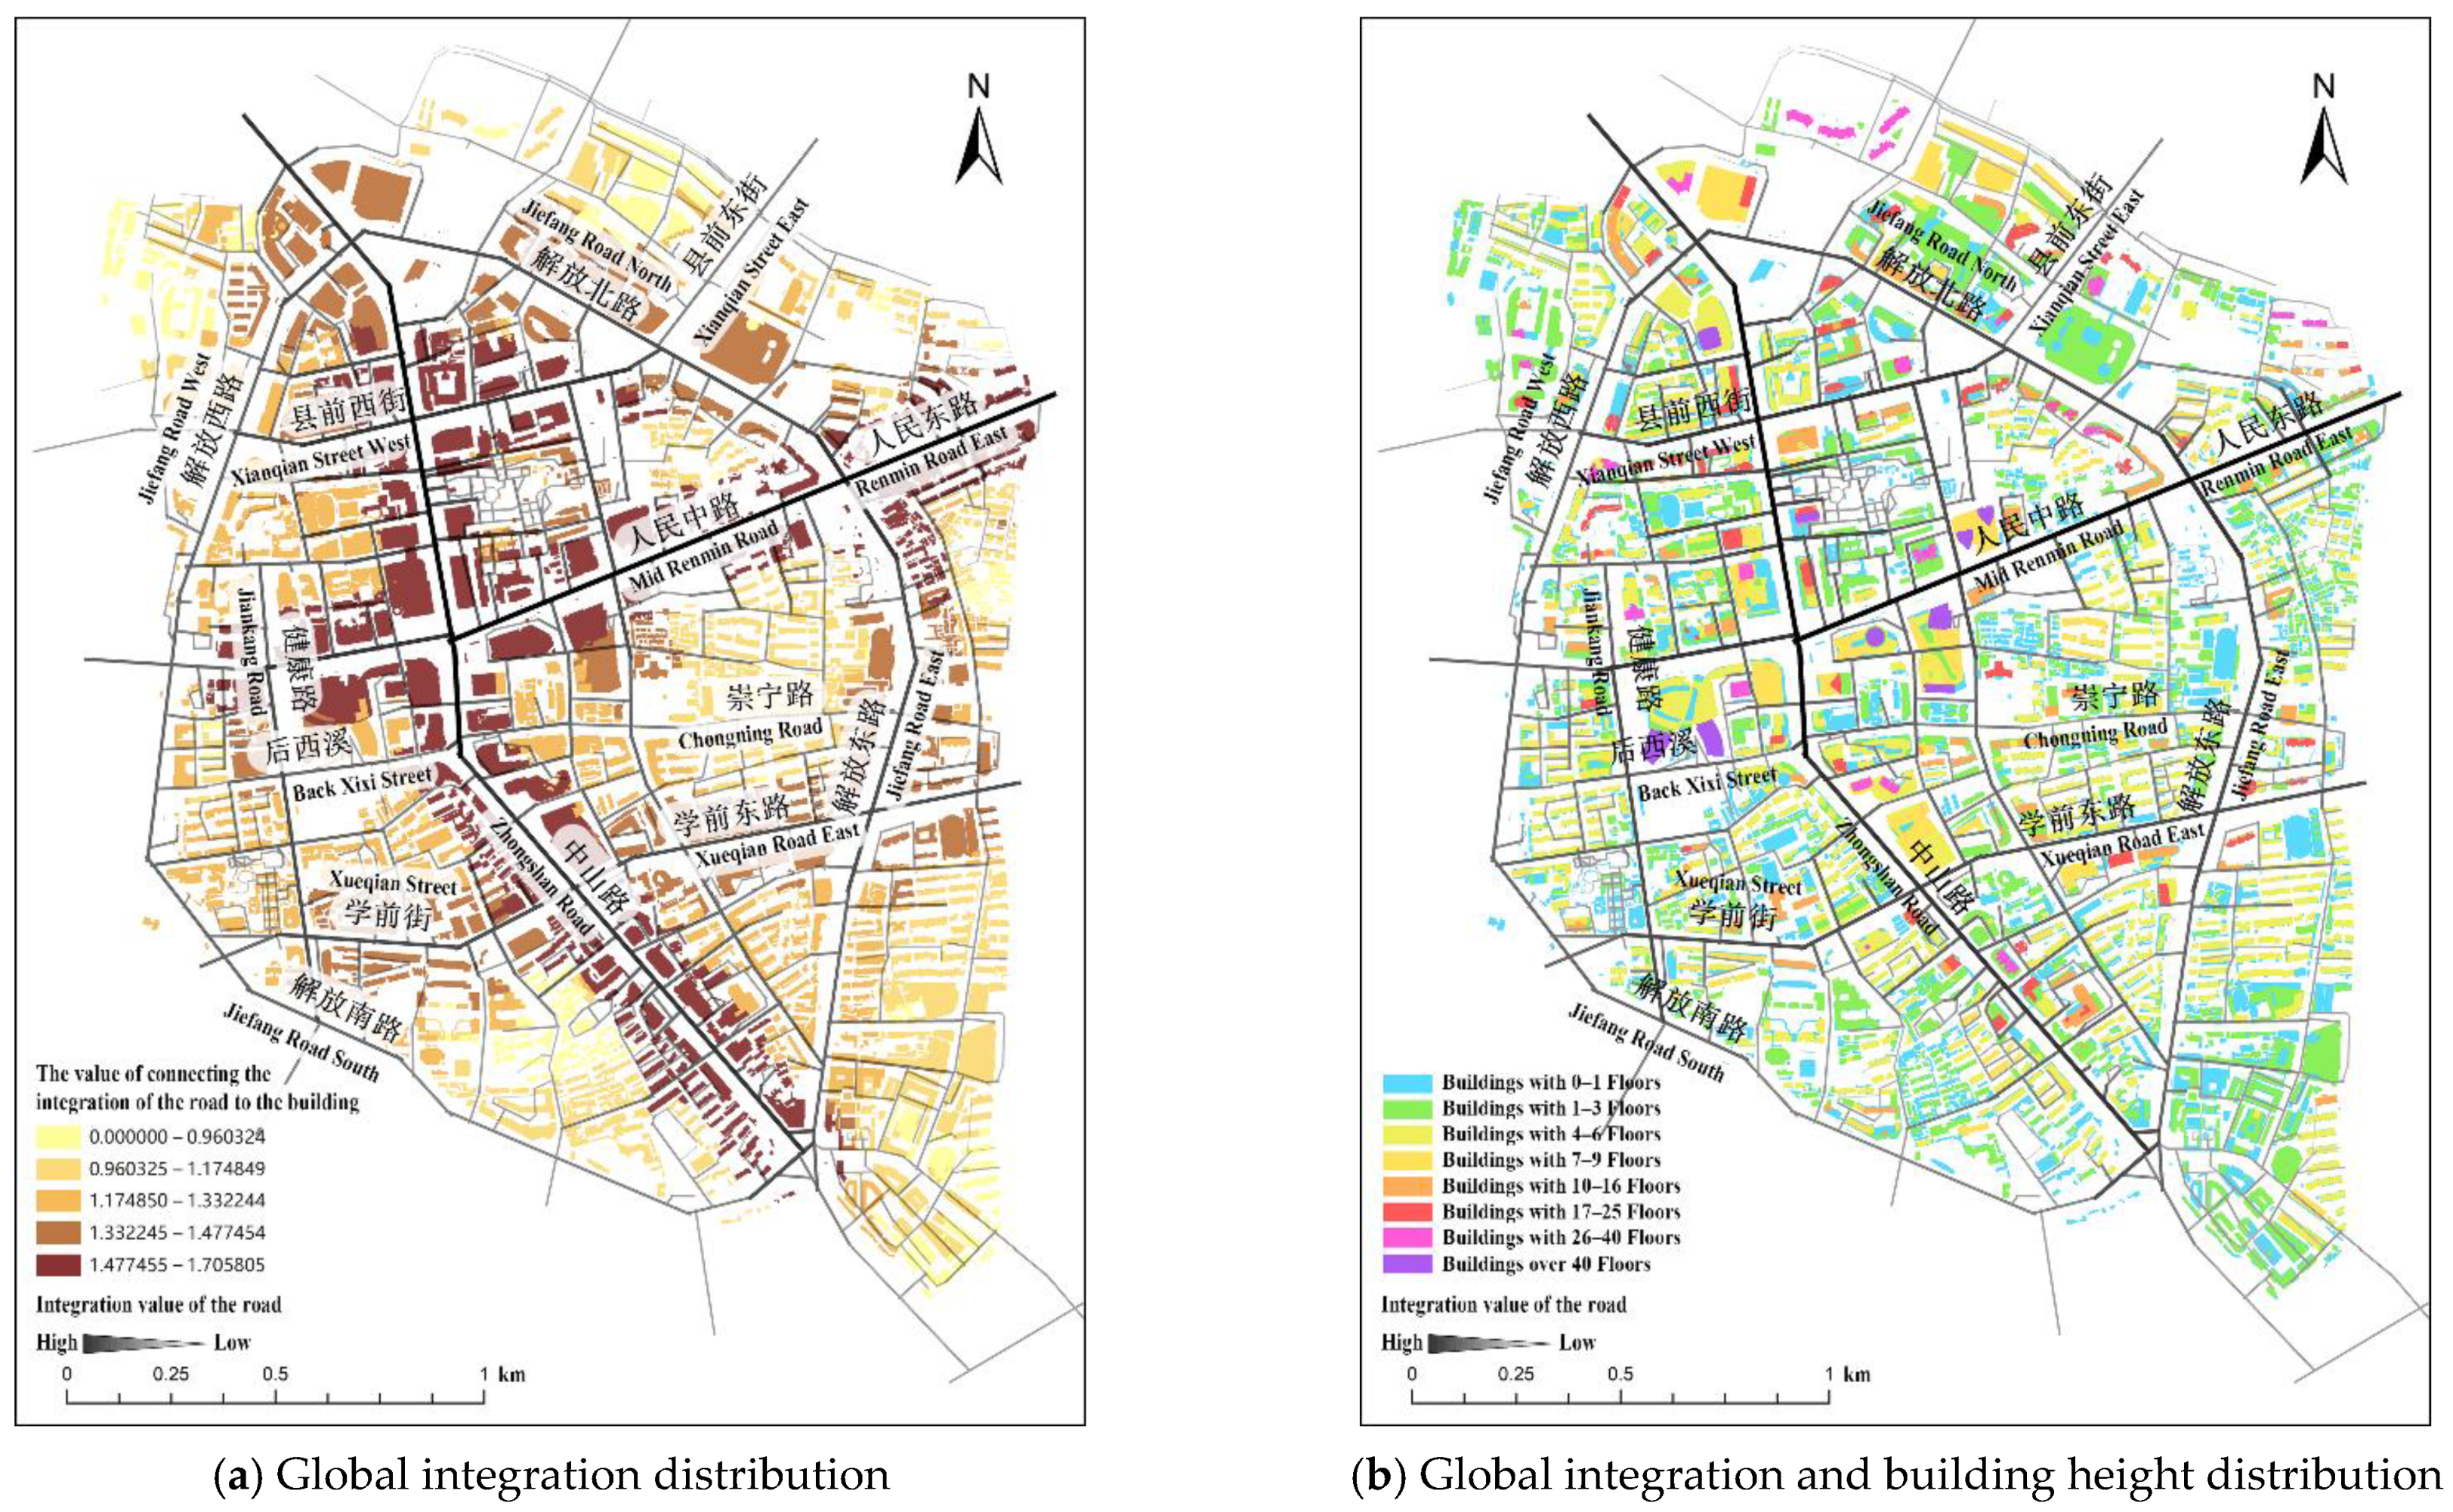
3.1. A Space with a Single Core and Independence

On the basis of the global integration analysis of the old urban area of Wuxi, the distribution characteristics of integration in the old urban area of Wuxi indicated that the integration of the main road and Jiefang Ring Road was high, while the integration of the collector street and the road on the periphery of Jiefang Ring Road was low. There was an apparent convergence point in the space of the old urban area, which was located in the center of the urban area (Figure 4a).
When we extended the extent of the axial map of the old urban area by 1 km in all directions, we found that the distribution characteristics of integration in the old urban area of Wuxi were unchanged with the expansion of the axial map (Figure 4). The integration of the main road and Jiefang Ring Road was high, while the integration of the collector street and the road on the periphery of Jiefang Ring Road is low. It can be concluded that the old urban area was less influenced by the spatial pattern of the periphery of the ring river and had the characteristics of independence.
Historically, Wuxi was a single-core space in ancient times, related to its crisscross river network distribution (Figure 3b). The old urban area had the characteristics of independence because it was a separate geographical unit, separated from the surrounding area by the city ring river and connected to it only by bridges in all directions. Therefore, the human activities within the old urban area were independent compared to the surrounding areas.

3.2. A Space with Duality and Positive Information Coupling

As shown in Figure 5a, in the old urban area of Wuxi, Zhongshan Road, Mid Renmin Road, and Renmin Road East had the highest integration, while the integration of Jiefang Ring Road and other main roads was also high. The integration of collector streets and roads located in the north, east, and southwest of the urban area was low. The regression model analysis revealed that the significance value calculated between integration and number of lanes, and the maximum road speed was 0.00, while the standardized coefficients were all positive (Table 1), and the adjusted R-squared in both models was around 0.37 (Table 2). Therefore, it can be determined that there was a significant positive correlation between integration and the number of lanes, and the maximum road speed. The areas with high integration tended to be distributed on wider and faster roads, while areas with low integration tended to be distributed on narrower and slower roads (Figure 5e,f). Through the above analysis, we can find that the spatial pattern of the old urban area of Wuxi had dual characteristics. The main road had high accessibility, while the internal collector street and the road on the periphery of Jiefang Ring Road had low accessibility. In the urbanization process, many demolition and construction activities were carried out in the old urban area of Wuxi. The traditional buildings on both sides of the main road, which were initially low and small in scale, were demolished, and a large number of tall and large-scale modern buildings were built, while some low and small-scale traditional buildings, pre-modern buildings, and pragmatic buildings remained along the collector streets and at the urban fringe areas, indicating the space’s dual characteristics.
Comparing the integration analysis results with the information on building outline, building height, points of interest, and architectural style in the geographic information system, was is found that the integration distribution status shown by space syntax was highly coupled with the information on buildings (Figure 5b–d). The regression model analysis revealed that the significance value calculated between integration and the geographic information of buildings was 0.00, the standardized coefficients were all positive (Table 1), and the adjusted R-squared value in the three models was around 0.02 to 0.03 (Table 2). Therefore, it can be determined that there was a significant positive correlation between integration and the geographic information of buildings. Through the above analysis, we can find that the space of the old urban area of Wuxi had the characteristics of positive information coupling. The main roads (Zhongshan Road, Mid Renmin Road, Renmin Road East, Jiefang Ring Road) with high integration had good accessibility and were matched with commercial spaces, modern buildings, high-rise buildings (0–40 stories), and large-scale urban fabric. On the other hand, the urban fringe areas and internal streets with low integration were less accessible and were matched with factories, schools, old neighborhoods, traditional buildings, pre-modern buildings, pragmatic buildings, multistory buildings (4–9 stories), and small-scale urban fabric.
The space of the old urban area had the characteristic of coupling because the spatial classification mechanism had a self-organizing effect [27]. Commercial development will choose highly integrated areas, where buildings have a modern style and usually use modern materials such as glass curtain walls to attract people’s attention. At the same time, because the commercial space has to carry a large number of people, its building scale is huge. On the other hand, areas with low integration have not been affected by commercialization and still have traditional, pre-modern, and pragmatic buildings, small in scale and short in height.

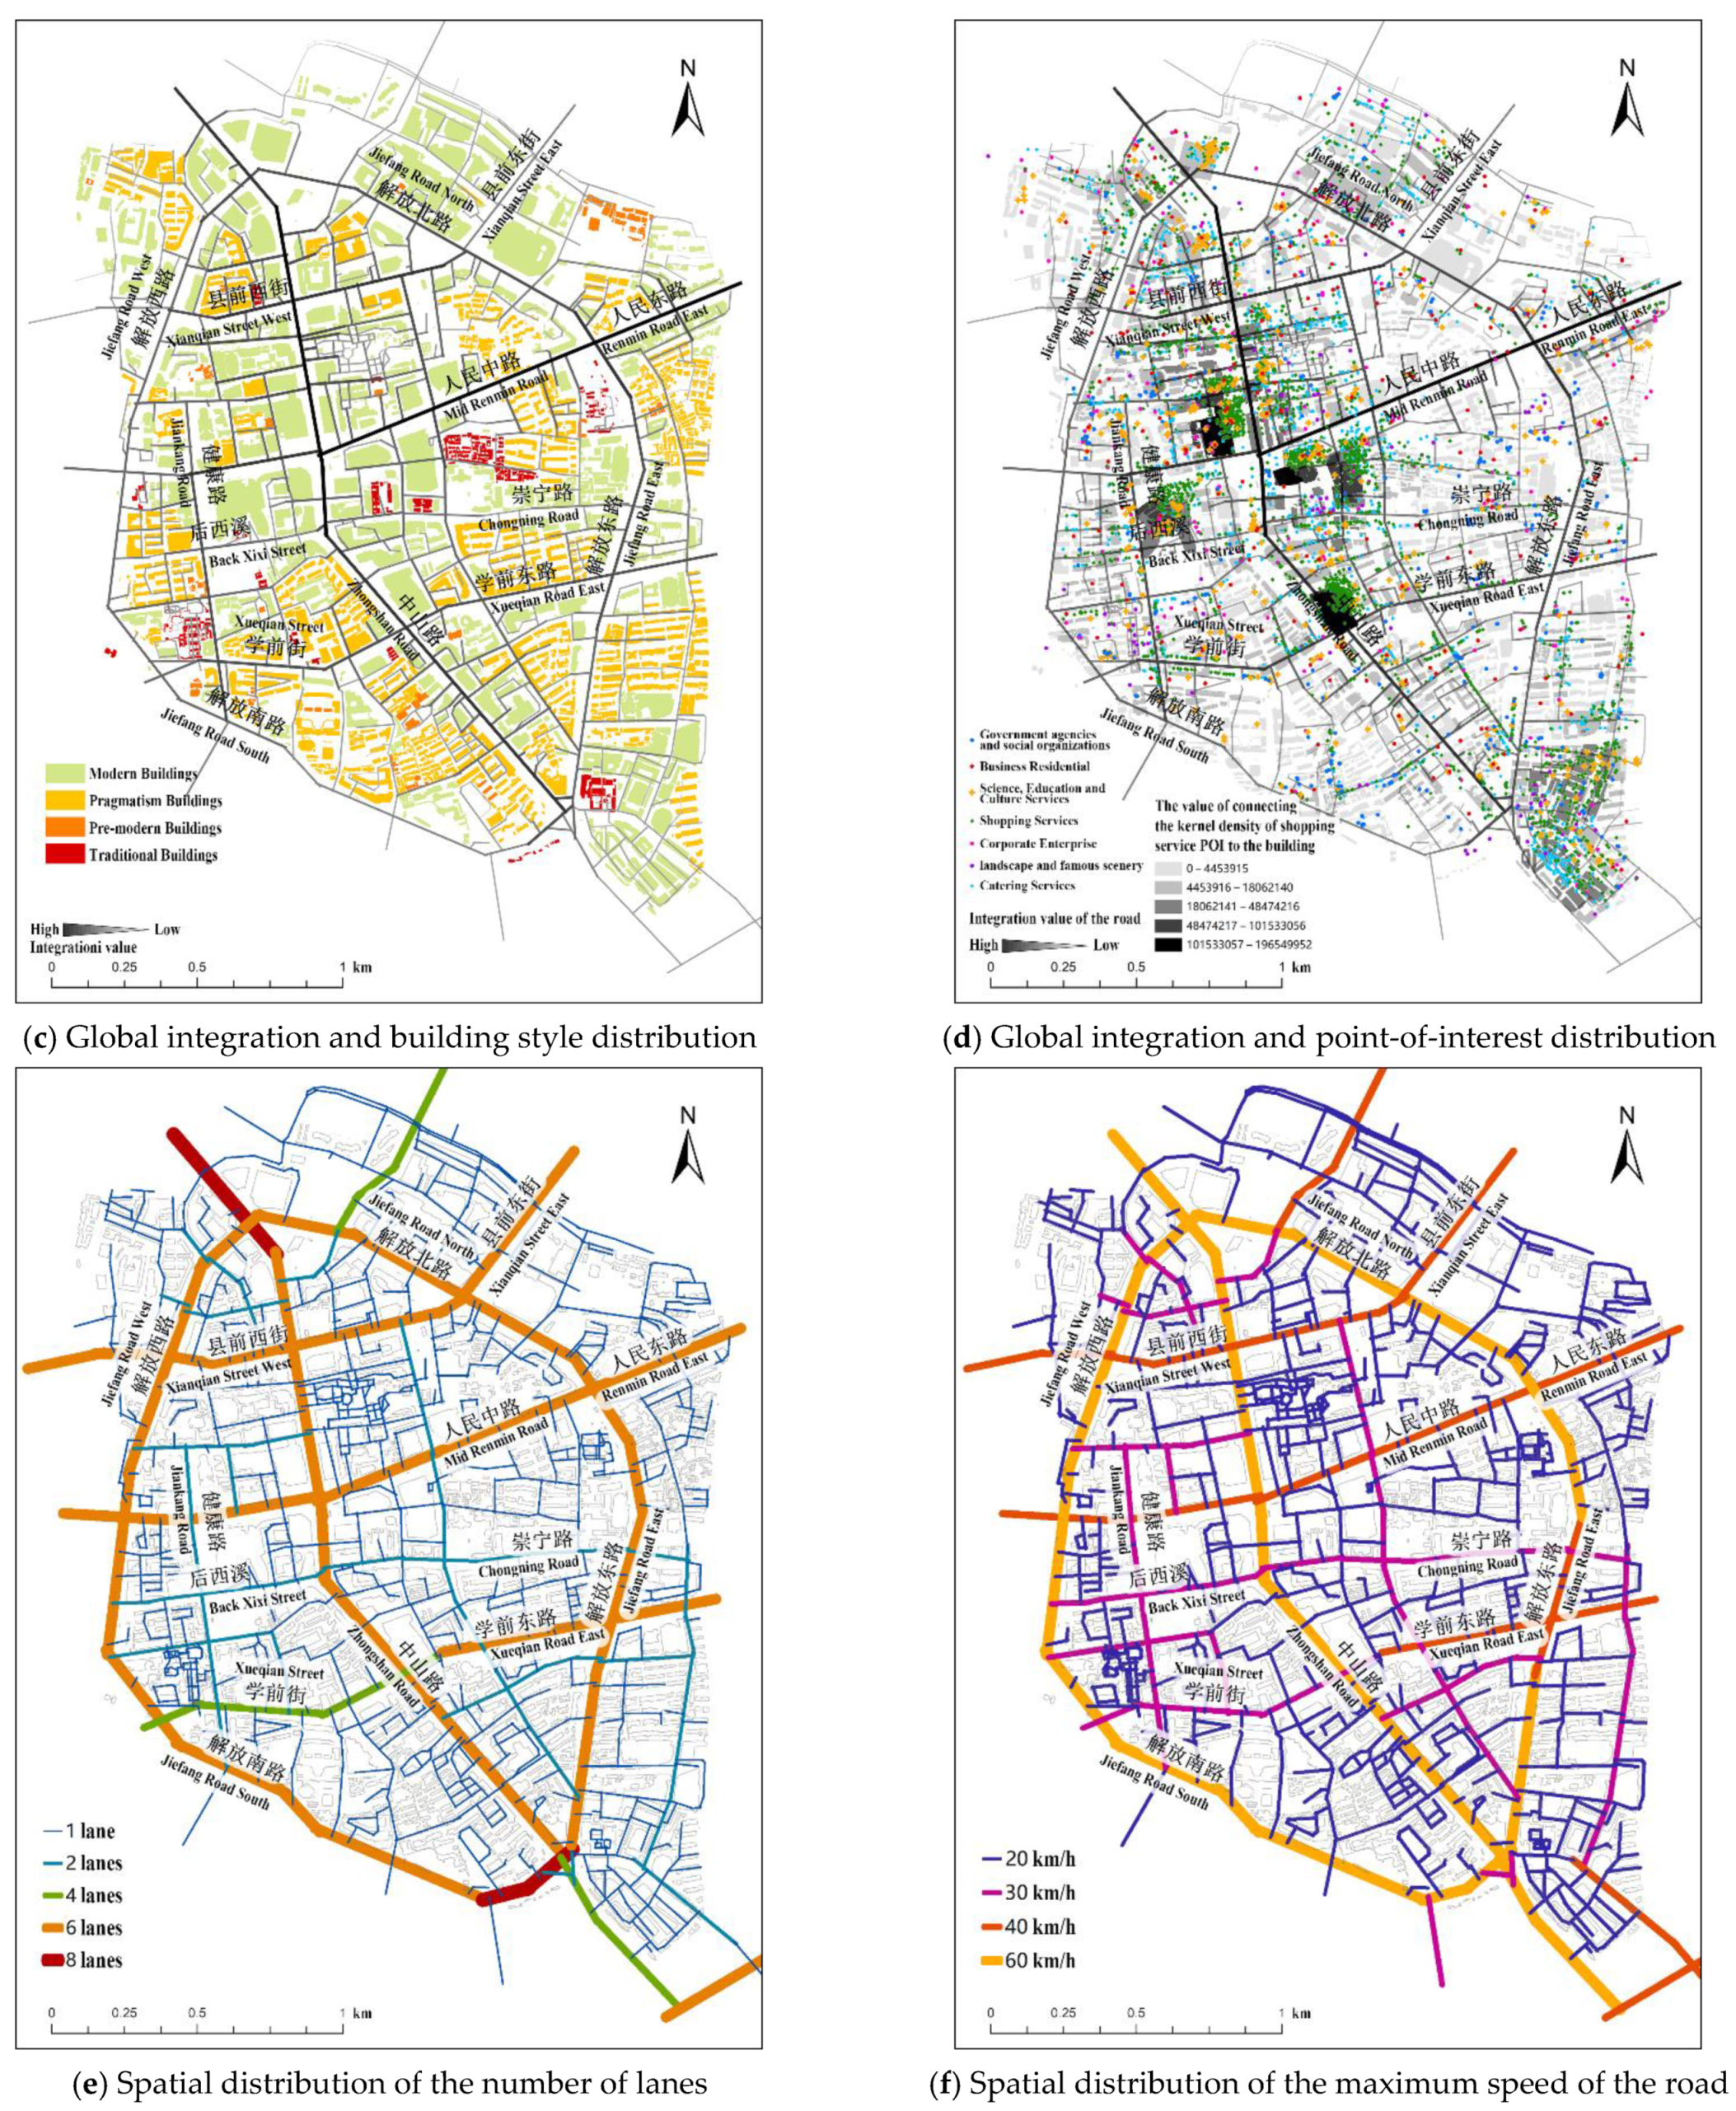
3.3. A Space Affected by Urban Road Construction and Vehicular Traffic

When we study the urban structure in terms of how parts of the city are accessible to each other, different radials make the urban space show different characteristics [28]. This paper investigated the spatial characteristics of the axial map of the old city of Wuxi when the radius was 2 and 5. The calculation results of the axial map under different radii represent the space’s characteristics under different travel modes. When the radius was 2, it represented the characteristics of the space when pedestrian traffic was dominant, whereas, when the radius was increased to 5, it represented the characteristics of the space when vehicle traffic was dominant. The analysis was divided into two parts. First, we ran graph analysis of the axial map with radius = 2 and radius = 5 in Depthmap software and interpreted the visualization results. Second, we analyzed the synergy of the local integration (when the radius was 2 and 5) and global integration [29] and analyzed which traffic mode had a higher synergy between local and global integration. The synergy analysis transformed the axial map into a scatter plot, expressed in Depthmap software as y = ax + b (where a is a coefficient, and b is a constant) with the R-squared value. The calculation result of the formula y = ax + b is a trend line, which is used to predict the trend of the scatter plot. The R-squared value indicates the degree of fitting.
When the radius was 2, the integration of Zhongshan Road, Mid Renmin Road East, Jiefang Road North, and Xianqian Street East in the old urban area of Wuxi was high, while the local integration of all other roads in the urban area was low (Figure 6a). The R-squared value of synergy was 0.34 (Figure 7a).
When the radius was 5, the integration of the main roads in the whole urban area was high, such as Zhongshan Road, Renmin Road, Jiefang Ring Road, Xianqian Street East, Xianqian Street West, Xueqian Street, and Xueqian Road East, and only the integration of the collector street and the road on the periphery of Jiefang Ring Road was low (Figure 6b). The R-squared value of synergy was 0.79 (Figure 7b).
Comparing the integration and the R-squared value of synergy of urban space under different radii, we could find two phenomena. First, whether the radius was 2 or 5, only the main roads had high integration, while other road networks had low integration. When the radius was 2, there were a small number of main roads with high integration. With the increase in radius from 2 to 5, the integration on the main traffic roads in the whole city was higher. However, the integration of the collector street did not increase significantly. It can be concluded that wider urban roads had a more significant impact on urban space than narrower urban roads. Secondly, the R-squared value of 0.79 for radius = 5 was about twice as high as that of 0.34 for radius = 2. Since the integration of space at radius = 5 represented the characteristics of urban space under vehicular traffic, we can assume that vehicular traffic had a more significant impact on urban space than pedestrian traffic. In summary, the wide urban roads and vehicular traffic significantly impacted the space in the old urban area of Wuxi. With the increase in population, the improvement of people’s economic level, and the acceleration of urbanization, vehicle traffic has become the primary mode of transportation. Thus, we have gradually adapted the urban network to vehicle traffic and abandoned the urban network adapted to pedestrian traffic [30]. The transportation mode of vehicle traffic has brought great convenience to people’s lives but has led to the loss of the regional characteristics of the urban spatial pattern.

3.4. A Space with Aggregation and Commerciality

The road network closeness of the old urban area of Wuxi was analyzed using Segment Map. The road network closeness of the space showed different characteristics at different travel distances. When the travel distance was 100 m, the road network closeness of the local area around the western section of Xueqian Street and the northern section of Zhongshan Road was high, while the road network closeness of the vast majority of the urban area was low (Figure 8a). When the travel distance was 500 m, the road network closeness of Xianqian Street East, the northern section of Zhongshan Road, and Xinsheng Road in the old urban area of Wuxi was the highest, while the road network closeness of Jiankang Road and the southern section of Jiefang Road South was also relatively high. In contrast, the road network closeness of all other roads in the urban area was low (Figure 8b). When the travel distance was 1000 m, the road network closeness in the middle section of Zhongshan Road was the highest, while the road network closeness in the area around this section and the area to the north was also high; only the road network closeness in the southern section of Jiefang Road South and on the periphery of Jiefang Ring Road was low (Figure 8c).
According to the above analysis, with the increase in travel distance, the spatial pattern of the old urban area of Wuxi first showed the characteristics of gathering to the central area, located in the center of the space of the old urban area, while the space of the old urban area changed from multi-core to single-core. When the travel distance was short, the areas with high road network closeness were located around the urban area. With the increase in travel distance, the area with high road network closeness became the core area where the main roads of the old urban area intersected.
In addition, the space of the old urban area of Wuxi was characterized by a spatial aggregation toward the commercial center. With the increase in travel distance, the gathering of people in the old urban area changed from the gathering in different spaces such as parks, residences, schools, and commercial areas to the gathering in commercial spaces.
Business drivers and personnel gathering were the most critical factors affecting the spatial pattern. When residents travel short distances, the urban space had a multi-core and multi-functional space pattern, whereas, with the increase in travel distance, people gathered in the commercial space center with high integration and high accessibility. This also reflects that consumer culture has affected space and people’s perception of space [31].

4. Discussion

According to the analysis of the spatial characteristics of the old urban area of Wuxi, the below-described strategies are proposed for the effective construction of the regional characteristics of urban space.

4.1. Reducing the Impact of Road Construction on Urban Space and Maintaining the Independence of the Old Urban Area

The spatial pattern of the old urban area of Wuxi was formed after a long period of evolution; the current single-core spatial pattern is consistent with history, and this spatial characteristic should be continued. We developed a regression model for the effect of the number of lanes on the integration situation. The analysis revealed that the significance value calculated between the number of lanes and integration was 0.00, the standardized coefficients were all positive (Table 3), and the adjusted R-squared value in the models was around 0.14 (Table 4). Therefore, it can be determined that the number of lanes significantly impacted the integration. When the number of lanes was doubled, the integration of space increased by about 14%. In the previous section, we constructed regression models between integration and building height, architectural style, and point-of-interest data. These models revealed a positive correlation between the integration and the geographic information mentioned above. We can conclude that, with the increase in lanes, the integration of urban space would increase; hence, larger buildings, modern buildings, and commercial buildings would be built, further aggravating the loss of the regional identity of the old urban area.
The transportation mode of vehicle traffic has changed the old spatial pattern of the old urban area of Wuxi, and the space has changed from a natural pattern to a mechanical pattern. In the reconstruction of the spatial pattern of the old urban area of Wuxi, the negative impact of vehicular traffic on the spatial structure of the urban area should first be reduced. We should avoid the development of major roads crossing the historic center and the construction of new bridges, as well as reduce the widening of lanes and the construction of new roads. Second, traffic and pedestrian traffic should be separated to control vehicles from crossing the historical areas, and more pedestrian areas should be established in the old urban area.

4.2. Formulating Spatial Zoning and Gradually Transforming the Space of the Old Urban Area

The space of Wuxi’s old urban area has the duality of structure and coupling of spatial information. These characteristics show that the space of the old urban area is abundant. The public spaces of the urban area provide a place for gathering people, while the spaces within the residential area form a close interpersonal relationship between people, and these two spaces form the richness of the overall space [32]. Therefore, for the transformation of the space of the old urban area, we should first formulate the zoning of space and different architectural transformation standards for different areas, and then use organic renewal theory to gradually transform the urban space and restore the historical style of the old urban area.
The areas along the main roads with high integration are essential areas for displaying urban style, and the reconstruction of the regional characteristics of the buildings in these areas can enhance the integrity and regionality of the urban style. It is necessary to make the new buildings conform to the historical features of the old urban area by means of architectural color transformation, building material replacement, facade design, building volume decomposition [33], fractal design, and elevated ground floor design method [34].
There are many historical buildings along the collector streets and the urban fringe areas, and the protection of these buildings is of great significance for constructing the regional features of the old urban area. It is necessary to formulate protection strategies for areas of different sizes, such as single building, block, and urban area, to protect the style of historic buildings and restore the historical pattern of the old urban area.

4.3. Reconstructing the Old Pattern of the Urban Area and Using New Functions to Promote the Historic Area

Although most of the highly integrated areas in the old urban area of Wuxi lack regional characteristics due to the influence of factors such as wide roads and tall commercial buildings, there are still some historical areas on less integrated roads with regional characteristics in the old urban areas. We should purposely make these areas more segregated to promote these areas for the respective kinds of venues. Specifically, they should divided into two parts. First, we should add roads to the periphery of the historic areas to form a grid, which not only allows the historical areas to be connected with the main roads but also keeps these areas relatively isolated and allows them to maintain the scale of the traditional streets and the small-scale urban fabric, to restore the spatial form of the traditional period. Second, consideration can be given to transforming the historical block into a block with new functions such as cultural leisure blocks, tourist attractions, residential areas, and recreation clubs to activate the site and attract tourists [35], such as transforming historical buildings into cultural museums, historical characteristic restaurants, and regional characteristic homestays. Historic buildings can even be transformed into fashion exhibition venues, entrepreneurial incubating bases, and small lecture venues.

5. Conclusions

The spatial transformation of the old cities influences the fate of the historic core, not only in terms of physical morphology but also in terms of various sets of social parameters which incorporate the urban elements [36]. With the large-scale urban demolition, the spatial pattern of the urban area in many cities has been destroyed, leading to the loss of urban regional identity; therefore, these urban spaces need to be urgently studied and protected.
The emergence of massive and multisource urban data provides the basis for a more systematic and scientific study of urban space. Meanwhile, data analysis and integration methods such as space syntax and the geographic information system have provided key theoretical and technical support for the analysis of urban space. Accordingly, this paper conducted a new urban space analysis method based on space syntax and the geographic information system using multisource data. This method has two advantages. First, it can consider many factors in urban space, such as building height, architectural style, building function, number of lanes, and maximum road speed, thus enabling a more comprehensive perception of urban space and then forming a perception of the relationship between static physical space and dynamic social factors of the city. Second, on the basis of the geographic information system, using space syntax and regression analysis, we can establish the relationship model of different geographic information to study urban space more scientifically. Through the empirical study of the old urban area of Wuxi, we established a series of regression models between the integration of road network and building height, architectural style, building function, number of lanes, and maximum road speed, and we drew a series of visual graphics. According to the visualization and quantitative analysis results, we put forward a number of targeted strategies for the protection and reconstruction of the regional characteristics of the old urban area of Wuxi. This new analysis method of urban space is of great significance for the systematic cognition and analysis of urban areas, the study of urban problems, the exploration of urban characteristics, and the proposal of urban strategies. This method and the research conclusions can be extended to the analysis of other regions or cities.

Author Contributions

Conceptualization, Zhaolian Xing and Weimin Guo; methodology, Zhaolian Xing and Weimin Guo; software, Zhaolian Xing; validation, Zhaolian Xing and Weimin Guo; formal analysis, Zhaolian Xing; investigation, Zhaolian Xing; resources, Zhaolian Xing; data curation, Zhaolian Xing and Weimin Guo; writing—original draft preparation, Zhaolian Xing; writing—review and editing, Zhaolian Xing and Weimin Guo; visualization, Zhaolian Xing; supervision, Weimin Guo; project administration, Weimin Guo; funding acquisition, Weimin Guo. All authors have read and agreed to the published version of the manuscript.

Funding

This research was funded by Key Project of Philosophy and Social Sciences Research in Universities of Jiangsu Province ‘Study on the Localization and Pedigree of Jiangsu Modern Foreign Architecture Patterns’, grant number 2018SJZDI146.

Institutional Review Board Statement

Not applicable.

Informed Consent Statement

Informed consent was obtained from all subjects involved in the study.

Data Availability Statement

Data sharing not applicable.

Acknowledgments

We would like to thank the editors and anonymous reviewers for their constructive suggestions and comments, which helped improve this paper’s quality.

Conflicts of Interest

The authors declare no conflict of interest.

References

  1. Xu, J. Research on the Spatial form of the Seat City in the Middle Reaches of the Han River in Ming and Qing Dynasties. Ph.D. Thesis, Huazhong University of Science and Technology, Wuhan, China, 2013. [Google Scholar]
  2. Zhang, Q.; Tong, M. The Changes and Renewal: Old Town Structure of Suzhou. City Plan. Rev. 1999, 23, 33–37. [Google Scholar]
  3. Tong, M. How Urban Fabric Can Help Sustain the Vitality of Cities. Urban Plan. Forum 2014, 21, 85–96. [Google Scholar]
  4. Zhong, C.; Fang, Y.; Wang, X.; Xu, J.; Hu, J. The Plan and Evolution of “Xiang” of Changzhou City from Song Dynasty. J. Hangzhou Norm. Univ. (Humanit. Soc. Sci.) 2016, 38, 100–108. [Google Scholar]
  5. Long, Y. (New) Urban Science: Studying “New” Cities With New Data, Methods, and Technologies. Landsc. Archit. Front. 2019, 7, 8–21. [Google Scholar] [CrossRef]
  6. Li, Y.; Xiao, L.Z.; Ye, Y.; Xu, W.T.; Law, A. Understanding tourist space at a historic site through space syntax analysis: The case of Gulangyu, China. Tour. Manag. 2016, 52, 30–43. [Google Scholar] [CrossRef]
  7. Yue, Y.; Zhuang, Y.; Yeh, A.G.O.; Xie, J.Y.; Ma, C.L.; Li, Q.Q. Measurements of POI-based mixed use and their relationships with neighbourhood vibrancy. Int. J. Geogr. Inf. Sci. 2017, 31, 658–675. [Google Scholar] [CrossRef] [Green Version]
  8. Xu, Y.B.; Rollo, J.; Jones, D.S.; Esteban, Y.; Tong, H.; Mu, Q.P. Towards Sustainable Heritage Tourism: A Space Syntax-Based Analysis Method to Improve Tourists’ Spatial Cognition in Chinese Historic Districts. Buildings 2020, 10, 29. [Google Scholar] [CrossRef] [Green Version]
  9. Liu, S.J.; Zhang, L.; Long, Y.; Long, Y.; Xu, M.H. A New Urban Vitality Analysis and Evaluation Framework Based on Human Activity Modeling Using Multi-Source Big Data. Isprs Int. J. Geo-Inf. 2020, 9, 617. [Google Scholar] [CrossRef]
  10. Liu, K.; Yin, L.; Lu, F.; Mou, N.X. Visualizing and exploring POI configurations of urban regions on POI-type semantic space. Cities 2020, 99, 102610. [Google Scholar] [CrossRef]
  11. Askarizad, R.; Safari, H. The influence of social interactions on the behavioral patterns of the people in urban spaces (case study: The pedestrian zone of Rasht Municipality Square, Iran). Cities 2020, 101, 102687. [Google Scholar] [CrossRef]
  12. Sen, E.; Baran, M. Examination of Traditional Residences in Bitlis on the Zeydan District Scale in the Context of Space Syntax Analysis Techniques. Sage Open 2020, 10. [Google Scholar] [CrossRef]
  13. Chen, M.S.; Ko, Y.T.; Hsieh, W.C. Exploring the Planning and Configuration of the Hospital Wayfinding System by Space Syntax: A Case Study of Cheng Ching Hospital, Chung Kang Branch in Taiwan. Isprs Int. J. Geo-Inf. 2021, 10, 570. [Google Scholar] [CrossRef]
  14. Andrakakou, M.; Kessler, C. Investigating configurational and active centralities: The example of metropolitan Copenhagen. Environ. Plan. B Urban Anal. City Sci. 2022, 23998083211072861. [Google Scholar] [CrossRef]
  15. Tan, D.; Wu, J. Objective evaluation of urban living environment based on GlS technology—A case study of Guangzhou Liwan district. J. Xi’an Univ. Archit. Technol. (Nat. Sci. Ed.) 2021, 53, 229–238. [Google Scholar]
  16. Hillier, B.; Hanson, J. The Social Logic of Space; Cambridge University Press: Cambridge, UK, 1989. [Google Scholar]
  17. Hanson, J. Order and structure in urban design: The plans for the rebuilding of London after the Great Fire of 1666. Ekistics 1989, 56, 22–42. [Google Scholar]
  18. Hillier, B. Specifically architectural theory: A partial account of the ascent from building as cultural transmission to architecture as theoretical concretion. Harv. Archit. Rev. 1993, 9, 8–27. [Google Scholar]
  19. Hillier, B.; Iida, S. Network effects and psychological effects: A theory of urban movement. In Proceedings of the Proceedings of the 5th International Symposium on Space Syntax, Delft, Switzerland, 13–17 June 2005; pp. 553–564. [Google Scholar]
  20. Hillier, B.; Turner, A.; Yang, T.; Park, H.-T. Metric and topo-geometric properties of urban street networks: Some convergences, divergences and new results. J. Space Syntax. Stud. 2009. Available online: https://discovery.ucl.ac.uk/id/eprint/18583 (accessed on 11 March 2022).
  21. Hillier, B. The hidden geometry of deformed grids: Or, why space syntax works, when it looks as though it shouldn’t. Environ. Plan. B Plan. Des. 1999, 26, 169–191. [Google Scholar] [CrossRef]
  22. Hillier, B. A theory of the city as object: Or, how spatial laws mediate the social construction of urban space. Urban Des. Int. 2002, 7, 153–179. [Google Scholar] [CrossRef] [Green Version]
  23. Hillier, B. Cities as movement economies. Urban Des. Int. 1996, 1, 41–60. [Google Scholar] [CrossRef]
  24. Hillier, B. Space is the Machine: A Configurational Theory of Architecture; Cambridge University Press: Cambridge, UK, 1996. [Google Scholar]
  25. Turner, A.; Penn, A.; Hillier, B. An algorithmic definition of the axial map. Environ. Plan. B Plan. Des. 2005, 32, 425–444. [Google Scholar] [CrossRef]
  26. Turner, A. From axial to road-centre lines: A new representation for space syntax and a new model of route choice for transport network analysis. Environ. Plan. B Plan. Des. 2007, 34, 539–555. [Google Scholar] [CrossRef] [Green Version]
  27. Zhang, P.; Zhang, N. Quantitative Analysis of the Narrative Environment of Urban Historic City based on Space Syntax. Urban Dev. Stud. 2017, 24, 17–22. [Google Scholar]
  28. Hillier, W.; Yang, T.; Turner, A. Normalising least angle choice in Depthmap-and how it opens up new perspectives on the global and local analysis of city space. J. Space Syntax. 2012, 3, 155–193. [Google Scholar]
  29. Zhu, D. Urban Spatial Development of Suzhou Since 1990: A Study on Dual-Organization Mechanism of Urban Topological Structure. Ph.D. Thesis, Southeast University, Nanjing, China, 2006. [Google Scholar]
  30. Salingaros, N. Principles of Urban Structure; China Architecture & Building Press: Beijing, China, 2011. [Google Scholar]
  31. Ji, S.; Duan, J. Consumption of Space: Urban Development in the Perspective of Consumer Culture; Southeast University Press: Nanjing, China, 2012; Volume 2. [Google Scholar]
  32. Hillier, B.; Yang, T. The Art of Place and The Science of Space. World Archit. 2005, 185, 16–26. [Google Scholar]
  33. Yang, T. Open Space Design in Historic District during Urban Renewal. Master’s Thesis, Xi’an University of Architecture and Technology, Xi’an, China, 2006. [Google Scholar]
  34. Wang, B.; Kang, J. Efects of Large Buildings in Urban Centers on Amenity of Urban Spaces. Archit. J. 2013, 60, 20–24. [Google Scholar]
  35. Xu, J. The Revitalization and Utilization of Architectural Heritage Discussed in the Perspective of Economics. Southeast Cult. 2020, 35, 13–20. [Google Scholar]
  36. Karimi, K. Continuity and Change in Old Cities: An Analytical Investigation of the Spatial Structure in Iranian and English Historic Cities before and After Modernisation; University of London, University College London: London, UK, 1998. [Google Scholar]
Figure 1. Conceptual framework of new urban space analysis method. Source: drawn by the author.
Ijgi 11 00297 g001
Figure 2. Distribution of ancient rivers in the old urban area of Wuxi. Source: Reprinted/adapted with permission from Ref. [Wuxi: A hundred-year review of a city of water in the south of the Yangtze River]. 2018, Wang, C.
Ijgi 11 00297 g002
Figure 3. The current and ancient conditions of the old urban area of Wuxi. Source: https://720yun.com/t/2a0jeOyvsy7?scene_id=17652944 (accessed on 30 April 2022); Reprinted/adapted with permission from Ref. [Wuxi County Annals]. 2008, Wuxi County Annals editorial board.
Ijgi 11 00297 g003
Figure 4. Global integration distribution of the old urban area of Wuxi. Source: drawn by the author.
Ijgi 11 00297 g004
Figure 5. Global integration and geographic information distribution of the old urban area of Wuxi. Source: drawn by the author.
Ijgi 11 00297 g005aIjgi 11 00297 g005b
Figure 6. Local integration distribution of the old urban area of Wuxi. Source: drawn by the author.
Ijgi 11 00297 g006
Figure 7. Synergy scatter chart of the old urban area of Wuxi. Source: drawn by the author.
Ijgi 11 00297 g007
Figure 8. Road network closeness and geographic information distribution of the old urban area of Wuxi. Source: drawn by the author.
Ijgi 11 00297 g008
Table 1. Correlation between global integration and geographic information.
Coefficients *ModelUnstandardized
Coefficients
Standardized
Coefficients
tSig.Collinearity
Statistics
BStd. ErrorBetaToleranceVIF
1(Constant)2.349 × 10−150.01 0.001.00
Z-score (Integration)0.160.010.1615.810.001.001.00
2(Constant)−7.691 × 10−150.01 0.001.00
Z-score (Integration)0.170.010.1716.920.001.001.00
3(Constant)1.637 × 10−160.01 0.001.00
Z-score (Integration)0.160.010.1616.350.001.001.00
4(Constant)−2.024 × 10−150.03 0.001.00
Z-score (Integration)0.370.030.3712.290.001.001.00
5(Constant)−4.283 × 10−150.03 0.001.00
Z-score (Integration)0.370.030.3712.120.001.001.00
* Model 1. Dependent variable: Z-score of building height. Model 2. Dependent variable: Z-score of building style. Model 3. Dependent variable: Z-score of shopping service points of interest. Model 4. Dependent variable: Z-score of the number of lanes. Model 5. Dependent variable: Z-score of the maximum road speed.
Table 2. Fitting degree of regression model between global integration and geographic information.
Model Summary *ModelRR-SquaredAdjusted R-SquaredStd. Error of the Estimate
10.160.020.020.99
20.170.030.030.99
30.160.030.030.99
40.370.140.140.93
50.370.140.140.93
* Predictors: (Constant), Z-score (Integration). Model 1. Dependent variable: Z-score of building height. Model 2. Dependent variable: Z-score of building style. Model 3. Dependent variable: Z-score of shopping service points of interest. Model 4. Dependent variable: Z-score of the number of lanes. Model 5. Dependent variable: Z-score of the maximum road speed.
Table 3. Correlation between number of lanes and global integration.
Coefficients *ModelUnstandardized CoefficientsStandardized
Coefficients
tSig.Collinearity Statistics
BStd. ErrorBetaToleranceVIF
1(Constant)5.446 × 10−150.03 0.001.00
Z-score (The number of lanes)0.370.030.3712.300.001.001.00
* Model 1. Dependent variable: Z-score of integration.
Table 4. Fitting degree of regression model between the number of lanes and global integration.
Model Summary *ModelRR-SquaredAdjusted R-SquaredStd. Error of the Estimate
10.370.140.140.93
* Predictors: (Constant), Z-score of the number of lanes. Dependent variable: Z-score of integration.
Publisher’s Note: MDPI stays neutral with regard to jurisdictional claims in published maps and institutional affiliations.

