
Inventory and Distribution Characteristics of Large-Scale Landslides in Baoji City, Shaanxi Province, China


Abstract
:1. Introduction
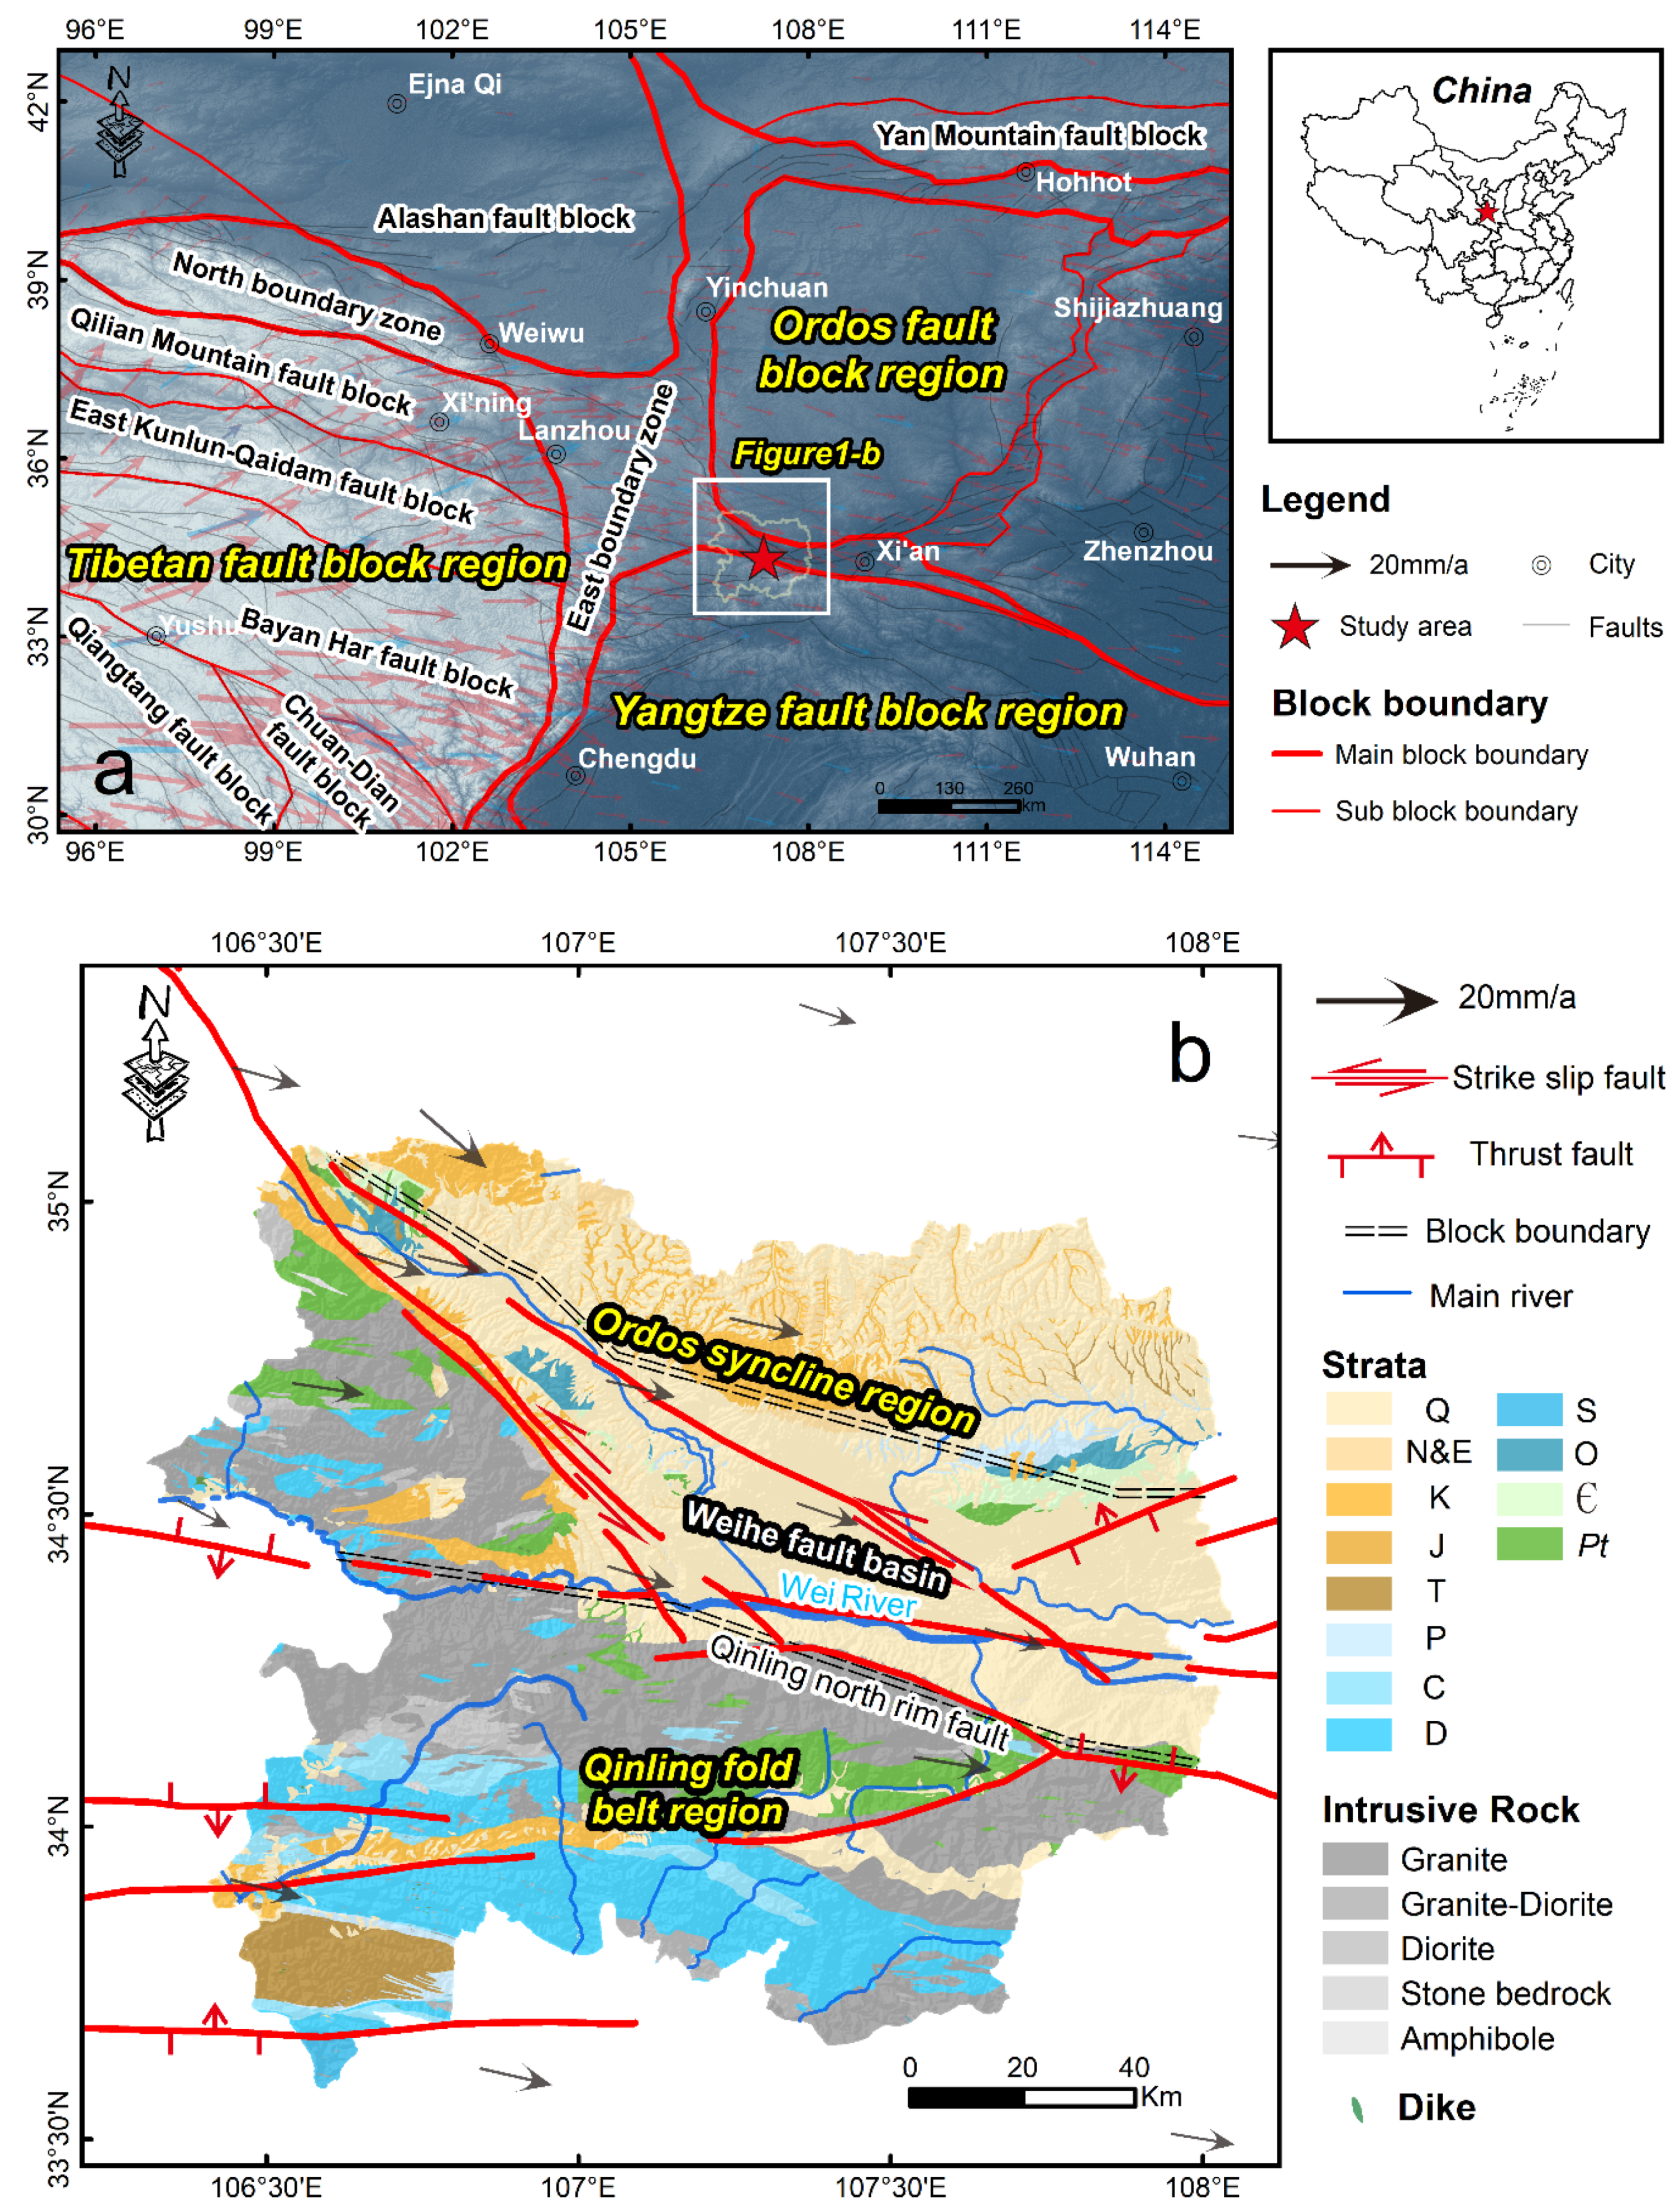
2. Study Area
3. Landslide Inventory
3.1. Visual Interpretation
3.2. Inventory of Large Landslides
4. GIS Spatial Analysis of Landslides
4.1. Influencing Factors
4.2. Statistics and Analysis
5. Results
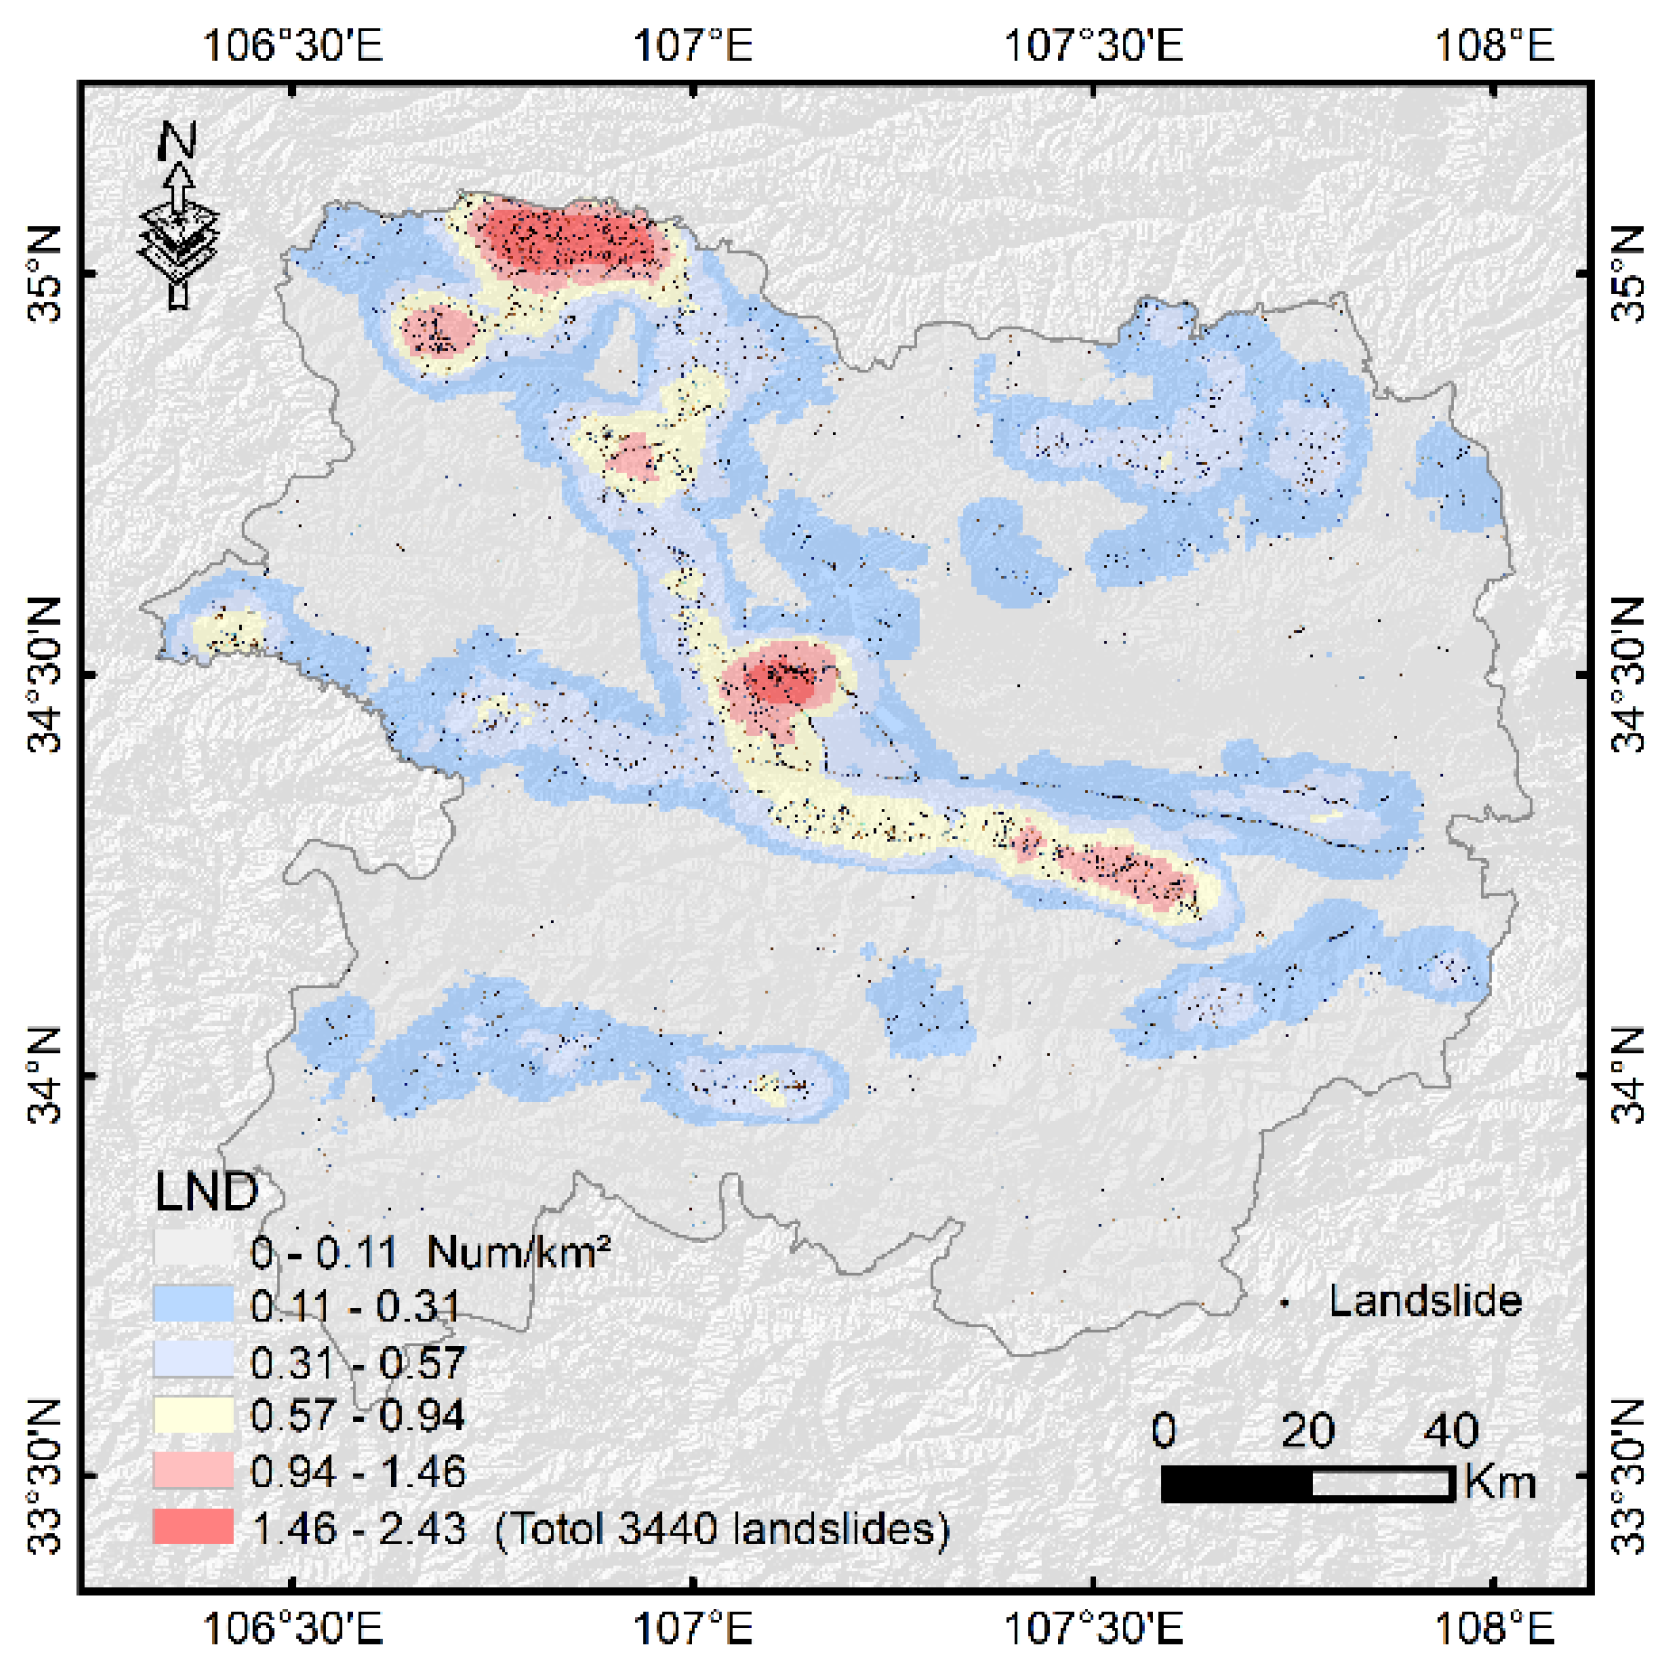
5.1. Overall Distribution Characteristics of Large Landslides
5.2. Correlation between Landslides and Influencing Factors
5.2.1. Topographic Factors
5.2.2. Geological Factors
5.2.3. Hydrological Factors
6. Discussion
6.1. Landslide Inventory
6.2. Spatial Distribution of Large Landslides
6.3. Correlation between Landslides and Influencing Factors
6.4. Comparison with Existing Landslide Databases
7. Conclusions
Author Contributions
Funding
Institutional Review Board Statement
Informed Consent Statement
Acknowledgments
Conflicts of Interest
References
- Huang, F.; Chen, J.; Du, Z.; Yao, C.; Huang, J.; Jiang, Q.; Chang, Z.; Li, S. Landslide susceptibility prediction considering regional soil erosion based on machine-learning models. Int. J. Geo-Inf. 2020, 9, 377. [Google Scholar] [CrossRef]
- Moharrami, M.; Naboureh, A.; Gudiyangada, N.; Thimmaiah; Ghorbanzadeh, O.; Guan, X.; Blaschke, T. National-scale landslide susceptibility mapping in Austria using fuzzy best-worst multi-criteria decision-making. Int. J. Geo-Inf. 2020, 9, 393. [Google Scholar] [CrossRef]
- Kim, J.-W.; Lu, Z.; Qu, F.; Hu, X. Pre-2014 mudslides at Oso revealed by Insar and multi-source dem analysis. Geomat. Nat. Hazards Risk 2015, 6, 184–194. [Google Scholar] [CrossRef]
- Xu, C.; Xu, X. Construction of basic earthquake-triggered landslides dataset for several large earthquake events at the beginning of the twenty-first century. Seismol. Geol. 2014, 36, 90–104. (In Chinese) [Google Scholar]
- Guzzetti, F.; Carrara, A.; Cardinali, M.; Reichenbach, P. Landslide hazard evaluation: A review of current techniques and their application in a multi-scale study, Central Italy. Geomorphology 1999, 31, 181–216. [Google Scholar] [CrossRef]
- Piacentini, D.; Troiani, F.; Daniele, G.; Pizziolo, M. Historical geospatial database for landslide analysis: The catalogue of landslide occurrences in the emilia-romagna region (CLOCkER). Landslides 2018, 15, 811–822. [Google Scholar] [CrossRef]
- Sapir, D.G.; Misson, C. The development of a database on disasters. Disasters 1992, 16, 74–80. [Google Scholar] [CrossRef]
- Kirschbaum, D.; Stanley, T.; Zhou, Y. Spatial and temporal analysis of a global landslide catalog. Geomorphology 2015, 249, 4–15. [Google Scholar] [CrossRef]
- Stanley, T.; Kirschbaum, D.B. A heuristic approach to global landslide susceptibility mapping. Nat. Hazards 2017, 87, 145–164. [Google Scholar] [CrossRef] [Green Version]
- Ohmori, H.; Sugai, T. Toward geomorphometric models for estimating landslide dynamics and forecasting landslide occurrence in Japanese mountains. Z. Geomorphol. 1995, 101, 149–164. [Google Scholar]
- Van Den Eeckhaut, M.; Hervás, J. State of the art of national landslide databases in Europe and their potential for assessing landslide susceptibility, hazard and risk. Geomorphology 2012, 139–140, 545–558. [Google Scholar] [CrossRef]
- Pennington, C.; Freeborough, K.; Dashwood, C.; Dijkstra, T.; Lawrie, K. The national landslide database of Great Britain: Acquisition, communication and the role of social media. Geomorphology 2015, 249, 44–51. [Google Scholar] [CrossRef] [Green Version]
- Taylor, F.E.; Malamud, B.D.; Freeborough, K.; Demeritt, D. Enriching great Britain’s national landslide database by searching newspaper archives. Geomorphology 2015, 249, 52–68. [Google Scholar] [CrossRef] [Green Version]
- Damm, B.; Klose, M. The landslide database for Germany: Closing the gap at national level. Geomorphology 2015, 249, 82–93. [Google Scholar] [CrossRef]
- Guzzetti, F. Landslide fatalities and the evaluation of landslide risk in Italy. Eng. Geol. 2000, 58, 89–107. [Google Scholar] [CrossRef]
- Sabatakakis, N.; Koukis, G.; Vassiliades, E.; Lainas, S. Landslide susceptibility zonation in Greece. Nat. Hazards 2013, 65, 523–543. [Google Scholar] [CrossRef]
- Tonini, M.; Pecoraro, G.; Romailler, K.; Calvello, M. Spatio-temporal cluster analysis of recent Italian landslides. Georisk Assess. Manag. Risk Eng. Syst. Geohazards 2020, 1–19. [Google Scholar] [CrossRef]
- Denys, B. Mass movement; the research frontier and beyond: A geomorphological approach. Geomorphology 1993, 7, 85–128. [Google Scholar]
- Xu, C.; Xu, X.; Shyu, J.B.H.; Gao, M.; Tan, X.; Ran, Y.; Zheng, W. Landslides triggered by the 20 April 2013 Lushan, China, mw 6.6 earthquake from field investigations and preliminary analyses. Landslides 2015, 12, 365–385. [Google Scholar] [CrossRef]
- Pike, R.J. The geometric signature: Quantifying landslide-terrain types from digital elevation models. Math. Geol. 1988, 20, 491–511. [Google Scholar] [CrossRef]
- Xu, J.; Xu, C.; He, X.; Wen, B.; Ge, K.; Bai, Y. Spatial distribution of seismic landslides in the areas of 1927 Gulang M8.0 earthquake. Earthq. Res. China 2020, 34, 5–28. [Google Scholar]
- Peng, J.; Wang, S.; Wang, Q.; Zhuang, J.; Huang, W.; Zhu, X.; Leng, Y.; Ma, P. Distribution and genetic types of loess landslides in China. J. Asian Earth Sci. 2019, 170, 329–350. [Google Scholar] [CrossRef]
- Xu, Y.; Allen, M.B.; Zhang, W.; Li, W.; He, H. Landslide characteristics in the loess plateau, northern China. Geomorphology 2020, 359, 107–150. [Google Scholar] [CrossRef]
- Zhuang, J.; Peng, J.; Wang, G.; Javed, I.; Wang, Y.; Li, W. Distribution and characteristics of landslide in loess plateau: A case study in Shaanxi province. Eng. Geol. 2018, 236, 89–96. [Google Scholar] [CrossRef]
- Wei, X.; Zhang, M.; Xiao, P. Developmental characteristic, regularities of distribution of the slide, which is a geological disaster, in Baota district of Yan’an city. Shanxi Archit. 2006, 32, 115–116. (In Chinese) [Google Scholar]
- Shi, J.; Li, B.; Wu, S.; Wang, T.; Xin, P. Mechanism of large-scale slide at edge of Loess Plateau on north of weihe river in Baoji urban area, Shaanxi Province. J. Eng. Geol. 2013, 6, 938–949. (In Chinese) [Google Scholar]
- Zhao, B.; Huang, Y.; Zhang, C.; Wang, W.; Tan, K.; Du, R. Crustal deformation on the Chinese mainland during 1998–2014 based on GPS data. Geod. Geodyn. 2015, 6, 7–15. [Google Scholar] [CrossRef] [Green Version]
- Deng, Q.; Cheng, S.; Ma, J.; Du, P. Seismic activities and earthquake potential in the Tibetan Plateau. Chin. J. Geophys. 2014, 57, 2025–2042. [Google Scholar]
- Xu, L.; Yan, D.; Zhao, T. Probabilistic evaluation of loess landslide impact using multivariate model. Landslides 2020, 18, 1011–1023. [Google Scholar] [CrossRef]
- Xu, C.; Wu, Y.; Xu, X. Earthquake-triggered landslides in the loess plateau and its adjacent areas. J. Eng. Geol. 2018, 26 (Suppl. 1), 260–273. (In Chinese) [Google Scholar]
- Xu, C.; Tian, Y.; Ma, S.; Xu, X.; Zhou, B.; Wu, X.; Zhuang, J.; Gao, Y.; Wu, W.; Huang, X. Inventory and spatial distribution of landslides in IX-XI high intensity areas of 1920 Haiyuan (China) M8.5 earth-quake. J. Eng. Geol. 2018, 26, 1188–1196. (In Chinese) [Google Scholar]
- Cui, Y.; Bao, P.; Xu, C.; Ma, S.; Zheng, J.; Fu, G. Landslides triggered by the 6 September 2018 mw 6.6 Hokkaido, Japan: An updated inventory and retrospective hazard assessment. Earth Sci. Inform. 2020, 14, 247–258. [Google Scholar] [CrossRef]
- Rabby, Y.W.; Li, Y. An integrated approach to map landslides in Chittagong hilly areas, Bangladesh, using google earth and field mapping. Landslides 2018, 16, 633–645. [Google Scholar] [CrossRef]
- Crosby, C. Lidar and Google Earth: Simplifying access to high-resolution topography data. Spec. Pap. Geol. Soc. Am. 2012, 492, 37–47. [Google Scholar]
- Shao, X.; Xu, C.; Ma, S.; Zhou, Q. Effects of seismogenic faults on the predictive mapping of probability to earthquake-triggered landslides. Int. J. Geo-Inf. 2019, 8, 328. [Google Scholar] [CrossRef] [Green Version]
- Xu, C. Preparation of earthquake-triggered landslide inventory maps using remote sensing and gis technologies: Principles and case studies. Geosci. Front. 2015, 6, 825–836. [Google Scholar] [CrossRef] [Green Version]
- Cruden, D.; Varnes, D.J. Landslide Types and Processes; National Academy Press: Washington, DC, USA, 1996. [Google Scholar]
- Shao, X.; Ma, S.; Xu, C.; Shen, L.; Lu, Y. Inventory, distribution and geometric characteristics of landslides in Baoshan city, Yunnan province, China. Sustainability 2020, 12, 2433. [Google Scholar] [CrossRef] [Green Version]
- Xu, G.; Zheng, D.; Li, S.; Qiao, Z.; Cong, N. Remote sensing images and distribution characteristics of avalanche and landslide geohazards in the western part of the Weibei Plateau, Shaanxi Province, China. Geol. Bull. China 2008, 27, 1837–1845. (In Chinese) [Google Scholar]
- Meng, J.; Hu, Q.; Shi, J.; Xin, P.; Li, B.; Wang, T. Research on basic features and stability of large and deep-seated loess landslide on the north bank of the weihe river in Baoji area. J. Geomech. 2018, 24, 78–86. (In Chinese) [Google Scholar]
- Xin, P.; Hu, L.; Wang, T.; Fan, L.; Wu, S.; Shi, J. The application of displacement-stress synergetic analysis to landslide monitoring: A case study of Beipo landslides in Baoji City, Shaanxi Province. Acta Geosci. Sin. 2020, 41, 37–48. (In Chinese) [Google Scholar]
- Wang, C. Study on Formation Mechanism and Stability of Loess Landslide in Beipo Village of Didian County, Baoji City. Master’s Thesis, Xi’an Technological University, Xi’an, China, 2019. [Google Scholar]
- Wang, H.; Zhou, B.; Wu, S.; Shi, J.; Li, B. Characteristic analysis of large-scale loess landslides: A case study in Baoji City of Loess Plateau of northwest China. Nat. Hazards Earth Syst. Sci. 2011, 11, 1829–1837. [Google Scholar] [CrossRef]
- Yang, G.; Xu, P.; Cao, C.; Zhang, W.; Lan, Z.; Chen, J.; Dong, X. Assessment of regional landslide susceptibility based on combined model of certainty factor method. J. Eng. Geol. 2019, 27, 1153–1163. (In Chinese) [Google Scholar]
- Andrew, K.S. Terrain position as mapped from a gridded digital elevation model. Int. J. Geogr. Inf. Sci. 1990, 4, 33–49. [Google Scholar]
- Deng, Q.; Cheng, S.; Ma, J.; Du, P. Seismic activities and earthquake potential in the Tibetan Plateau. Chin. J. Geophys. 2014, 57, 678–697. (In Chinese) [Google Scholar] [CrossRef]
- Xu, C.; Ma, S.; Tan, Z.; Xie, C.; Toda, S.; Huang, X. Landslides triggered by the 2016 Mj 7.3 Kumamoto, Japan, earthquake. Landslides 2017, 15, 551–564. [Google Scholar] [CrossRef]
- Ciurleo, M.; Calvello, M.; Cascini, L. Susceptibility zoning of shallow landslides in fine grained soils by statistical meth-ods. Catena 2016, 139, 250–264. [Google Scholar] [CrossRef]
- Parker, R.N.; Densmore, A.L.; Rosser, N.J.; Michele, M.; Li, Y.; Huang, R.; Whadcoat, S.; Petley, D.N. Mass wasting triggered by the 2008 Wenchuan earthquake is greater than orogenic growth. Nat. Geosci. 2011, 4, 449–452. [Google Scholar] [CrossRef] [Green Version]
- Harp, E.L.; Keefer, D.K.; Sato, H.P.; Yagi, H. Landslide inventories: The essential part of seismic landslide hazard analyses. Eng. Geol. 2011, 122, 9–21. [Google Scholar] [CrossRef]
- Xu, Y.; Du, P.; Li, W.; Zhang, W.; Tian, Q.; Xiong, R.; Wang, L. A case study on AD 1718 Tongwei M 7.5 earthquake triggered landslides—application of landslide database triggered by historical strong earthquakes on the Loess Plateau. Chin. J. Geophys. 2020, 63, 1235–1248. (In Chinese) [Google Scholar]
- Qiao, D.; Li, Z. Engineering Geology in Loess Areas; Water Resources and Electric Power Press: Beijing, China, 1990. (In Chinese) [Google Scholar]
- Xu, C.; Xu, X.; Wu, X.; Dai, F.; Yao, X.; Yao, Q. Detailed catalog of landslides triggered by the 2008 Wenchuan earthquake and statistical analyses of their spatial distribution. J. Eng. Geol. 2013, 21, 25–44. (In Chinese) [Google Scholar]
- Xu, Z.; Lin, Z.; Zhang, M. Loess in China and loess landslides. Chin. J. Rock Mech. Eng. 2007, 26, 1297–1312. (In Chinese) [Google Scholar]
- Le, Z. The distribution pattern of geological hazards and its application. J. Gansu Sci. 1996, 8, 123–128. (In Chinese) [Google Scholar]
- Lei, X. Models of loess stratigraphical structure on the terraces in the Loess Plateau of China. Mar. Geol. Quat. Geol. 2006, 2, 113–122. (In Chinese) [Google Scholar]
- Wang, N. Study on the Growing Laws and Controlling Measures for Loess Landslide. Ph.D. Thesis, Chengdu University of Technology, Chengdu, China, 2004. (In Chinese). [Google Scholar]
- Hu, S. Spatial Pattern of Landslide in Loess Plateau and Its Influence on Geomorphologic Evolution. Ph.D. Thesis, Northwest University, Xi’an, China, 2019. (In Chinese). [Google Scholar]
- Tian, Y.; Xu, C.; Xu, X.; Chen, J. Detailed inventory mapping and spatial analyses to landslides induced by the 2013 ms 6.6 Minxian earthquake of China. J. Earth Sci. 2016, 27, 1016–1026. [Google Scholar] [CrossRef]
- Qiu, H.; Regmi, A.D.; Cui, P.; Hu, S.; Wang, Y.; He, Y. Slope aspect effects of loess slides and its spatial differentiation in different geomorphologic types. Arab. J. Geosci. 2017, 10, 344. [Google Scholar] [CrossRef]
- Duan, Z.; Li, W.; Wang, Q. Types and spatial-temporal distribution of loess landslides in the south plateau of lower Jing river. J. Xi’an Univ. Sci. Technol. 2015, 35, 369–375. (In Chinese) [Google Scholar]
- Peng, J.; Leng, Y.; Zhu, X.; Wu, D.; Tong, X. Development of a loess-mudstone landslide in a fault fracture zone. Environ. Earth Sci. 2016, 75, 658. [Google Scholar] [CrossRef]
- Peng, J.; Wu, D.; Duan, Z.; Tang, D.; Cheng, Y.; Che, W.; Huang, W.; Wang, Q.; Zhuang, J. Disaster characteristics and destructive mechanism of typical loess landslide cases triggered by human engineering activities. J. Southwest Jiaotong Univ. 2016, 51, 971–980. (In Chinese) [Google Scholar]
- Xu, L.; Dai, F.; Tu, X.; Tham, L.G.; Zhou, Y.; Iqbal, J. Landslides in a loess platform, north-west China. Landslides 2013, 11, 993–1005. [Google Scholar] [CrossRef]
- Shi, J.; Wu, L.; Wu, S.; Li, B.; Wang, T.; Xin, P. Analysis of the causes of large-scale loess landslides in Baoji, China. Geomorphology 2016, 264, 109–117. [Google Scholar] [CrossRef]
- Peng, D.; Xu, Q.; Liu, F.; He, Y.; Zhang, S.; Qi, X.; Zhao, K.; Zhang, X. Distribution and failure modes of the landslides in Heit-ai terrace, China. Eng. Geol. 2018, 236, 97–110. [Google Scholar] [CrossRef]


| No. | Strata | Main Lithologies |
|---|---|---|
| 1 | Quaternary (Q) | Fluvial loess, Aeolian loess, Sandy clay |
| 2 | Tertiary (N&E) | Sandy conglomerates, Siltstone |
| 3 | Cretaceous (K) | Sandstone, Conglomerate, Mudstone clamp sandstone |
| 4 | Jurassic (J) | Silicarenite, Sandy shale, Coal seam |
| 5 | Triassic (T) | Sandy shale, Coaly shale, Mudstone |
| 6 | Permian (P) | Sandstone with shale, Quartzose sandstone, Granite |
| 7 | Carboniferous (C) | Silicarenite, Carbonaceous sandstone |
| 8 | Devonian (D) | Silty slate, Sedimentary limestone, Dolomitic marble |
| 9 | Silurian (S) | Siliceous limestone, Limestone, Phyllite |
| 10 | Ordovician (O) | Argillaceous limestone, Dolomitic limestone |
| 11 | Cambrian (Є) | Dolomitic limestone, Shale, Quartzite |
| 12 | Proterozoic (Pt) | Di-mica quartz schist, Graphite marble, Black mica gneiss |
| Site | Time (Year) | Magnitude (Ms) | Longitude (°) | Latitude (°) |
|---|---|---|---|---|
| Qishan | 780 B.C. | 7 | 107.8 | 34.5 |
| Lantian | 35 B.C. | 5.75 | 109 | 34.3 |
| Tianshui | 416 | 5 | 105.6 | 34.5 |
| Tianshui-Longxian | 600 | 6 | 106.5 | 34.5 |
| Tianshui | 734 | 7 | 105.6 | 34.6 |
| Qishan | 1307 | 5 | 107.6 | 34.5 |
| Xianyang | 1487 | 6.25 | 108.9 | 34.4 |
| Huixian-Tianshui | 1542 | 5 | 106 | 34.2 |
| Xi’an | 1568 | 6.75 | 109 | 34.4 |
| Zhuanglang | 1642 | 6 | 105.9 | 35.4 |
| Lingtai | 1634 | 5.5 | 107.6 | 35.1 |
| Longxian | 1704 | 6 | 107 | 34.9 |
| Guyuan | 1921 | 6.5 | 106.2 | 35.8 |
| Tianshui | 1936 | 6 | 105.7 | 34.2 |
| Name (Landslide) | Longitude | Latitude |
|---|---|---|
| Yan’s shady slope [39] | 107°13′00″ | 34°38′20″ |
| Lijiaxia [39] | 106°56′40″ | 34°57′48″ |
| Black gully gate [39] | 106°34′03″ | 34°58′26″ |
| Yangjia village [40] | 107°43′40″ | 34°18′55″ |
| Gaojia cliff [41] | 107°07′08″ | 34°23′12″ |
| Golden dome temple [41] | 107°07′29″ | 34°23′05″ |
| Bumpy mountain [41] | 107°08′17″ | 34°22′53″ |
| North slope village [42] | 107°17′05″ | 34°22′04″ |
| Liujia stream [43] | 107°05′51″ | 34°24′49″ |
| Zhu plateau [43] | 107°06′33″ | 34°25′01″ |
| Variable | Classification | Landslide Number | LND /(km2) | LAP |
|---|---|---|---|---|
| Elevation (m) | 400–500 | 9 | 0.02 | 0.3% |
| (404–3719) | 500–600 | 265 | 0.31 | 2.4% |
| 600–700 | 372 | 0.37 | 3.8% | |
| 700–800 | 298 | 0.36 | 2.8% | |
| 800–900 | 305 | 0.35 | 2.8% | |
| 900–1000 | 329 | 0.31 | 2.7% | |
| 1000–1100 | 336 | 0.27 | 2.7% | |
| 1100–1200 | 455 | 0.31 | 3.9% | |
| 1200–1300 | 408 | 0.25 | 3.3% | |
| 1300–1400 | 341 | 0.22 | 2.8% | |
| 1400–1500 | 142 | 0.12 | 1.1% | |
| 1500–1600 | 68 | 0.07 | 0.6% | |
| 1600–1700 | 37 | 0.04 | 0.4% | |
| 1700–1800 | 40 | 0.04 | 0.4% | |
| … | ||||
| Slope (°) | 0–10 | 483 | 0.11 | 2.2% |
| (0.8–62.1) | 10–20 | 1555 | 0.35 | 3.8% |
| 20–30 | 1047 | 0.21 | 1.4% | |
| 30–40 | 311 | 0.1 | 0.6% | |
| 40–50 | 36 | 0.05 | 0.2% | |
| 50–60 | 7 | 0.06 | 0.3% | |
| 60–70 | 1 | 0.06 | 0.3% | |
| Aspect | N | 231 | 0.22 | 1.9% |
| NNE | 196 | 0.18 | 1.6% | |
| NE | 174 | 0.16 | 1.7% | |
| ENE | 240 | 0.21 | 2.4% | |
| E | 190 | 0.16 | 1.7% | |
| ESE | 184 | 0.15 | 1.4% | |
| SE | 167 | 0.14 | 1.4% | |
| SSE | 146 | 0.14 | 1.4% | |
| S | 154 | 0.16 | 2% | |
| SW | 170 | 0.16 | 2.5% | |
| SW | 173 | 0.15 | 2.2% | |
| WSW | 232 | 0.19 | 2.6% | |
| W | 284 | 0.25 | 2.4% | |
| WNW | 321 | 0.29 | 2.7% | |
| NW | 308 | 0.29 | 2.6% | |
| NNW | 270 | 0.25 | 1.9% | |
| Position | Valley | 132 | 0.09 | 0.9% |
| Lower mid-slope | 969 | 0.19 | 1.6% | |
| Mid-slope | 1716 | 0.34 | 3.5% | |
| Upper mid-slope | 503 | 0.13 | 1.6% | |
| Ridge | 120 | 0.05 | 1% | |
| Land Cover | Water | 0 | 0 | 0 |
| Trees | 1153 | 0.1 | 1% | |
| Grass | 0 | 0 | 0 | |
| Flooded vegetation | 0 | 0 | 0 | |
| Crops | 1383 | 0.39 | 4.8% | |
| Scrub/Shrub | 795 | 0.38 | 4% | |
| Built area | 104 | 0.1 | 1% | |
| Bare ground | 5 | 0.33 | 2% | |
| Snow and ice | 0 | 0 | 0 | |
| Strata | Q | 1995 | 0.29 | 3.4% |
| N&E | 158 | 0.32 | 3.6% | |
| K | 589 | 0.42 | 3.7% | |
| J | 1 | 0.09 | 2.2% | |
| T | 12 | 0.03 | 0.6% | |
| P | 4 | 0.03 | 0.1% | |
| C | 20 | 0.06 | 0.9% | |
| D | 196 | 0.1 | 0.8% | |
| S | 0 | 0 | 0 | |
| O | 41 | 0.25 | 1.7% | |
| Є | 24 | 0.13 | 1.2% | |
| Pt | 12 | 0.09 | 0.7% | |
| Distance to stream (m) | 200 | 170 | 0.15 | 0.7% |
| 400 | 361 | 0.33 | 3.2% | |
| 600 | 238 | 0.23 | 3% | |
| 800 | 237 | 0.23 | 3.2% | |
| 1000 | 236 | 0.24 | 2.4% | |
| 1200 | 196 | 0.2 | 1.8% | |
| … | ||||
| Distance to fault (km) | 2 | 852 | 0.34 | 2.9% |
| 4 | 724 | 0.3 | 2.5% | |
| 6 | 355 | 0.17 | 1.7% | |
| 8 | 243 | 0.14 | 1% | |
| 10 | 200 | 0.14 | 1.2% | |
| 12 | 195 | 0.15 | 1.3% | |
| 14 | 154 | 0.13 | 1.6% | |
| 16 | 129 | 0.13 | 1.7% |
Publisher’s Note: MDPI stays neutral with regard to jurisdictional claims in published maps and institutional affiliations. |
© 2021 by the authors. Licensee MDPI, Basel, Switzerland. This article is an open access article distributed under the terms and conditions of the Creative Commons Attribution (CC BY) license (https://creativecommons.org/licenses/by/4.0/).
Share and Cite
Li, L.; Xu, C.; Xu, X.; Zhang, Z.; Cheng, J. Inventory and Distribution Characteristics of Large-Scale Landslides in Baoji City, Shaanxi Province, China. ISPRS Int. J. Geo-Inf. 2022, 11, 10. https://doi.org/10.3390/ijgi11010010
Li L, Xu C, Xu X, Zhang Z, Cheng J. Inventory and Distribution Characteristics of Large-Scale Landslides in Baoji City, Shaanxi Province, China. ISPRS International Journal of Geo-Information. 2022; 11(1):10. https://doi.org/10.3390/ijgi11010010
Chicago/Turabian StyleLi, Lei, Chong Xu, Xiwei Xu, Zhongjian Zhang, and Jia Cheng. 2022. "Inventory and Distribution Characteristics of Large-Scale Landslides in Baoji City, Shaanxi Province, China" ISPRS International Journal of Geo-Information 11, no. 1: 10. https://doi.org/10.3390/ijgi11010010
APA StyleLi, L., Xu, C., Xu, X., Zhang, Z., & Cheng, J. (2022). Inventory and Distribution Characteristics of Large-Scale Landslides in Baoji City, Shaanxi Province, China. ISPRS International Journal of Geo-Information, 11(1), 10. https://doi.org/10.3390/ijgi11010010