Abstract
Point of interest (POI) data can provide a clear spatial location and accurate attributes for geoscience research. The traditional assessment of Beautiful China construction (BCC) has relied on statistical materials, which have shortcomings in terms of timeliness, authenticity, efficiency, and accuracy. Referring to the theoretical framework of the Zhongke Beauty Index, we built an evaluation index system and technical process based on POI data. In terms of the Inner Mongolia Autonomous Region (IMAR), 5.09 million POIs were collected using the web crawler technique, and the Beautiful Inner Mongolia construction evaluation and analysis were performed. The results show the following: (1) POI data can be used to establish an evaluation index system for the construction of Beautiful Inner Mongolia on the county scale; in the dimensions of industrial development, social harmony, and institutional improvement, it shows especially good application prospects. (2) The Beautiful Inner Mongolia index in 2020 was 0.22. Among the five dimensions, the industrial development index was the highest, while the cultural heritage index was the lowest. We found significant spatial differences in the dimensions of cultural heritage as well as social harmony. (3) The areas in the IMAR with a low-level construction were mostly industrial and mining areas, agricultural counties, and other economically developing areas, among which the Baiyunebo mining area and Xianghuangqi and Shiguai areas had the lowest comprehensive beauty index values. (4) We also found large numerical disparities in the level of Beautiful Inner Mongolia construction between municipal districts and banners/counties, and the ranking of each region was affected by the population and coverage areas of administrative units. After verification, we found an overall good consistency between the evaluation indexes proposed in this paper and a previous study. Therefore, this paper provides a new perspective and an effective method for the application of Internet big data in economic and social evaluation work.
1. Introduction
In 2012, the report of the 18th National Congress of the Communist Party of China (CPC) introduced the concept of “Beautiful China” and emphasized the important role of the construction of the ecological civilization, forming a theoretical prototype of “Beautiful China construction” (BCC) [1,2]. In 2016, the National Development and Reform Commission jointly formulated the Green Development Index system and the Ecological Civilization Construction Assessment Target system as the basis for the evaluation and assessment of the construction of the ecological civilization [3]. In 2017, the 19th CPC National Congress again included Beautiful China in the report, further clarifying the concept of green development, requiring the promotion of ecological civilization construction and speeding up the reform of the ecological civilization system [4]. In February 2020, the National Development and Reform Commission issued the evaluation index system and implementation plan for Beautiful China construction. It introduced an evaluation scheme including five dimensions and 22 specific indicators, involving fresh air, clean water, soil safety, good ecology, and clean human settlements [5]. In June 2020, Ge et al. conducted an in-depth analysis of the relationship between Beautiful China construction and the 2030 Sustainable Development Goals (SDGs) issued by the United Nations and found that Beautiful China construction is an effective method of achieving the 2030 Agenda SDGs [6].
Starting from 2013, some evaluation index systems were constructed to examine the effects of the implementation of the Beautiful City proposed in 2013 [7]; Beautiful Village in 2014 [8]; Beautiful Region in 2014 [9] and in 2015 [10]; and Beautiful China in 2014 [11], 2016 [12], 2017 [13] and 2019 [2]. The basis of the above evaluation index systems is the theory named “Five-in-One”, which reflects the processes of construction from the ecology, economy, society, culture, and political system perspectives [2,7]. The specific types and quantity of indexes for each dimension were comprehensively decided by data, methods, and research areas. Among these established index systems, the Zhongke Beauty Index, proposed by Fang of the Institute of Geographical Sciences and Natural Resources Research, Chinese Academy of Sciences (CAS), and its evaluation model were regarded to be more complete, comprehensive and representative, and have already been applied to analyzing the construction effectiveness in 2016 of all 341 cities in China [2]. However, the current index systems proposed by various academic circles and official institutions were mostly established based on traditional data from official statistical channels, which had limitations such as poorly reflecting the current situation, weak spatial relevance, and lack of authenticity and intuitiveness [14,15]. Therefore, the quality of the data sources is an urgent problem that must be solved for the evaluation of the construction of Beautiful China and Beautiful Regions.
In recent years, researchers have applied POI data in index calculation and index system construction for mixed-use neighborhoods, poverty assessment, residential livability, urban built-up area extraction, and nighttime light (NTL) urban indexes. In research on neighborhood vibrancy, POIs from a navigation database were used to develop a series of mixed-use indicators that can more accurately reflect the multifaceted, multidimensional characteristics of mixed-use neighborhoods [16]. In research on identifying and evaluating poverty, POIs were used to develop the comprehensive poverty index (CPI), and the computed POI cost distance played a vital role in assessing poverty [17]. In the study of residential livability based on POI data, the attribute information of the medical, educational, traffic, economic, and ecological environments was extracted from POIs [18]. In research on urban built-up area extraction, POI data, together with land surface temperature (LST) data, were used to develop an adjusted NTL urban index (PLANUI) [19]. POI data were used to calculate a life convenience index and establish the corresponding evaluation system [20]. Therefore, POI data provide the advantage of high coverage of public service facilities and have been efficiently used for index calculation [19] as well as index system construction [20]. These data have not only provided reference value for abundant and complex service facilities [16], but also help explain public life and economic conditions [17,18]. Additionally, POI data have been used to conduct studies on POI recommendations [21,22], POI matching [23], urban functional area identification [24,25,26], population mapping [27,28,29], virtual pedestrians generating [30], and land-use mapping [31,32,33,34]. Therefore, POI data, which provide accurate spatial information, cover most types of facilities, directly reflect social attributes, are easy to download for free, and can meet the needs of index system construction.
Although the applications of POI data in the study of the above-mentioned indicator systems prove that POI data are superior in the construction of index systems, these index calculations or index systems are inadequate in terms of completeness, comprehensiveness and geographic coverage. POI data have not been applied to the evaluation of the construction of Beautiful China and Beautiful Regions. Whether POI data can be applied to reflect the BCC level and which POI types can be considered to build the evaluation index system were not known. To compensate for these research gaps, we applied the Zhongke Beauty Index model based on POI data to build an index system that is comprehensive, standardized, specific, and quick to apply for the construction of Beautiful Inner Mongolia. The Zhongke Beauty Index contains 31 specific indicators in five dimensions, with a complete and nationwide evaluation technology process, providing reference maps from the end of 2016; we used it to provide values and trends for comparison and credibility analysis of the indicator systems for the mid-2020s constructed in this study. The Inner Mongolia Autonomous Region (IMAR) in Northern China, located between 37° and 54° N [35], was selected as our study object. The IMAR, extending from the west to northeast of China, can roughly reflect the differences between the east and the west in North China. Currently, the IMAR has five types of administrative units (i.e., municipal districts, banners, counties, county-level cities, and autonomous banners); therefore, it is representative of the various administrative unit types. Because the IMAR is also rich in ecological landscapes, covering a variety of landforms such as deserts, grasslands, plains, hills, etc., it is representative of the ecological environment [35,36]. In addition, the IMAR covers 1.18 million km² with a population of 25.39 million (2019) [35,37]; it is vast and sparsely populated [36,37], having significant spatial differences in terms of the distribution of population and land cover. In this study, we evaluated Beautiful Inner Mongolia Construction based on POI data and built an index system that can be compared with the previous methods, which helps to understand the construction shortcomings of various banners (counties and districts) in Inner Mongolia and to explore the factors influencing the evaluation of Beautiful Inner Mongolia construction.
The remainder of this paper is structured as follows: Section 2 includes three parts, explaining how to download POI data from Amap through Web Crawler, presenting the main contents of the BCC Evaluation Indicator System based on POIs and introducing the method for computing each index with reference to the Zhongke Beauty Index. In Section 3, maps and charts are used to visualize evaluation results and identify the construction shortcomings of developing areas from five perspectives. Section 4 first discusses the differences between counties and cities, then discusses the differences between the absolute and relative quantity of POIs, and finally discusses the advantages and uncertainties of the evaluation process based on POI data. Section 5 provides the study conclusions.
2. Materials and Methods
Our methods can be divided into three parts: basic data, index system, and evaluation method. The basic data section (Section 2.1) introduces how to download POIs through API, and other applied materials, such as yearbooks and boundary data. To explain the similar and different input parameters between the Zhongke Beauty Index and the Beautiful Inner Mongolia Index, Section 2.2 first introduces the main parameters in Fang et al.’s research. Then, some shortcomings of the public data used by previous studies are described, and finally, we elaborate upon the benchmarks and reasons for choosing indicators for each dimension of the Beautiful Inner Mongolia Index system (Table 1). In the evaluation method part (Section 2.3), the range method, analytic hierarchy process, and Zhongke Beauty Index are introduced.

Table 1.
Evaluation index system of Beautiful China construction.
2.1. Basic Data
Amap (amap.com, accessed on 24 April 2021), Baidu Map (map.baidu.com, accessed on 24 April 2021), and Tencent Map (map.qq.com, accessed on 24 April 2021) are three mainstream Internet map providers in China. Among them, Amap is the only one qualified for civil surveying and mapping. Therefore, compared to other Internet POI providers, POIs provided by Amap are more authoritative and current. Using Python 3.7 and the NumPy extension package (https://numpy.org/, accessed on 25 December 2019), calling the polygon search function based on API (https://lbs.amap.com/, accessed on 1 May 2020), provided by the Amap open platform, we accurately retrieved and downloaded all POIs of Inner Mongolia. The process for POIs acquisition included four steps: obtaining the grid generated by the longitude and latitude range of the study area, reading HTML documents from the pages, iteratively processing grids with more than 900 POIs, and storing POIs information as CSV and SHP files. As a result, a total of 5,093,398 POIs were downloaded, and the deadline for the data acquisition was May 2020. Therefore, the research results roughly reflect the situation of the IMAR in mid-2020. Of each POI, 13 fields were recorded: longitude and latitude (“longitude”, “latitude”), POI name (“name”), address (“address”), province (“pname”), city (“cityname”), district and county (“adname”), type (“type”), type code (“typecode”), ID (“ID”), first class name (“type1”), second class name (“type2”), and third class name (“type3”).
According to the basic administrative division data provided by the National Geographic Information Resources Catalog Service System of the National Basic Geographic Information Center [38], combined with the administrative adjustment information provided by the official website of the Ministry of Civil Affairs [39], the latest administrative division boundary of the IMAR was updated and generated. The results showed that as of December 2019, it had jurisdiction over 9 cities and 3 leagues, totaling 12 prefecture-level city units, 23 municipal districts, 11 county-level cities, 17 counties, 49 banners, and 3 autonomous banners, totaling 103 county-level units. The total household registration population data of various banners (counties and districts) provided by the Inner Mongolia Statistical Yearbook 2019 [37] was also used.
2.2. Index System
Our analysis was based on the technical evaluation scheme of the Zhongke Beauty Index proposed by Fang et al. [2]. In their major study, five indexes of the ecological environment, green development, social harmony, institutional improvement, and cultural heritage were calculated. Specifically, the ecological environment dimension was evaluated using the data on ecological function zones, the proportion of ecological land, sewage treatment rate, garbage disposal rate, annual average PM2.5 concentration, and good air quality. The green development dimension was evaluated using the data on per capita GDP, energy consumption per GDP, water consumption per unit GDP, the proportion of secondary industry, the proportion of tertiary industry, and per capita fiscal revenue. The cultural heritage dimension was evaluated using the data on the number of national intangible heritage sites, national cultural relics, world cultural heritage, the quantity of students in school out of 10,000, and the quantity of books owned by 10,000 people. The institutional improvement dimension was evaluated using the data of the frequency of disaster events, urban crime rate, frequency of harmful events, frequency of corruption, government credit status, and government information disclosure. The social harmony dimension was evaluated using the data of urbanization rate, urban–rural income gap, road network density, share of education expenditure, share of science and technology expenditure, share of health personnel, and Internet penetration rate.
Many of these public data have the following common shortcomings [14,15]: (1) low accuracy: Although statistical data are highly authoritative, local governments often interfere with them, affecting their authenticity; (2) poor current situation: Statistical data such as yearbooks and annual reports have a time lag of 1 to 2 years from production to publication; (3) the indicators are not intuitive and specific: statistical indicators are a digital abstraction of the real world, and it is difficult for the public to form a sense of experience, reality, and acquisition based on statistical data; (4) spatial processing of text and table data was required. The spatialization required the support of GIS technology, which inevitably causes data loss and misuse during manual processing and is time-consuming.
POI data can be easily transformed to shape data (a data format that can be used in ArcMap software), providing accurate geographic information and abundant feature information. On the Amap platform, the original POIs were divided into 22 first categories, 264 second categories, and 869 third categories. Compared with Fang et al.’s research, our evaluation system also considers the five dimensions (ecological environment, industrial development (corresponding to green development), social harmony, institutional improvement, and cultural heritage) and uses the Zhongke Beauty Index as the calculating standard. Here, instead of industrial development, green development is considered mainly because POIs only reflect the characteristics of land surface objects and do not include the atmospheric environment. The main difference between these two evaluation systems is the specific types of evaluation indicators: In this method, POIs among 869 types are selected. Therefore, the overall goal of BCC evaluation is the first-level index, and the Beautiful China evaluation index system was constructed with the above five dimensions (second-level index) and 25 basic data items (POI types, third-level index). In the IMAR, based on the above evaluation index system scheme, 179,483 POIs from all 5,093,398 POIs in Table 1 were extracted and applied to evaluation process modeling. The final evaluation index system for the BCC is shown in Table 1.
In this index system, following the principles of green living and eco-friendliness, 25 POI types of ecological environment dimensions (park squares, scenic spots, natural landscapes, leisure places and resorts) were selected. The industrial development index aims to reveal the construction level of primary production (i.e., agriculture, forestry, animal husbandry and fishery), secondary production (i.e., high-end manufacturing, electronics and telecommunications), and tertiary industry (i.e., scientific research institutions and transportation). The social harmony index mainly describes medical care, shopping, food, clothing, travel, etc. Institutional improvement concerns public social safety (police stations and public security bureau), equal services (central agencies and governments at all levels), social relief (welfare institutions), legal protection (tax authorities and courts), personal safety (insurance companies), etc. The cultural heritage index characterizes education, training, cultural media, and cultural inheritance, which were evaluated using the POIs of public cultural spaces, religious culture, literary and artistic landscapes, schools, and media institutions, among which public cultural spaces are represented by museums, libraries, and cultural palaces.
2.3. Evaluation Method
To determine BCC’s progress, it was necessary to use a bottom-up technical route of gradual integration. First, we clarified the application method of the basic data items, and then performed, merged and synthesized the third-level indicators into the second-level indicators, and then into the first-level indicators. In this study, the total number of POIs of each administrative unit, per capita quantity (POIs/10,000 people), and average land quantity (POIs/km²) were used as the third-level indicator values. The second- and first-level indicators were evaluated using the third-level indicators step-by-step using the analytic hierarchy process (AHP) method. Before AHP analysis, the range method was used to standardize the third-level indicators and normalize the values to between 0 and 1, to eliminate the large differences in the absolute quantity of POIs among various categories in different regions. The formula of the range method is expressed as:
where is the third-level index after normalization; is the quantity of a POI type in the th administrative region; and and are the highest and lowest POI quantities for that type, respectively.
AHP is a multi-criteria decision-making method first introduced by Saaty, an American operations researcher [40]. Yaahp software (http://www.metadecsn.com/, accessed on 15 June 2020) can help users quickly build hierarchical models, calculate judgment matrices, and then obtain weight results [41,42]. According to the overall Five-in-One BCC requirements, equal weight was assigned to the five secondary indicators (that is, the weight coefficients of the five secondary indicators were all 0.2). On this basis, the AHP method was further applied to decompose the weight of the second-level indicators to the third-level indicators with the support of Yaahp 10.1 software. As such, the weight list of secondary and tertiary indicators of Beautiful Inner Mongolia was obtained, as shown in Table 2. Finally, the resulting maps of each dimension were visualized using ArcMap 10.6 and the relevant charts were drawn using Origin 2018.
Table 2.
Weight list of the Beautiful Inner Mongolia construction evaluation index system.
According to the above-mentioned range method and index weight design, the formulas of the comprehensive Beautiful Inner Mongolia index and each dimension of the Zhongke Beauty Index [2] are shown in Equations (2) and (3).
where is the comprehensive index; is the third-level index value; is the third-level serial number (1, 2, …, 25); is the weight coefficient of the third-level index (Table 2); represents the evaluation index of each dimension; and represents the dimension, namely, ecological environment, industrial development, social harmony, institutional improvement, or cultural heritage. The value range of and is [0,1]; the higher the index value, the higher the degree of beauty.
3. Results
The evaluation results for the five dimensions (ecological environment, industrial development, social harmony, institutional improvement, and cultural heritage) are presented in this section. In addition to the index value of each dimension, the absolute quantity of POIs and some statistics are used to explain the construction process. The POI types that have shortcomings in each dimension are identified in the corresponding subsections in Section 3. Finally, a comprehensive evaluation of Beautiful Inner Mongolia is provided.
3.1. Ecological Environment
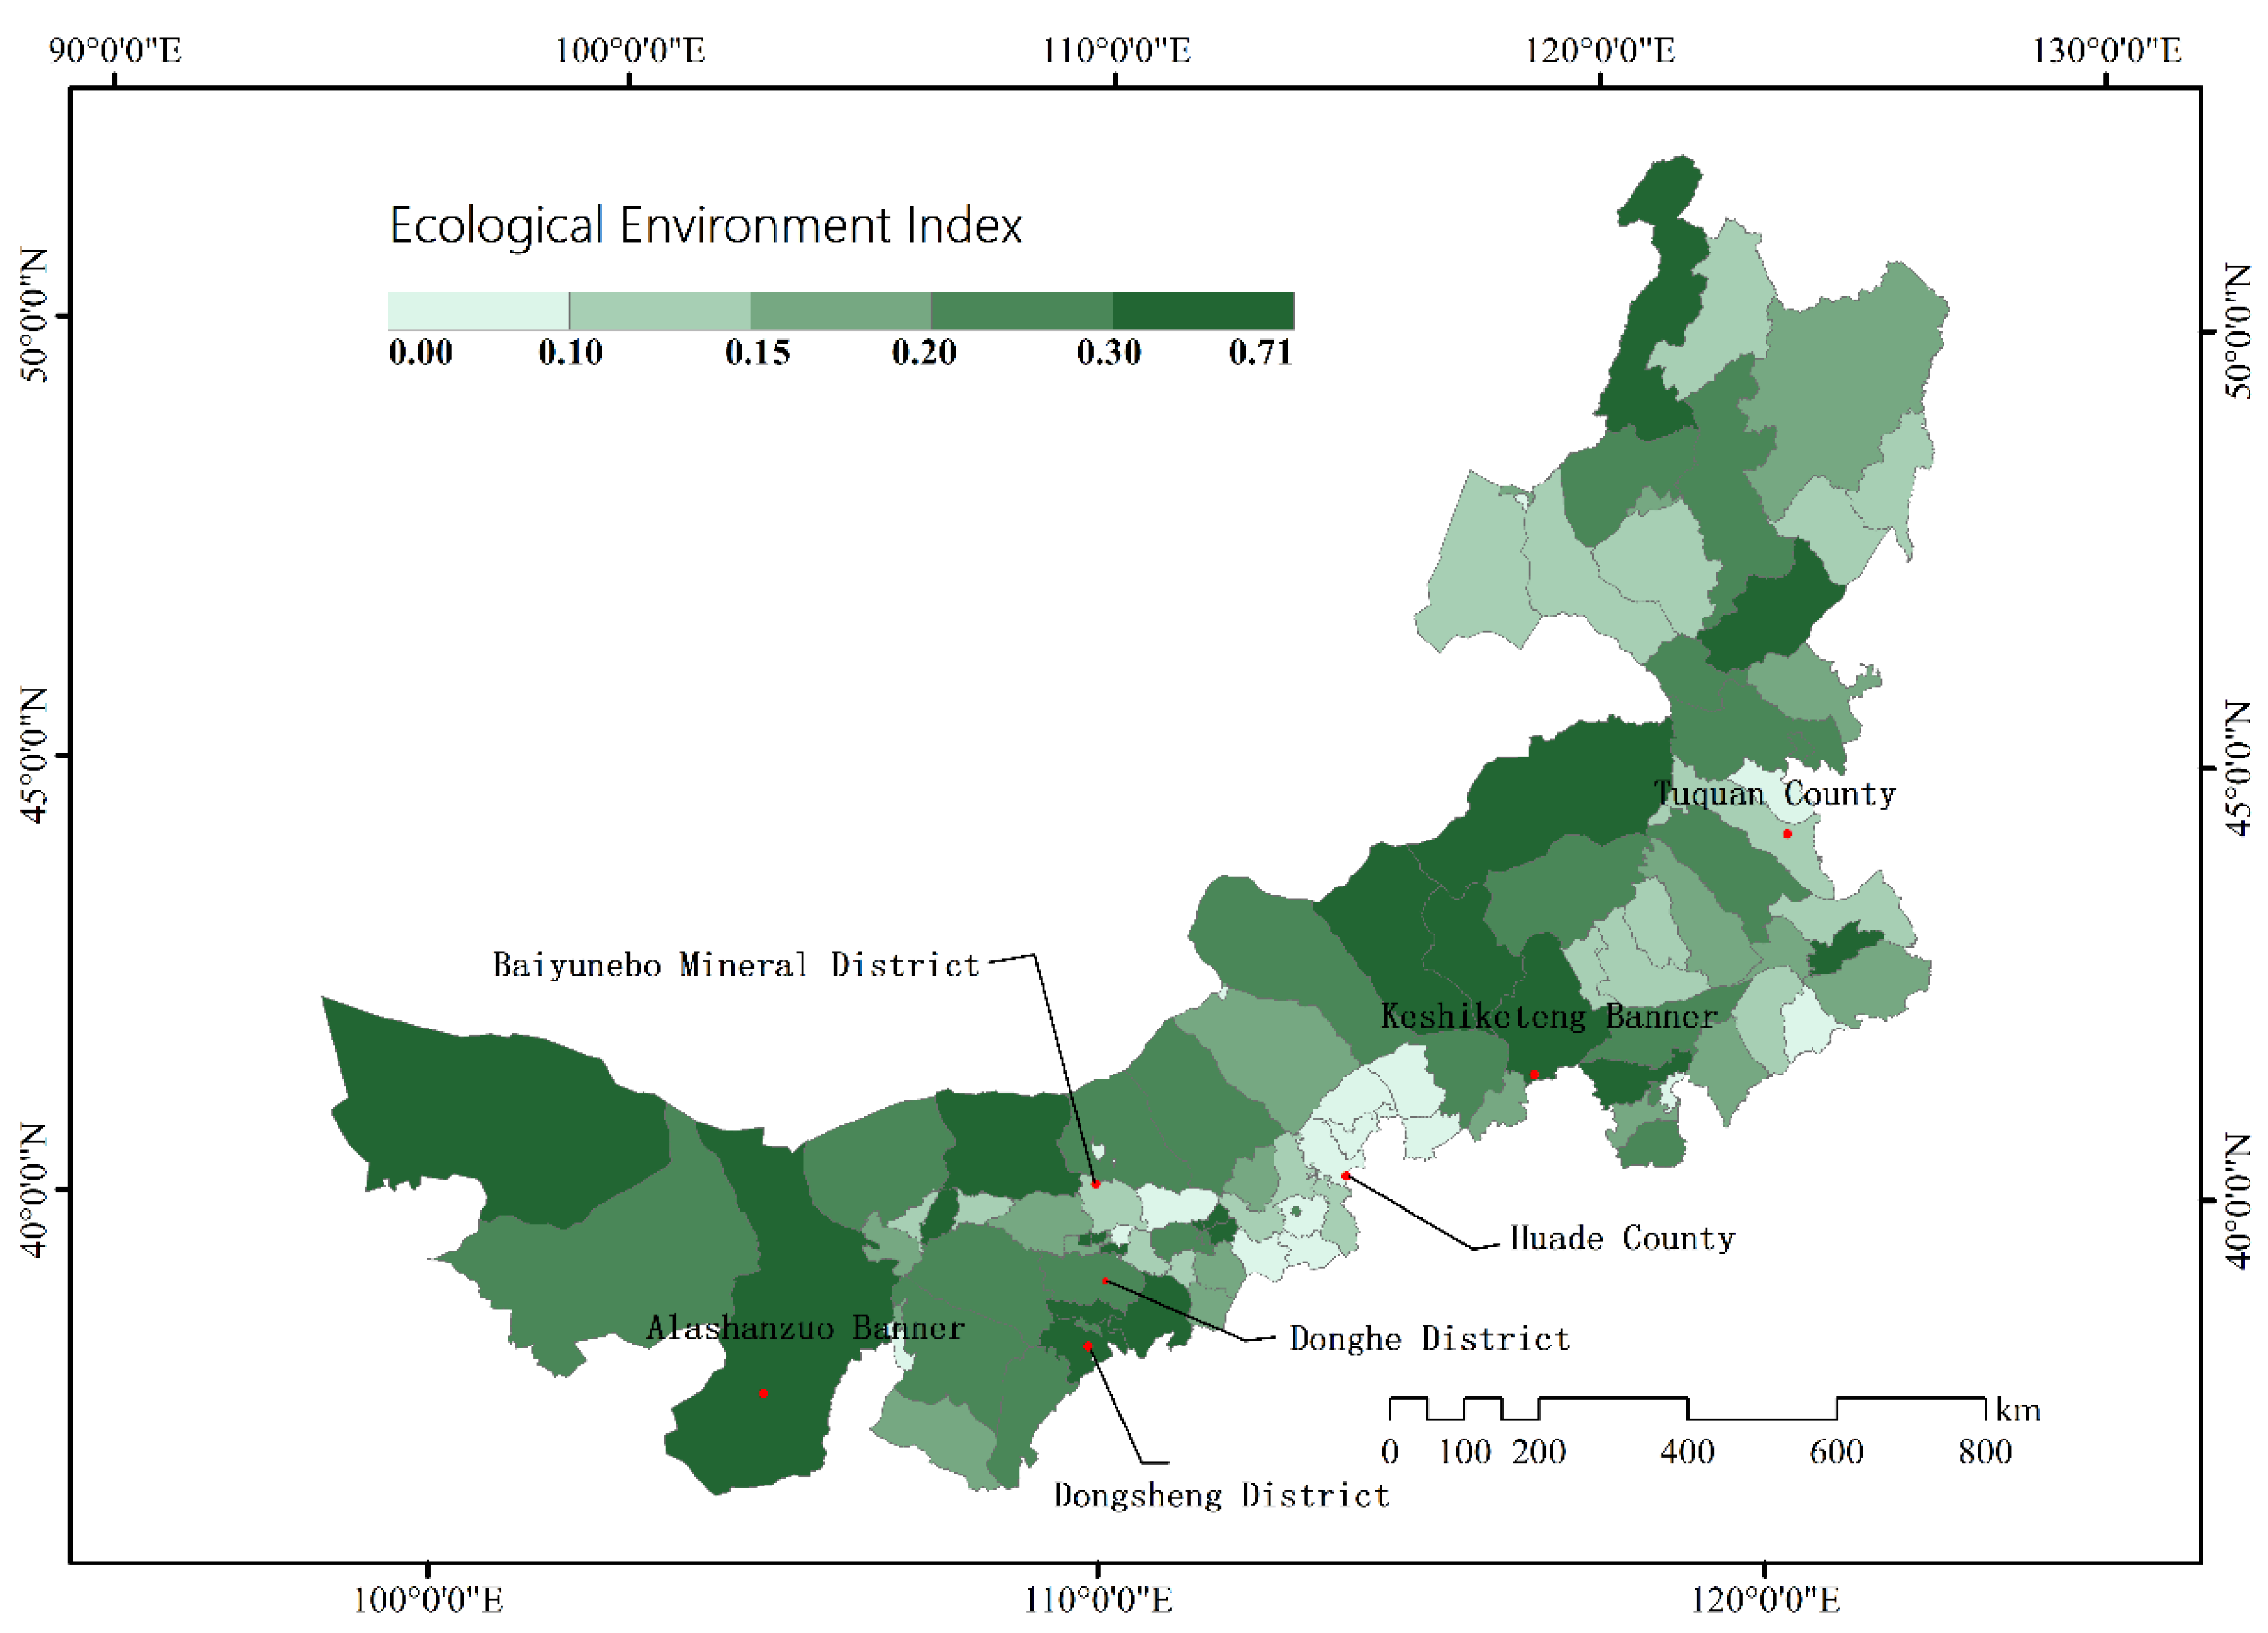
A total of 37,963 POIs were related to the ecological environment in the IMAR. Among them, 836 were park squares, 1276 were scenic spots, 33,659 were natural landscapes, 1502 were leisure places, and 690 were vacation and recuperation places. On average, there were 368 ecological environment-related POIs in each banner (county and district). The maximum ecological environment index value in the whole region was 0.71, the mean was 0.21, and the standard deviation (SD) was 0.13. The coefficient of variation (CV) is a dimensionless quantity for comparing the degree of variation from one data series to another, even if the means are drastically different from one another. The larger the CV, the larger the degree of variation (deviation). Here, the CV of the ecological environment was 62% (CV = (SD/Mean) × 100%). A total of 21 banners (counties and districts) in the region had an ecological environment index value higher than 0.3. Among them, Alashanzuo Banner in Alashan League, Keshiketeng Banner in Chifeng City, Qingshan District in Baotou City, Dongsheng District in Erdos City, and Donghe District in Baotou City had the highest ecological environment index values, all above 0.5. Baiyunebo Mineral District in Baotou City, Huade County in Wulanchabu City, and Tuquan County in Xingan League had the lowest ecological environment index values, all lower than 0.05 (see the red dots in Figure 1). The reasons for these findings are as follows: As a traditional industrial and mining area, the number of natural landscapes, scenic spots, park squares, and vacation and recuperation places in the Baiyunebo Mineral District was low. As a traditional agricultural county with an underdeveloped economy, Huade County lacked natural landscapes, holiday resorts, and park squares. Tuquan County lacks scenic spots, park squares, and leisure places.

Figure 1.
Spatial distribution of the ecological environment index in Inner Mongolia in 2020.
3.2. Industrial Development
A total of 63,007 POIs were related to industrial development and infrastructure support. Among them, 1891 were AFAF bases, 1417 were factories, 25,190 were companies, 734 were industrial parks, and 33,775 were basic road facilities. On average, each banner (county or district) had 611 POIs related to industrial development and infrastructure support. The maximum industrial development index value was 0.77, the mean was 0.28, the SD was 0.17, and the CV was 61%. The industrial development index value of 20 banners (counties and districts) was higher than 0.4. Among them, Keerqin District in Tongliao City, Saihan District in Hohhot City, Alashanzuo Banner in Alashan League, Tumotezuo Banner in Hohhot City, Linhe District in Bayannaoer City, Dongsheng District in Erdos City, Hongshan District in Chifeng City, Yijinhuoluo Banner in Erdos City, Yakeshi City in Hulunbeier City, Dalate Banner in Erdos City, and Xilinhaote City in Xilinguole League had the highest industrial development index values, all above 0.5. The index values of four banners (counties and districts) of Baiyunebo Mineral District of Baotou City, Xianghuang Banner of Xilinguole League, Sunitezuo Banner of Xilinguole League, and Shiguai District of Baotou City were the lowest, all below 0.05 (see the red dots in Figure 2). The reasons for these findings are as follows: As an industrial and mining area with a single industry, the number of basic road facilities, factories, companies, and AFAF bases in Baiyunebo Mineral District is low, and the number of companies and AFAF bases in Shiguai district is relatively low. As a relatively underdeveloped county with animal husbandry as the main industry, the number of basic road facilities and companies in Xianghuang Banner was low, and the number of companies and AFAF bases in Sunitezuo Banner was low.
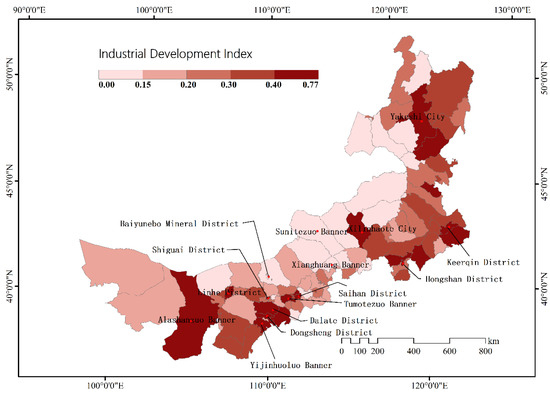
Figure 2.
Spatial distribution of the industrial development index in Inner Mongolia in 2020.
3.3. Social Harmony
A total of 49,602 POIs were related to social development and living convenience. Among them, 10,761 were public facilities, 16,814 were healthcare services, 4882 were shopping malls and supermarkets, 8321 were convenience stores, and 8824 were transportation hub facilities. On average, each banner (county or district) had 481 POIs related to social development and living convenience. The maximum social harmony index of the whole region was 0.85, the mean was 0.19, the SD was 0.17, and the CV was 89%. The social harmony index values of 21 banners (counties and districts) in the region were higher than 0.25. Among them, Huimin District in Hohhot City, Jining District in Wulanchabu City, Keerqin District in Tongliao City, Yuquan District in Hohhot City, and Dongsheng District in Erdos City had the highest social harmony index values, all above 0.5. Shiguai District in Baotou City, Wuda District in Wuhai City, Xianghuang Banner in Xilinguole League, Chahaeryouyihou Banner in Wulanchabu City, Chenbaerhu Banner in Hulunbeier City, Baiyunebo Mineral District in Baotou City, Hainan District in Wuhai City, Xinghe County in Wulanchabu City, Siziwang Banner in Wulanchabu City, and Qingshuihe County in Hohhot City 10 banners (counties, districts) had the lowest values, all less than 0.05 (see the red dots in Figure 3). The reasons for these findings are as follows: Shiguai District and Wuda District lacked convenience stores, healthcare services, large shopping malls, and supermarkets. Xianghuang Banner lacked transportation hub facilities, public facilities, and healthcare service points; Chahaeryouyihou Banner and Chenbaerhu Banner lacked transportation hub stations, large shopping malls, and supermarkets. Baiyunebo Mineral District lacked transportation hub facilities, public facilities, and healthcare service points. Hainan District mainly lacked large shopping malls and supermarkets. Xinghe County, Siziwang Banner, and Qingshuihe County mainly lacked transportation hub facilities.
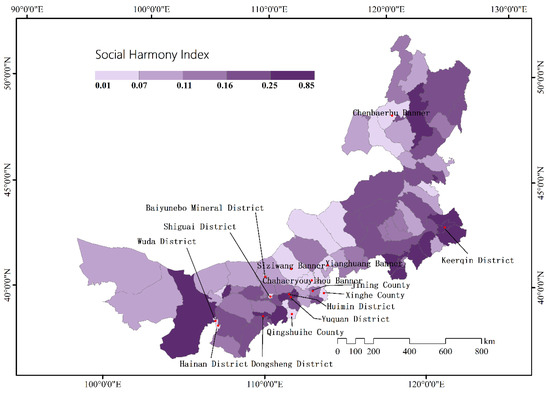
Figure 3.
Spatial distribution of the social harmony index in Inner Mongolia in 2020.
3.4. Institutional Improvement
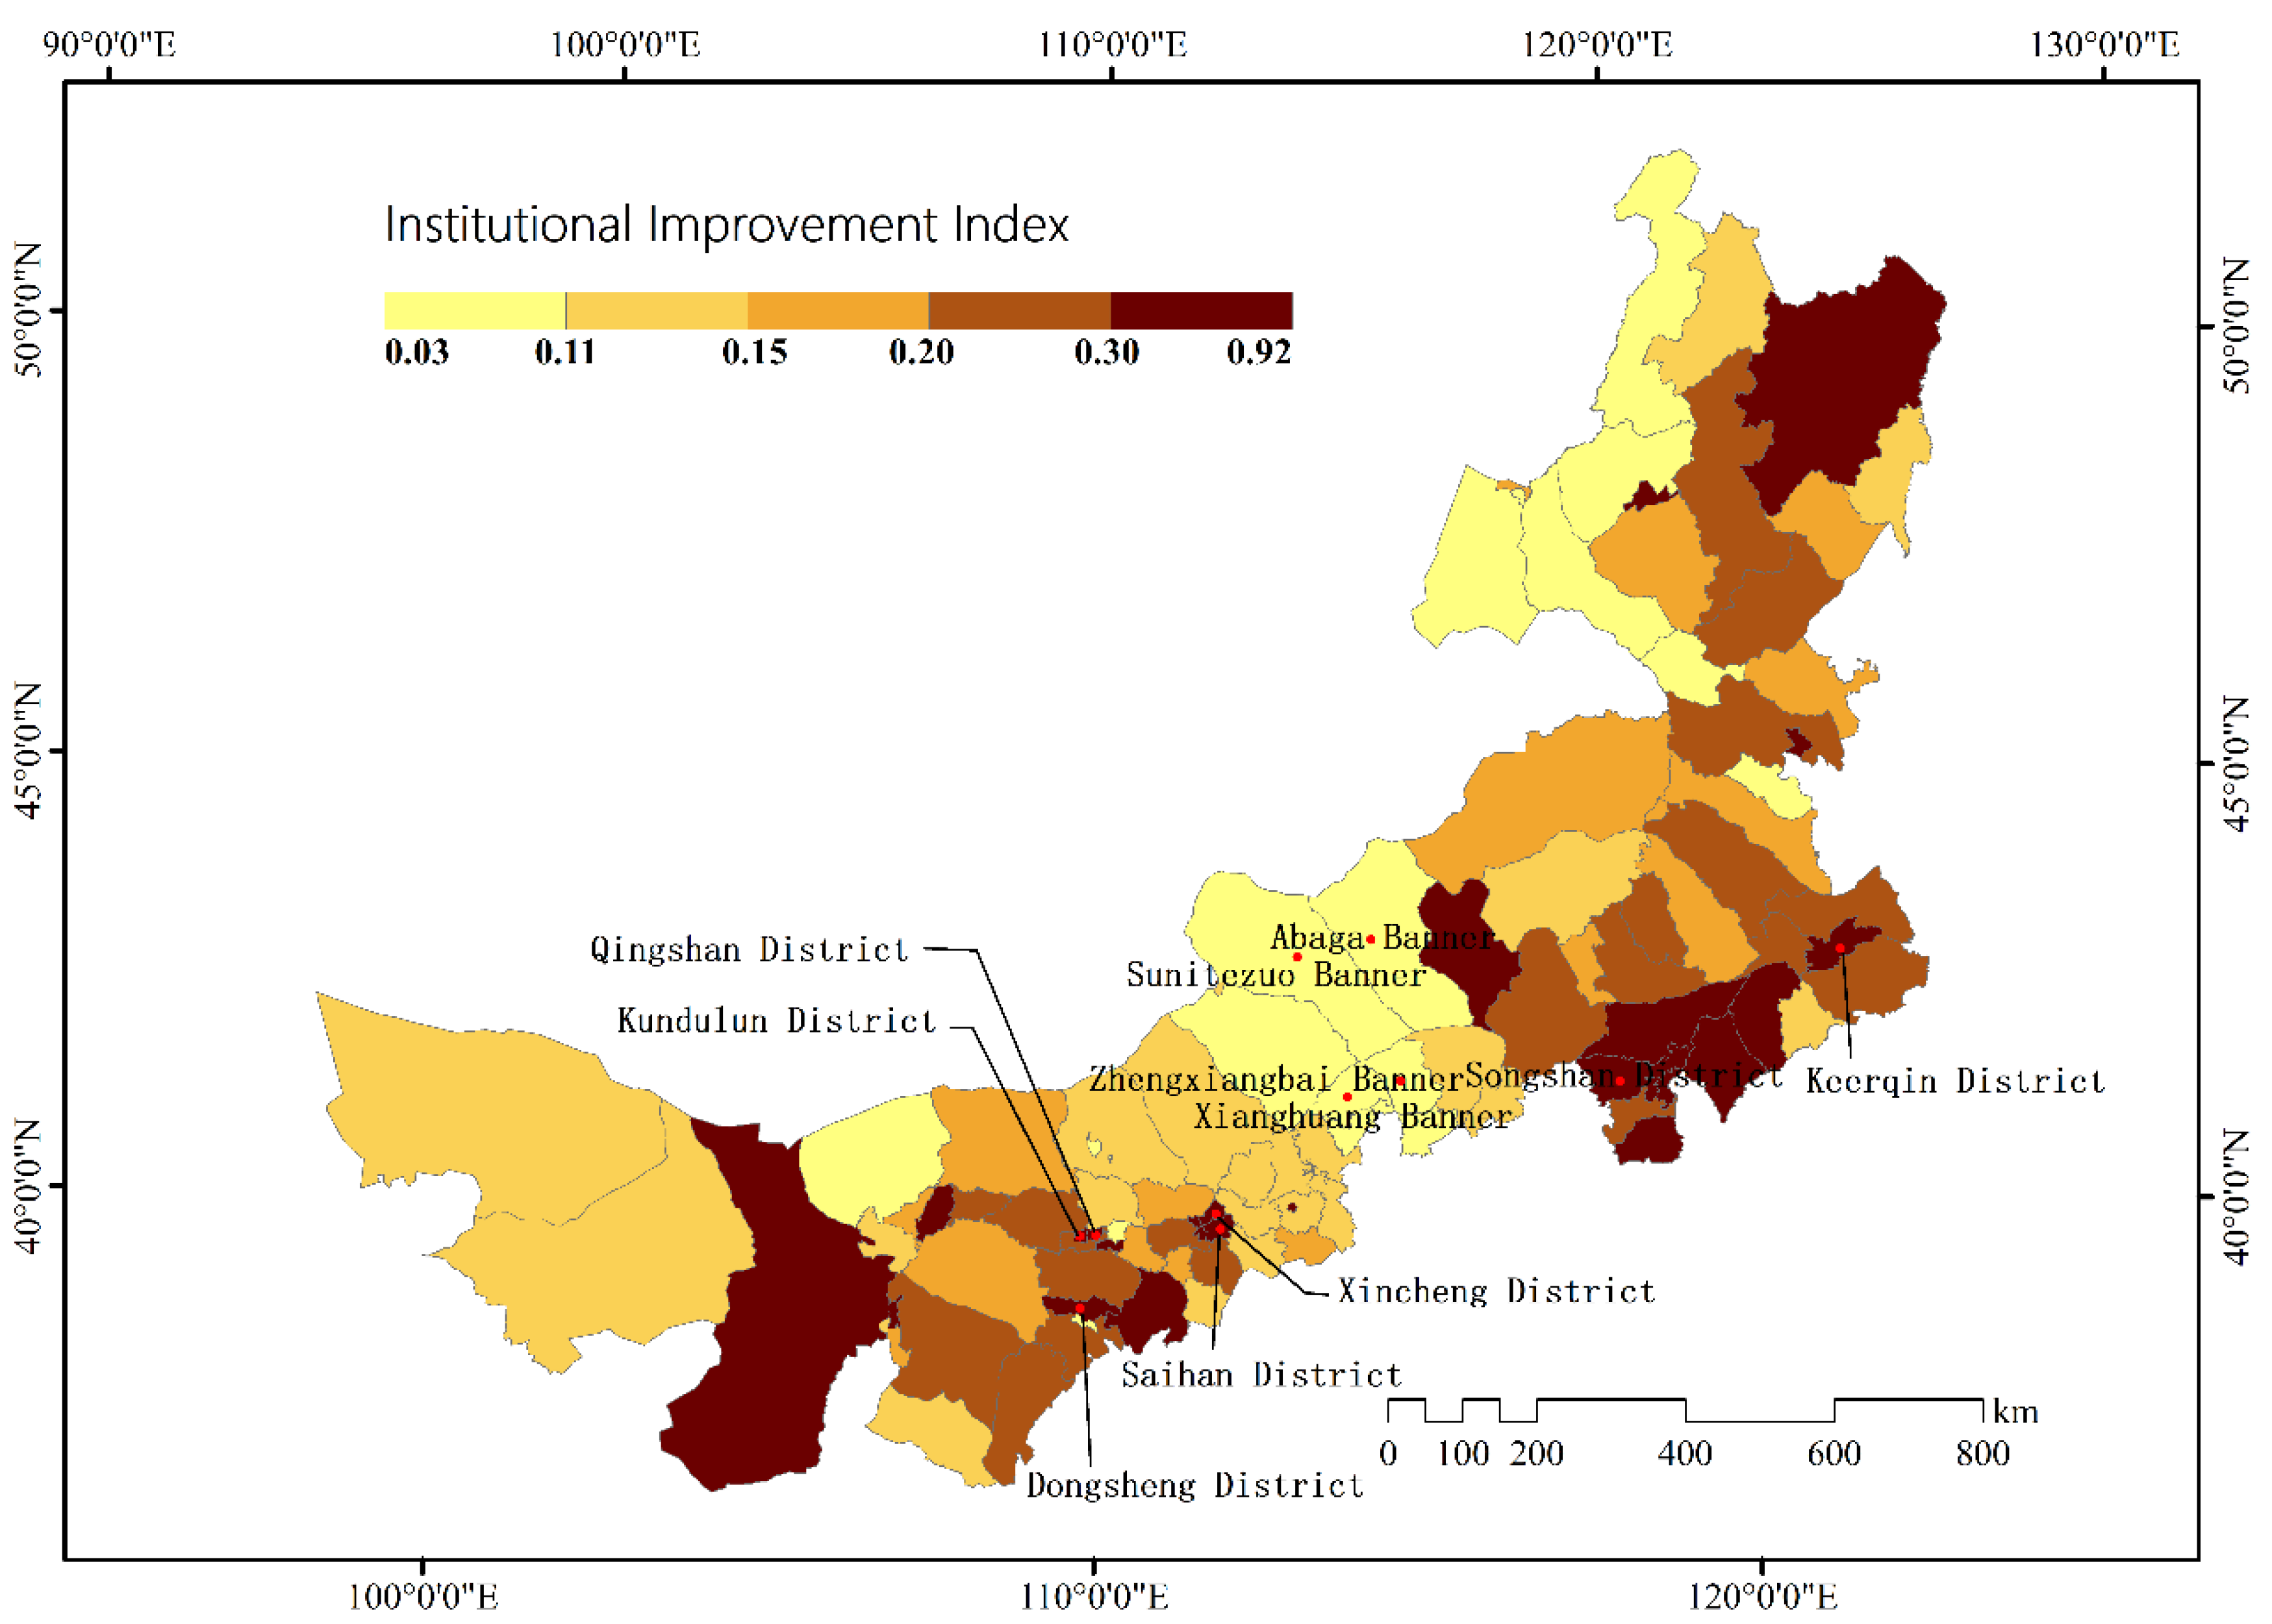
A total of 23,106 POIs were related to government governance and economic society development security. Among them, 906 were industrial and commercial tax administration; 3034 were public security bureaus, procuratorates and court bodies; 11,263 were government bodies; 6456 were financial and insurance service institutions; and 1447 were related social organizations. On average, each banner (county or district) had 224 POIs related to government governance and economic and social development security. The highest institutional improvement index value of the whole region was 0.92, the mean was 0.23, the SD was 0.16, and the CV was 70%. The institutional improvement index values of 25 banners (counties and districts) in the region were higher than 0.3. Among them, the institutional improvement indexes of seven banners (counties and districts) in Keerqin District in Tongliao City, Saihan District in Hohhot City, Dongsheng District in Erdos City, Qingshan District in Hohhot City, Songshan District in Chifeng City, Kundulun District in Baotou City, and Xincheng District in Hohhot City were all above 0.5. The institutional improvement index values of Zhengxiangbai Banner, Abaga Banner, Sunitezuo Banner, and Xianghuang Banner (county and district) were all lower than 0.05 (see the red dots in Figure 4). The reasons for these findings are as follows: There was a relative shortage of social organizations, public security bureaus, procuratorates, court agencies, industrial-commercial tax administration, and financial-insurance service institutions in Zhengxiangbai Banner of Xilinguole League; relatively few social organizations, public security bureaus, procuratorates, court institutions, and financial-insurance service institutions in Sunitezuo Banner of Xilinguole League; and a lack of relevant social groups and financial-insurance service institutions in Abaga Banner of Xilinguole League. The financial insurance service institutions in Xianghuang Banner of Xilinguole League were relatively scarce.
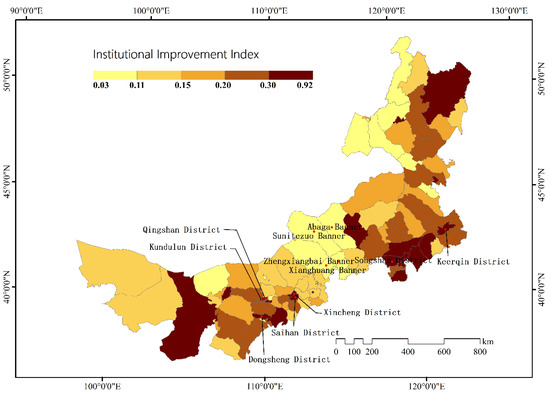
Figure 4.
Spatial distribution of the institutional improvement index in Inner Mongolia in 2020.
3.5. Cultural Heritage
A total of 5805 POIs were related to educational development and cultural heritage. Among them, 617 were public cultural spaces, 964 were literary and artistic landscapes, 2767 were schools, 951 were media institutions, and 506 were religious and cultural landscapes. On average, each banner (county or district) had 56 POIs related to educational development and cultural heritage. The highest cultural heritage index value in the whole region was 0.90, the mean was 0.18, the SD was 0.17, and the CV was 94%. The cultural heritage index values of 21 banners (counties and districts) in the region were above 0.25. Among them, Saihan District in Hohhot City, Dongsheng District Erdos City, Xincheng District in Hohhot City, Huimin District in Hohhot City, Linhe District in Bayannaoer City, Kundulun District Baotou City, Qingshan District in Baotou City, and Yuquan District in Baotou City had the highest cultural heritage index values (all higher than 0.5). Shiguai District in Baotou City, Xianghuang Banner in Xilinguole League, Wulateqian Banner in Bayannaoer City, Baiyunebo Mining Area in Baotou City, Alukeerqin Banner in Chifeng City, Keerqinyouyizhong Banner in Xingan League, Xinghe County in Wulanchabu City, Genhe City in Hulunbeier City, and Xinbaerhuzuo Banner in Hulunbeier City had the lowest cultural heritage index values (all lower than 0.05) (see the red dots in Figure 5). The reasons for these findings are as follows: There were shortages of media institutions, public cultural spaces, literature, and artistic landscapes in Shiguai District; media institutions, public cultural spaces, and religious cultural landscapes in Xianghuang Banner; media institutions and public cultural spaces in Wulatehou Banner; media institutions in Baiyunebo Mineral District; and public cultural spaces in Alukeerqin Banner. Public cultural spaces, literature, and artistic landscapes in Keerqinyouyizhong Banner were lacking. Public cultural spaces and religious cultural landscapes in Xinghe County were scarce; and the schools, literature, and artistic landscapes in Genhe City and Xinbaerhuzuo Banner were scarce.
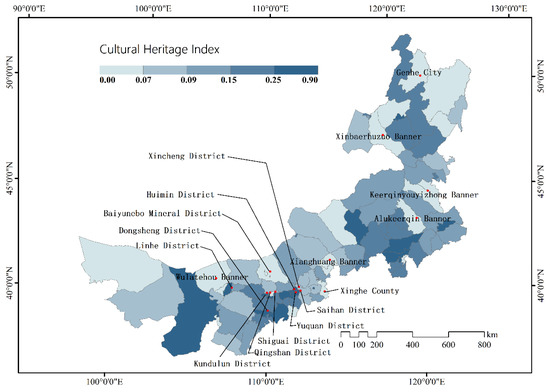
Figure 5.
Spatial distribution of the cultural heritage index in Inner Mongolia in 2020.
3.6. Comprehensive Evaluation of Beautiful Inner Mongolia
We comprehensively analyzed the five dimensions of ecological environment, industrial development, social harmony, institutional improvement, and cultural heritage to obtain the beauty index of comprehensive regional construction. The results showed (Figure 6) that the highest Beautiful Inner Mongolia index value was 0.67, the mean was 0.22, the SD was 0.14, and the CV was 64%. Among them, Saihan District (Hohhot), Keerqin District (Tongliao), Dongsheng District (Erdos), Alashanzuo Banner, Huimin District (Hohhot), Linhe District (Bayannaoer), and Xincheng District (Hohhot) were the seven banners (Counties and districts) that had the highest comprehensive beauty index values, all above 0.5. Baiyunebo Mineral District (Baotou), Xianghuang Banner and Shiguai District (Baotou) had the lowest comprehensive beauty index values, all of which were lower than 0.05. The reasons for these findings are as follows: Baiyunebo Mineral District had major deficiencies in industrial development, ecological environment, and cultural heritage. Xianghuangqi had shortcomings in cultural heritage and industrial development. Shiguai District was relatively lagging in cultural heritage and social harmony.
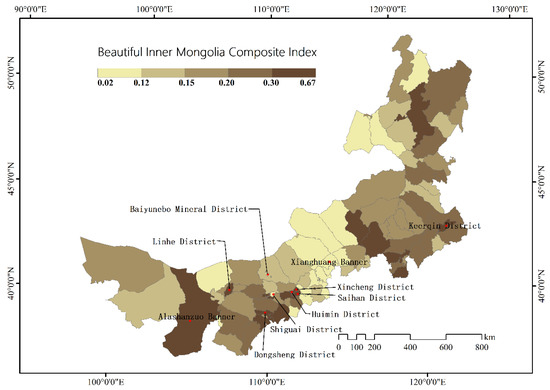
Figure 6.
Spatial distribution of the composite Beautiful Inner Mongolia index in 2020.
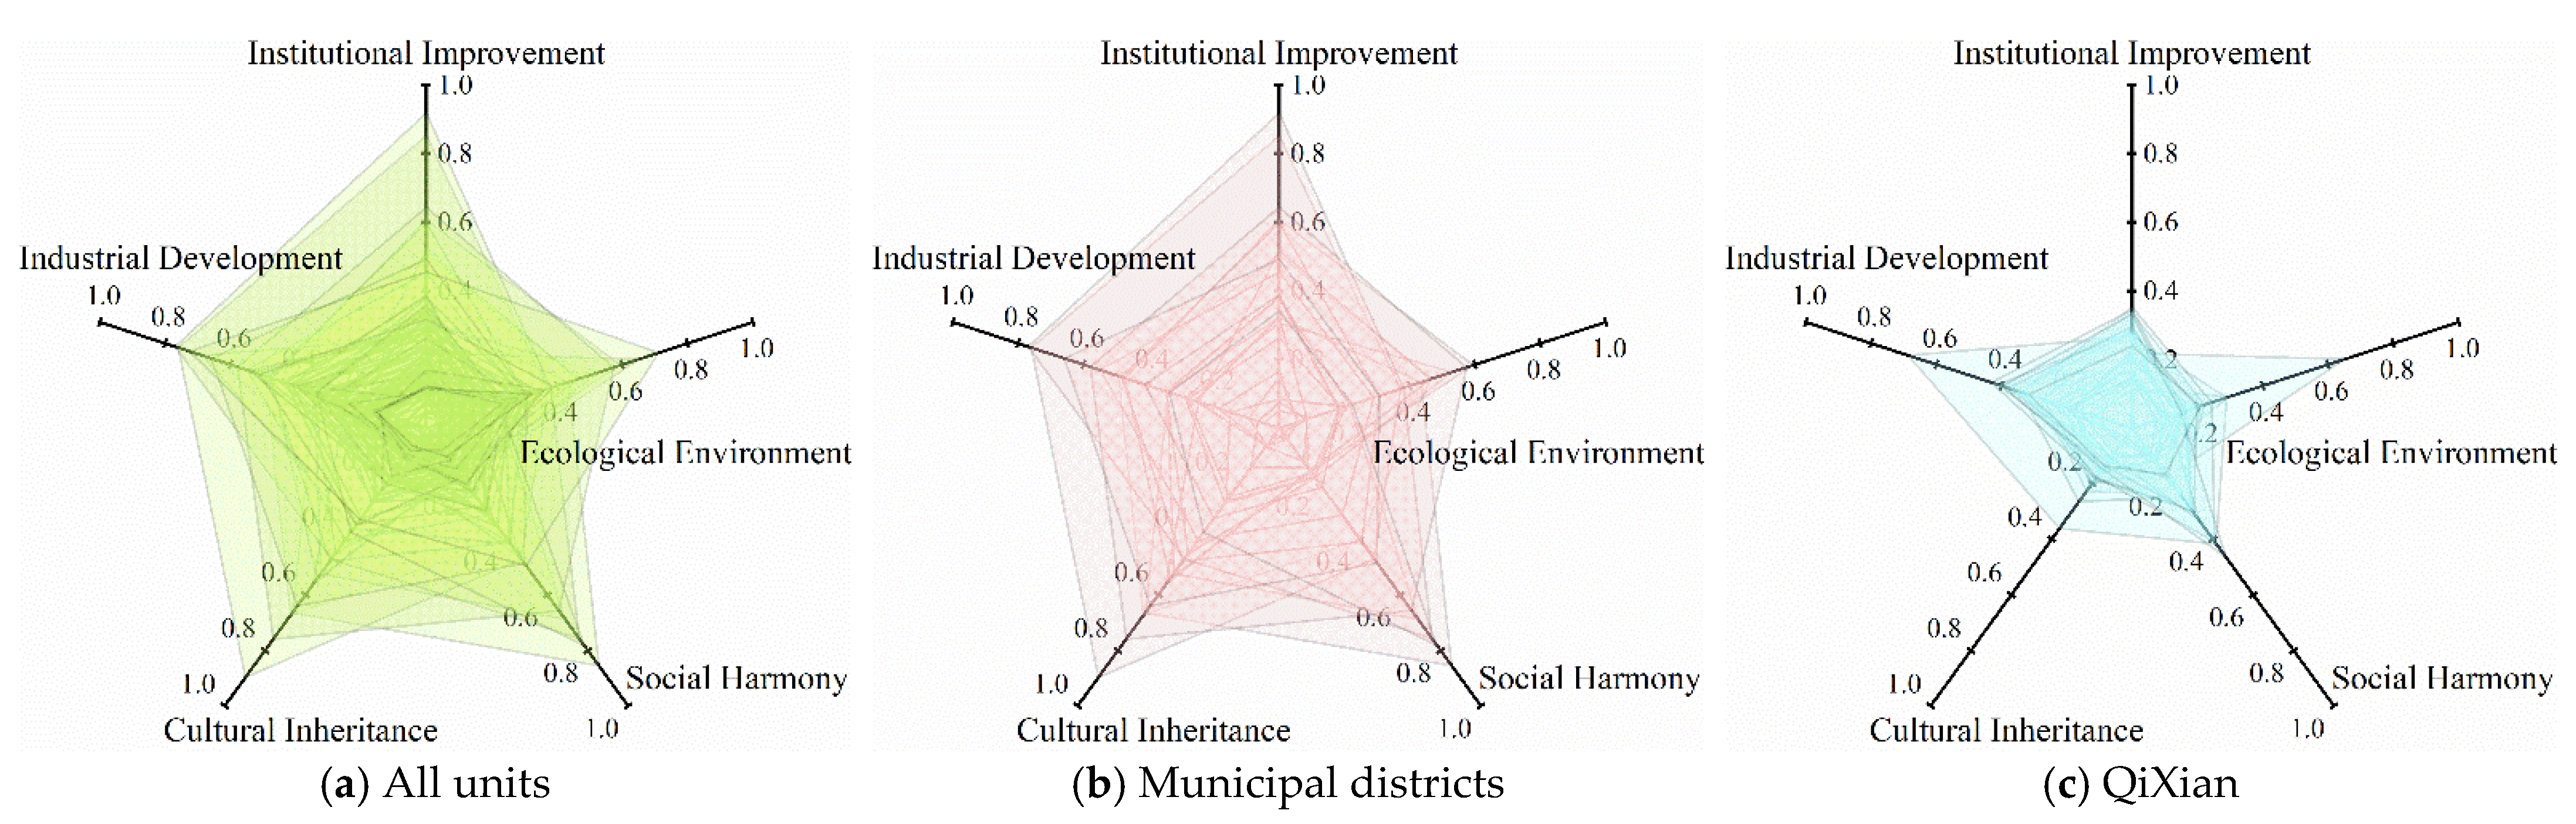
Using the radar chart, the evaluation results of the construction of a Beautiful Inner Mongolia in all 103 county-level administrative regions and five dimensions in the IMAR are displayed in Figure 7a. In terms of the scores of each dimension, the industrial development index of Inner Mongolia’s banners, counties, and districts was the highest (mean = 0.28), and the cultural heritage index was the lowest (mean = 0.18), revealing that the level of industrial development and the construction pressure in the field of the cultural heritage of all banners, counties, and districts in Inner Mongolia were relatively high. In terms of the degree of agglomeration of the scores of each dimension, the cultural heritage and social harmony indexes of each banner, county, and district were relatively scattered (the CVs were 94% and 89%, respectively), which showed that large regional differences existed in the different banners/counties, and districts in Inner Mongolia.
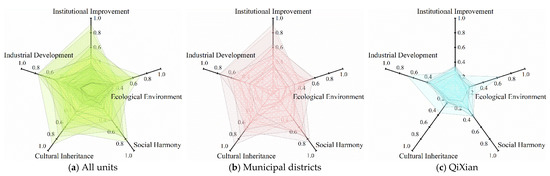
Figure 7.
The results of Beautiful Inner Mongolia construction evaluation for the different types of administrative units: (a) all administrative units; (b) municipal districts; (c) QiXian.
4. Discussion
We identified differences between municipal districts and QiXian, differences between the absolute quantity and relative quantity in terms of population and land area, and advantages and uncertainties for methods based on POI data. Through these discussions, we identified some factors that may have affected the evaluation. Lastly, regarding the uncertainty of the results, the index of each dimension in this study was compared with the results of Fang et al. one by one.
4.1. Differences between Municipal Districts and QiXian
Observed from the resulting data and considering the significant differences between the municipal districts and the general QiXian (including banners, counties, county-level cities and autonomous banners) in Inner Mongolia, we use radar charts to present the results of the evaluation of the construction of a Beautiful Inner Mongolia in two levels of units: municipal districts and QiXian. The results are shown in Figure 7b,c. In municipal districts, the cultural heritage and institutional improvement indexes (mean = 0.39) were the highest; the ecological environment index was the lowest (mean = 0.27). The social harmony index (CV = 83%) and cultural heritage index (CV = 66%) varied widely. In QiXian areas, the industrial development index (mean = 0.25) and ecological environment index (mean = 0.20) were the highest, while cultural heritage index (mean = 0.13) was the lowest. The social harmony index (CV = 66%) and cultural heritage index (CV = 60%) varied relatively widely.
The comparison shows that the overall level of the construction of beautiful areas in municipal districts was better than that in QiXian areas. In particular, the scores of municipal districts were significantly higher than the corresponding indicators of QiXian (0.18, 0.15, 0.13 and 0.25, respectively) in four aspects: institutional improvement (0.39), social harmony (0.32), cultural heritage (0.39) and industrial development (0.35). Only in terms of ecological environment was the gap between the score of banner counties (0.20) and the corresponding index of municipal districts (0.27) the smallest. The above differences were caused by the differences between districts and banners (counties) in terms of geo-spatial location, administrative scope and area, and the actual level of regional economic and social development. Therefore, in future evaluations of the construction of Beautiful China and Beautiful Areas, it will be necessary to consider the characteristics of self-positioning for different types of administrative units to provide a reasonable evaluation benchmark and ranking.
4.2. Differences between Absolute Quantity and Relative Quantity
In the process of the evaluation of the construction of a Beautiful Inner Mongolia, evaluating the absolute number of POIs or the relative number of POIs (the relative amount per person or relative amount per land) involved the benchmark issue of public service equalization evaluation [18,20]. To this end, we further calculated the per capita number of POIs (POIs per 10,000 people) and the average land-based POIs (POIs per km²), and then evaluated the model evaluation and compared the results.
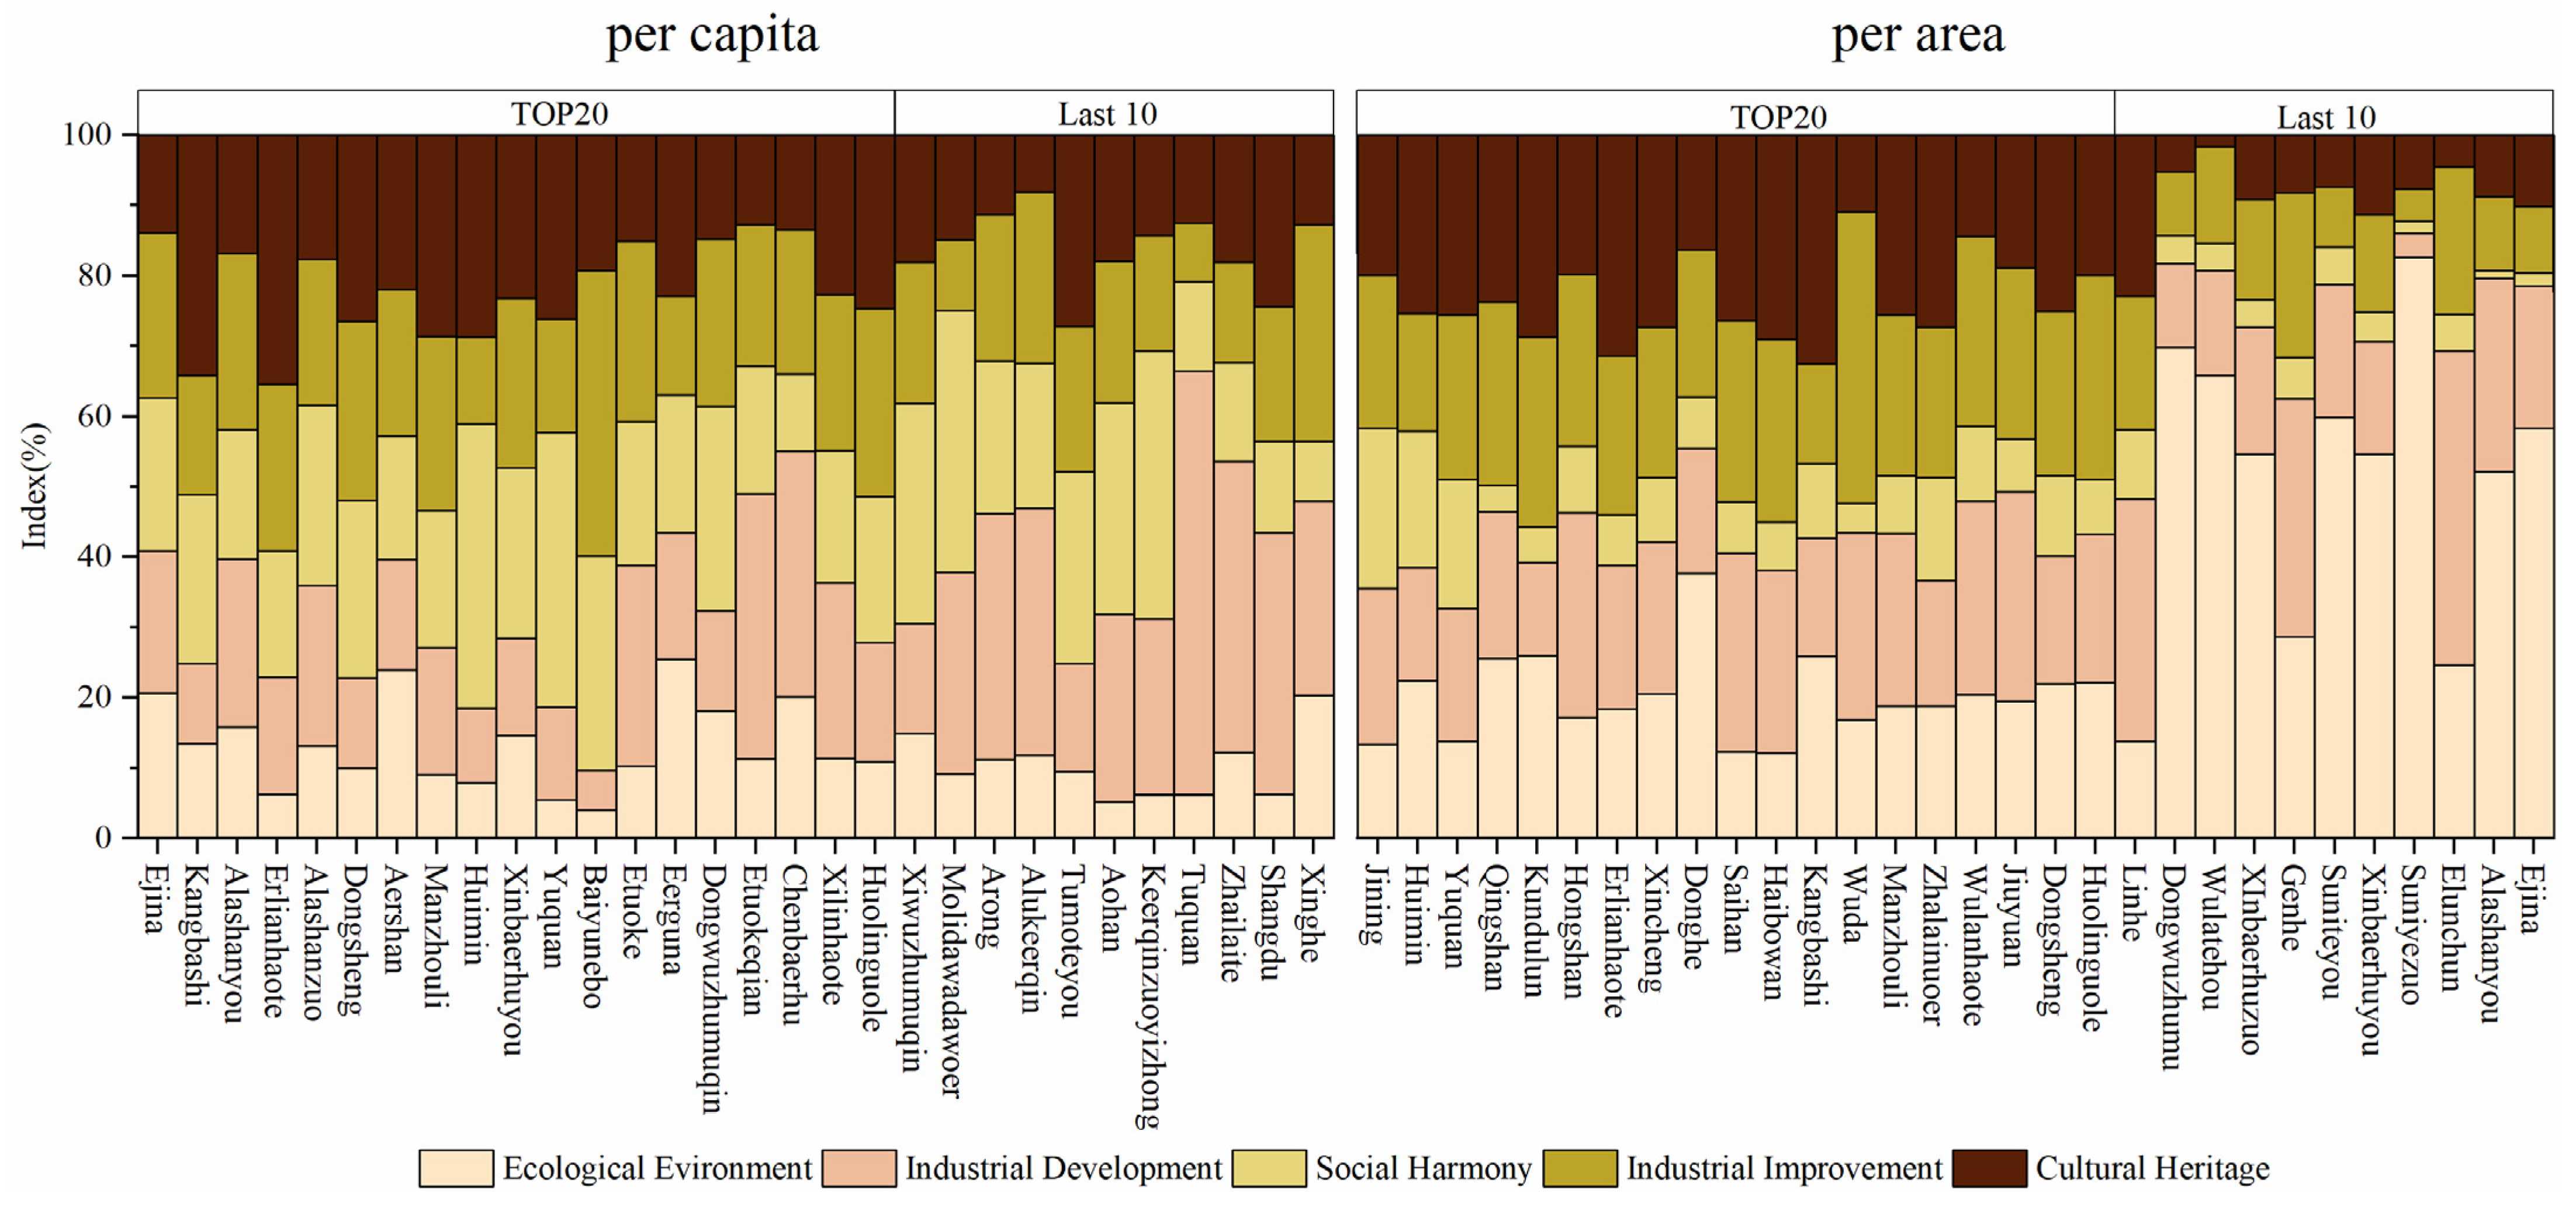
Our data showed that based on the number of POIs per capita, the highest Beautiful Inner Mongolia index was 0.69, the average was 0.14, the standard deviation was 0.11, and the coefficient of variation was 79% (Figure 8). Among them, Ejina Banner (Alashan), Kangbashi District (Erdos), Alashanyou Banner (Alashan), Erlianhaote City (Xilinguole), and Alashanzuo Banner (Alashan) had the highest comprehensive beauty indexes (all above 0.35). Tuquan County (0.038), Zhalaite Banner (0.035), Shangdu County (0.030), and Xinghe County (0.025) had the lowest comprehensive beauty indexes. Further analysis showed that after considering the per capita resources and services, Tuquan County had major shortcomings in terms of institutional improvement and ecological environment; whereas Zhalaite Banner and Shangdu County had shortcomings in terms of institutional improvement, ecological environment, and social harmony; and Xinghe County was relatively lagging in terms of social harmony, cultural heritage, and industrial development.
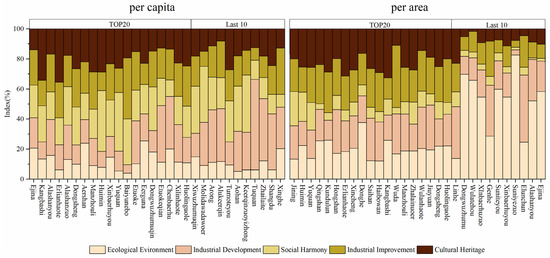
Figure 8.
Beautiful Inner Mongolia construction evaluation based on POI quantity per capita and per area, visualized as percentage stacked histograms (TOP20: The top 20 regions in terms of comprehensive index values; Last 10: The last 10 regions in terms of comprehensive index values).
Based on the number of POIs per area, the highest Beautiful Inner Mongolia index was 0.88, with an average of 0.06, a standard deviation of 0.14, and a coefficient of variation of 233% (Figure 8). Among them, four banners (counties and districts) had the highest comprehensive beauty index: Jining District in Wulanchabu City, Huimin District in Hohhot City, Yuquan District in Hohhot City, and Qingshan District in Baotou City (all above 0.5). Xinbaerhuzuo Banner in Hulunbeier City, Genhe City in Hulunbeier City, Suniteyou Banner in Xilinguole League, Xinbaerhuyou Banner in Hulunbeier City, Sunitezuo Banner in Xilinguole League, Elunchun National Autonomous Banner in Hulunbeier City, Alashanyou Banner in Alashan League, and Ejina Banner in Alashan League (Counties, Districts) had the lowest comprehensive beauty index (all below 0.002). Further analysis showed that after considering the area coverage of various resources and services, the above eight regions had shortcomings mainly in terms of social harmony and cultural heritage. In addition, Suniteyou Banner, Sunitezuo Banner, Alxashanyou Banner, and Ejina Banner were still relatively lagging in terms of institutional improvement and industrial development.
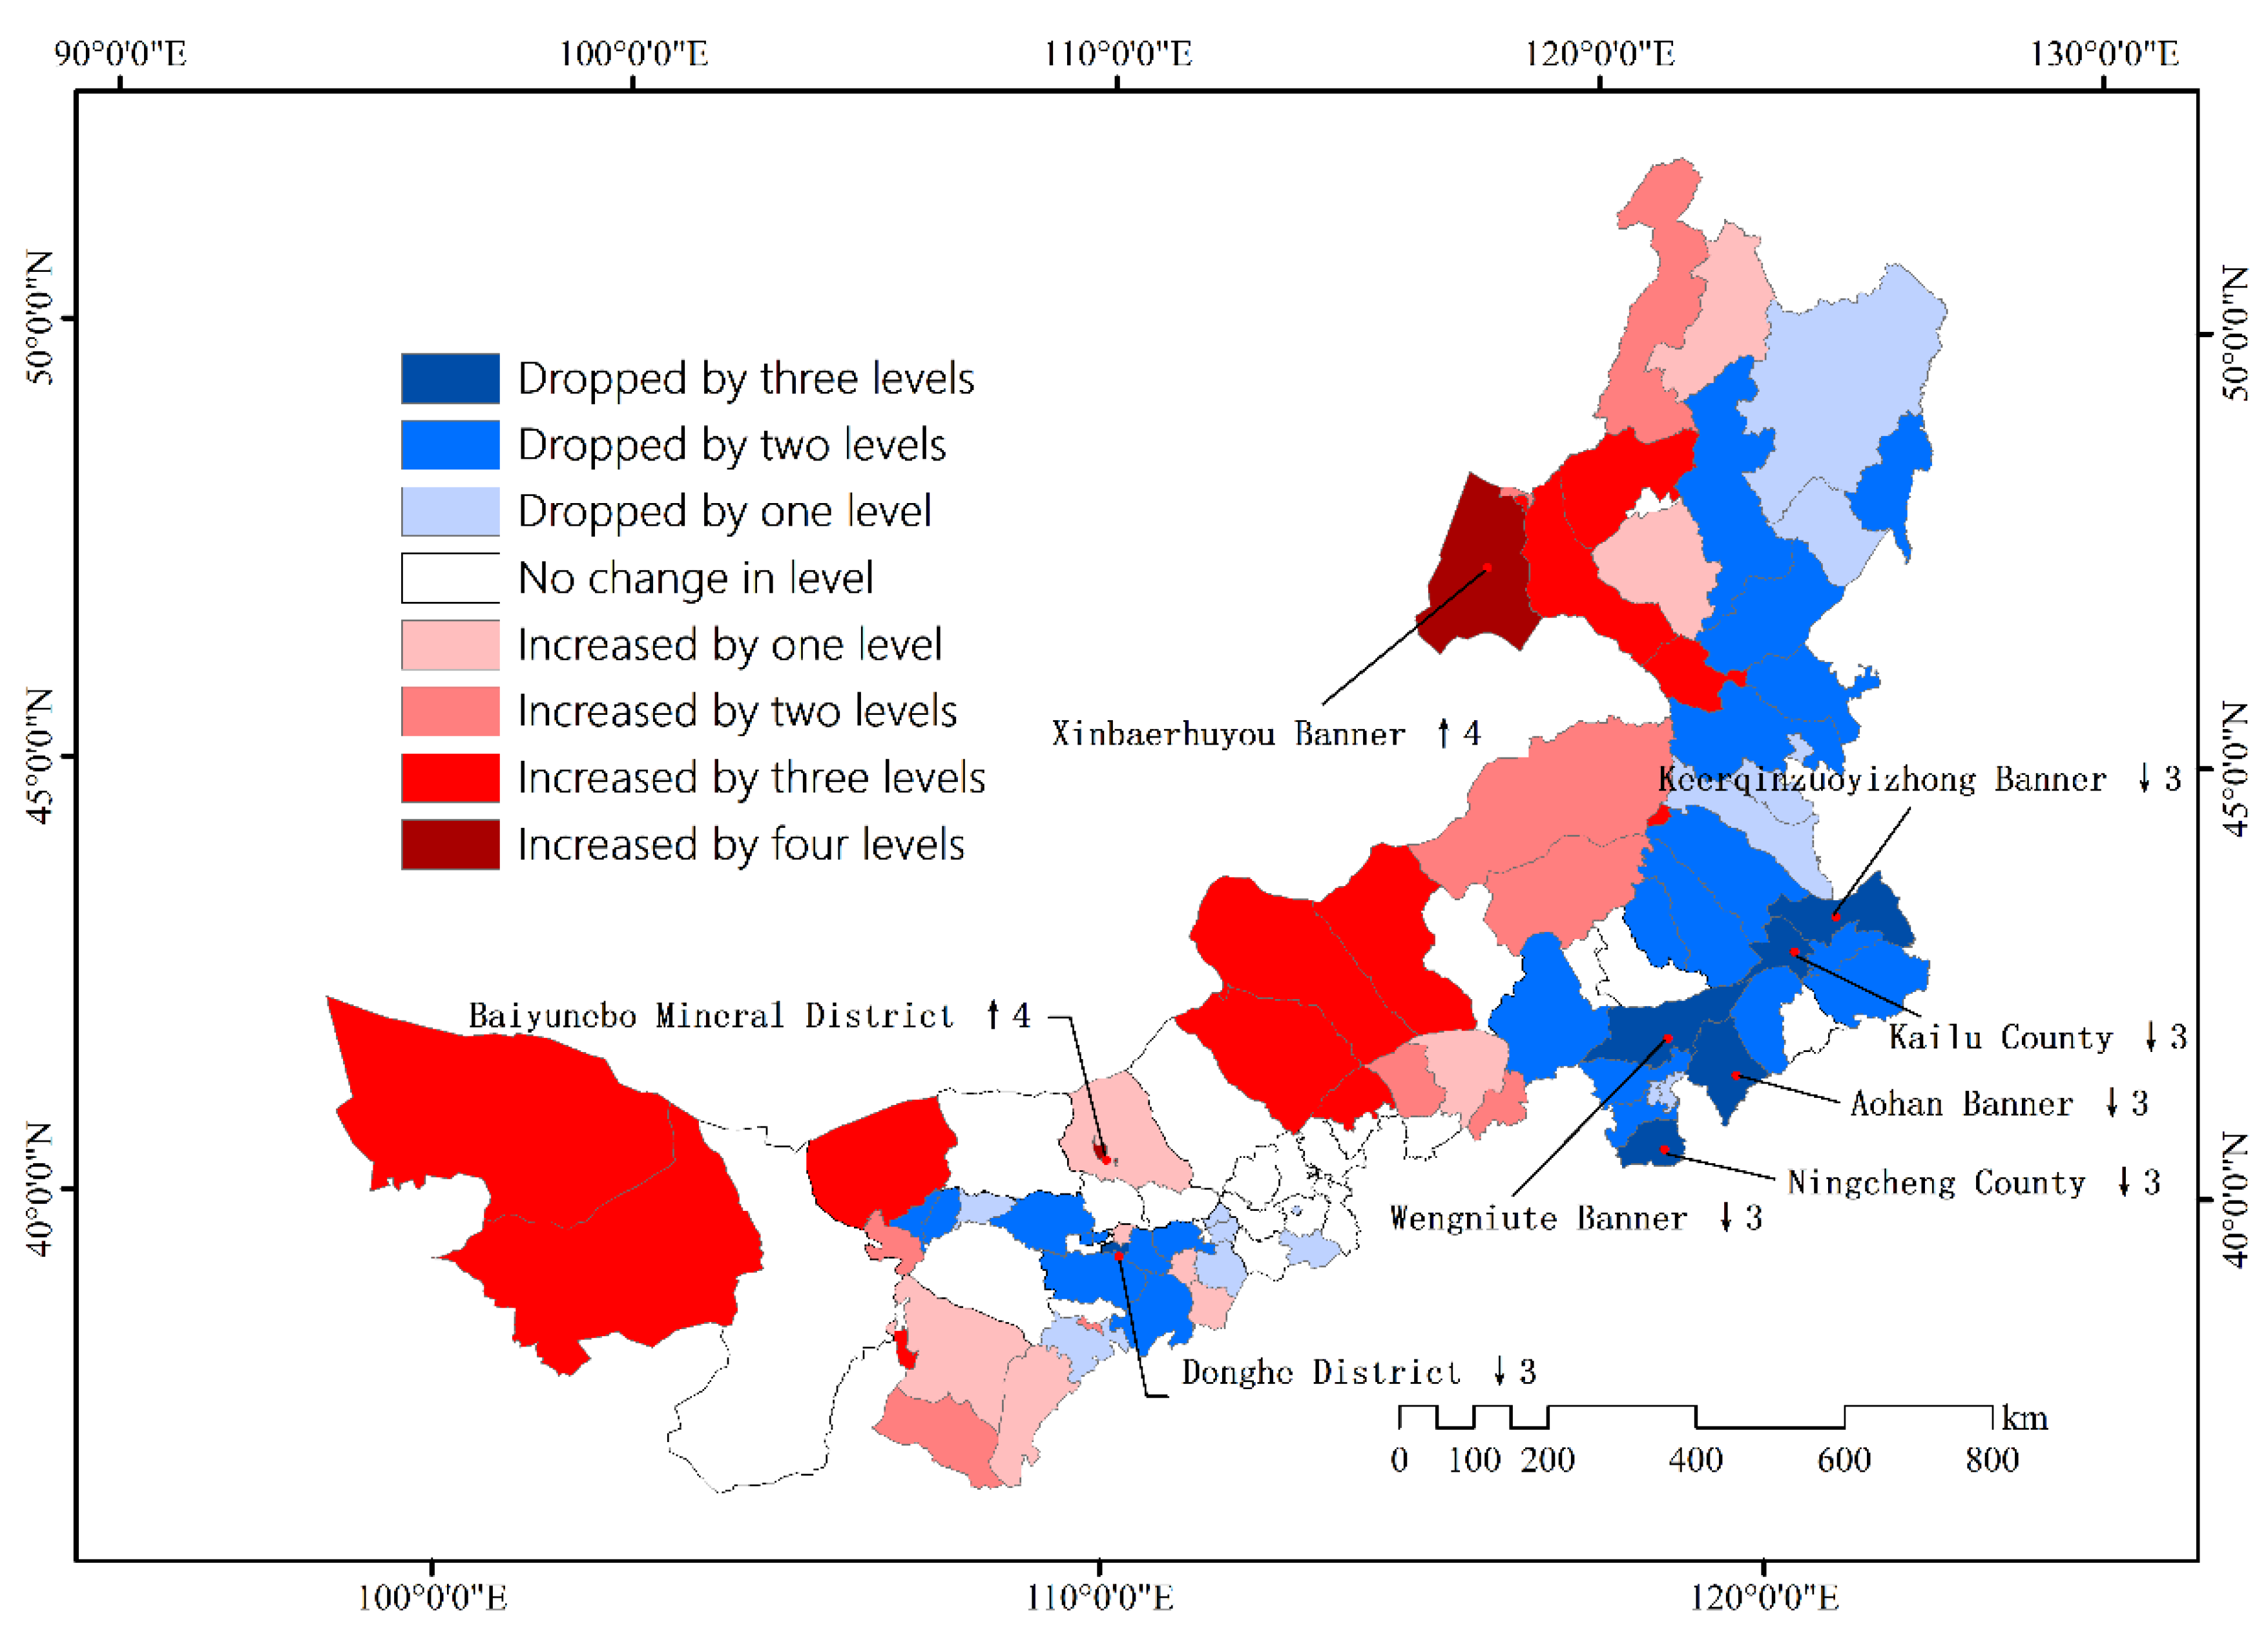
Comparing the evaluation results based on the total amount of POIs and the number of POIs per capita (Figure 9), we found that the rankings of the banners (counties, districts) in the eastern, southeastern, and central HuBaoE city circle of Inner Mongolia, which has a large population base, showed a downward trend. In the western and northern banners (counties, districts) of Inner Mongolia, which have a small population base, the ranking of the evaluation results showed an upward trend. Specifically, 25 banners (counties) showed a downward trend, including Baiyunebo Mineral District (Baotou), Xinbaerhuyou Banner, Hainan District, Huolinguole City, Zhalainuoer City, etc. The rankings of 25 counties in urban areas rose significantly (rankings increased by more than two levels). The rankings of 29 banners (counties), including Kailu County, Keerqinzuoyizhong Banner, Aohan Banner, Ningcheng County, and Wengniute Banner, dropped significantly (the rankings dropped by more than two levels). Further analysis showed that in these banners (counties, districts), due to the large population base, the construction of an ecological environment, industrial development, and other related fields could not effectively support Beautiful Area construction in the administrative region.

Figure 9.
Differences between the Beautiful Inner Mongolia construction evaluation results based on POI quantity and POI quantity per capita.
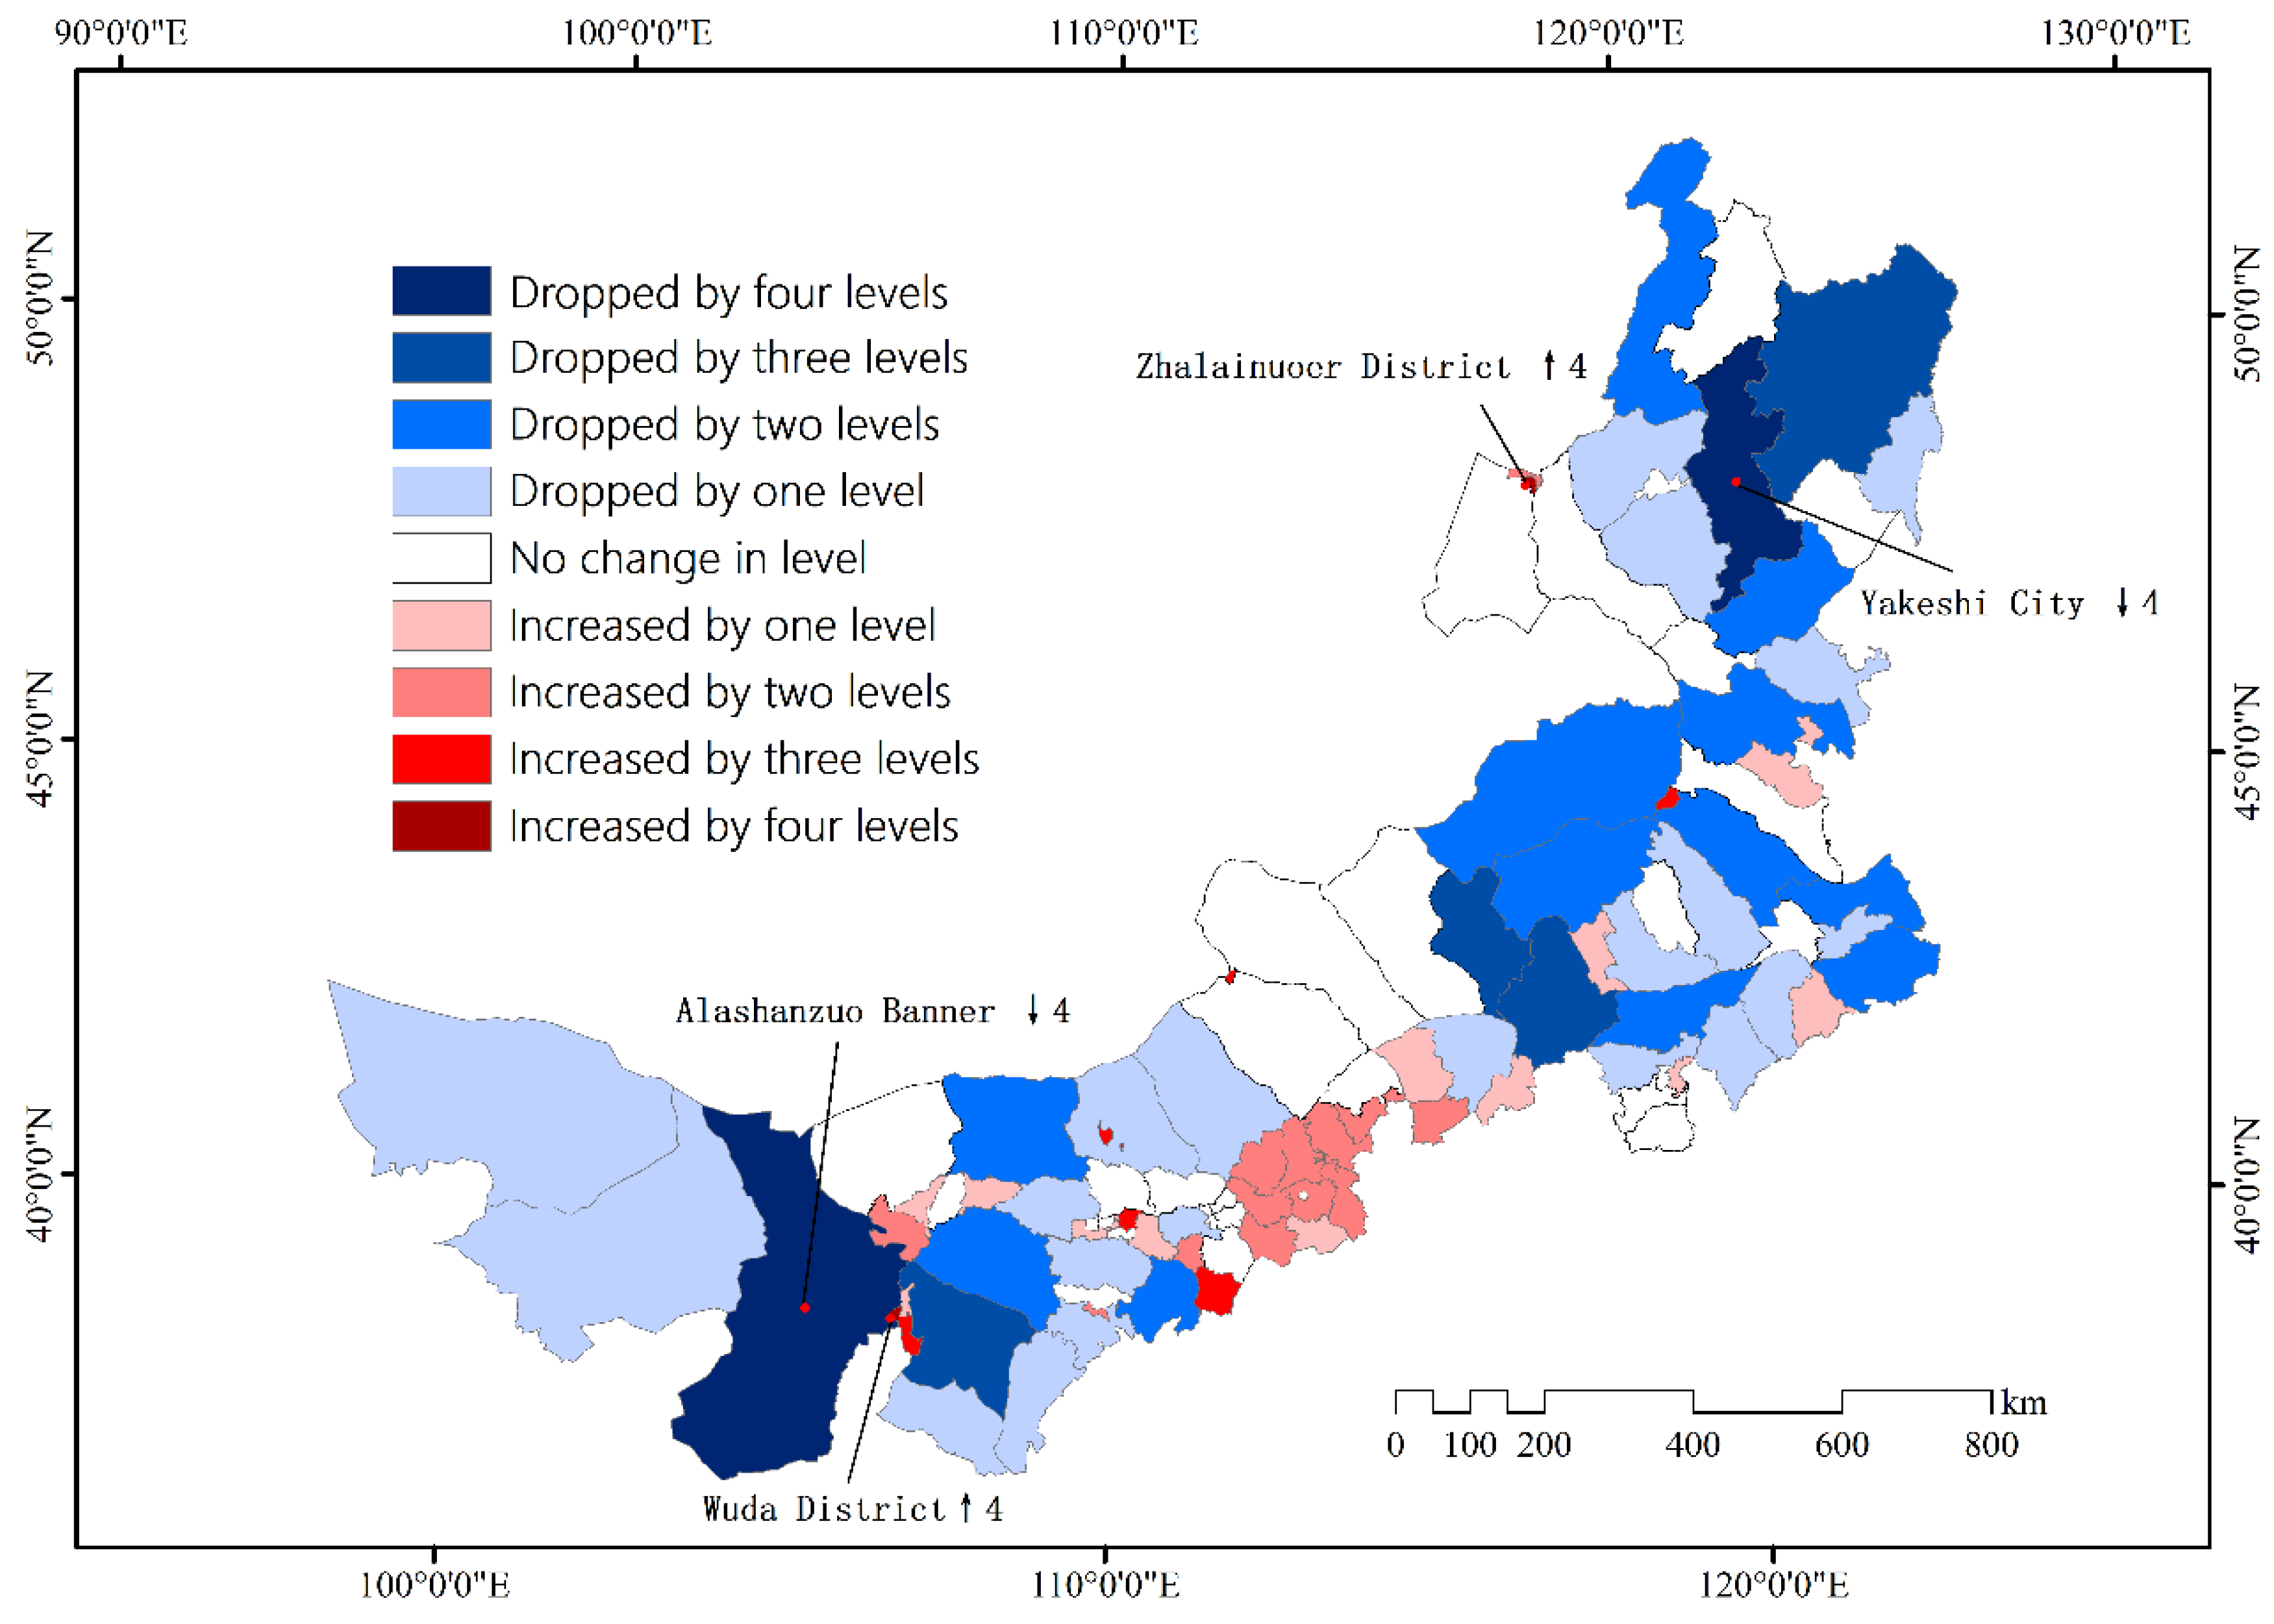
Comparing the evaluation results based on the total amount of POIs and the number of POIs per area (Figure 10), we found that the rankings showed a downward trend in the eastern steppe and western desert areas of Inner Mongolia and in the banners (counties, districts) with larger areas. In the central and southern agricultural areas and agro-pastoral ecotone of Inner Mongolia, the evaluation results of the banners (counties, districts) showed an upward trend. Specifically, the ranking of 21 banner counties and cities in the region increased significantly (ranking raised by more than two grades), e.g., Wuda District (Wuhai), Zhalainuoer District (Hohhot), Qingshuihe County (Hohhot), Shiguai District (Baotou), Baiyunebo Mineral District (Baotou), Hainan District (Wuhai), Huolinguole City, and Erlianhaote City. The ranking of 18 counties and cities, including Yakeshi City, Alashanzuo Banner, Keshikten Banner, Otok Banner, Oroqun Autonomous Banner, and Xilinhot City, dropped significantly (the ranking dropped by more than two grades). Further analysis showed that in these banners (counties and districts), due to the large land area, the construction in fields related to institutional improvement, social harmony, cultural heritage and so on, could not effectively support the construction of Beautiful Areas in the administrative region. The ranking of 18 counties and cities, including Yakeshi City, Alashanzuo Banner, Keshiketeng Banner, Etuoke Banner, Elunchun National Autonomous Banner, and Xilinhaote City, dropped significantly (the ranking dropped by more than two grades).
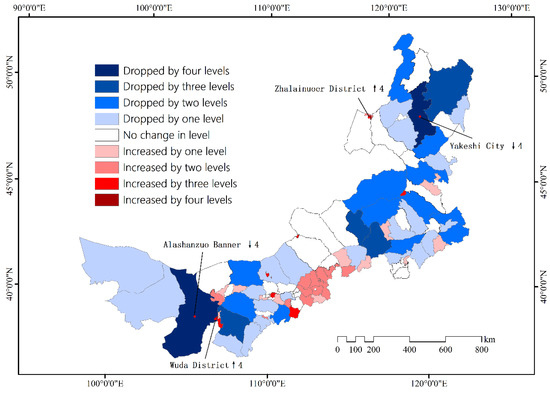
Figure 10.
Differences between the Beautiful Inner Mongolia construction evaluation results based on POI quantity and POI quantity per area.
Based on the above comparative analysis results, we concluded that given the significant differences in the evaluation results caused by absolute indicators (such as the number of POIs in each unit) and relative indicators (such as the POI quantity per capita and per area), the method cannot be blindly adopted for the evaluation of Beautiful China and Beautiful Areas. Instead, a comprehensive understanding of a variety of factors, such as the size of administrative units, the scale of the regional population, and so on, should be considered.
4.3. Advantages and Uncertainties of Methods Based on POI Data
In the construction of this index system, we referred to the overall framework of the Zhongke Beauty Index based on statistical data sources introduced by Fang et al. from the Chinese Academy of Sciences, but in the basic data sources, internet map POIs with clearer spatial position, more accurate description of attributes, and stronger real-time performance were used to establish our index system. Therefore, the specific indicators constructed in this study are significantly different from those in the former study. Compared to conventional statistical data sources, POIs are more objective, real, and close to people’s lives. The evaluation results based on POI data also have these advantages: With the rapid updating of internet map POI data, the results strongly reflect the current situation and can be updated quickly, which enables rapid evaluation and comparative studies on annual, quarterly, monthly, and even 10-day scales. This is why we were able to study 2019 in 2019, whereas Fang et al. could only complete the evaluation of 2016 in 2019 [2].
In Fang et al.’s research [2], the beauty indexes of ecological environment, green development, social harmony, institutional improvement, and cultural heritage in the Inner Mongolia Autonomous region were between 0.51 and 0.55, 0.26 and 0.30, 0.25 and 0.30, 0.30 and 0.34, and 0.07 and 0.10, respectively (no data were obtained, only a rough estimate based on the maps of that study). In this study, the findings based on POIs showed that the above dimension indexes were 0.21, 0.28, 0.19, 0.23, and 0.18, respectively. The deviations between the two research results are 60%, 0%, 32%, 28% and 53%, respectively. Fang et al. found that the comprehensive index of BCC in Inner Mongolia was between 0.19 and 0.21, whereas the calculation based on POIs showed that the comprehensive index of a Beautiful Inner Mongolia was 0.22, for a difference of 9%. The comparison between the two showed that although there are differences in basic data sources, basic data items, and sub-dimensional evaluation index between this study and that of Fang et al.; the final results of this study are not much different from those of Fang et al., that is, we achieved the results goals using different routes. Therefore, we concluded that the index system and technical methods for evaluating the construction of a Beautiful Inner Mongolia based on POIs proposed in this paper can be further extended and applied to the national scale or to other provinces, regions (cities), and counties to form a technical scheme for the evaluation of a Beautiful China and Beautiful Areas.
Notably, there are deficiencies and uncertainties in the technical solutions and results obtained regarding a Beautiful Inner Mongolia or Beautiful China based on POIs: (1) We only considered the POI data, but did not consider other data that can reflect an area’s feature (such as regions of interest and remote sensing images) or the reflection of the natural surface. (2) We only considered the quantitative characteristics of ground objects, but did not consider the quality and capacity characteristics of ground objects (such as nature reserve areas, factory areas, and enterprise profitability). (3) Only static feature target data were considered, without considering important social event data (such as macro-economic growth, enterprise operation, disasters, crimes, violent terrorism, etc.). (4) Only positive index data that played a positive role in promoting BCC were considered, and negative index data (such as environmental pollution, feudal superstition, poverty, etc.) were not considered. The shortcomings and problems in the construction of these index systems and evaluation models produce some uncertainties in the accurate scientific evaluation of the construction of Beautiful Inner Mongolia, which is important to improve and study in the future.
5. Conclusions
In this study, we aimed to establish an index system and technical route for the evaluation of BCC using internet big data technology and geographic information technology, starting from the theoretical system of Beautiful China Construction and based on the latest POI data provided by Amap. Taking Inner Mongolia as a case area, the beauty of the ecological environment, industrial development, social harmony, institutional improvement, and cultural heritage of various banners (counties and districts) were evaluated, both in the form of quantitative and spatial diagrams.
Compared to a previous related study, POI data, which provides many advantages, were used to overcome the low accuracy and low authenticity of data, and the cumbersomeness of data processing in the application of common public data in evaluation index systems. The construction of an evaluation index system of Beautiful Inner Mongolia based on POI data filled the research gap that has not yet applied POI data to Beautiful China Construction. The evaluation index system, involving five dimensions and 25 indicators, provides a breakthrough in the studies of index system applications based on POI data in terms of the authoritative theoretical basis, mature index model, complete technical process, and rich index types of this evaluation index system. Lastly, we held comprehensive discussions on the influence of different factors on the evaluation results, such as population distribution, and the different types and sizes of administrative units.
We identified that the ecological environment was 0.21 with a CV of 62%, the industrial development was 0.28 with a CV of 61%, the social harmony was 0.19 with a CV of 89%, the institutional improvement was 0.23 with a CV of 70%, and the cultural heritage was 0.18 with a CV of 94%. Significant spatial differences were identified in the dimensions of cultural heritage and social harmony in the IMAR. The industrial and mining areas, agricultural counties, and other economically lagging areas usually had relatively low index values, such as the Baiyunebo Mining Area, Xianghuangqi, and Shiguai. In the Discussion section, the index values of each dimension were compared to the results in Fang et al.’s maps. Although the current study is based on a preliminary attempt using a small sample, the findings suggest that the overall consistency is good between the evaluation indexes of the two methods. Another major finding was that the deviations between the two methods in terms of industrial development, social harmony, and institutional improvement are relatively low, demonstrating the better application effect of POI data in these three dimensions.
Overall, referring to the presently available literature, the proposed method on Beautiful China and Beautiful Regions based on POIs is innovative, and we provided a new idea for the application of internet big data to the evaluation of the construction of a Beautiful China, economic and social status, and the scale of other countries and provinces. The application results of this method in the case area of Inner Mongolia, being in good agreement with the results of the previous study, shows that the proposed index system and technical methods provide an important reference for the national departments to quickly and accurately conduct the relevant operational evaluation work. According to the results of the uncertainty analysis, in the future, researchers can focus on POI data combined with data sources and information modeling technologies such as remote sensing, internet event searches, and information mining to form a more comprehensive, more accurate, and faster evaluation technology system and system platform for evaluating Beautiful China or Beautiful Regions.
Author Contributions
Conceptualization Yunfeng Hu; methodology, Yunfeng Hu and Yuting Liang; data collection, Yuting Liang; writing—original draft, Yunfeng Hu and Yuting Liang; writing—review and editing, Yuting Liang and Yunfeng Hu. All authors have read and agreed to the published version of the manuscript.
Funding
This work was supported by the Strategic Priority Research Program of Chinese Academy of Sciences (XDA19040301), and the National Natural Science Foundation of China (41977421). The authors would like to thank all the government funding partners for supporting this research.
Data Availability Statement
Not applicable.
Conflicts of Interest
The authors declare no conflict of interest.
References
- Xinhua News Agency. Mountains Want Green, People Want Rich—The First Mention of “Beautiful China” in the Report of the 18th National Congress of the Communist Party of China Attracts Attention. Website of the Central People’s Government of the People’s Republic of China. 8 November 2012. Available online: http://www.gov.cn/jrzg/2012-11/08/content_2260440.htm (accessed on 8 July 2020).
- Fang, C.L.; Wang, Z.B.; Liu, H.M. Exploration of the theoretical basis and evaluation plan for the construction of Beautiful China. Acta Geogr. Sin. 2019, 74, 619–632. [Google Scholar]
- National Development and Reform Commission. The National Development and Reform Commission issued the “Green Development Index System” and “Ecological Civilization Construction Assessment Target System”. Website of the Central People’s Government of the People’s Republic of China. 12 December 2016. Available online: http://www.gov.cn/xinwen/2016-12/23/content_5151575.htm (accessed on 8 July 2020).
- Xinhua News Agency. Promoting Green Development and Building a Beautiful China—An Overview of Comprehensively Deepening the Reform of the Ecological Civilization System Since the Third Plenary Session of the 18th Central Committee. Website of the Central People’s Government of the People’s Republic of China. 3 January 2019. Available online: http://www.gov.cn/xinwen/2019-01/03/content_5354583.htm (accessed on 8 July 2020).
- National Development and Reform Commission. Notice of the National Development and Reform Commission on Issuing the “Beautiful China Construction Evaluation Index System and Implementation Plan”. Website of the Central People’s Government of the People’s Republic of China. 28 February 2020. Available online: http://www.gov.cn/zhengce/zhengceku/2020-03/07/content_5488275.htm (accessed on 8 July 2020).
- Ge, Q.S.; Fang, C.L.; Jiang, D. The mission of geography and the coupling path of man-earth system in the construction of Beautiful China. Acta Geogr. Sin. 2020, 75, 1109–1119. [Google Scholar]
- Gan, L.; Cai, S.W.; Cheng, L. Evaluation of China’s urban construction level from the perspective of “Beautiful China”—Based on a comparative study of provincial capitals and sub-provincial cities. Thinking 2013, 39, 143–148. [Google Scholar]
- Huang, L.; Shao, C.F.; Sun, Z.S.; Ju, M.T. Research on Evaluation Index System of “Beautiful Country”. Ecol. Econ. 2014, 30, 392–398. [Google Scholar]
- Lai, Z.L.; Zha, X.C. The construction and application of the evaluation index system of regional ecological civilization construction from the perspective of “Beautiful China”—Taking Shaanxi as an example. Ecol. Econ. 2014, 30, 395–398. [Google Scholar]
- Xiang, Y.B.; Xie, B.G. “Beautiful China” regional construction evaluation index system design. Stat. Decis. 2015, 5, 51–55. [Google Scholar]
- Hu, Z.Y.; Zhao, L.K.; Liu, Y.W. Construction and Demonstration of Evaluation Index System of “Beautiful China”. Stat. Decis. 2014, 9, 4–7. [Google Scholar]
- Xie, B.L.; Chen, Y.L.; Li, X.Q. Application of Coupling Coordination Model in the Construction Evaluation of “Beautiful China”. Econ. Geogr. 2016, 36, 38–44. [Google Scholar]
- Xie, B.L.; Xiang, Y.B. Construction and Application of Evaluation Index System for the Construction Level of Beautiful China. Econ. Geogr. 2017, 37, 15–20. [Google Scholar]
- Hu, Y.F.; Wang, Q.Q.; Liu, Y.; Li, J.; Ren, W.B. The principle and method of national-scale social and economic data gridding. J. Geo-Inf. Sci. 2011, 13, 573–578. [Google Scholar]
- Zhang, Q.; Hu, Y.F.; Liu, J.Y.; Liu, Y.; Ren, W.B.; Li, J. Identification of Chinese urban agglomerations based on transportation, population and economy. Acta Geogr. Sin. 2011, 66, 761–770. [Google Scholar]
- Yue, Y.; Zhuang, Y.; Yeh, A.G.; Xie, J.Y.; Ma, C.L.; Li, Q.Q. Measurements of POI-based mixed use and their relationships with neighbourhood vibrancy. Int. J. Geogr. Inf. Sci. 2017, 31, 658–675. [Google Scholar] [CrossRef] [Green Version]
- Shi, K.F.; Chang, Z.J.; Chen, Z.Q.; Wu, J.P.; Yu, B.L. Identifying and evaluating poverty using multisource remote sensing and point of interest (POI) data: A case study of Chongqing, China. J. Clean. Prod. 2020, 255, 120245. [Google Scholar] [CrossRef]
- Hou, J.W.; Zheng, M.Y. Online Spatial Evaluation of Residential Livability Based on POI Data Mining and LMBP Algorithm. Arab. J. Geosci. 2021, 14, 1–11. [Google Scholar] [CrossRef]
- Li, F.; Yan, Q.W.; Bian, Z.F.; Liu, B.L.; Wu, Z.H. A POI and LST Adjusted NTL Urban Index for Urban Built-Up Area Extraction. Sensors 2020, 20, 2918. [Google Scholar] [CrossRef]
- Ye, X.Y.; Tan, H.L.; Zhang, Y.Z.; Zhang, L.; Zhang, Z.H. Research on Convenience Index of Urban Life Based on POI Data. J. Phys. Conf. Ser. 2020, 1646, 012073. [Google Scholar] [CrossRef]
- Mao, Y.; Yin, P.F.; Lee, W.C.; Lee, D.L. Exploiting geographical influence for collaborative point-of-interest recommendation. In Proceedings of the 34th International ACM SIGIR Conference on Research and Development in Information Retrieval, Beijing, China, 24–28 July 2011. [Google Scholar]
- Liu, B.; Hui, X. Point-of-Interest Recommendation in Location Based Social Networks with Topic and Location Awareness. In Proceedings of the 2013 SIAM International Conference on Data Mining, Austin, TX, USA, 2–4 May 2013. [Google Scholar]
- McKenzie, G.; Janowicz, K.; Adams, B. A weighted multi-attribute method for matching user-generated Points of Interest. Cartogr. Geogr. Inf. Sci. 2014, 41, 125–137. [Google Scholar] [CrossRef]
- Hu, Y.F.; Han, Y.Q. Identification of Urban Functional Areas Based on POI Data: A Case Study of the Guangzhou Economic and Technological Development Zone. Sustainability 2019, 11, 1385. [Google Scholar] [CrossRef] [Green Version]
- Liu, J.P.; Cao, Y.H.; Wang, Y.; Wang, L.J.; Wu, W.Z.; Su, F.Z. Research on urban building function classification method based on POI data. J. Geo-Inf. Sci. 2020, 22, 1339–1348. [Google Scholar]
- Xu, S.Y.; Qing, L.B.; Han, L.M.; Liu, M.; Peng, Y.H.; Shen, L.F. A New Remote Sensing Images and Point-of-Interest Fused (RPF) Model for Sensing Urban Functional Regions. Remote Sens. 2020, 12, 1032. [Google Scholar] [CrossRef] [Green Version]
- Bakillah, M.; Liang, S.; Mobasheri, A.; Arsanjani, J.J.; Zipf, A. Fine-resolution population mapping using OpenStreetMap points-of-interest. Int. J. Geogr. Inf. Sci. 2014, 28, 1940–1963. [Google Scholar] [CrossRef]
- Ye, T.T.; Zhao, N.Z.; Yang, X.C.; Ouyang, Z.T.; Liu, X.P.; Chen, Q.; Hu, K.J.; Yue, W.Z.; Qi, J.G.; Li, Z.S.; et al. Improved population mapping for China using remotely sensed and points-of-interest data within a random forests model. Sci. Total Environ. 2019, 658, 936–946. [Google Scholar] [CrossRef]
- Yang, X.C.; Ye, T.T.; Zhao, N.Z.; Chen, Q.; Yue, W.Z.; Qi, J.G.; Zeng, B.; Jia, P. Population Mapping with Multisensor Remote Sensing Images and Point-Of-Interest Data. Remote Sens. 2019, 11, 574. [Google Scholar] [CrossRef] [Green Version]
- Pouke, M.; Goncalves, J.; Ferreira, D.; Kostakos, V. Practical simulation of virtual crowds using points of interest. Comput. Environ. Urban Syst. 2016, 57, 118–129. [Google Scholar] [CrossRef]
- Liu, X.J.; Long, Y. Automated identification and characterization of parcels with OpenStreetMap and points of interest. Environ. Plan. B Plan. Des. 2016, 43, 341–360. [Google Scholar] [CrossRef]
- Hu, T.Y.; Yang, J.; Li, X.C.; Gong, P. Mapping Urban Land Use by Using Landsat Images and Open Social Data. Remote Sens. 2016, 8, 151. [Google Scholar] [CrossRef]
- Yao, Y.; Li, X.; Liu, X.P.; Liu, P.H.; Liang, Z.T.; Zhang, J.B.; Mai, K. Sensing spatial distribution of urban land use by integrating points-of-interest and Google Word2Vec model. Int. J. Geogr. Inf. Sci. 2017, 31, 825–848. [Google Scholar] [CrossRef]
- Meng, Y.; Xing, H.F.; Hou, D.Y.; Xu, H.B.; Liu, J.R. A method of applying interest point data for land surface cover classification. Inf. Sci. Ed. 2019, 44, 758–764. [Google Scholar] [CrossRef]
- Zhang, Y.C.; Xia, J.J.; Fang, H.; Zuo, H.T.; Jiang, Y. Roadmap towards clean heating in 2035: Case study of inner Mongolia, China. Energy 2019, 189, 116152. [Google Scholar] [CrossRef]
- Liang, Y.T.; Hu, Y.F.; Han, Y.Q. Spatial Distribution and Dynamic Changes in Research Hotspots for Desertification in China Based on Big Data from CNKI. J. Resour. Ecol. 2019, 10, 612,692–703. [Google Scholar]
- Inner Mongolia Autonomous Region Statistics Bureau. Inner Mongolia Statistical Yearbook-2019. 2019. Available online: http://tj.nmg.gov.cn/Files/tjnj/2019/indexch.htm (accessed on 25 December 2020).
- National Basic Geographic Information Center. 1:1 Million National Basic Geographic Database. 2017. Available online: https://www.webmap.cn/commres.do?method=result100W (accessed on 29 December 2019).
- Ministry of Civil Affairs of the People’s Republic of China. 2019. Available online: http://www.mca.gov.cn/ (accessed on 25 December 2020).
- Thomas, L.S. How to make a decision: The analytic hierarchy process. Eur. J. Oper. Res. 1990, 48, 9–26. [Google Scholar]
- Li, J.M.; Deng, X.; Zeng, H.J.; Chen, J.Y.; Zhao, J.F. Analysis of Analytic Hierarchy Process Weight Calculation Method and Its Application Research. Math. Pract. Theory 2012, 42, 93–100. [Google Scholar]
- Sun, B.W.; Li, X.S. Measurement and comparison of regional integration of urban agglomerations in the middle reaches of the Yangtze River. Resour. Environ. Yangtze Basin 2013, 22, 996–1003. [Google Scholar]


Publisher’s Note: MDPI stays neutral with regard to jurisdictional claims in published maps and institutional affiliations. |
© 2021 by the authors. Licensee MDPI, Basel, Switzerland. This article is an open access article distributed under the terms and conditions of the Creative Commons Attribution (CC BY) license (https://creativecommons.org/licenses/by/4.0/).