Abstract
The implementation of autonomous rovers in agriculture could be a promising solution to ensure, at the same time, productivity and sustainability. One of the key points of this kind of vehicle concerns their autonomous driving strategy. Generally, the strategy should include the path planning and path following algorithms. In this paper, an autonomous driving strategy assessing both is presented. To evaluate the effectiveness of this strategy, a case study of an agricultural rover is presented. A co-simulation model, including a multibody model of the rover, is developed in Matlab/Simulink R2021b and Hexagon Adams 2024 environments to virtually test the rover capabilities and the effects of its dynamics on the robustness of the algorithm. Given different orchard configurations, common but critical work scenarios are investigated, namely a 180° turn and an obstacle avoidance manoeuvre. The actual trajectory obtained during simulations are compared to the ideal trajectory defined in the path planning stage. Furthermore, the torque demand at the electric motors is evaluated. To consider a wide range of possible operating conditions, additional tests with different terrains, payloads and road slopes are included. Results showed that the rover managed to accomplish the considered manoeuvres on loam soil with a maximum trajectory deviation of 0.58 m, but a temporary overload of the motors is needed. On the contrary, in case of difficult terrains, such as muddy soil, the rover was not able to perform the manoeuvre. To limit tire slip, a traction control algorithm is developed and implemented, and the results are compared with the case without control.
1. Introduction
Agriculture has a role of primary importance both from economic and social perspectives. Estimates indicate that agricultural sector added value has increased by around 84% in the last 20 years, reaching a 3.7 trillion USD volume of business [1]. However, this turnover poses several challenges of different natures: social, economic and environmental. Indeed, in the near future, agriculture will have to deal with the reduction of agricultural workers and, at the same time, with the current predictions of worldwide population growth, which speak of 10 billion people by 2050 [1,2,3,4]. As a consequence, the agricultural sector supply chain must be improved in terms of efficiency while maintaining high productivity and standard quality. For these reasons, circular economy models have been progressively implemented. In this way, both economic profit and environmental sustainability can be achieved [5,6]. Indeed, in recent decades, several studies that demonstrate the correlation between anthropic activities and environmental pollution have been presented [7]. Agriculture is a key element in the food supply chain and, at the same time, is an important source of emissions [8,9,10]. Indeed, agricultural machineries are generally equipped with oversized diesel-powered engines that produce a high amount of pollutants and greenhouse gas at the exhaust due to the fuel combustion process [11]. Hence, it can be stated that the direct and indirect consequences of agricultural practices are non-negligible impacts on human health, climate change and economics [12,13,14,15]. Coming to terms with these facts, there are human activities that are necessary for guaranteeing a sufficient quality of living. To reduce the emissions levels, several solutions have been investigated, including the adoption of exhaust gas aftertreatment systems [16], alternative fuels [17,18,19], and innovative powertrains [20,21,22,23,24,25].
A promising solution to address both productivity and sustainability is the implementation of autonomous rovers in agriculture [26,27,28]. Indeed, these modern agricultural robots are able to perform several tasks, including crop health monitoring and pest and disease detection, according to precision agriculture principles [29,30,31]. The employment of autonomous vehicles can optimize resource utilization, improve field operations efficiency and reduce the environmental impact of agricultural practices [32]. Furthermore, these robots are generally lighter, reducing the effects of soil compaction, and do not need the presence of a human. However, agricultural rovers need to be properly designed and programmed to perform all the tasks they might be appointed to perform. The vehicle chassis and the powertrain must be designed considering the operational requirements of the rover, such as endurance and peak power performance. As for the rover control unit, an autonomous driving system must be implemented. The development of autonomous driving algorithms can be divided into two main stages, namely path planning and path following stages [33,34,35]. The path planning stage involves the definition process of the optimal trajectory in the operating environment, while the path following stage defines how the vehicle follows the predefined trajectory.
In this scenario, co-simulation involving a multibody model can be an effective tool that can be used during the vehicle development stage to virtually test and optimize both the autonomous driving algorithm and the rover mechanical design. Co-simulation consists of the analysis of complex systems involving multiple interconnected models. In contrast to simple simulation, the co-simulation can integrate models which refers to different domains in order to provide a more comprehensive and accurate view of its overall behaviour. Indeed, in the literature, several studies have exploited co-simulations to test unmanned vehicles and their control. He et al. [36] developed a co-simulation model using NX/Motion and Simulink software to verify the control strategy for a wheeled-legged planetary rover that must be able to operate on rough terrains. Wang et al. [37] simulated the behaviour of an underwater robot through a co-simulation model using Webots and Matlab, showing that this approach can be a useful instrument to evaluate the behaviour of the system. Han et al. [38] exploited a co-simulation model in Matlab/Simulink and Adams to test the control algorithm of an agricultural robot in different road conditions. Wang et al. [39] designed a co-simulation model for testing a 4-axis pipeline welding robot for automatic welding operations in oil and gas transportation pipelines, obtaining satisfactory results for the further development of a physical prototype. Su et al. [40] evaluated the steering control strategy of an articulated rock-drilling robot in different working conditions using a co-simulation model, developed using Adams and Matlab/Simulink.
As it can be stated, the adoption of co-simulation models is a widely used technique thanks to its reliability and the opportunity to consider a wide range of scenarios. Indeed, in most cases, these models are used to test control algorithms and/or the interaction of the vehicle with the environment, for example focusing on the tire–soil interaction. However, to authors’ knowledge, there are no studies which aim to investigate, through co-simulation, the dynamic behaviour of an autonomous agricultural rover equipped with a 4-differential wheel-drive steering system, employed for vineyard or orchard applications. The adoption of a co-simulation model allows for investigating the effects of the rover dynamics, and its interaction with the soil, on the autonomous driving strategy. In this scenario, the proposed paper focuses on a 4-wheel drive (4WD) agricultural rover, equipped with a differential steering system, designed for operations in orchards. With respect to the literature, in the proposed analysis the adoption of a co-simulation model allows for testing the path planning and path following algorithms presented in [41], taking into account the effects of the dynamic behaviour of a real rover with the aim of verifying the applicability of the motion strategy within a very close to reality scenario. The co-simulation analysis focused on the path following strategy, the electric motor controls and the power requirements. The multibody model was developed using Hexagon Adams 2024, while the control algorithms, including the autonomous driving strategy, were developed in the Matlab/Simulink R2021b environment. For the simulations, a virtual environment considering the rows of an orchard was implemented. Analysing the results, the effectiveness of the proposed algorithms and of the rover’s mechanical design was evaluated.
It should be highlighted that the main purpose of the proposed study was to provide a co-simulation methodology that might be useful for researchers involved in the development of autonomous rovers, and to apply it to a case study of a rover designed for operations in vineyards. The proposed methodology was developed to focus on the evaluation of the autonomous driving algorithm, the rover dynamics and their interaction. Consequently, there are several elements that are undoubtedly relevant in these systems but are not included in the proposed methodology as they are not within its scope. These elements included reliability analysis of sensors and electric equipment, cost and environmental analysis, safety and regulatory issues, durability analysis, social impact, and so on.
The paper is organized as follows: the Material and Methods section describes the rover architecture, the path planning and path following algorithms, the multibody model, and the virtual test scenario; the Results and Discussion section shows and deeply analyses the simulation results; and finally, the Conclusion section summarizes the main outcomes of the paper.
2. Materials and Methods
In this section, the mechanical design of the agricultural rover under investigation is presented. Next, the path planning and path following algorithms are briefly described, and the multibody model developed in Adams 2024 is presented. Finally, the virtual test scenario is presented, along with a detailed description of the simulation parameters and conditions.
2.1. Case Study
The vehicle under investigation is an autonomous 4-wheel differential drive agricultural rover designed to perform a wide variety of tasks in orchards and vineyards, ranging from load transportation to the use of sprayers or other electric implements. In detail, the case study is an existing prototype, named Smilla H2, developed by the Italian company Ecothea Srl and presented at EIMA 2024 in Bologna (Italy) [42].
The rover is powered by four electric motors, one for each wheel, and adopts torque vectoring steering to perform curves since it is not equipped with a physical steering system which allows the wheels to turn around the axis perpendicular to their contact plane. Each motor can provide 5 Nm of continuous torque, and up to 15 Nm of peak torque. The main properties of the vehicle are summarized in Table 1.

Table 1.
Rover main properties; the EM properties refer to the performance of a single power unit.
The electric motors are mechanically linked to the wheels using a right-angle planetary gear reducer with a transmission ratio of 12:1. This solution was adopted considering compactness and transmission efficiency. A schematic representation of the rover powertrain architecture is shown in Figure 1. The vehicle weighs approximately 400 kg and is equipped with wheels having a radius equal to 0.2 m.
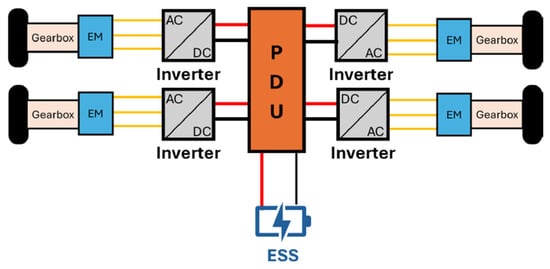
Figure 1.
Schematic representation of the rover powertrain architecture.
2.2. Autonomous Driving Strategy
The main features of the autonomous driving algorithm, implemented within the co-simulation model, are described in this subsection. The employed algorithm was specifically developed for an autonomous driving rover operating in vineyards/orchards by the same authors of this study. The comprehensive description of the autonomous driving strategy is available in the literature [41,43]. The autonomous driving algorithm was essentially articulated in three main steps:
- Path planning.
- Path following.
- Kinematic model.
The working principle of the algorithm is shown in Figure 2.
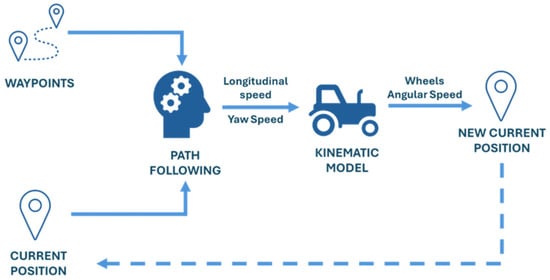
Figure 2.
Autonomous driving strategy working principle.
The path planning phase aimed at defining the ideal trajectory that the vehicle should follow in order to accomplish its mission. The implemented motion planning strategy was based on a Dubins geometrical planner [44,45]. According to this theory, it is possible to determine the ideal trajectory combining segments and circular arcs, given a start and arrival point and their relative orientation within the map. The optimal path is generated under the form of a sequence of points, known as waypoints. The reason behind this choice relies on the high repeatability of the manoeuvres that the rover executes while travelling within a vineyard or orchard. The generation of the trajectory needs some input arguments related to the geometrical characteristics of the rover, presented in Table 1, and the spacing among each waypoint, namely the waypoint pitch distribution (WPP).
The path following phase consists of the strategy carried out by the rover in order to follow the aforementioned optimal path. The aim is to define the reference longitudinal and yaw speeds through which the vehicle can reach the final arrival point. This stage is essentially made up of two phases:
- Local goal point (LGP) identification.
- Determination of longitudinal and yaw speeds.
The first one occurs through a strategy inspired on pure-pursuit controller [46,47]. The definition of LGP is given by the intersection between the optimal path and the circumference centred on the rover centre of mass whose radius is equal to lookahead distance value (LD). A waypoint is considered reached when the distance between it and the rover is below a certain value, known as distance threshold Dth. The identification of LGP allows the vehicle to determine the yaw angle , necessary to reach it. It consists of the difference between the current vehicle orientation and the direction given by the line linking the rover centre of mass and LGP. At this point, given a cycle time t, the motion strategy calculates the yaw and longitudinal speed reference values:
where
- and v represent the yaw and longitudinal speeds, respectively.
- t represents the cycle time used to determine the vehicle speeds.
- vt corresponds to the max reference working speed of the rover.
- is the maximum steering angle compatible with the steering system of the rover; in this case it corresponds to 360° since the differential wheel drive system allows the execution of a pivot manoeuvre.
The kinematic model represents the last step of the autonomous driving strategy. It represents the link between the reference values of rover speed and direction and the way through which the vehicle is able to reach that specific condition. In this case, the aim is to determine the rotational speeds of left and right tires since the vehicle is equipped with a differential drive steering system [48], hence the wheels are not able to steer as traditional agricultural tractors. The vehicle steering is possible only by differentiating the rotational speeds between left and right wheels:
where
- ωl and ωr represent the rotational speed of left and right tires, respectively.
- v is the reference longitudinal speed, obtainable using Equation (2).
- is the reference yaw speed, obtainable using Equation (1).
- r is the tire radius.
- l corresponds to the halftrack of the rover.
The rotational speeds, determined from the equations system 3, corresponds to one of the main input arguments of the control strategy described in the next section. It should be noted that, according to the proposed model, the calculated reference speeds for wheels on the same side are equal. Thus, the reference speeds for the front and rear right wheels are the same, and so are those for the front and rear left wheels.
2.3. Multibody Model
The multibody model had to properly simulate the dynamic behaviour of the rover. From a numerical point of view, the vehicle was modelled as a series of rigid bodies, characterized by specific geometrical and inertial properties, linked to each other with different joints, depending on the configuration, that limit their degrees of freedom.
The model was developed, according to the features shown in Table 1, considering two main elements, namely the body and the wheels, as shown in Figure 3.
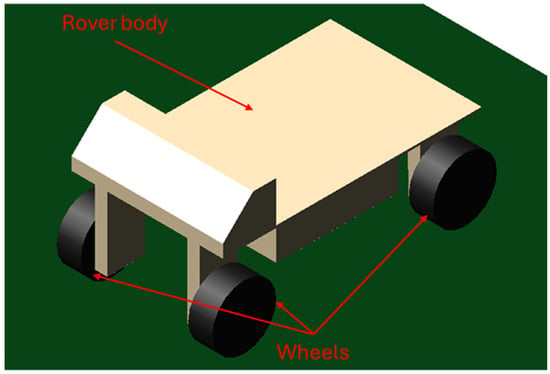
Figure 3.
Virtual prototype, used for co-simulation model, composed by the rover body (in beige) and the four wheels (in black).
The body comprises all the elements related to the powertrain and the chassis and was modelled combining different geometric solids to replicate the geometry of the real system. As for the wheels, they were modelled as simple cylinders. The wheels and the vehicle body were linked using revolute joints. A torque element was applied at the wheels to consider the torque coming from the electric motors. In the multibody model, the element torque was applied directly at the wheels, thus the torque is downstream of the gearboxes. No other joints were required since the vehicle was not equipped with a physical steering system. The inertial properties of the rover body and of a single wheel are shown in Table 2.

Table 2.
Rover inertial barycentric properties.
To properly account for the interaction between tire and ground, contact forces were introduced. These forces should consider the deformability of the ground, and were thus defined according to the following equation [49]:
where k and c represented the contact stiffness and damping, p the interpenetration between the ground and the wheel, and e an empirical exponent accounting for the non-linearity of the system. In Table 3, the values used to model the contact force are resumed. The adopted values were estimated considering data available in the literature. Indeed, the stiffness k is influenced by several factors, including inflating pressure, speed, and so on [50,51]. The authors adopted a value of 3 × 10⁵ N/m, which is coherent with typical values obtained through compression tests on agricultural tires [52]. As for the damping coefficient, it was determined in [53] that an agricultural tire with a 16″ (0.406 m) radius had a damping coefficient of 700 Ns/m at a pressure of 2.2 bar. Furthermore, it is known that the damping coefficient decreases when the tire size decreases. Thus, since the rover tires had a radius of 8″ (0.203 m) and a pressure of 2.2 bar, it was possible to determine that the damping coefficient was highly likely to be less than 700 Ns/m. The authors opted for performing simulations considering different values of c, namely 0, 100, 300, and 500 Ns/m. It was noted that this parameter did not particularly affect the results of the simulation in terms of trajectory, torques and speeds, since during the tests no bumps were introduced.

Table 3.
Contact force parameters.
Furthermore, the tire–ground interaction was also modelled including friction coefficients to account for the capability of developing traction force. Indeed, three coefficients were used to model this aspect, namely, the static friction, kinetic friction and rolling resistance coefficients. The first describes, according to Coulomb friction model [54], the maximum torque at which the tire begins to slip, while the second determines the amount of torque the tire is capable of transmitting once it begins to slip, according to the following equation [24]:
where and are, respectively, the traction and normal forces on the i-wheel, is the torque at the i-wheel, is the wheel radius, and and are, respectively, the static and kinetic friction coefficients. Sandy loam was considered as soil; therefore, its static and kinetic friction coefficients were set to 0.45 and 0.5, respectively [55]. Lastly, the rolling coefficient accounts for tire and ground deformation in the contact that generates a resistant torque that opposes the longitudinal motion. In the multibody model, this last aspect was implemented introducing an opposing force to the longitudinal motion that was evaluated according to the following equation:
where is the rover total mass (including tires), g is the gravity acceleration, is the rolling resistance (value assumed 0.1 [56]) coefficient, and α is the road slope.
2.4. Simulink Co-Simulation
Co-simulation is a simulation approach in which two or more simulation environments or models are executed simultaneously by exchanging data using synchronization points. In the proposed research, the co-simulation consisted of a multibody model developed in Hexagon Adams 2024, and of a Matlab/Simulink R2021b model. The first had to simulate the dynamic behaviour of the rover and its interaction with the soil, while the second had to simulate the rover control strategy according to the proposed autonomous driving algorithm. After the Adams multibody model was established, the Simulink interface was defined for the co-simulation. The co-simulation structure is schematically represented in Figure 4. As can be stated, the path planning process was performed offline with respect to the co-simulation, since its purpose was to define the trajectory waypoints according to the orchard configuration. Consequently, the co-simulation mainly considered the path following and the rover dynamics.
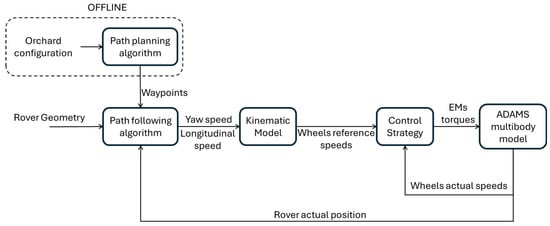
Figure 4.
Co-simulation model architecture.
The co-simulation model was developed as a block structure with the aim to reach a high level of parametrization. In this way, the approach proposed in this work can be easily reused to develop control strategies for other kinds of vehicles independently of their application, powertrain or steering system. The co-simulation model is structured in four main parts:
- Path following.
- Kinematic model.
- Control strategy.
- Adams multibody model.
The path following represents the first step of the co-simulation process. The aim of this stage is to provide the reference value of longitudinal and yaw speeds, according to the autonomous driving strategy described in the previous section. It needs some input arguments in order to properly perform, which are related to the ideal path (waypoints) and to the main features of the rover in terms of geometry and eligible speeds. The outputs of this stage represent the input arguments of the kinematic model block. It calculates the reference rotational speeds for left and right tires according to the Equation (3).
The control strategy block is the third element of the co-simulation model, whose aim is to define the torque values that must be applied on each wheel in order to follow the optimal trajectory. The authors wanted to specify that the algorithm evaluates the electric motor torques, which are then multiplied for the transmission ratios of the gearboxes and are finally applied in the multibody model. Thus, the algorithm defines the motor torques, while the multibody model receives as input the torques at the wheels downstream of the transmission. The torque is determined through a PI controller [57] on the basis of the difference between the reference and actual rotational speeds of each wheel. The authors opted for neglecting the derivative terms as they deemed that a proportional-integral controller was sufficient. Indeed, if not properly calibrated, the derivative terms can lead to instability phenomena in the controller. The torque, applied to each wheel, is determined by using the following formulation:
where
- KP and Ki are, respectively, the proportional and integral coefficients of the PI controller.
- T is the torque of the specific wheel considered (left or right, front or rear).
- ωref is the reference rotational speed of the specific wheel considered (determined by the kinematic model as observable in Equation (3).
- ωreal is the real rotational speed of the specific wheel considered (left or right, front or rear).
- t represents the cycle time.
The PI controller was chosen because it allows emulation of the real scenario of torque application because is determined by the vehicle control unit and is provided by the encoder equipped on each electric motor. Furthermore, PI controllers are flexible, robust, and easy to implement. Expressing the wheel rotational speeds in radians per second, after a calibration procedure, the optimal values of the proportional and integral coefficients of the PI controller were found to be 6.97 and 5.44, respectively. The authors opted for neglecting the derivative term as it was deemed unnecessary since the PI controller allows the setpoint value to be reached thanks to the integrative term. Then, the torque value obtained from the PI controller is processed through a saturation block to limit its upper and lower values. In particular, the limit corresponds to the maximum torque providable by the electric motor multiplied by the torque ratio of the gearbox. The last structural element of the co-simulation model is represented by the multibody model. It consists of the virtual prototype described in the previous section. The output arguments of the block are as follows:
- Actual wheel speeds.
- Rover speed.
- Rover position.
- Rover orientation within the map.
When the vehicle successfully reached the reference waypoint, the next one was taken as the new reference. A waypoint was considered reached when the distance between it and the rover was below a certain pre-defined threshold value. The co-simulation model developed in Simulink is shown in Figure 5.
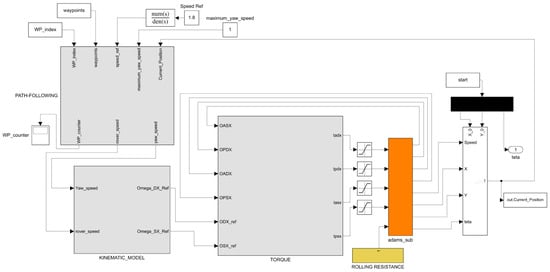
Figure 5.
Co-simulation model developed in Matlab/Simulink R2021b.
2.5. Virtual Test Scenario
To test the autonomous driving algorithm and the rover dynamics, a virtual test scenario consisting of a typical orchard configuration was considered. According to this, the authors defined a bidimensional map with fruit rows. Since the purpose of the study was to investigate the rover behaviour in some specific situations of interest, the attention focused on two specific cases. The first was when the rover approached the end of a row and had to perform a 180-degree curve to enter the next one. In particular, the path was composed by two straights of ten meters each, linked between them by a hairpin turn. The hairpin presents two rope points. Their abscissa coordinates were, respectively, positioned at one-fourth and three-fourths of the distance between the straights, whereas their ordinate coordinate was set at 2.5 m above the end of the cultivation row.
To take into account different cultivations, three different row distances were considered, namely 10, 5 and 3 m. Indeed, according to [58], a row spacing less than 3 m can be adopted, but it poses relevant challenges as agricultural machineries might have difficulties in passing among narrow rows. A representation of the proposed manoeuvre with different row spacing is shown in Figure 6. For the test, the rover target speed was set equal to 6.5 km/h, which is coherent with the typical vehicle speeds for field operations in orchards.
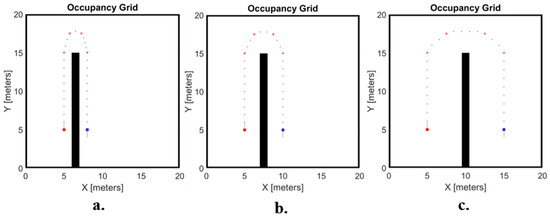
Figure 6.
Representation of the proposed manoeuvres: (a) row distance = 3 m, (b) row distance = 5 m, and (c) row distance = 10 m; the red stars represent the points used by the path planning strategy to generate the ideal trajectory, whereas the red and purple squares indicate the starting and goal position of the rover mission.
The second case is instead related to the avoidance of an obstacle in the row, placed nearer to the left row. In particular, the obstacle presents a square shape (side equal to 2 m) and its centre is positioned 1.5 m far from the left row. Indeed, these autonomous vehicles might have, if possible, to circumvent small objects or hurdles. Thus, in this case the rover had to follow a trajectory in which, when approaching the obstacle, it had to perform a gentle curve to avoid the obstacle without exceeding the row width. The authors adopted the “Follow the Gap Method” proposed by Sezer et al. in [59]. This method is based on the construction of a gap array around the vehicle, and then, the largest one is selected. An improved version of this algorithm was described in [60] to overcome its main limitations and drawbacks. Considering this method and the proposed scenario, the expected trajectory is shown in Figure 7. In accordance with the other test scenario, the rover target speed was also set equal to 6.5 km/h. Furthermore, in all the performed tests, the road slope was set equal to 0.
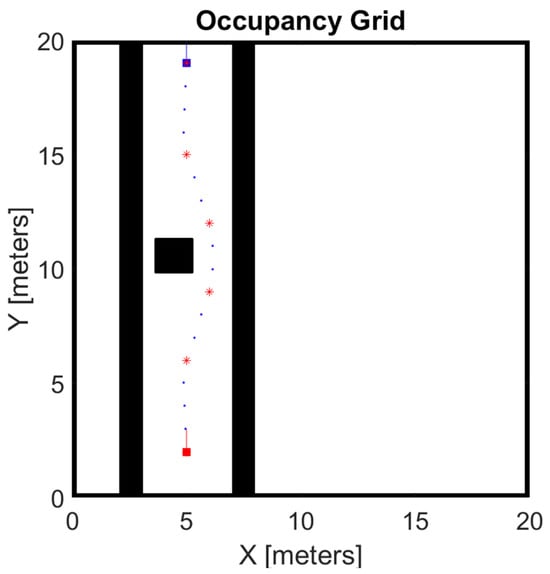
Figure 7.
Trajectory for the obstacle avoidance test; the red stars represent the points used by the path planning strategy to generate the ideal trajectory, whereas the red and purple squares indicate the starting and goal position of the rover mission.
3. Results and Discussion
In the following subsection, the results of the co-simulation tests are presented. Starting from the test regarding the 180° turn at the end of the orchard row, the results in terms of ideal trajectory and actual trajectory are shown in Figure 8. It can be stated that the rover successfully performed the manoeuvre in all the three cases. As expected, when the distance between the rows was lower, the actual trajectory deviated more from the ideal one; however, the autonomous driving algorithm and the rover features were able to handle this issue and allowed for completing the manoeuvre.
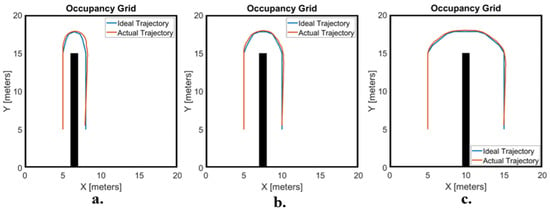
Figure 8.
Results of the 180° turn test in terms of actual and ideal trajectories (c = 0.3 Ns/mm); (a) row distance = 3 m, (b) row distance = 5 m, and (c) row distance = 10 m.
As for the rover wheel speeds and motor torques, the results are shown in Figure 9 (c equal to 300 Ns/m). Analysing the results, it can be noted that performing the 180° turn at the predefined rover speed, namely 1.8 m/s, generally requires the overload of the motors, both in traction and in braking. Indeed, the highest torque was found to be equal to approximately 10 Nm, which corresponds to a 2× overload factor. Nevertheless, the proposed commercial motors can provide that torque since they have a peak torque of 15 Nm in S3–20%.
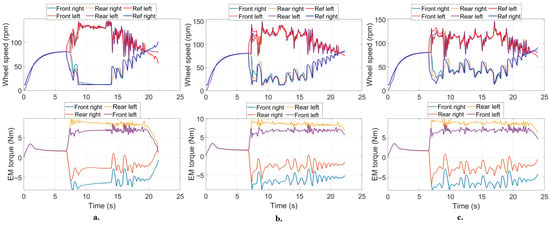
Figure 9.
Wheel speeds and EMs torques during the 180° turn test (c = 300 Ns/m): (a) row distance = 3 m, (b) row distance = 5 m, and (c) row distance = 10 m.
As for the obstacle avoidance test, the results in terms of ideal and actual trajectories are shown in Figure 10 (c equal to 300 Ns/m). Also, in this case, it can be stated that the rover managed to avoid the obstacle without exceeding the limits imposed by the orchard rows. The results in terms of wheel speeds and motor torques are shown in Figure 11. Also, in this case, to perform the manoeuvre the electric motors were overloaded. Indeed, the maximum motor torque reached 10 Nm.
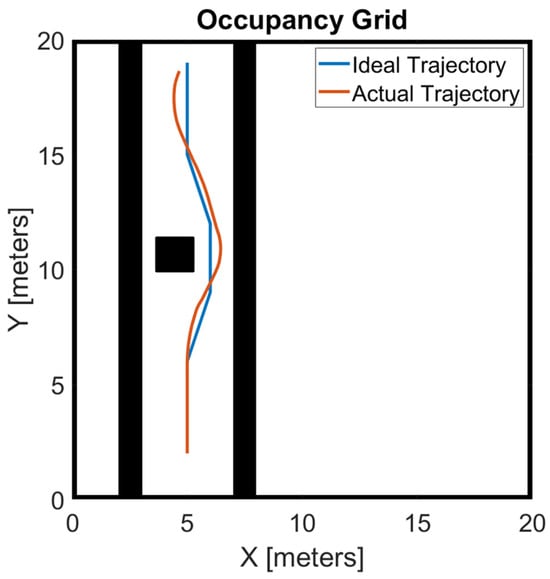
Figure 10.
Results of the obstacle avoidance test (c = 300 Ns/m).
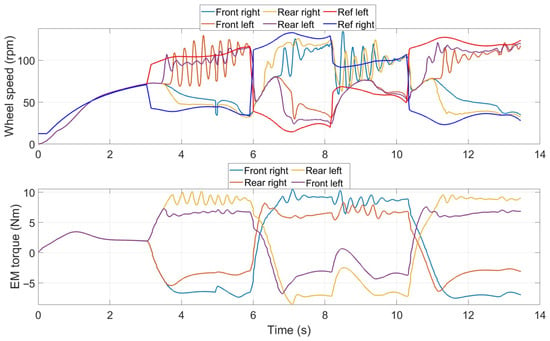
Figure 11.
Wheel speeds and EMs torques during the obstacle avoidance test (c = 300 Ns/m).
The tests results showed that the proposed autonomous driving algorithm and rover powertrain were capable of accomplishing the considered task. To evaluate the capability of the system to follow the ideal planned trajectory, the maximum distance between it and the actual trajectory for each manoeuvre was evaluated. The results are shown in Table 4.

Table 4.
Maximum trajectory deviations.
In terms of power requirements, when proceeding in a straight line at 1.8 m/s, the torque required to the motors was about 2 Nm per motor, which corresponds to an overall traction power at the wheels equal to 700 W. Instead, when performing the manoeuvres, the overall traction power was higher and reached a peak, considering all the tests, equal to about 2300 W.
As for the rover behaviour during the manoeuvres, it should be noted that when the vehicle was steering using the torque vectoring, wheels began to slip. This behaviour can be highlighted during both tests, as the speed of some wheels started oscillating during the manoeuvre. A clear representation of this issue can be seen in Figure 12 at time = 3.5–6 s and 8–10 s. The slip occurred as the wheels exceeded the capability of transmitting torque to the ground and started slipping. According to the authors’ opinion, this behaviour can be related to the absence of a physical steering system. To overcome this limit, an algorithm that limits the torque during slipping should be developed and implemented, along with the adoption of better performance tires. Nevertheless, since this rover was designed for operating in orchards, it is expected that for most of the time it proceeds in a straight line and only occasionally performs a turn or an obstacle avoidance manoeuvre, thus the slip should not particularly affect the overall efficiency during a common work scenario. However, to analyse the possible improvements deriving from the implementation of a traction control strategy, in Section 3.2 a simple torque limiting strategy is presented and implemented in the co-simulation model.
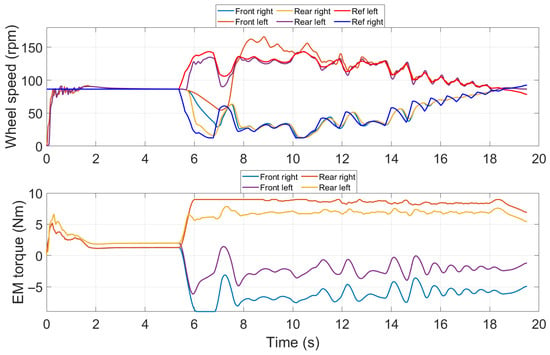
Figure 12.
Wheel speeds and Ems torques during 180° turn test (row distance = 5 m) when the traction control is implemented within the model.
3.1. Sensitivity Analysis
The results obtained and discussed in the previous section were carried out performing simulations in certain operative conditions. However, the rover may have to accomplish tasks in a wide variety of scenarios. As a consequence, other simulations were carried out considering different terrains, road slopes, and rover payload.
Starting from different soil conditions, from a numerical point of view the main parameters that changed from one terrain to another were the rolling resistance coefficient, the static and dynamic friction coefficients, and the contact force parameters. The rolling resistance and the friction coefficients had a significant impact on the simulation results as they directly affected the power required for traction and the tires slipping. In the previous section, a loam soil, which is typical in agricultural scenarios, was considered. To expand the analysis, further simulations were performed considering the 180° turn manoeuvre with row distance of 5 m with the following soil conditions: sandy soil, muddy road, and hard soil. The coefficients adopted for the considered soils were derived from data available in the literature [61,62,63,64]. The results, compared with the loam soil reference case, are exposed in Table 5. As can be stated, in the case of sandy and muddy soils, the rover was not able to perform the manoeuvre. On the contrary, in the case of hard soil, which is less critical than loam soil, a significant reduction in both the power required for traction and the trajectory deviation was noted.

Table 5.
Co-simulation results obtained for the 180° turn manoeuvre with row distance of 5 m for different soil conditions.
As for the rover payload, other simulations considering the same manoeuvre on loam soil but with different payloads were carried out. Indeed, load transportation is a task that the rover under investigation may have to perform and thus determining its capabilities is certainly of interest. To address this, an additional mass was added in the multibody model on the rover chassis. The simulations were performed considering payloads of 50, 100 and 200 kg. The results, compared to the 0 kg payload case, are shown in Table 6. As expected, for heavier payloads the mean and peak powers were significantly higher. In the case of 200 kg of payload, the peak EM torque reached a 2.5 overload factor. However, no relevant differences were noted in the trajectory deviation, which was substantially the same among the four cases.

Table 6.
Co-simulation results obtained for the 180° turn manoeuvre with row distance of 5 m with different payloads.
Lastly, the rover performance in different road slope scenarios was investigated. In this case, the main goal of the simulations was to determine the maximum approachable slope with a standing start. Thus, in this case, the analysis considered a straight trajectory with an inclined road. Indeed, when moving to or from the field, or within orchard rows, the rover may have to face high slopes due to the hill conformation. The simulations considered the four different soils already used for the previous test of the 180° manoeuvre on different terrains. The results are shown in Table 7. Analysing the results, it can be stated that the rover performance strongly depends on the terrain. In particular, the rover showed good results in the loam soil, which is the terrain for which it is designed. On the contrary, in the case of other soils, especially muddy terrain, the performance decreased significantly.

Table 7.
Co-simulation results for the overcoming the slope test with different terrains; the value reported in the second column represents the maximum road slope approachable by the rover for the type of soil considered.
3.2. Traction Control Implementation
Since the simulation results highlighted that tire slip can occur when performing turns, a simple traction control was developed and implemented in the model to quantify the potential benefits deriving from a more efficient management of the EMs torques [65,66]. The traction control strategy was developed so that, given the maximum allowable tire slip, the torques were limited to the maximum transmittable value, which was related to the static friction coefficient, when the slip exceeded the pre-defined threshold value. Thus, the following equations were adopted:
where s is the tire slip, v is the rover speed, rwheel the wheel radius, Fnorm the normal force, mtot the total mass, g the acceleration of gravity (equal to 9.81 m/s2), µstatic the static friction coefficient, Tcalc the torque evaluated by the algorithm upstream of the traction control, and slim the maximum allowed tire slip. The subscript i means that the parameter is related to the i-wheel. A simulation was performed considering the 180° turn manoeuvre with a row distance of 5 m. The obtained results in terms of torque provided by the electric motors and the subsequent rotational speed of the wheels are reported in Figure 12. Comparing the results with the case without traction control, shown in Figure 9b, a reduction in the wheel speeds and in the EMs torque oscillations can be noted.
In particular, focusing on the oscillation amplitude, which is directly linked to wheel slip phenomena, the introduction of traction control allows a reduction in oscillation amplitude of 40% for the front wheels, and of 25% for the rear wheels. This, in turn, causes a reduction of torque amplitude of 25% for the front wheels and of 50% for the rear wheels.
4. Conclusions
The proposed paper investigated the adoption of an agricultural rover designed to operate in orchards and vineyards through a co-simulation model. The study covered both the autonomous driving control system, including path planning and path following algorithms, and the rover dynamics. Given the orchard configuration and the task to be accomplished, the path planning was used to define the ideal trajectory, while the path following algorithm had to evaluate the reference wheel speeds to follow that trajectory. The path planning algorithm was run offline using a Matlab script, whose outputs were the trajectory waypoints. The path following algorithm was implemented in Matlab/Simulink R2021b and, given the waypoints defined in the path planning stage and the rover position, evaluated the reference wheel speeds. A PI controller was introduced to determine the torque to be applied at the wheels according to the difference between their actual speeds and the reference speeds defined by the path following algorithm. To evaluate the dynamic behaviour of the rover, a multibody model, consisting of the rover body and wheels, was developed in Adams 2024. To test the rover behaviour, two manoeuvres were considered, namely a 180° turn, typically performed at the end of the orchard rows, and an obstacle avoidance. The tests results showed that the vehicle successfully accomplished the considered tasks. Analysing the results, two main elements can be highlighted:
- During the manoeuvres, the electric motors were overloaded with a maximum 2× factor.
- When turning using the torque vectoring technique, wheels began to slip.
- The maximum trajectory deviation during the considered manoeuvres was equal to 0.58 m, observed during the obstacle avoidance test.
Concerning the overload issue, the adopted motors can operate up to a 3× overload factor in S3–20%; thus, they can provide that torque for the time required to complete the manoeuvre. As for the wheel slipping, the authors deemed that since this rover was designed to operate in orchards, it is expected to move along a straight line for most of the time, and this behaviour does not particularly affect overall work efficiency. To consider different work conditions, additional tests, including different terrains, payloads and road slopes, were performed. The results showed that the rover was able to accomplish the task with payloads up to 200 kg on loam soil (with a 2.5× overload factor), but, on the contrary, failed in the case of difficult terrains, such as sandy or muddy soils. In conclusion, the proposed algorithm and rover configuration are a feasible solution to improve the efficiency and sustainability of the agricultural sector, but the operative conditions, in particular those related to the field soil, must be checked. Furthermore, a simple traction control algorithm was implemented to limit tire slip, showing benefits in terms of reduction of speeds and torque oscillations. Future works will focus on the powertrain components, such as the energy storage system, and on the environmental impact reduction of orchard practices by implementing the proposed rover for low-power field tasks. In detail, a lifecycle assessment of the rover and its impact on the overall emissions emitted by a farm might be the subject of future research activities. Finally, a real-world experimental analysis on the full-scale prototype will be performed to evaluate the reliability of the proposed methodology.
Author Contributions
Conceptualization, S.M.; methodology, S.M. and V.M.; software, S.M. and V.M.; validation, S.M., V.M. and F.M.; formal analysis, S.M. and V.M.; investigation, S.M. and V.M.; resources, S.M. and V.M.; data curation, S.M. and V.M.; writing—original draft preparation, S.M. and V.M.; writing—review and editing, S.M., V.M., F.M. and A.S.; visualization, S.M., V.M., F.M. and A.S.; supervision, S.M., V.M., F.M. and A.S.; project administration, S.M., F.M. and A.S.; funding acquisition, F.M. and A.S. All authors have read and agreed to the published version of the manuscript.
Funding
This research received no external funding.
Data Availability Statement
The original contributions presented in the study are included in the article, further inquiries can be directed to the corresponding author.
Conflicts of Interest
The authors declare no conflicts of interest.
Abbreviations
The following abbreviations are used in this manuscript:
| 4WD | 4-wheel drive |
| WPP | Waypoint pitch distribution |
| LGP | Local goal point |
| LD | Lookahead distance |
| PI | Proportional integral |
References
- Food and Agriculture Organization. World Food and Agriculture—Statistical Yearbook 2023; FAO: Rome, Italy, 2023; ISBN 978-92-5-138262-2. [Google Scholar]
- Prosekov, A.Y.; Ivanova, S.A. Food Security: The Challenge of the Present. Geoforum 2018, 91, 73–77. [Google Scholar] [CrossRef]
- Ravankar, A.; Ravankar, A.A.; Rawankar, A.; Hoshino, Y. Autonomous and Safe Navigation of Mobile Robots in Vineyard with Smooth Collision Avoidance. Agriculture 2021, 11, 954. [Google Scholar] [CrossRef]
- Martelli, S.; Mocera, F.; Somà, A. New Challenges Towards Electrification Sustainability: Environmental Impact Assessment Comparison Between ICE and Hybrid-Electric Orchard Tractor. In Proceedings of the 2023 JSAE/SAE Powertrains, Energy and Lubricants International Meeting, Kyoto, Japan, 29 August–1 September 2023. [Google Scholar]
- Arruda, E.H.; Melatto, R.A.P.B.; Levy, W.; de Melo Conti, D. Circular Economy: A Brief Literature Review (2015–2020). Sustain. Oper. Comput. 2021, 2, 79–86. [Google Scholar] [CrossRef]
- Loiseau, E.; Saikku, L.; Antikainen, R.; Droste, N.; Hansjürgens, B.; Pitkänen, K.; Leskinen, P.; Kuikman, P.; Thomsen, M. Green Economy and Related Concepts: An Overview. J. Clean. Prod. 2016, 139, 361–371. [Google Scholar] [CrossRef]
- O’Regan, A.C.; Nyhan, M.M. Towards Sustainable and Net-Zero Cities: A Review of Environmental Modelling and Monitoring Tools for Optimizing Emissions Reduction Strategies for Improved Air Quality in Urban Areas. Environ. Res. 2023, 231, 116242. [Google Scholar] [CrossRef]
- Wollenberg, E.; Richards, M.; Smith, P.; Havlík, P.; Obersteiner, M.; Tubiello, F.N.; Herold, M.; Gerber, P.; Carter, S.; Reisinger, A.; et al. Reducing Emissions from Agriculture to Meet the 2 °C Target. Glob. Change Biol. 2016, 22, 3859–3864. [Google Scholar] [CrossRef]
- Gołasa, P.; Wysokiński, M.; Bieńkowska-gołasa, W.; Gradziuk, P.; Golonko, M.; Gradziuk, B.; Siedlecka, A.; Gromada, A. Sources of Greenhouse Gas Emissions in Agriculture, with Particular Emphasis on Emissions from Energy Used. Energies 2021, 14, 3784. [Google Scholar] [CrossRef]
- Martini, V.; Mocera, F.; Somà, A. Numerical Investigation of a Fuel Cell-Powered Agricultural Tractor. Energies 2022, 15, 8818. [Google Scholar] [CrossRef]
- Perera, F. Pollution from Fossil-Fuel Combustion Is the Leading Environmental Threat to Global Pediatric Health and Equity: Solutions Exist. Int. J. Environ. Res. Public Health 2018, 15, 16. [Google Scholar] [CrossRef]
- Anenberg, S.C.; Achakulwisut, P.; Brauer, M.; Moran, D.; Apte, J.S.; Henze, D.K. Particulate Matter-Attributable Mortality and Relationships with Carbon Dioxide in 250 Urban Areas Worldwide. Sci. Rep. 2019, 9, 11552. [Google Scholar] [CrossRef]
- Eom, J.; Hyun, M.; Lee, J.; Lee, H. Increase in Household Energy Consumption Due to Ambient Air Pollution. Nat. Energy 2020, 5, 976–984. [Google Scholar] [CrossRef]
- Dai, C.; Qin, X.S.; Zhang, X.L.; Liu, B.J. Study of Climate Change Impact on Hydro-Climatic Extremes in the Hanjiang River Basin, China, Using CORDEX-EAS Data. Weather Clim. Extrem. 2022, 38, 100509. [Google Scholar] [CrossRef]
- Taghizadeh-Hesary, F.; Taghizadeh-Hesary, F. The Impacts of Air Pollution on Health and Economy in Southeast Asia. Energies 2020, 13, 1812. [Google Scholar] [CrossRef]
- Bacenetti, J.; Lovarelli, D.; Facchinetti, D.; Pessina, D. An Environmental Comparison of Techniques to Reduce Pollutants Emissions Related to Agricultural Tractors. Biosyst. Eng. 2018, 171, 30–40. [Google Scholar] [CrossRef]
- Ettl, J.; Bernhardt, H.; Huber, G.; Thuneke, K.; Remmele, E.; Emberger, P. Evaluation of Pure Rapeseed Oil as a Renewable Fuel for Agricultural Machinery Based on Emission Characteristics and Long-Term Operation Behaviour of a Fleet of 18 Tractors. SN Appl. Sci. 2020, 2, 1711. [Google Scholar] [CrossRef]
- Owczuk, M.; Matuszewska, A.; Kruczyński, S.; Kamela, W. Evaluation of Using Biogas to Supply the Dual Fuel Diesel Engine of an Agricultural Tractor. Energies 2019, 12, 1071. [Google Scholar] [CrossRef]
- Venkatesan, V.; Nallusamy, N. Pine Oil-Soapnut Oil Methyl Ester Blends: A Hybrid Biofuel Approach to Completely Eliminate the Use of Diesel in a Twin Cylinder off-Road Tractor Diesel Engine. Fuel 2020, 262, 116500. [Google Scholar] [CrossRef]
- Mocera, F.; Martini, V.; Somà, A. Comparative Analysis of Hybrid Electric Architectures for Specialized Agricultural Tractors. Energies 2022, 15, 1944. [Google Scholar] [CrossRef]
- Martelli, S.; Martini, V.; Mocera, F.; Soma’, A. Life Cycle Assessment Comparison of Orchard Tractors Powered by Diesel and Hydrogen Fuel Cell. Energies 2024, 17, 4599. [Google Scholar] [CrossRef]
- Pascuzzi, S.; Łyp-Wrońska, K.; Gdowska, K.; Paciolla, F. Sustainability Evaluation of Hybrid Agriculture-Tractor Powertrains. Sustainability 2024, 16, 1184. [Google Scholar] [CrossRef]
- Mendecka, B.M.; Tribioli, L.; Lombardi, S.; Federici, L.; Bella, G. Environmental Impacts of a Low-Profile Full Electric Specialized Tractor: A Case Study on Different Battery Pack Configurations. In Proceedings of the Energy & Propulsion Conference & Exhibition, Columbus, OH, USA, 12–14 November 2024; SAE Technical Papers. SAE International: Warrendale, PA, USA, 2024. [Google Scholar]
- Martini, V.; Mocera, F.; Somà, A. Carbon Footprint Enhancement of an Agricultural Telehandler through the Application of a Fuel Cell Powertrain. World Electr. Veh. J. 2024, 15, 91. [Google Scholar] [CrossRef]
- Martini, V.; Mocera, F.; Somà, A. Design and Experimental Validation of a Scaled Test Bench for the Emulation of a Hybrid Fuel Cell Powertrain for Agricultural Tractors. Appl. Sci. 2023, 13, 8582. [Google Scholar] [CrossRef]
- Roshanianfard, A.; Noguchi, N.; Okamoto, H.; Ishii, K. A Review of Autonomous Agricultural Vehicles (The Experience of Hokkaido University). J. Terramechanics 2020, 91, 155–183. [Google Scholar] [CrossRef]
- Spagnuolo, M.; Todde, G.; Caria, M.; Furnitto, N.; Schillaci, G.; Failla, S. Agricultural Robotics: A Technical Review Addressing Challenges in Sustainable Crop Production. Robotics 2025, 14, 9. [Google Scholar] [CrossRef]
- Bazargani, K.; Deemyad, T. Automation’s Impact on Agriculture: Opportunities, Challenges, and Economic Effects. Robotics 2024, 13, 33. [Google Scholar] [CrossRef]
- Liu, L.; Yang, F.; Liu, X.; Du, Y.; Li, X.; Li, G.; Chen, D.; Zhu, Z.; Song, Z. A Review of the Current Status and Common Key Technologies for Agricultural Field Robots. Comput. Electron. Agric. 2024, 227, 109630. [Google Scholar] [CrossRef]
- Karunathilake, E.M.B.M.; Le, A.T.; Heo, S.; Chung, Y.S.; Mansoor, S. The Path to Smart Farming: Innovations and Opportunities in Precision Agriculture. Agriculture 2023, 13, 1593. [Google Scholar] [CrossRef]
- Oliveira, L.F.P.; Moreira, A.P.; Silva, M.F. Advances in Agriculture Robotics: A State-of-the-Art Review and Challenges Ahead. Robotics 2021, 10, 52. [Google Scholar] [CrossRef]
- Rehman, A.U.; Alamoudi, Y.; Khalid, H.M.; Morchid, A.; Muyeen, S.M.; Abdelaziz, A.Y. Smart Agriculture Technology: An Integrated Framework of Renewable Energy Resources, IoT-Based Energy Management, and Precision Robotics. Clean. Energy Syst. 2024, 9, 100132. [Google Scholar] [CrossRef]
- Reda, M.; Onsy, A.; Ghanbari, A.; Haikal, A.Y. Path Planning Algorithms in the Autonomous Driving System: A Comprehensive Review. Robot. Auton. Syst. 2024, 174, 104630. [Google Scholar] [CrossRef]
- Han, J.H.; Park, C.H.; Jang, Y.Y.; Gu, J.D.; Kim, C.Y. Performance Evaluation of an Autonomously Driven Agricultural Vehicle in an Orchard Environment. Sensors 2022, 22, 114. [Google Scholar] [CrossRef]
- Martelli, S.; Mocera, F.; Somà, A. Co-Simulation of a Specialized Tractor for Autonomous Driving in Orchards; SAE International: Warrendale, PA, USA, 2022. [Google Scholar]
- He, J.; Sun, Y.; Yang, L.; Gao, F. Model Predictive Control of a Novel Wheeled–Legged Planetary Rover for Trajectory Tracking. Sensors 2022, 22, 4164. [Google Scholar] [CrossRef]
- Wang, Q.; Wang, Z.; Yao, T. Research on Co-Simulation of Underwater Robot Based on Webots and Matlab. In Proceedings of the ICARCE 2023—2023 2nd International Conference on Automation, Robotics and Computer Engineering, Wuhan, China, 14–16 December 2023; Institute of Electrical and Electronics Engineers Inc.: New York, NY, USA, 2023. [Google Scholar]
- Han, J.B.; Yang, K.M.; Kim, D.H.; Seo, K.H. A Modeling and Simulation Based on the Multibody Dynamics for an Autonomous Agricultural Robot. In Proceedings of the 2019 7th International Conference on Control, Mechatronics and Automation (ICCMA), Delft, The Netherlands, 6–8 November 2019; IEEE: New York, NY, USA, 2019; pp. 137–143. [Google Scholar]
- Wang, X.; Xuan, H.; Zhao, S.; Ye, K.; Dai, L. Co-Simulation Research of Pipeline Welding Robot Based on MATLAB and ADAMS; Institute of Electrical and Electronics Engineers (IEEE): New York, NY, USA, 2024; pp. 162–168. [Google Scholar]
- Su, Y.; Sun, H.; Jiang, Y.; Wei, L.; Deng, S.; Sun, H.; Ren, D. A Distributed Drive Articulated Robot Control System Based on Steering Control Strategy. In Proceedings of the 2024 IEEE International Conference on Mechatronics and Automation, ICMA 2024, Tianjin, China, 4–7August 2024; Institute of Electrical and Electronics Engineers Inc.: New York, NY, USA, 2024; pp. 829–833. [Google Scholar]
- Martelli, S.; Mocera, F.; Somà, A. Autonomous Driving Strategy for a Specialized Four-Wheel Differential-Drive Agricultural Rover. Agriengineering 2024, 6, 1937–1958. [Google Scholar] [CrossRef]
- Ecothea Srl Smilla H2. Available online: https://ecothea.it/attivita-e-progetti/smilla-h2/ (accessed on 5 May 2025).
- Martelli, S.; Mocera, F. Experimental Analysis of an Autonomous Driving Strategy for a Four-Wheel Differential Drive Agricultural Rover. Eng. Proc. 2025, 85, 41. [Google Scholar]
- Shkel, A.M.; Lumelsky, V. Classification of the Dubins Set. Robot. Auton. Syst. 2001, 34, 179–202. [Google Scholar] [CrossRef]
- Yang, D.; Li, D.; Sun, H. 2D Dubins Path in Environments with Obstacle. Math. Probl. Eng. 2013, 2013, 291372. [Google Scholar] [CrossRef]
- Macenski, S.; Singh, S.; Martín, F.; Ginés, J. Regulated Pure Pursuit for Robot Path Tracking. Auton. Robot. 2023, 47, 685–694. [Google Scholar] [CrossRef]
- Coulter, C.R. Implementation of the Pure Pursuit Path ’hcking Algorithm; R. C. Coulter: Pittsburgh, PA, USA, 1992. [Google Scholar]
- Cornejo, J.; Magallanes, J.; Denegri, E.; Canahuire, R. Trajectory Tracking Control of a Differential Wheeled Mobile Robot: A Polar Coordinates Control and LQR Comparison. In Proceedings of the 2018 IEEE XXV International Conference on Electronics, Electrical Engineering and Computing (INTERCON), Lima, Peru, 8–10 August 2018; IEEE: New York, NY, USA, 2018; pp. 1–4. [Google Scholar]
- Mocera, F.; Somà, A.; Nicolini, A. Grousers Effect in Tracked Vehicle Multibody Dynamics with Deformable Terrain Contact Model. Appl. Sci. 2020, 10, 6581. [Google Scholar] [CrossRef]
- Becker, C.; Els, S. Agricultural Tyre Stiffness Change as a Function of Tyre Wear. J. Terramechanics 2022, 102, 1–15. [Google Scholar] [CrossRef]
- Lines, J.A.; Murphy, K. The Stiffness of Agricultural Tractor Tyres. J. Terramechanics 1991, 28, 49–64. [Google Scholar] [CrossRef]
- Yoo, H.; Oh, J.; Chung, W.-J.; Han, H.-W.; Kim, J.-T.; Park, Y.-J.; Park, Y. Measurement of Stiffness and Damping Coefficient of Rubber Tractor Tires Using Dynamic Cleat Test Based on Point Contact Model. Int. J. Agric. Biol. Eng. 2021, 14, 157–164. [Google Scholar] [CrossRef]
- Cường, Đ.M.; Hong, Z.S.; Hùng, Đ.V.; Ngọc, N.T. Study on the vertical stiffness and damping coefficient of tractor tire using semi-empirical model. Hue Univ. J. Sci. Agric. Rural. Dev. 2013, 83, 5–15. [Google Scholar] [CrossRef]
- Coulomb, C.A. Essai Sur Une Application Des Règles de Maximis et de Minimis à Quelques Problèmes de Statique Relatifs à l’architecture. In Mémoires Savants Etrangers; L’academie Paris: Paris, France, 1776; Volume 7, pp. 343–382. [Google Scholar]
- Renius, K.T. Fundamentals of Tractor Design; Springer International Publishing: Cham, Germany, 2020; ISBN 978-3-030-32803-0. [Google Scholar]
- McAllister, M. Reduction in the Rolling Resistance of Tyres for Trailed Agricultural Machinery. J. Agric. Eng. Res. 1983, 28, 127–137. [Google Scholar] [CrossRef]
- Knospe, C. PID Control. IEEE Control. Syst. Mag. 2006, 26, 30–31. [Google Scholar] [CrossRef]
- Scalisi, A.; O’Connell, M.G.; Stefanelli, D.; Zhou, S.; Pitt, T.; Graetz, D.; Dodds, K.; Han, L.; De Bei, R.; Stanley, J.; et al. Narrow Orchard Systems for Pome and Stone Fruit—A Review. Sci. Hortic. 2024, 338, 113815. [Google Scholar] [CrossRef]
- Sezer, V.; Gokasan, M. A Novel Obstacle Avoidance Algorithm: “Follow the Gap Method”. Robot. Auton. Syst. 2012, 60, 1123–1134. [Google Scholar] [CrossRef]
- Demir, M.; Sezer, V. Improved Follow the Gap Method for Obstacle Avoidance. In Proceedings of the 2017 IEEE International Conference on Advanced Intelligent Mechatronics (AIM), Munich, Germany, 3–7 July 2017; IEEE: New York, NY, USA, 2017; pp. 1435–1440. [Google Scholar]
- Hu, C.; Gao, J.; Diao, J.; Song, X. Numerical Simulation of Tire Steering on Sandy Soil Based on Discrete Element Method. AIP Adv. 2021, 11, 015015. [Google Scholar] [CrossRef]
- Widodo, N.P.; Kramadibrata, S.; Rohman, A.; Wicaksana, Y.; Hermawan, F. Rolling Resistance Study of Gravelly Sand Material on Laboratory Scale. In Proceedings of the 2nd International Symposium of Novel Carbon Resources Science, Bandung, Indonesia, March 2009. [Google Scholar]
- Cenek, P.D.; Jamieson, N.J.; McLarin, M.W. Frictional Characteristics of Roadside Grass Types. In Proceedings of the International Surface Friction Conference: Roads and Runways: Improving Safety Through Assessment and Design, Christchurch, New Zealand, 1–4 May 2005. [Google Scholar]
- Samuelraj, D.; Jaichandar, S.; Rajan, G.; Govindan, S. Coefficient of Friction in Different Road Conditions by Various Control Methods—An Overall Review. Int. J. Mech. Prod. Eng. Res. Dev. 2018, 8, 9–20. [Google Scholar] [CrossRef]
- Ivanov, V.; Savitski, D.; Augsburg, K.; Barber, P.; Knauder, B.; Zehetner, J. Wheel Slip Control for All-Wheel Drive Electric Vehicle with Compensation of Road Disturbances. J. Terramechanics 2015, 61, 1–10. [Google Scholar] [CrossRef]
- Kawabe, T. Model Predictive PID Traction Control Systems for Electric Vehicles. In Proceedings of the 2012 IEEE International Conference on Control Applications, Dubrovnik, Croatia, 3–5 October 2012; IEEE: New York, NY, USA, 2012; pp. 112–117. [Google Scholar]
Disclaimer/Publisher’s Note: The statements, opinions and data contained in all publications are solely those of the individual author(s) and contributor(s) and not of MDPI and/or the editor(s). MDPI and/or the editor(s) disclaim responsibility for any injury to people or property resulting from any ideas, methods, instructions or products referred to in the content. |
© 2025 by the authors. Licensee MDPI, Basel, Switzerland. This article is an open access article distributed under the terms and conditions of the Creative Commons Attribution (CC BY) license (https://creativecommons.org/licenses/by/4.0/).