Abstract
The relevance of mannosyldiinositolphosphorylceramide [M(IP)2C] synthesis, the terminal complex sphingolipid class in the yeast Saccharomyces cerevisiae, for the lateral organization of the plasma membrane, and in particular for sphingolipid-enriched gel domains, was investigated by fluorescence spectroscopy and microscopy. We also addressed how changing the complex sphingolipid profile in the plasma membrane could influence the membrane compartments (MC) containing either the arginine/ H+ symporter Can1p (MCC) or the proton ATPase Pma1p (MCP). To achieve these goals, wild-type (wt) and ipt1Δ cells, which are unable to synthesize M(IP)2C accumulating mannosylinositolphosphorylceramide (MIPC), were compared. Living cells, isolated plasma membrane and giant unilamellar vesicles reconstituted from plasma membrane lipids were labelled with various fluorescent membrane probes that report the presence and organization of distinct lipid domains, global order, and dielectric properties. Can1p and Pma1p were tagged with GFP and mRFP, respectively, in both yeast strains, to evaluate their lateral organization using confocal fluorescence intensity and fluorescence lifetime imaging. The results show that IPT1 deletion strongly affects the rigidity of gel domains but not their relative abundance, whereas no significant alterations could be perceived in ergosterol-enriched domains. Moreover, in these cells lacking M(IP)2C, a clear alteration in Pma1p membrane distribution, but no significant changes in Can1p distribution, were observed. Thus, this work reinforces the notion that sphingolipid-enriched domains distinct from ergosterol-enriched regions are present in the S. cerevisiae plasma membrane and suggests that M(IP)2C is important for a proper hydrophobic chain packing of sphingolipids in the gel domains of wt cells. Furthermore, our results strongly support the involvement of sphingolipid domains in the formation and stability of the MCP, possibly being enriched in this compartment.
1. Introduction
The plasma membrane of fungi contains a multitude of actively maintained membrane compartments, which have distinct protein markers, are stable in space and time, and are responsible for specific physiological functions [1,2,3]. Despite the growing interest in these compartments, the mechanism of their formation, their lipid composition, and their interrelations are still largely unknown [4].
In yeast and other fungi, as well as in plants, many plasma membrane proteins display slow lateral diffusion or are immobile, when compared to vertebrate biological membranes or artificial fluid lipid bilayers [2]. In some cases, this low mobility is dependent on plasma membrane sterols and sphingolipids [1,3,5,6,7,8]. In this regard, sphingolipid-enriched microdomains seem to be of particular relevance [9,10,11]. These domains found in the plasma membrane of Saccharomyces cerevisiae differ from the prototypical mammalian lipid raft both in composition, given they are ergosterol-depleted, and biophysically, as they are highly rigid gel domains [11]. Hence, the study of these domains is particularly important, as they may explain fundamental differences between fungal and mammalian membranes [9], providing potential targets that can be explored concerning antifungal drug development [12].
In the plasma membrane of yeast S. cerevisiae two major non-overlapping compartments can be found: The membrane compartment containing Can1p (MCC), an arginine permease, and the membrane compartment containing Pma1p (MCP), the plasma membrane H+-ATPase. MCC is currently designated MCC/eisosome, as its characteristic furrow-like invaginating shape is stabilized by a large cytosolic protein scaffold, the eisosome, at the bottom of the MCC furrow [2,13,14]. A typical S. cerevisiae cell in exponential phase contains around 1.5–2.5 such invaginations per μm2 of cell surface [8,13] covering roughly 25% of the membrane area. Fluorescence labeling with the 3′-β-sterol-binding filipin suggested that the MCC/eisosome is ergosterol-enriched [15]. The deletion of proteins that are part of the MCC/eisosome, or are associated with it, compromises the formation of intact MCC/eisosome domains and influences ergosterol distribution in the plasma membrane [2]. Some of the well-known functions of the MCC/eisosome include the sensing of local membrane disturbances and deformations, e.g., due to mechanical or osmotic stress [16], involvement in membrane adaptation to other types of stress [17,18,19,20], regulation of lipid homeostasis, in particular sensing sphingolipid levels [2], and protection against endocytosis/starvation [3]. Notably, membrane potential has been suggested to modulate the organization of MCC domains. Readily after membrane depolarization, proteins including Can1p are no longer confined to the MCC, acquiring a more homogeneous distribution in the plasma membrane [15,21]. Concomitantly, sphingolipid-enriched microdomains dissipate [22]. Thus, despite the stability of MCC and the low mobility of Can1p inside the MCC, its distribution in the plasma membrane is dynamic and regulated.
The MCP was first identified in S. cerevisiae by confocal fluorescence microscopy as a network-like compartment containing Pma1p [23], the most abundant plasma membrane protein in fungi [24]. This protein is responsible for the creation and maintenance of membrane potential of fungal cells, as well as regulation of the intracellular pH and ion concentration [25]. More recently, it has been suggested to be of relevance for signaling [3]. The electrochemical gradient established by Pma1p drives nutrient uptake, namely by symporters localized at the MCC, such as Can1p, establishing an important functional relation between MCP and MCC.
On the other hand, in S. cerevisiae [26,27] as well as in Cryptococcus neoformans [28,29], alterations of sphingolipid metabolic balance affect the oligomerization, traffic, activity, and plasma membrane stability of Pma1p [30,31,32,33]. These results point to an intimate relation between the MCP and the sphingolipids. Pma1p has relatively long hydrophobic transmembrane segments and is one of the yeast plasma membrane constituents with the longest residence time [34]. Thus, this compartment seems to be a good candidate to host sphingolipids. With very long hydrocarbon chains, they exhibit tendency to form highly ordered gel domains, and relatively low levels of ergosterol [15] are putatively found in the MCP. However, whether sphingolipids are major lipid components of those domains is also unproved, as is the sphingolipid enrichment in the MCC. Moreover, the labelling of sphingolipids is not straightforward, and only indirect evidence is available to support that hypothesis.
Based on the structure of their headgroup, complex sphingolipids are classified in three types in yeast, inositolphosphorylceramide (IPC), MIPC (mannosylinositolphosphorylceramide), and M(IP)2C (mannosyldiinositolphosphorylceramide). M(IP)2C is the most abundant complex sphingolipid in S. cerevisiae, regardless of whether the whole cell or specifically the plasma membrane is considered [35,36]. Still, MIPC is also present in the plasma membrane of wild-type (wt) S. cerevisiae cells. The formation of terminal complex sphingolipid M(IP)2C from MIPC is catalyzed by an inositol phosphotransferase encoded by the IPT1 gene [35,36]. In ipt1Δ cells, despite the major changes in sphingolipid composition, that are characterized by the lack of M(IP)2C and its replacement by MIPC, the sterol composition is similar to that of wt cells [35]. Some studies suggest that this gene deletion may enhance resistance to both nystatin and miconazole [35], and confers markedly higher resistance to zymocin [37], syringomycin E [38], and the plant defensin DmAMP1 produced by Dahlia merckii seeds [39]. The authors of the latter study proposed that the antifungal peptide targets membrane patches containing M(IP)2C, although the specific contribution of each complex sphingolipid for the organization of the plasma membrane is still unclear.
In this work, in an attempt to clarify some of the issues described above, we have carried out a thorough biophysical characterization of the plasma membrane in S. cerevisiae ipt1Δ versus wt cells, addressing both lipid domains and membrane compartments. We found that the plasma membrane of ipt1Δ cells has more compact sphingolipid-enriched domains, whereas dielectric properties that are more specifically modulated by ergosterol remained essentially unchanged. Moreover, we present evidence that in ipt1Δ cells, where M(IP)2C is absent, the plasma membrane distribution of Pma1p is much more affected than that of Can1p.
2. Materials and Methods
2.1. Materials and Strains
Table 1 lists the S. cerevisiae strains used in this work. The wt and ipt1Δ strains were transformed using the lithium acetate procedure [40], with the integrative plasmid Ylp211-CAN1-GFP (URA3) or Ylp128-PMA1-mRFP (LEU2) kindly provided by Dr. Guido Grossmann and Professor Widmar Tanner (University of Regensburg, Germany).

Table 1.
Saccharomyces cerevisiae strains used in this work, genotype description, and growth media.
Yeast extract, bactopeptone, yeast nitrogen base, and bacto-agar were purchased from Difco (Hampton, NH, USA). Amino acids, nucleotides and glucose used in the synthetic complete (SC) medium, sucrose, and organic solvents (of analytical grade for lipid extraction and spectroscopic grade for lipids and probes stock solutions) were obtained from Merck (Darmstadt, Germany). Trans-parinaric acid (t-PnA) was purchased from Santa Cruz Biotech. (Santa Cruz, CA, USA), 1,6-diphenylhexatriene (DPH) from Invitrogen (Carlsbad, CA, USA), 4-[2-[6-(dioctylamino)-2-naphthalenyl]ethenyl]-1-(3-sulfopropyl)-pyridinium (di-8-ANEPPS) was obtained from Biotium (Fremont, CA, USA), 1,2-dioleoyl-sn-glycero-3-phosphoethanolamine-N-(lissamine rhodamine B sulfonyl) (Rhod-DOPE) from Avanti Polar Lipids (Alabaster, AL, USA), and Ludox (TM-50 colloidal silica, 50 wt.% suspension in water) acquired from Sigma-Aldrich (St. Louis, MO, USA).
The fluorescent probes were quantified spectrophotometrically using the respective molar absorption coefficients: t-PnA, = 89,000 M−1cm−1; DPH, = 88,000 M−1cm−1; di-8-ANEPPS, = 37,000 M−1cm−1, Rhod-DOPE, = 95,000 M−1cm−1 [41].
2.2. Media and Growth Conditions
S. cerevisiae cells were inoculated at an A600nm of 0.15 and cultured in SC medium (2% (w/v) glucose, 0.68% (w/v) yeast nitrogen base and amino acid composition given in [42]), except when specifically stated and for microscopy experiments using di-8-ANEPPS and Rhod-DOPE as membrane probes. In these cases, a similar growth procedure was performed using a culture medium containing 1% (w/v) yeast extract, 2% (w/v) peptone and 2% (w/v) glucose (YPD). Yeast cells were grown at 30 °C and 160 rpm overnight and reinoculated into the culture medium at an A600nm of ~0.15. Upon reaching an A600nm of 0.6, after a 5–6 h incubation, i.e., in the mid-exponential phase, cells were harvested.
2.3. Plasma Membrane Isolation
The plasma membrane isolation was performed as described in [43] with minor adjustments. Briefly, cells were collected by centrifugation (5 min, 5000× g) and washed twice with 0.4 M sucrose in buffer A (25 mM imidazole HCl, pH 7.0) at 3500× g for 10 min. Harvested cells were resuspended in buffer A containing sucrose at 0.4 M and a mixture of protease inhibitors (Halt™ protease inhibitor cocktail (100×) from Thermo Scientific (Waltham, MA, USA)), and lysed gently with glass beads. To obtain a crude membrane extract, lysed cells were centrifuged at low speed (530× g) for 20 min, the supernatant was recovered and centrifuged at 22,000× g for 30 min. For the total lipid extracts preparation, the pellet containing the crude membrane extract was stored, while for the plasma membrane isolation it was resuspended in 2 mL of buffer A containing the protease inhibitor mixture. Then, it was applied on the top of a 10 mL discontinuous sucrose gradient (consisting of three layers of 2.25, 1.65, and 1.1 M sucrose in buffer A). The gradient centrifugation was carried out in a CP80NX Hitachi ultracentrifuge (Berkshire, United Kingdom) for 18 h at 80,000× g. Pure plasma membrane fractions were obtained from the interface between the 2.25 and 1.65 M sucrose layers and then they were resuspended in either buffer A (for lipid extraction) or B (for fluorescence analysis; 100 mM NaH2PO4.H2O, 100 mM NaCl, 1 mM EDTA, pH 7.4) and pelleted by centrifugation at 30,000× g for 40 min.
2.4. Lipid Extraction
The extraction of the total lipids of the cell and of the plasma membrane was performed using a slightly modified Bligh–Dyer method [44]. The isolated plasma membrane (IPM) and the crude membrane extracts were separately incubated with 1 mL of buffer A and 19 mL of chloroform:methanol (1:2, v/v) at 20 °C with shaking at 140 rpm for 1 h. Chloroform was further added in order to have a chloroform:methanol ratio of 1:1 (v/v). The same volume of a 0.04% (w/v) CaCl2 solution was added to the mixture, which was then vigorously stirred for 1 min (while relieving the pressure). Once two distinct phases were visible, both the organic phase and the interface were collected separately. The whole process was then repeated for the interface, from which the organic phase was collected, added to the previous one, dried under a stream of nitrogen and then stored at −20 °C. In plasma membrane suspensions and in lipid extracts, total phospholipid concentration was determined by phosphorus analysis [45]. Ergosterol molar proportion was assumed to be ca. 2:1 (phospholipid:ergosterol) [19,46]. Before use, total lipid extracts were redissolved in chloroform/methanol (2:1, v/v) and the adequate volume was taken to obtain suspensions of multilamellar vesicles (MLVs) in buffer B, at a final lipid concentration of ca. 0.3 mM (see [11] for further details).
2.5. Giant Unilamellar Vesicles (GUVs) Preparation
GUVs were prepared by the electroformation method of Angelova et al. [47]. For GUV preparation, a 1 mM solution of the lipids extracted from yeast plasma membrane in chloroform: methanol (2:1, v/v) was used. The adequate volume of probe (di-8-ANEPPS and/ or Rhod-DOPE) stock solution was mixed to obtain a final lipid/probe ratio of 1:500 (mol:mol) and a chloroform:methanol ratio of (2:1, v/v). Then, 25 µL of this mixture, previously homogenized, was spread with a gas-tight syringe on the titanium plates of the GUV chamber. To remove any traces of organic solvent, the plates were placed on a vacuum desiccator for 30 min. The titanium chambers were assembled and filled with 700 µL of a 200 mM sucrose solution with sodium azide 15 mM, previously heated to 60 °C in a heat block, sealed, connected to the signal generator and placed in the heat block maintaining the system at 60 °C. A 10 Hz sinusoidal wave with a peak-to-peak amplitude of 0.4 V was initially applied and the voltage was increased to 2.0 V and kept overnight. The sinusoidal signal was then changed to 4 Hz frequency and 2.6 V voltage for 20 min. The vesicle suspension was kept at room temperature (24 °C) in the dark until use. For GUV visualization, 100 µL of each GUV suspension and 150 µL of glucose solution 200 mM were added to a well of an eight-well plastic plate from Ibidi® with glass like coverslip bottom.
2.6. Fluorescence Spectroscopy Measurements and Data Analysis
Fluorescence measurements were performed with a Fluorolog Model 3.22 spectrofluorimeter from Horiba Jobin Yvon (Villeneuve D’ascq, France) at 24.0 ± 1.0 °C in a sample compartment with temperature-control and magnetic stirring.
Harvested cells (wt and ipt1Δ) were washed twice with sterile water and then suspended in buffer B. Before starting the measurements, the probes DPH or t-PnA were added to the cell suspension to a final concentration of 2 µM and incubated at 24 °C (room temperature) for 20 and 5 min, respectively [11].
For fluorescence measurements, the IPM suspensions were incubated with t-PnA, DPH or di-8-ANEPPS for more than 5 min, 20 min, and 1 h respectively, at room temperature, to a final ratio of probe/lipid of 1/100, for DPH and t-PnA, and 1/200 for di-8-ANEPPS. The MLV suspensions made from total lipid extracts were labelled with DPH at a probe:phospholipid ratio of 1/200. following a procedure previously described [48].
For fluorescence in the steady-state, the excitation and emission wavelengths were set to, respectively, 320 and 404 nm for t-PnA and 358 and 430 nm for DPH. The value of steady-state fluorescence anisotropy, ⟨r⟩, was determined through Equation (1):
in which the subscripts indicate the orientation of the excitation and emission polarizers, where V and H correspond to vertical and horizontal orientations and G is a correction for the instrument different sensitivity to each light polarization plane. An adequate blank was subtracted from each intensity reading.
Time-resolved fluorescence measurements were carried out by the single photon timing technique, using a nanoLED N-320 from Horiba Jobin Yvon (Villeneuve D’ascq, France) for the excitation of t-PnA, and 404 nm as the emission wavelength. The scattering agent used to obtain the instrument response function (IRF) was Ludox®. The experimental fluorescence intensity decays were analyzed with the software TRFA® version 1.4 (Minsk, Belarus). To completely separate the emission of the probe from the autofluorescence of the cells, a method of global analysis was used [49]. The fluorescence intensity decays of the probe were described by a multiexponential model according to Equation (2):
After subtracting the contribution of the cells autofluorescence to the pre-exponential factor in each component i with lifetime , and after the thus obtained pre-exponential factors were normalized to obtain their relative amplitude . Equation (3) was used to calculate the mean fluorescence lifetime (intensity weighted):
and Equation (4) was used to compute the amplitude-weighted mean fluorescence lifetime:
The criteria for good quality of the fitting were the reduced global χ2 close to 1 and the random distributions of weighted residuals and of residuals autocorrelation (see supplemental Figure S1).
Changes in membrane dipole potential were evaluated in IPM suspensions using the ratio of the steady-state fluorescence intensity values obtained from excitation of di-8-ANEPPS at 420 nm and at 520 nm, both with emission at 635 nm [50,51].
2.7. Fluorescence Intensity and Lifetime Imaging by Confocal Microscopy
2.7.1. GUV and Living Cells Labeled with Di-8-ANEPPS or Rhod-DOPE
For fluorescence lifetime imaging microscopy (FLIM) with di-8-ANEPPS, after cell harvesting, the cellular suspension was labeled at room temperature (24 °C) with the probe at 1 µM, which was added from a concentrated methanol stock solution. After a 5 min incubation with the probe, the cells were centrifuged and suspended in buffer B.
Intensity images as well as FLIM measurements were taken in the confocal mode using an Olympus Fluoview 1000 (Olympus, Tokyo, Japan) upgraded with a LSM time-resolved kit (PicoQuant GmbH, Berlin, Germany) and an oil immersion objective, ×60 (1.35 N.A.). For intensity images, Di-8-ANEPPS was excited by a 488 nm line of a multiline argon laser and its emission detected in the range of 565–665 nm. Rhod-DOPE intensity images were acquired with excitation at 559 nm using a line of a multiline argon laser and detection in the range of 590–690 nm. Images with a frame size of 512 × 512 pixels were acquired. For FLIM measurements, di-8-ANEPPS was excited at 483 nm and Rhod-DOPE at 560 nm using pulsed-laser diodes and detected by a single photon avalanche photodiode (SPAD) using a 620 ± 30 nm bandpass filter. FLIM images were acquired for 60 s (45 frames with an average photon count rate of 2–4 × 10⁴ count/s). Analysis of FLIM data was performed using the software from PicoQuant, SymPhoTime 64, (version 2.5), considering the convolution of the fluorescence decays with the IRF. The time distribution of photon counts in each pixel retrieved from the regions of interest were combined into a single decay curve which was analyzed by using a 2 exponentials model (Equation (2) with i = 2), judging the fitting quality from the distribution of the residuals and reduced χ2 value. The intensity-weighted mean fluorescence lifetime and the amplitude weighted mean fluorescence lifetime were calculated using Equations (3) and (4). The results are averaged over more than 50 GUV from at least 3 independent experiments and more than 400 cells from 4 independent experiments. The fluorescence lifetime of the probe was independent of the incubation time.
2.7.2. Yeast Living Cells Tagged with GFP and mRFP
FLIM measurements as well as confocal images of harvested S. cerevisiae wt and ipt1Δ cells with GFP-tagged Can1p and mRFP-tagged Pma1p were performed on a time-resolved confocal fluorescence microscope, model MicroTime 200, from PicoQuant GmbH (Berlin, Germany), with details of the equipment setup described in [52].
The point-spread function of the setup was measured using fluorescent beads of size 100 nm, which afforded a lateral resolution of about 400 nm. Intensity images were obtained concomitantly with FLIM measurements. GFP and mRFP were excited at 480 nm using a pulsed-laser diode and detected by a SPAD using a the longpass filter above 510 nm. The images were obtained with a scanning resolution of 0.156 µm/pixel. All images were acquired with an excitation power of ca. 0.54 kW/cm2 and further processed by creating a mask in which the cell membrane regions were visually selected using the region-of-interest (ROI) tools of SymPhoTime program, version 5.3.2.2. The fluorescence decays corresponding to the regions identified as cell membranes were obtained from the histograms of photon arrival times concerning only the pixels contained in these regions. Here, the same criteria as in Section 2.7.1. for the analysis of the FLIM data of proteins were employed. The results are averaged over ca. 400 cells from 3 independent experiments.
Confocal images were used to assess the distribution of Can1p-GFP and Pma1p-mRFP in the plasma membrane of yeast living cells. For numerical data extraction a line profile of the fluorescence intensity of the plasma membrane was obtained using Image Pro-Plus v6.0 and the fluorescence heterogeneity, i.e., the fraction of pixels which have intensity higher or lower than the average plus or minus 10%, respectively (or plus or minus the standard deviation—both calculations yield the same relative results when comparing proteins or strains). It reflects to which extent the fluorescence intensity is concentrated in specific pixels and is independent on the total fluorescence intensity (see supplemental Figure S2). The heterogeneity was determined for the plasma membrane of each cell. For each transformed yeast strain, 4 independent experiments were performed, and more than 190 cells were analyzed.
2.8. Statistical Analysis
The results are presented as mean ± standard deviation (S.D.), unless stated otherwise, and the sample dimension and number of biologically independent replicates are given with the results. The statistical significance was determined using Student’s t-test. Mean values were considered significantly different for p values below or equal to 0.05.
3. Results
3.1. Sphingolipid-Enriched Domains are more Compact in ipt1Δ Cells
To understand how sphingolipid-enriched gel domains may change with an alteration of the sphingolipid profile, the plasma membrane of S. cerevisiae living cells was labelled with t-PnA. The fluorescence properties of this probe, especially the time-resolved, are sensitive to changes in the amount and composition of highly ordered gel domains, into which it partitions very favorably in membrane model systems, undergoing a concomitant increase of its fluorescence quantum yield [48,53,54]. Additionally, the long lifetime component in t-PnA fluorescence intensity decay can be used as a fingerprint for gel domains when longer than 30 ns [11].
The fluorescence intensity decay of t-PnA incorporated in the plasma membrane of S. cerevisiae cells is properly described by four exponentials, where the long component lifetime (τlong) gives information about the relative degree of hydrophobic packing of gel domains and its amplitude (normalized pre-exponential) about their relative abundance [55]. For wt cells, the long lifetime component was 40.9 ± 0.4 ns, a value similar to that obtained in our previous work (~41 ns) [11], while for ipt1Δ cells it was 45.1 ± 2.4 ns (Figure 1–τlong). Since this parameter is higher than 30 ns for both strains, it reveals the presence of gel domains in the plasma membrane [11]. Moreover, both the long-lifetime component and the intensity weighted mean fluorescence lifetime (Figure 1—⟨τ⟩) were even longer in ipt1Δ cells than wt cells. Similar results were obtained for cells grown in YPD medium (Supplementary Material Figure S3).
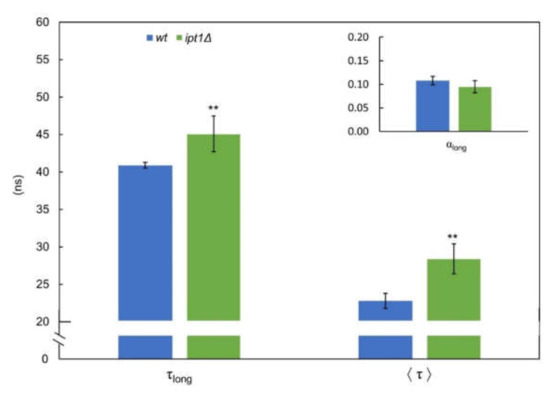
Figure 1.
The gel lipid domains of the plasma membrane of intact S. cerevisiae cells are more compact in ipt1Δ than in wt cells. The fluorescence intensity decay of the probe t-PnA in S. cerevisiae cellular suspensions was obtained at 24 °C, as described in the “experimental procedures”. The long-component lifetime (τlong) and normalized amplitude (αlong; see inset) and the mean fluorescence lifetime (⟨τ⟩) are shown. The values are the mean ± S.D. of at least four biological replicates. ** p ≤ 0.01.
Regarding the relative abundance of the sphingolipid-enriched domains, the amplitude of the long lifetime component was somewhat lower in ipt1Δ cells, but the differences were not statistically significant. Taken together the results of packing and abundance of the sphingolipid-enriched domains contribute to the identical values obtained for the steady state fluorescence anisotropy of t-PnA in living cells or IPM of S. cerevisiae wt and ipt1Δ cells (Supplementary Figure S4).
3.2. Membrane Fluidity Is Altered in ipt1Δ Cells
To further understand how the plasma membrane responds to alterations in the sphingolipid profile, the membrane of S. cerevisiae was labelled with DPH. Since DPH partitions equally throughout different lipid phases, it is sensitive to the membrane global properties, rather than to a particular type of domain [56,57], with the notable exception of poorly hydrated ceramide-rich phases [54]. DPH steady-state fluorescence anisotropy, ⟨r⟩, is a well-established parameter to report alterations in the global fluidity of the plasma membrane [11,58,59]. The fluorescence anisotropy of DPH changes linearly with composition (and temperature) along the gel/ liquid disordered (ld) and ld/ liquid ordered (lo) phase coexistence region, i.e., responds linearly to the fraction of each phase, in several binary and ternary lipid systems [12,54,58], including in the 1-palmitoyl-2-oleoyl-sn-glycero-3-phosphocholine (POPC)/ergosterol binary system [60]. Moreover, in the POPC/phytoceramide (the yeast sphingolipid backbone) system, the fluorescence anisotropy and intensity of DPH behave similarly to typical gel/ ld systems in the region of coexistence of ld and a phytoceramide-rich gel phase where the hydrophobic packing is comparable to the one found for the gel domains in yeast [48]. All these studies support the use of DPH anisotropy as a reporter of global membrane fluidity in yeast membranes.
As can be seen in Figure 2, for both the IPM suspensions and total lipid extracts reconstituted into multilamellar liposomes the steady-state anisotropy, ⟨r⟩, of DPH was significantly lower for ipt1Δ cells than for wt cells, but the values of ⟨r⟩ for IPM and total lipid extracts were similar for each strain.
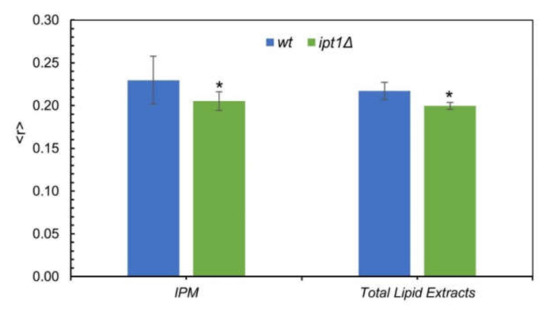
Figure 2.
The global order of the plasma membrane of S. cerevisiae is higher in wt than in ipt1Δ cells. The diphenylhexatriene (DPH) steady-state fluorescence anisotropy at 24 °C was obtained as described under “experimental procedures” for wt and ipt1Δ cells isolated plasma membrane (IPM) and multilamellar vesicles (MLVs) made from total lipid extracts obtained from cells in mid-exponential phase. The values are the mean ± S.D. of at least four biological replicates. * p ≤ 0.05.
In conclusion, the results suggest that the lack of M(IP)2C in ipt1Δ cells and/or the accumulation of MIPC [35,36] may lead to an alteration of the global fluidity of cellular membranes.
3.3. Plasma Membrane Fluid Domains Present Similar Properties in wt and ipt1Δ cells
Electrochromic dyes, such as di-8-ANEPPS, are suitable to report sterol-related properties [50,61]. In fact, the partition of another probe from ANEPPS family, di-4-ANEPPS, for the lo phase formed in the presence of ergosterol is higher (~2.1×) than for the corresponding ld phase in the same POPC/ergosterol phase coexistence tie-line. The probe also displays a higher fluorescence quantum yield in the lo phase [62]. On the other hand, as already mentioned, t-PnA partitions preferentially towards gel domains [11,53,54]. Thus, complementary information can be retrieved by labelling the membranes with di-8-ANEPPS [59].
Unlike t-PnA, di-8-ANEPPS can be used in fluorescence microscopy studies due to its excitation and emission in the visible range and photostability. The imaging techniques enable to directly conclude from the labelling pattern if the probe is homogeneously distributed in the membrane or if brighter regions can be readily distinguished. We also used FLIM, which allows to selectively analyze the fluorescence lifetime for each region of interest (ROI) of the plasma membrane of living cells. In addition to intact cells, GUV reconstituted from plasma membrane lipid extracts pertaining to either wt or ipt1Δ cells were also used. These reconstituted systems were double-labelled both with di-8-ANEPPS and with Rhod-DOPE. Rhod-DOPE was only used to label GUVs since when added externally to an aqueous solution it will not incorporate efficiently into the lipid bilayer [49]. Rhod-DOPE, due to the unsaturated acyl chains of DOPE moiety, partitions preferentially towards ld phase versus both gel [63] and ergosterol-induced lo [62] domains. In a three-phase coexistence situation, it will be mostly excluded from the gel, but still with some partition into the lo regions of the membrane [63]. Thus, since di-8-ANEPPS labels preferentially the lo phase and Rhod-DOPE the ld phase, their distribution in the membrane allows to evaluate the phase behavior of the GUV prepared from the plasma membrane lipid extracts. Both GUV and living cells were analyzed by confocal microscopy and FLIM (Figure 3).
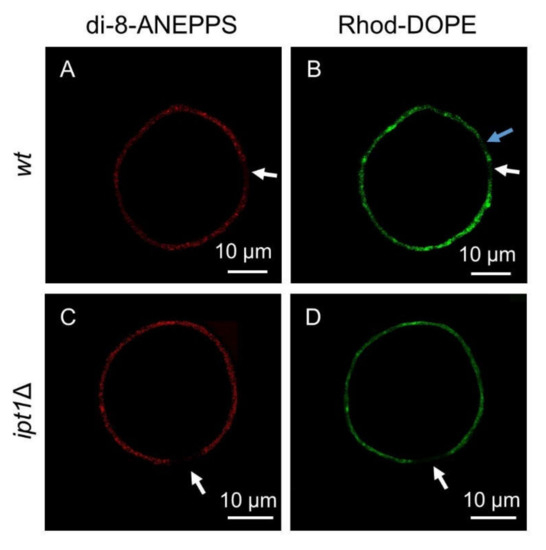
Figure 3.
S. cerevisiae plasma membrane lipids have complex phase behavior. Representative confocal microscopy images of giant unilamellar vesicles (GUVs) reconstituted from plasma membrane lipid extracts obtained from wt cells (A,B) or ipt1Δ cells (C,D) double-labelled with both di-8-ANEPPS and Rhod-DOPE. Images from di-8-ANEPPS channel (A,C) and Rhod-DOPE channel (B,D) are shown. White arrows indicate regions that were poorly labelled by both probes. The blue arrow points to a region that was poorly labelled by Rhod-DOPE but not at all by di-8-ANEPPS.
Confocal images of double-labelled GUVs prepared with plasma membrane lipid extracts from wt or ipt1Δ cells revealed that the fluorescence intensity of Rhod-DOPE and di-8-ANEPPS was not uniform throughout the GUV membrane. There were regions where the Rhod-DOPE signal was brighter, which indicated the presence of ld domains. The same was observed for di-8-ANEPPS, which suggested the presence of regions where lo predominates. Probe distribution throughout the membrane was clearly heterogeneous and despite the existence of regions where either the Rhod-DOPE or the di-8-ANEPPS signal was brighter it was not possible to accurately determine the relative proportion of ld and lo since these probes label most of the membrane, though with different intensity. Eventually, the size of the domains may be below the resolution of confocal fluorescence microscopy. Nonetheless, there were regions that were not labelled at all. These dark regions reveal lipid domains from which both probes were excluded. Both these probes are efficiently excluded from gel domains in coexistence with ld and lo domains but have different distribution between ld and lo phases [49,64,65]. Therefore, those dark regions that are simultaneously unlabeled by both probes likely correspond to rigid gel domains, in agreement with the results obtained from the fluorescence spectroscopy of t-PnA (Figure 1).
FLIM experiments were carried out both on GUV and living yeast cells to study in more detail the biophysical properties of the plasma membrane regions probed by di-8-ANEPPS in wt versus ipt1Δ cells. In FLIM, the microscopy image generated is based on the fluorescence lifetime rather than fluorescence intensity. Electrochromic dyes such as ANEPPS display a complex relaxation kinetics, which translates into a multiexponential fluorescence decay. It is highly dependent on the density of dipoles and dielectric constant of the membrane interfacial region, polarity properties that can be strongly affected by the presence of sterols [61,66]. In the case of cells, ROI corresponding to the plasma membrane were selected (Figure 4A–D). The parameters describing the fluorescence intensity decays, namely the normalized pre-exponentials and the fluorescence lifetimes of the two exponential components, as well as the amplitude-weighted and intensity-weighted mean fluorescence lifetimes are presented in Table 2.
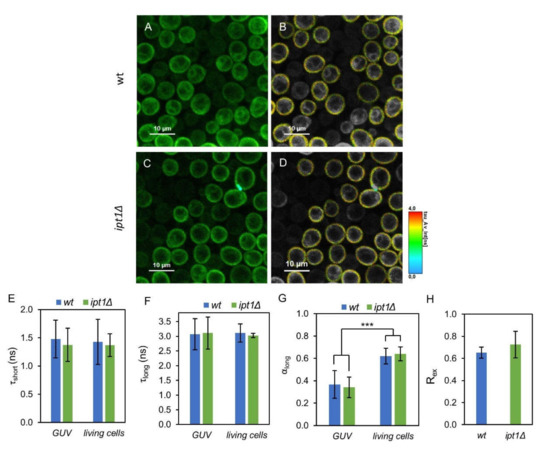
Figure 4.
Di-8-ANEPPS parameters are identical for wt and ipt1Δ cells in the different systems studied. Representative fluorescence lifetime imaging microscopy (FLIM) images of living S. cerevisiae wt (A,B) and ipt1Δ cells (C,D) labelled with di-8-ANEPPS. Panels (A,C) show representative intensity images, whereas in panels (B,D) the region-of-interest (ROI) selecting the plasma membrane is represented with the lifetime color scale obtained by FLIM. Lifetime components in GUVs obtained from plasma membrane lipids of wt and ipt1Δ cells and in living cells, (E) lifetime of the short component, (F) lifetime of the long component and (G) amplitude of the long component. The amplitude of the short component is 1-αlong. The values are the mean ± S.D. of at least three biological replicates with a total of at least 50 GUVs and 400 cells analyzed per strain. ***, p ≤ 0.001. In panel (H) Rex (420 nm/520 nm), which is linearly dependent on the membrane dipole potential, is shown for IPM suspensions labeled with di-8-ANEPPS (n ≥ 3).
Table 2.
Fluorescence intensity decay parameters of di-8-ANEPPS incorporated in S. cerevisiae wt and ipt1Δ cells at 24 °C. The fluorescence intensity decays measured in cells were described by the sum of two exponentials, with amplitudes α1 and α2 and lifetimes τ1 and τ2. is the amplitude-weighted mean fluorescence lifetime and ⟨τ⟩ is the intensity-weighted mean fluorescence lifetime (Equations (3) and (4)). The values are the mean ± S.D. of more than 50 GUVs from three biological replicates and ca. 400 cells from four biological replicates.
The lifetimes of the components describing the fluorescence decays obtained in GUV and in living cells are identical (Figure 4E,F) though their amplitudes are not (Figure 4G). Nonetheless, when comparing the two types of cells, wt and ipt1Δ, the decay parameters obtained were all very similar with no statistical differences found either in the plasma membrane of living cells or in reconstituted GUV, with a percent variation of less than 2%, if at all. These results imply that the properties of the membrane reported by di-8-ANEPPS were not significantly affected by altering the composition of complex sphingolipids.
To further confirm that the properties of ergosterol-enriched domains are not affected by changes in the sphingolipid profile, the ratiometric value Rex (420 nm/520 nm), which has a linear relationship with the membrane dipole potential [50], was determined from the excitation spectra of di-8-ANEPPS in the IPM of S. cerevisiae (Figure 4H). This parameter was not significantly different between wt and ipt1Δ cells, corroborating the previous conclusion.
The ⟨τ⟩ of Rhod-DOPE was also measured in GUVs reconstituted from lipids of wt cells yielding a value of 2.36 ± 0.02 ns, whereas in those prepared from lipids of ipt1Δ cells a value of 2.45 ± 0.04 ns was obtained. These values lay within those measured in phosphatidylcholine/ergosterol lipid bilayers, where a longer fluorescence lifetime points to a more fluid environment [62]. Thus, the fact that the fluorescence lifetime of Rhod-DOPE in GUVs made from plasma membrane lipids is slightly longer for ipt1Δ cells than for wt cells, suggests a more fluid membrane in the deletion mutant, in agreement with the results obtained with the probe DPH.
3.4. The Lateral Organization of Pma1p But Not Can1p Is Dependent on the Sphingolipid Profile
In order to evaluate the impact of changing sphingolipid composition of S. cerevisiae plasma membrane in the organization of MCC and MCP, the time-resolved fluorescence properties of Can1p tagged with GFP (Can1p-GFP) and Pma1p tagged with mRFP (Pma1p-mRFP) were studied by FLIM both in living wt and ipt1Δ cells. As already mentioned, Can1p is found in MCC domains that co-localize with ergosterol staining by filipin, whereas Pma1p is the hallmark of MCP which seems to be intimately related with sphingolipids, but with no direct evidence for sphingolipid enrichment [3].
The fluorescence decay parameters of the proteins mentioned above were collected for both wt and ipt1Δ cells (Figure 5 and Table S1). The decays are bi-exponential as expected when exciting GFP using a wavelength outside the absorption band of the protonated form and detecting emission above 500 nm [67,68,69]. Moreover, the lifetime and amplitude values obtained for each component of the fluorescence decay are in line with those reported in the literature [67,68,69]. The mean fluorescence lifetime obtained for GFP suggests that the protein is close to a medium with a high refractive index [70] as anticipated considering the membrane location of Can1p. For Can1p-GFP no differences were found between wt cells and ipt1Δ cells. On the contrary, for Pma1p-mRFP significant differences in the fluorescence decay parameters were found between the two strains studied (Supplementary Table S1). A statistically significant decrease was also observed in the intensity-weighted mean fluorescence lifetime, from 2.09 ± 0.04 ns in wt cells to 1.96 ± 0.07 ns in ipt1Δ cells (Figure 5B). This corresponds to, approximately, a 6% variation. This alteration reflects a different environment surrounding the protein in the two strains, which could be related to changes in the membrane refractive index, or to alterations in the pH or local ion concentration in the vicinity of the protein. Considering, e.g., that the refractive index of a lipid membrane varies with the length and packing of the lipid hydrophobic chains [71] and also with polar headgroup chemistry [72], the change obtained in the mean fluorescence lifetime is particularly relevant since it would represent a variation equivalent to ~0.03 in terms of refractive index, or an increase of 20% (v/v) of glycerol in a water/glycerol mixture for a GFP in solution [70], which, in turn, is also comparable e.g., to a change of about 6 carbons in the length of a fatty acid chain monolayer [71].
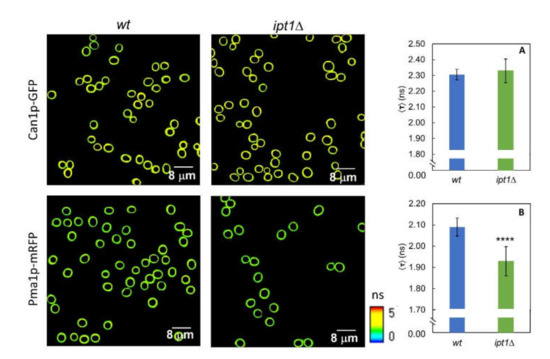
Figure 5.
The lack in M(IP)2C leads to a change in the microenvironment surrounding Pma1p but not Can1p. Representative FLIM images of ROI comprising S. cerevisiae wt cells and ipt1Δ cells plasma membrane. Intensity-weighted mean fluorescence lifetime for S. cerevisiae cells. (A) wt-Can1p-GFP and ipt1Δ-Can1p-GFP cells and (B) wt-Pma1p-mRFP and ipt1Δ Pma1p-mRFP cells. The values are the mean ± S.D. of three independent biological replicates with a total of ca. 400 cells analyzed for each strain. **** p ≤ 0.0001.
The heterogeneity of Can1p and Pma1p distribution in the plasma membrane of S. cerevisiae was also assessed (see Section 2.7.2) to further evaluate the possible influence of the complex sphingolipids in the yeast membrane compartments MCC and MCP. The distribution heterogeneity was determined by confocal fluorescence microscopy [15,23], as described in the experimental section. These fusion proteins have been used previously to visualize and detect alterations in both membrane compartments in S. cerevisiae [15,23], or similar proteins, e.g., Pma1p-GFP in other fungi such as Neurospora Crassa [73] or Pma1p tagged with hemagglutinin in C. neoformans [28].
In Figure 6, representative confocal images for the two strains labeled with either Pma1p-mRFP or Can1p-GFP are shown, as well as values obtained for the heterogeneity of their distribution in the plasma membrane for all the replicates. The fact that the heterogeneity values for Can1p and Pma1p distribution in the plasma membrane in wt cells are very similar, 0.68 ± 0.10 and 0.66 ± 0.12 respectively, can be due to the reported complementarity of the two membrane compartments. The heterogeneity of Can1p distribution is only slightly—if at all—affected by 3% in ipt1Δ cells relatively to wt cells (Figure 6A). In contrast, the heterogeneity of Pma1p distribution in the plasma membrane is 15% higher in ipt1Δ cells than in wt cells (Figure 6B), a prominent change between strains especially when compared to the one found for Can1p. Interestingly, the quantification of fluorescence intensity at the plasma membrane (see supplementary Figure S5), reveals that Can1p-GFP has slightly higher average intensity in ipt1Δ plasma membrane than in the wt, whilst for Pma1p-mRFP, the intensity is significantly weaker in ipt1Δ cells. This difference in fluorescence intensity between strains indicates a change in the amount of protein at the plasma membrane, since the fluorescence quantum yield of Pma1p-RFP is only marginally lower in ipt1Δ cells, according to the measured amplitude-weighted mean fluorescence lifetimes (Supplementary Table S1) and pinpoints a potential defect in Pma1p accumulation at the plasma membrane in ipt1Δ cells. The mechanism underlying the lower Pma1p-mRFP levels at the plasma membrane of ipt1Δ cells can be related to alterations in the protein traffic or turnover or protein expression levels.
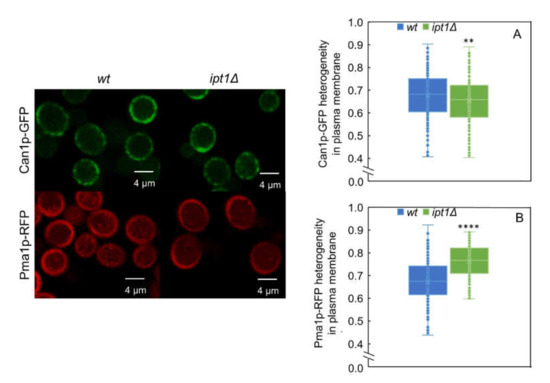
Figure 6.
MCP distribution in the plasma membrane is different in wt cells and ipt1Δ cells. The heterogeneity of Can1p-GFP and Pma1p-mRFP distribution along the plasma membrane was determined for wt cells (A) and ipt1Δ cells (B) as described in the experimental procedures. The values are the median ± S.D. of at least four biological replicates with a total of at least 190 cells analyzed per replicate. **, p ≤ 0.01; ****, p ≤ 0.0001. On the left, representative confocal fluorescence images of living S. cerevisiae cells with or without deletion of IPT1 and expressing either Can1p-GFP or Pma1p-mRFP, as indicated, are shown.
4. Discussion
Sphingolipid-enriched gel domains in the plasma membrane of yeast [11] have been proposed to act as diffusion barriers [9] possibly contributing to the stability of the plasma membrane compartments [48] and to the separation of mother and daughter cell components during S. cerevisiae cell division that occurs at the budding neck [74]. Another possible function might relate to cell viability in the absence of a cell wall since in the filamentous fungus N. crassa, a much tighter packing of sphingolipid-enriched domains occurs in the cell wall-less slime strain when compared to the wt strain under similar growth conditions [59] and membrane compartmentalization of lipids and proteins is interconnected to the cell wall and responds to cell wall stress [4]. Although it has been shown that sphingolipids are crucial for the formation and properties of such gel domains [10,11], it is still unclear if these domains contain a major sphingolipid class or if they are composed by a mixture of different sphingolipids. M(IP)2C is the most abundant complex sphingolipid in S. cerevisiae, particularly at the plasma membrane [35,75], but experimental support allowing the unequivocal identification of the components of gel domains is missing.
Considering the numerous relations between sphingolipids and/or C26 very long chain fatty acids with Pma1p [27,76], it is reasonable to predict that sphingolipid-enriched regions (gel domains) and MCP may co-localize at the yeast plasma membrane, but no direct evidence to confirm this hypothesis is available. Moreover, the impact of the sphingolipid headgroup on Pma1p distribution and microenvironment in the plasma membrane of S. cerevisiae has not been elucidated.
Recent observations support the hypothesis that MCC domains are ergosterol-enriched [7]. However, it is still unknown if complex sphingolipids, particularly M(IP)2C, play a direct role in the organization of the MCC [3,15].
To address these questions, wt cells and ipt1Δ cells were compared regarding plasma membrane biophysical properties and distribution and organization of proteins referring to distinct membrane compartments. The deletion of the IPT1 gene, which leads to the lack of M(IP)2C and its replacement by MIPC [35,36], allows to evaluate how changing the polar headgroup of complex sphingolipids influences the different plasma membrane lipid domains, namely, the sphingolipid-enriched gel domains, and also how it impacts on protein distribution and microenvironment. Thus, we aimed at establishing a more direct correlation between sphingolipid-enriched domains and MCP or MCC.
We showed in this work that the formation of gel domains was not hampered by the absence of M(IP)2C as the relative abundance of these domains in the plasma membrane was similar for both S. cerevisiae wt cells and ipt1Δ cells. In fact, in ipt1Δ cells, plasma membrane gel domains are even more rigid than those found in wt cells, as reported by t-PnA time-resolved fluorescence. This can be rationalized considering that M(IP)2C is a constituent of gel domains and in ipt1Δ cells is replaced by MIPC in those domains. The lack of a second inositol phosphate group makes the polar head of MIPC smaller and less charged than that of M(IP)2C. This may allow a tighter packing of these complex sphingolipids due to less electrostatic repulsion and/or steric hindrance at the headgroup level, which may result in a tighter packing and a more rigid environment at the hydrophobic membrane core. A similar proposal has been made to explain the tighter packing of gel domains found in the plasma membrane of scs7Δ cells, which lack the 2-OH group in the fatty acyl chain of all sphingolipids, when compared with wt cells [11]. On the other hand, the polar headgroups of M(IP)2C and MIPC may confer different average transversal positions to the sphingolipid amide group and sphingolipid backbone hydroxyl groups, which leads to distinct H-bonding network at the membrane surface [77] affecting the compactness of gel domains. The biophysical differences reported in this work between wt and ipt1Δ cells suggest that M(IP)2C is an important component of gel domains in wt cells. If sphingolipid-enriched domains were mainly composed by MIPC only, and independent of M(IP)2C, then in ipt1Δ cells, which have a higher concentration of MIPC in the plasma membrane [46,78], we would observe an increase in the abundance of sphingolipid-enriched domains, but no changes in their packing. However, what we found is the opposite, i.e., an increased packing and either no changes or a very small decrease in the abundance of sphingolipid-enriched domains. Thus, in ipt1Δ cells the sphingolipid-enriched domains are probably enriched in MIPC, as compared to wt cells. This can be due either to a direct effect, i.e., the absence of M(IP)2C and its replacement by MIPC or an indirect effect that results from changing the balance of interactions between sphingolipids, including IPC, or between sphingolipids and other membrane lipids.
The loss of the IPT1 gene leads to an increase in calcium tolerance [36,79], and differential drug resistance/sensitivity phenotypes [80], or an impaired uptake of miconazole [81,82]. Such results indicate that M(IP)2C differentially affects membranes permeability or the activity of membrane proteins [80], which suggests that different direct/indirect mechanisms may be at play. It has also been suggested that in ipt1Δ S. cerevisiae cells, lowered levels of M(IP)2C or altered levels of other sphingolipids may regulate the activity of some ABC transporters such as Pdr5p and Yor1p, which have been associated with controlling phospholipid content or distribution at the plasma membrane [83,84]. Thus, alterations of membrane components other than sphingolipids could be responsible, e.g., for the decreased global fluidity of the plasma membrane in ipt1Δ cells. Sphingolipid-enriched gel domains have been proposed to serve as diffusion barriers [74], which may account, e.g., for the slow diffusion of plasma membrane proteins in yeast. Thus, the alteration in their rigidity may influence the diffusion properties of several membrane components in the plasma membrane [85], conformational freedom of proteins residing in these domains [86] or the partition of proteins in/out of these domains, namely glycosylphosphatidylinositol-anchored proteins [11].
While changing the sphingolipid headgroup has a measurable impact on the compactness of gel domains, it has no obvious effect on the lipid-dependent dipolar properties of sterol-enriched domains. With di-8-ANEPPS, our results for both fluorescence lifetime and membrane dipole potential measurements, were nearly identical for wt and ipt1Δ cells, regardless of the model system studied—GUVs, living cells or IPM. This suggests that those biophysical properties, which are strongly dependent on sterol and sterol-lipid interactions [51,61], are less dependent on the major sphingolipid headgroup. In erg6Δ cells, which have an altered sterol profile, but no noticeable changes in sphingolipid profile when compared to wt cells [87,88], the rigidity of the gel domains is not changed [11], but the fluorescence lifetime of a sterol sensitive dye is significantly different from wt cells [51]. This behavior is opposite to that found for ipt1Δ cells where the rigidity of the gel domains is increased but the fluorescence properties of di-8-ANEPPS remain unchanged when compared to wt cells. Hence, sphingolipid-enriched and ergosterol-enriched regions seem to be to a certain extent independent in the plasma membrane of yeast. Those results thus support the recent observation that sphingolipids and ergosterol do not predominate in the same membrane leaflet [89]. Nonetheless, the occurrence of sphingolipid-enriched domains in the outer leaflet does not rule out the presence of ergosterol molecules in the inner leaflet of MCP.
Regarding the protein markers of membrane compartments, it was found that Pma1p plasma membrane distribution heterogeneity and fluorescence lifetime are changed in ipt1Δ cells when compared to wt cells, whereas the same parameters remain unaltered for Can1p. Since Pma1p- and Can1p-specific membrane compartments have been described as spatially separated [1,3], and considering that changes were observed in the biophysical properties of sphingolipid-enriched domains but not in ergosterol-enriched domains, the results obtained in this work for Pma1p and Can1p support an independent compartmentalization of sphingolipid-enriched and sterol-enriched regions, and that these regions could be lipid domain counterparts of the MCP and the MCC, respectively. Currently, it is not certain which lipids compose either MCP or MCC apart from the lower ergosterol content of the former and the higher ergosterol content of the latter [15,23,86]. However, by using a lipidomic approach with styrene-maleic-acid polymers (SMAPLs) to determine which lipids surround Can1p and Pma1p, and other MCC or MCP specific proteins (periprotein lipidome), Klooster et al. [86] demonstrated that in fact the sphingolipid/ergosterol ratio is much higher in the MCP than in the MCC, while they do not differ much in periprotein phospholipid composition. The distribution pattern of Pma1p as isolated foci in the plasma membrane has been associated to the honeycomb-like hexagonal lattices observed on the plasma membrane of S. cerevisiae [1]. Moreover, it has been suggested that the lipids contained in these structures should be very compact and display a gel arrangement [1]. The results here presented, and considering the body of knowledge on the relation between sphingolipids and sterols in MCP organization, e.g., [1,26,27,28,29,30,31,32,33,86], are consistent with the presence of gel-forming sphingolipids in the composition of the MCP, providing the most simple explanation for the concomitant changes here observed in gel domains packing and Pma1p-mRFP, but not Can1p-GFP, distribution and fluorescence lifetime. The different fluorescence lifetime of Pma1p-mRFP in wt vs. ipt1∆, cells reflects a different environment for the protein. This could be due to a different refractive index in the vicinity of the protein, which could be attributed to its relocation into different domains or changes in the thickness and packing of those domains, or it could also be due to misfunction of Pma1p leading to alterations of pH and ion concentration in the vicinity of the protein. This is a subject that certainly deserves further investigation. Our data strongly suggest that the MCC does not contain gel domains, since an alteration of their compactness did not affect the properties measured for Can1p. However, it should be noted that Can1p MCC partitioning is less affected than other MCC transporters by sphingolipid stress [3].
The labelling of GUV reconstituted from plasma membrane lipid extracts of wt cells or ipt1Δ cells with both di-8-ANEPPS and Rhod-DOPE revealed a complex phase behavior where three distinct types of domains can be distinguished and related to a three-phase coexistence (ld/lo/gel). DPH steady-state fluorescence anisotropy was lower in the IPM of ipt1Δ cells, pointing to a lower global order of the membrane, which seems to contradict the higher order of the gel domains. Therefore, it seems that the remainder of the membrane is more fluid. In particular, there could be a small increase in the relative abundance and/or fluidity of ld-like domains. Upon IPT1 deletion no alterations in lo-like domains were apparent, since fluorescence decays of di-8-ANEPPS yielded similar components lifetimes and amplitudes in ipt1Δ and wt cells, and the gel domains became more rigid (and maybe slightly less abundant). Phytoceramide, the backbone of complex sphingolipids in yeast, can recruit up to 3 glycerophospholipid molecules per molecule of phytoceramide to form rigid gel phases [48]. It is possible that each M(IP)2C molecule can recruit a higher number of glycerophospholipid molecules, not only due to its double negative charge that could interact with the positive choline moiety of phosphatidylcholine, but especially because of the large size of its polar headgroup. MIPC, which is less charged and contains a smaller headgroup compared to M(IP)2C, would recruit a lower number of glycerophospholipid molecules than M(IP)2C. Thus, in ipt1Δ cells, where M(IP)2C is missing and MIPC accumulates instead, gel domains would be more rigid due to the lower content in glycerophospholipids. On another hand, these low melting temperature lipids would become more available for the formation of disordered domains, contributing to the higher global fluidity of the membrane in ipt1Δ cells. Since gel domains are more rigid in ipt1Δ cells, this would suggest that liquid domains are more disordered in this strain. It was previously confirmed with DPPC and POPC membranes with and without cholesterol, labelled with Rhod-DOPE at different probe/lipid ratios [62,90], that the higher the ⟨τ⟩ values for Rhod-DOPE the more disordered are the membrane regions into which the probe is incorporating. Therefore, the fact that ⟨τ⟩ of Rhod-DOPE in GUVs reconstituted from lipids of wt cells is lower than those prepared from lipids of ipt1Δ cells supports the hypothesis that liquid regions in the plasma membrane of ipt1Δ cells are more disordered when compared to wt cells. Additionally, considering the recent results on the Pma1p periprotein lipidome [86], where this region of the membrane is sphingolipid-enriched, but there seems to be some ergosterol present, one might hypothesize that in ipt1Δ cells the sphingolipid-enriched domains /Pma1p periprotein lipidome become even more depleted in ergosterol, which could also lead to an increased rigidity of the domains, because ergosterol may actually fluidify these domains [11]. However, it is unlikely that the changes are due to ergosterol, because there were no changes in the fluorescence parameters of di-8-ANEPPS in ipt1Δ cell membrane and, in the erg6Δ cells strain lacking ergosterol mentioned above, the rigidity of the gel domains was not different from the wt.
This work points to a role of the polar headgroup of complex sphingolipids in the organization of Pma1p in the plasma membrane of S. cerevisiae. Also, in C. neoformans the complex sphingolipid headgroup has been related with Pma1p oligomerization and transport [28]. By regulating the rigidity/order of gel domains, sphingolipid polar headgroups may thus contribute to control Pma1p stability, distribution, and oligomerization in the plasma membrane. However, a specific interaction of M(IP)2C, having an extra inositol phosphate group as compared to MIPC, with the protein cannot be ruled out. If the lipid annulus surrounding the protein is different, e.g., in terms of number of lipid rings, the fraction of annular or non-annular complex sphingolipid may change, resulting in a different overall packing within the sphingolipid-enriched domains.
The present work shows how the headgroup structure of complex sphingolipids can be an important determinant in the organization of plasma membrane lipids and proteins in S. cerevisiae. Recently, we showed that the polyene antifungal nystatin forms active pores in membranes lacking any sterol, but containing gel domains [12], challenging the classical model which describes the molecular mode of action of nystatin through an ergosterol-dependent mechanism. Moreover, the action of other antifungal drugs has been shown to involve an interplay with sphingolipids that is conditioned by their headgroup structure. S. cerevisiae cells defective in M(IP)2C are resistant to zymocin [37]. Moreover, zymocin requires an active Pma1p proton pump to exert its toxicity. These observations can be related to our results supporting a close relation between MCP and sphingolipid-enriched domains. The sphingolipid headgroup also influences the antifungal activity of the lipopeptide syringomycin E [38]. Fungi lacking M(IP)2C, and accumulating MIPC, become resistant to syringomycin E. Syringomycin E acts on the membrane forming channels causing K+ efflux and Ca2+ influx. The complete absence of M(IP)2C hampers syringomycin E toxicity. Since in ipt1Δ cells, gel domains become more tightly packed, this might hinder the insertion of syringomycin E acyl chain into the membrane. An independent study supporting the importance of sphingolipid-dependent biophysical properties shows that scs7Δ cells, where sphingolipid-enriched domains are also more rigid than in wt cells [11], are also more resistant to the action of syringomycin E. Since the lack of M(IP)2C leads to a tightening of gel domains, as well as to an altered distribution of Pma1p, it is possible that membrane proteins, alongside lipid composition, are also important for the susceptibility to syringomycin E. This is further supported by the observation that Pma1p proper functioning is crucial for the virulent activity of pathogenic fungi [28,91,92]. The apparent requirement of intact MCP/M(IP)2C domains for the action of syringomycin E is supported by the fact that cumulative conditions of MIPC accumulation and absence of M(IP)2C lead to resistance; yet higher levels of MIPC, when M(IP)2C is still produced, do not change the sensitivity phenotype [93]. A better understanding of sphingolipids role in yeast plasma membrane organization, particularly, in domain formation, may thus be an important contribute to clarify antifungal molecular targets and mode of action.
Gournas and collaborators showed that sphingolipids are required for the slower diffusion of Can1p in the MCC [8] and, presented different hypothesis for the still unknown mechanism [3]. Our results seem to rule out the hypothesis that M(IP)2C is directly required for the conformation-dependent anchoring of the protein transporters in the MCC, since its absence does not alter any measured property of Can1p. Also, in this work we observed diverse membrane reorganizations upon IPT1 deletion, including changes in global plasma membrane fluidity, and yet no significant alterations were detected for Can1p, which seems to discard the hypothesis that the partitioning of Can1p into the MCC could be indirectly affected by a general alteration of plasma membrane organization. Our results did not confirm neither reject the possibility that sphingolipids depletion could lead to a concomitant decrease of ergosterol levels in eisosomes, since ergosterol levels are similar in both ipt1Δ cells and wt cells and we show that some of the sterol-dependent properties are not significantly changed in the plasma membrane of ipt1Δ cells when compared to wt cells. However, another scenario is still possible, where sphingolipid-enriched domains act as diffusional barriers and are neighboring the MCC, thus preventing movement of Can1p. The change in sphingolipid levels may induce an alteration of the relative arrangement of yeast compartments, indirectly affecting those that are not sphingolipid-enriched.
5. Conclusions
There are still many unaddressed questions regarding lipid–protein interactions in the plasma membrane of fungi. Disclosing the mechanism of membrane compartments formation, their lipid composition and interrelations will hopefully lead to significant advances in membrane biology, but their investigation is also driven by the importance of some of these compartments in the pathogenicity of clinically relevant fungal species.
The identification of gel domains under physiological conditions was an important finding but the specific molecular constitution of those domains is unknown. Four different fluorescent probes, t-PnA, DPH, di-8-ANEPPS, and Rhod-DOPE, were used to label yeast plasma membrane, in living cells and IPM and in reconstituted systems, namely GUV made from plasma membrane lipid extracts. The set of probes employed yields complementary information that enables a comprehensive picture of the biophysical changes taking place at the plasma membrane upon the loss of M(IP)2C synthesis ability. With this work, it became clear that M(IP)2C is important for the regulation of gel domains in the plasma membrane of yeast, since in cells unable to synthesize this complex sphingolipid these domains are more rigid. In the future, co-localization studies with Pma1p-mRFP, and Can1p-GFP-containing wt cells [23], ipt1Δ cells and other strains with mutations in sphingolipid (and sterol) metabolism will provide invaluable insights to further understand the intricate relation between membrane lipid composition, biophysical properties, and membrane compartments organization and function in yeast.
Our results also help to clarify the interrelation between sphingolipids, M(IP)2C in this case, and Pma1p or Can1p. Diverse results in the literature point to a dependence of Pma1p proper sorting with intact sphingolipid synthesis. Here, we demonstrate a direct correlation between sphingolipid polar headgroup and protein distribution. Pma1p distribution is more heterogeneous in ipt1Δ cells, whereas Can1p distribution, if affected at all, becomes slightly more homogeneous. This suggests that M(IP)2C is directly involved in the organization of MCP, but possibly not of MCC. The concomitant alteration in the rigidity of gel domains and Pma1p distribution supports a close communication between gel domains and MCP. On the other hand, MCC and ergosterol-enriched domains did not undergo any noticeable changes upon a major alteration of complex sphingolipid profile, which corroborates that MCC and ergosterol co-localize, further supporting that M(IP)2C is not an important constituent of ergosterol-enriched domains.
Supplementary Materials
The following are available online at https://www.mdpi.com/2218-273X/10/6/871/s1, Figure S1: Fluorescence intensity decay of t-PnA in wt and ipt1Δ cell suspensions at 24 °C. Figure S2: Relation between the mean intensity of fluorescence along the plasma membrane of each protein, Can1p or Pma1p, for each cell and respective heterogeneity. Figure S3: The lifetime of the long component of t-PnA is essentially identical in growth media SC and YPD. Figure S4: The deletion of IPT1 does not lead to significant differences between intact cells and isolated plasma membrane (IPM) in the sphingolipid-enriched domains. Figure S5: Can1p-GFP and Pma1p-mRFP mean fluorescence intensity in the plasma membrane of wt and ipt1Δ cells. Table S1: Parameters describing the fluorescence intensity decays of Can1p-GFP and Pma1p-mRFP in the plasma membrane of S. cerevisiae wt and ipt1Δ cells.
Author Contributions
Conceptualization, R.F.M.d.A.; methodology, H.S.M., T.K., P.M.R.P. and R.F.M.d.A.; formal analysis, A.B.-O., F.C.S., J.T.M., H.S.M.; T.K., and P.M.R.P.; investigation, A.B.-O., F.C.S. and J.T.M.; resources, H.S.M., A.H., P.M.R.P. and R.F.M.d.A.; data curation, H.S.M., T.K. and P.M.R.P.; writing—original draft preparation, A.B.-O., F.C.S., J.T.M. and R.F.M.d.A.; writing—review and editing, H.S.M. and A.H.; visualization, A.B.-O., F.C.S. and J.T.M.; supervision, R.F.M.d.A.; funding acquisition, R.F.M.d.A. All authors have read and agreed to the published version of the manuscript.
Funding
This research was funded by Fundação para a Ciência e a Tecnologia, F.C.T., I.P., through research grants PTDC/BBB-BQB/6071/2014, UID/Multi/00612/2019 and UIDB/00100/2020, and doctoral scholarships to F.C.S. (SFRH/BD/108031/2015) and A.B.-O. (SFRH/BD/145600/2019).
Acknowledgments
The authors thank Guido Grossmann and Widmar Tanner (University of Regensburg, Germany) that generously provided plasmid Ylp211-CAN1-GFP (URA3) and Ylp128-PMA1-mRFP (LEU2). We wish to thank Luísa Cyrne (Universidade de Lisboa, Portugal) for helping with the yeast cells transformation.
Conflicts of Interest
The authors declare no conflict of interest.
References
- Malinsky, J.; Opekarova, M. New Insight into the Roles of Membrane Microdomains in Physiological Activities of Fungal Cells. Int. Rev. Cell Mol. Biol. 2016, 325, 119–180. [Google Scholar] [CrossRef] [PubMed]
- Zahumensky, J.; Malinsky, J. Role of MCC/Eisosome in Fungal Lipid Homeostasis. Biomolecules 2019, 9, 305. [Google Scholar] [CrossRef] [PubMed]
- Athanasopoulos, A.; André, B.; Sophianopoulou, V.; Gournas, C. Fungal Plasma Membrane Domains. FEMS Microbiol. Rev. 2019. [Google Scholar] [CrossRef] [PubMed]
- De Almeida, R.F.M. A route to understanding yeast cellular envelope—Plasma membrane lipids interplaying in cell wall integrity. FEBS J. 2018. [Google Scholar] [CrossRef]
- Ganguly, S.; Singh, P.; Manoharlal, R.; Prasad, R.; Chattopadhyay, A. Differential dynamics of membrane proteins in yeast. Biochem. Biophys. Res. Commun. 2009, 387, 661–665. [Google Scholar] [CrossRef]
- Valdez-Taubas, J.; Pelham, H.R. Slow diffusion of proteins in the yeast plasma membrane allows polarity to be maintained by endocytic cycling. Curr. Biol. CB 2003, 13, 1636–1640. [Google Scholar] [CrossRef]
- Bianchi, F.; Syga, Ł.; Moiset, G.; Spakman, D.; Schavemaker, P.E.; Punter, C.M.; Seinen, A.-B.; van Oijen, A.M.; Robinson, A.; Poolman, B. Steric exclusion and protein conformation determine the localization of plasma membrane transporters. Nat.Commun. 2018, 9, 501. [Google Scholar] [CrossRef]
- Gournas, C.; Gkionis, S.; Carquin, M.; Twyffels, L.; Tyteca, D.; André, B. Conformation-dependent partitioning of yeast nutrient transporters into starvation-protective membrane domains. Proc. Natl. Acad. Sci. USA 2018, 115, E3145–E3154. [Google Scholar] [CrossRef]
- De Almeida, R.F.; Joly, E. Crystallization around solid-like nanosized docks can explain the specificity, diversity, and stability of membrane microdomains. Front. Plant Sci. 2014, 5, 72. [Google Scholar] [CrossRef]
- Vecer, J.; Vesela, P.; Malinsky, J.; Herman, P. Sphingolipid levels crucially modulate lateral microdomain organization of plasma membrane in living yeast. FEBS Lett. 2014, 588, 443–449. [Google Scholar] [CrossRef]
- Aresta-Branco, F.; Cordeiro, A.M.; Marinho, H.S.; Cyrne, L.; Antunes, F.; de Almeida, R.F. Gel domains in the plasma membrane of Saccharomyces cerevisiae: Highly ordered, ergosterol-free, and sphingolipid-enriched lipid rafts. J. Biol. Chem. 2011, 286, 5043–5054. [Google Scholar] [CrossRef] [PubMed]
- Dos Santos, A.G.; Marquês, J.T.; Carreira, A.C.; Castro, I.R.; Viana, A.S.; Mingeot-Leclercq, M.P.; de Almeida, R.F.M.; Silva, L.C. The molecular mechanism of Nystatin action is dependent on the membrane biophysical properties and lipid composition. Phys. Chem. Chem. Phys. 2017, 19, 30078–30088. [Google Scholar] [CrossRef] [PubMed]
- Stradalova, V.; Stahlschmidt, W.; Grossmann, G.; Blazikova, M.; Rachel, R.; Tanner, W.; Malinsky, J. Furrow-like invaginations of the yeast plasma membrane correspond to membrane compartment of Can1. J. Cell Sci. 2009, 122, 2887–2894. [Google Scholar] [CrossRef] [PubMed]
- Walther, T.C.; Brickner, J.H.; Aguilar, P.S.; Bernales, S.; Pantoja, C.; Walter, P. Eisosomes mark static sites of endocytosis. Nature 2006, 439, 998–1003. [Google Scholar] [CrossRef]
- Grossmann, G.; Opekarova, M.; Malinsky, J.; Weig-Meckl, I.; Tanner, W. Membrane potential governs lateral segregation of plasma membrane proteins and lipids in yeast. EMBO J. 2007, 26, 1–8. [Google Scholar] [CrossRef]
- Berchtold, D.; Piccolis, M.; Chiaruttini, N.; Riezman, I.; Riezman, H.; Roux, A.; Walther, T.C.; Loewith, R. Plasma membrane stress induces relocalization of Slm proteins and activation of TORC2 to promote sphingolipid synthesis. Nat. Cell Biol. 2012, 14, 542–547. [Google Scholar] [CrossRef]
- Douglas, L.M.; Konopka, J.B. Plasma membrane architecture protects Candida albicans from killing by copper. PLoS Genet. 2019, 15, e1007911. [Google Scholar] [CrossRef]
- Douglas, L.M.; Wang, H.X.; Keppler-Ross, S.; Dean, N.; Konopka, J.B. Sur7 promotes plasma membrane organization and is needed for resistance to stressful conditions and to the invasive growth and virulence of Candida albicans. mBio 2012, 3. [Google Scholar] [CrossRef]
- Pedroso, N.; Matias, A.C.; Cyrne, L.; Antunes, F.; Borges, C.; Malho, R.; de Almeida, R.F.M.; Herrero, E.; Marinho, H.S. Modulation of plasma membrane lipid profile and microdomains by H2O2 in Saccharomyces cerevisiae. Free Radic. Biol. Med. 2009, 46, 289–298. [Google Scholar] [CrossRef]
- Dupont, S.; Beney, L.; Ritt, J.F.; Lherminier, J.; Gervais, P. Lateral reorganization of plasma membrane is involved in the yeast resistance to severe dehydration. Biochim. Biophys. Acta 2010, 1798, 975–985. [Google Scholar] [CrossRef]
- Grossmann, G.; Malinsky, J.; Stahlschmidt, W.; Loibl, M.; Weig-Meckl, I.; Frommer, W.B.; Opekarova, M.; Tanner, W. Plasma membrane microdomains regulate turnover of transport proteins in yeast. J. Cell Biol. 2008, 183, 1075–1088. [Google Scholar] [CrossRef] [PubMed]
- Herman, P.; Vecer, J.; Opekarova, M.; Vesela, P.; Jancikova, I.; Zahumensky, J.; Malinsky, J. Depolarization affects the lateral microdomain structure of yeast plasma membrane. FEBS J. 2015, 282, 419–434. [Google Scholar] [CrossRef] [PubMed]
- Malinska, K.; Malinsky, J.; Opekarova, M.; Tanner, W. Visualization of protein compartmentation within the plasma membrane of living yeast cells. Mol. Biol. Cell 2003, 14, 4427–4436. [Google Scholar] [CrossRef] [PubMed]
- Serrano, R. Transport across yeast vacuolar and plasma membrane. In The Molecular and Cellular Biology of the Yeast Saccharomyces: Genome Dynamics, Protein Synthesis, and Energetics; Broach, J.R., Jones, E.W., Pringle, J.R., Eds.; Cold Spring Harbor Laboratory Press: Cold Spring Harbor, NY, USA, 1991; Volume 21, pp. 523–585. [Google Scholar]
- Kane, P.M. Proton Transport and pH Control in Fungi. Adv. Exp. Med. Biol. 2016, 892, 33–68. [Google Scholar] [CrossRef]
- Bagnat, M.; Chang, A.; Simons, K. Plasma membrane proton ATPase Pma1p requires raft association for surface delivery in yeast. Mol. Biol. Cell 2001, 12, 4129–4138. [Google Scholar] [CrossRef]
- Gaigg, B.; Toulmay, A.; Schneiter, R. Very long-chain fatty acid-containing lipids rather than sphingolipids per se are required for raft association and stable surface transport of newly synthesized plasma membrane ATPase in yeast. J. Biol. Chem. 2006, 281, 34135–34145. [Google Scholar] [CrossRef]
- Farnoud, A.M.; Mor, V.; Singh, A.; Del Poeta, M. Inositol phosphosphingolipid phospholipase C1 regulates plasma membrane ATPase (Pma1) stability in Cryptococcus neoformans. FEBS Lett. 2014, 588, 3932–3938. [Google Scholar] [CrossRef]
- Munshi, M.A.; Gardin, J.M.; Singh, A.; Luberto, C.; Rieger, R.; Bouklas, T.; Fries, B.C.; Del Poeta, M. The Role of Ceramide Synthases in the Pathogenicity of Cryptococcus neoformans. Cell Rep. 2018, 22, 1392–1400. [Google Scholar] [CrossRef]
- Wang, Q.; Chang, A. Sphingoid base synthesis is required for oligomerization and cell surface stability of the yeast plasma membrane ATPase, Pma1. Proc. Natl. Acad. Sci. USA 2002, 99, 12853–12858. [Google Scholar] [CrossRef]
- Lauwers, E.; Andre, B. Association of yeast transporters with detergent-resistant membranes correlates with their cell-surface location. Traffic 2006, 7, 1045–1059. [Google Scholar] [CrossRef]
- Lauwers, E.; Grossmann, G.; Andre, B. Evidence for coupled biogenesis of yeast Gap1 permease and sphingolipids: Essential role in transport activity and normal control by ubiquitination. Mol. Biol. Cell 2007, 18, 3068–3080. [Google Scholar] [CrossRef] [PubMed]
- Lee, M.C.; Hamamoto, S.; Schekman, R. Ceramide biosynthesis is required for the formation of the oligomeric H+-ATPase Pma1p in the yeast endoplasmic reticulum. J. Biol. Chem. 2002, 277, 22395–22401. [Google Scholar] [CrossRef] [PubMed]
- Ferreira, T.; Mason, A.B.; Slayman, C.W. The yeast Pma1 proton pump: A model for understanding the biogenesis of plasma membrane proteins. J. Biol. Chem. 2001, 276, 29613–29616. [Google Scholar] [CrossRef] [PubMed]
- Leber, A.; Fischer, P.; Schneiter, R.; Kohlwein, S.D.; Daum, G. The yeast mic2 mutant is defective in the formation of mannosyl-diinositolphosphorylceramide. FEBS Lett. 1997, 411, 211–214. [Google Scholar] [CrossRef]
- Dickson, R.C.; Nagiec, E.E.; Wells, G.B.; Nagiec, M.M.; Lester, R.L. Synthesis of mannose-(inositol-P)(2)-ceramide, the major sphingolipid in Saccharomyces cerevisiae, requires the IPT1 (YDR072c) gene. J. Biol. Chem. 1997, 272, 29620–29625. [Google Scholar] [CrossRef] [PubMed]
- Zink, S.; Mehlgarten, C.; Kitamoto, H.K.; Nagase, J.; Jablonowski, D.; Dickson, R.C.; Stark, M.J.R.; Schaffrath, R. Mannosyl-diinositolphospho-ceramide, the major yeast plasma membrane sphingolipid, governs toxicity of Kluyveromyces lactis zymocin. Eukaryot. Cell 2005, 4, 879–889. [Google Scholar] [CrossRef]
- Stock, S.D.; Hama, H.; Radding, J.A.; Young, D.A.; Takemoto, J.Y. Syringomycin E inhibition of Saccharomyces cerevisiae: Requirement for biosynthesis of sphingolipids with very-long-chain fatty acids and mannose- and phosphoinositol-containing head groups. Antimicrob. Agents Chemother. 2000, 44, 1174–1180. [Google Scholar] [CrossRef]
- Thevissen, K.; Cammue, B.P.; Lemaire, K.; Winderickx, J.; Dickson, R.C.; Lester, R.L.; Ferket, K.K.; Van Even, F.; Parret, A.H.; Broekaert, W.F. A gene encoding a sphingolipid biosynthesis enzyme determines the sensitivity of Saccharomyces cerevisiae to an antifungal plant defensin from dahlia (Dahlia merckii). Proc. Natl. Acad. Sci. USA 2000, 97, 9531–9536. [Google Scholar] [CrossRef]
- Gietz, D.; St Jean, A.; Woods, R.A.; Schiestl, R.H. Improved method for high efficiency transformation of intact yeast cells. Nucleic Acids Res. 1992, 20, 1425. [Google Scholar] [CrossRef]
- Johnson, I.; Spence, M.T.Z. (Eds.) The Molecular Probes Handbook—A Guide to Fluorescent Probes and Labeling Technologies; Life Technologies Corporation: Carlsbad, CA, USA, 2010. [Google Scholar]
- Branco, M.R.; Marinho, H.S.; Cyrne, L.; Antunes, F. Decrease of H2O2 Plasma Membrane Permeability during Adaptation to H2O2 in Saccharomyces cerevisiae. J. Biol. Chem. 2004, 279, 6501–6506. [Google Scholar] [CrossRef]
- Panaretou, B.; Piper, P. Isolation of yeast plasma membranes. Methods Mol. Biol. 2006, 313, 27–32. [Google Scholar] [PubMed]
- Bligh, E.G.; Dyer, W.J. A rapid method of total lipid extraction and purification. Can. J. Biochem. Physiol. 1959, 37, 911–917. [Google Scholar] [CrossRef] [PubMed]
- McClare, C.W. An accurate and convenient organic phosphorus assay. Anal. Biochem. 1971, 39, 527–530. [Google Scholar] [CrossRef]
- Daum, G.; Tuller, G.; Nemec, T.; Hrastnik, C.; Balliano, G.; Cattel, L.; Milla, P.; Rocco, F.; Conzelmann, A.; Vionnet, C.; et al. Systematic analysis of yeast strains with possible defects in lipid metabolism. Yeast 1999, 15, 601–614. [Google Scholar] [CrossRef]
- Angelova, M.I.; Soléau, S.; Méléard, P.; Faucon, F.; Bothorel, P. Preparation of giant vesicles by external AC electric fields. Kinetics and applications. In Trends in Colloid and Interface Science VI; Steinkopff: Darmstadt, Germany, 1992; pp. 127–131. [Google Scholar]
- Marques, J.T.; Cordeiro, A.M.; Viana, A.S.; Herrmann, A.; Marinho, H.S.; de Almeida, R.F. Formation and Properties of Membrane-Ordered Domains by Phytoceramide: Role of Sphingoid Base Hydroxylation. Langmuir ACS J. Surf. Colloids 2015, 31, 9410–9421. [Google Scholar] [CrossRef]
- Bastos, A.E.; Scolari, S.; Stockl, M.; Almeida, R.F. Applications of fluorescence lifetime spectroscopy and imaging to lipid domains in vivo. In Methods Enzymol; Conn, P.M., Ed.; Academic Press: Burlington, MA, USA, 2012; Volume 504, pp. 57–81. [Google Scholar] [CrossRef]
- Haldar, S.; Kanaparthi, R.K.; Samanta, A.; Chattopadhyay, A. Differential Effect of Cholesterol and Its Biosynthetic Precursors on Membrane Dipole Potential. Biophys. J. 2012, 102, 1561–1569. [Google Scholar] [CrossRef]
- Khmelinskaia, A.; Marques, J.M.; Bastos, A.E.; Antunes, C.A.; Bento-Oliveira, A.; Scolari, S.; Lobo, G.M.; Herrmann, A.; Marinho, H.S.; de Almeida, R.F. Liquid-ordered phase formation by mammalian and yeast sterols: A common feature with organizational differences. Front. Cell Dev. Biol. 2020. Accepted. [Google Scholar] [CrossRef]
- Francisco, A.P.; Botequim, D.; Prazeres, D.M.F.; Serra, V.V.; Costa, S.M.B.; Laia, C.A.T.; Paulo, P.M.R. Extreme Enhancement of Single-Molecule Fluorescence from Porphyrins Induced by Gold Nanodimer Antennas. J. Phys. Chem. Lett. 2019, 10, 1542–1549. [Google Scholar] [CrossRef]
- Sklar, L.A.; Hudson, B.S.; Simoni, R.D. Conjugated polyene fatty acids as fluorescent probes: Synthetic phospholipid membrane studies. Biochemistry 1977, 16, 819–828. [Google Scholar] [CrossRef]
- De Almeida, R.F.; Loura, L.M.; Prieto, M. Membrane lipid domains and rafts: Current applications of fluorescence lifetime spectroscopy and imaging. Chem. Phys. Lipids 2009, 157, 61–77. [Google Scholar] [CrossRef]
- Mateo, C.R.; Brochon, J.C.; Lillo, M.P.; Acuna, A.U. Lipid Clustering in Bilayers Detected by the Fluorescence Kinetics and Anisotropy of Trans-Parinaric Acid. Biophys. J. 1993, 65, 2237–2247. [Google Scholar] [CrossRef]
- Davenport, L. [24] Fluorescence probes for studying membrane heterogeneity. In Methods in Enzymology; Academic Press: Cambridge, MA, USA, 1997; Volume 278, pp. 487–512. [Google Scholar]
- Florine-Casteel, K.; Feigenson, G.W. On the use of partition coefficients to characterize the distribution of fluorescent membrane probes between coexisting gel and fluid lipid phases: An analysis of the partition behavior of 1,6-diphenyl-1,3,5-hexatriene. Biochim. Biophys. Acta (BBA) Biomembr. 1988, 941, 102–106. [Google Scholar] [CrossRef]
- Lentz, B.R. Membrane “Fluidity” from Fluorescent Anisotropy Measurements. In Spectroscopic Membrane Probes; Loew, M.L., Ed.; CRC press: Boca Raton, FL, USA, 1988; pp. 13–41. [Google Scholar]
- Santos, F.C.; Fernandes, A.S.; Antunes, C.A.; Moreira, F.P.; Videira, A.; Marinho, H.S.; de Almeida, R.F. Reorganization of plasma membrane lipid domains during conidial germination. Biochim. Biophys. Acta 2017, 1862, 156–166. [Google Scholar] [CrossRef] [PubMed]
- Silva, L.; Coutinho, A.; Fedorov, A.; Prieto, M. Competitive binding of cholesterol and ergosterol to the polyene antibiotic nystatin. A fluorescence study. Biophys. J. 2006, 90, 3625–3631. [Google Scholar] [CrossRef] [PubMed]
- Amaro, M.; Reina, F.; Hof, M.; Eggeling, C.; Sezgin, E. Laurdan and Di-4-ANEPPDHQ probe different properties of the membrane. J. Phys. D Appl. Phys. 2017, 50. [Google Scholar] [CrossRef] [PubMed]
- Bastos, A.E.P.; Marinho, H.S.; Cordeiro, A.M.; de Soure, A.M.; de Almeida, R.F.M. Biophysical properties of ergosterol-enriched lipid rafts in yeast and tools for their study: Characterization of ergosterol/phosphatidylcholine membranes with three fluorescent membrane probes. Chem. Phys. Lipids 2012, 165, 577–588. [Google Scholar] [CrossRef]
- De Almeida, R.F.; Borst, J.; Fedorov, A.; Prieto, M.; Visser, A.J. Complexity of lipid domains and rafts in giant unilamellar vesicles revealed by combining imaging and microscopic and macroscopic time-resolved fluorescence. Biophys. J. 2007, 93, 539–553. [Google Scholar] [CrossRef]
- González-Ramírez, E.J.; Goñi, F.M.; Alonso, A. Mixing brain cerebrosides with brain ceramides, cholesterol and phospholipids. Sci. Rep. 2019, 9, 13326. [Google Scholar] [CrossRef]
- Pinto, S.N.; Fernandes, F.; Fedorov, A.; Futerman, A.H.; Silva, L.C.; Prieto, M. A combined fluorescence spectroscopy, confocal and 2-photon microscopy approach to re-evaluate the properties of sphingolipid domains. Biochim. Biophys. Acta 2013, 1828, 2099–2110. [Google Scholar] [CrossRef]
- Fluhler, E.; Burnham, V.G.; Loew, L.M. Spectra, membrane binding, and potentiometric responses of new charge shift probes. Biochemistry 1985, 24, 5749–5755. [Google Scholar] [CrossRef]
- Cotlet, M.; Hofkens, J.; Maus, M.; Gensch, T.; Van der Auweraer, M.; Michiels, J.; Dirix, G.; Van Guyse, M.; Vanderleyden, J.; Visser, A.J.W.G.; et al. Excited-State Dynamics in the Enhanced Green Fluorescent Protein Mutant Probed by Picosecond Time-Resolved Single Photon Counting Spectroscopy. J. Phys. Chem. B 2001, 105, 4999–5006. [Google Scholar] [CrossRef]
- Heikal, A.A.; Hess, S.T.; Webb, W.W. Multiphoton molecular spectroscopy and excited-state dynamics of enhanced green fluorescent protein (EGFP): Acid–base specificity. Chem. Phys. 2001, 274, 37–55. [Google Scholar] [CrossRef]
- Suhling, K.; Siegel, J.; Phillips, D.; French, P.M.W.; Lévêque-Fort, S.; Webb, S.E.D.; Davis, D.M. Imaging the Environment of Green Fluorescent Protein. Biophys. J. 2002, 83, 3589–3595. [Google Scholar] [CrossRef]
- Suhling, K.; Davis, D.; Petrasek, Z.; Siegel, J.; Phillips, D. Influence of the refractive index on EGFP fluorescence lifetimes in mixtures of water and glycerol. Proc. SPIE 2001, 4259, 92–101. [Google Scholar] [CrossRef]
- Petrov, J.G.; Pfohl, T.; Möhwald, H. Ellipsometric Chain Length Dependence of Fatty Acid Langmuir Monolayers. A Heads-and-Tails Model. J. Phys. Chem. B 1999, 103, 3417–3424. [Google Scholar] [CrossRef]
- Kienle, D.F.; de Souza, J.V.; Watkins, E.B.; Kuhl, T.L. Thickness and refractive index of DPPC and DPPE monolayers by multiple-beam interferometry. Anal. Bioanal. Chem. 2014, 406, 4725–4733. [Google Scholar] [CrossRef]
- Fajardo-Somera, R.A.; Bowman, B.; Riquelme, M. The plasma membrane proton pump PMA-1 is incorporated into distal parts of the hyphae independently of the Spitzenkorper in Neurospora crassa. Eukaryot. Cell 2013, 12, 1097–1105. [Google Scholar] [CrossRef]
- Clay, L.; Caudron, F.; Denoth-Lippuner, A.; Boettcher, B.; Frei, S.B.; Snapp, E.L.; Barral, Y. A sphingolipid-dependent diffusion barrier confines ER stress to the yeast mother cell. Elife 2014, 3. [Google Scholar] [CrossRef]
- Ejsing, C.S.; Sampaio, J.L.; Surendranath, V.; Duchoslav, E.; Ekroos, K.; Klemm, R.W.; Simons, K.; Shevchenko, A. Global analysis of the yeast lipidome by quantitative shotgun mass spectrometry. Proc. Natl. Acad. Sci. USA 2009, 106, 2136–2141. [Google Scholar] [CrossRef]
- Gaigg, B.; Timischl, B.; Corbino, L.; Schneiter, R. Synthesis of sphingolipids with very long chain fatty acids but not ergosterol is required for routing of newly synthesized plasma membrane ATPase to the cell surface of yeast. J. Biol. Chem. 2005, 280, 22515–22522. [Google Scholar] [CrossRef]
- Marques, J.T.; Marinho, H.S.; de Almeida, R.F.M. Sphingolipid hydroxylation in mammals, yeast and plants—An integrated view. Prog. Lipid Res. 2018, 71, 18–42. [Google Scholar] [CrossRef] [PubMed]
- Tani, M.; Toume, M. Alteration of complex sphingolipid composition and its physiological significance in yeast Saccharomyces cerevisiae lacking vacuolar ATPase. Microbiology 2015, 161, 2369–2383. [Google Scholar] [CrossRef] [PubMed]
- Dickson, R.C. Thematic Review Series: Sphingolipids. New insights into sphingolipid metabolism and function in budding yeast. J. Lipid Res. 2008, 49, 909–921. [Google Scholar] [CrossRef] [PubMed]
- Hallstrom, T.C.; Lambert, L.; Schorling, S.; Balzi, E.; Goffeau, A.; Moye-Rowley, W.S. Coordinate control of sphingolipid biosynthesis and multidrug resistance in Saccharomyces cerevisiae. J. Biol. Chem. 2001, 276, 23674–23680. [Google Scholar] [CrossRef]
- Tanaka, S.; Tani, M. Mannosylinositol phosphorylceramides and ergosterol coodinately maintain cell wall integrity in the yeast Saccharomyces cerevisiae. FEBS J. 2018, 285, 2405–2427. [Google Scholar] [CrossRef]
- Morimoto, Y.; Tani, M. Synthesis of mannosylinositol phosphorylceramides is involved in maintenance of cell integrity of yeast Saccharomyces cerevisiae. Mol. Microbiol. 2015, 95, 706–722. [Google Scholar] [CrossRef]
- Kean, L.S.; Grant, A.M.; Angeletti, C.; Mahé, Y.; Kuchler, K.; Fuller, R.S.; Nichols, J.W. Plasma membrane translocation of fluorescent-labeled phosphatidylethanolamine is controlled by transcription regulators, PDR1 and PDR3. J. Cell Biol. 1997, 138, 255–270. [Google Scholar] [CrossRef]
- Decottignies, A.; Grant, A.M.; Nichols, J.W.; de Wet, H.; McIntosh, D.B.; Goffeau, A. ATPase and Multidrug Transport Activities of the Overexpressed Yeast ABC Protein Yor1p. J. Biol. Chem. 1998, 273, 12612–12622. [Google Scholar] [CrossRef]
- Ratto, T.V.; Longo, M.L. Obstructed diffusion in phase-separated supported lipid bilayers: A combined atomic force microscopy and fluorescence recovery after photobleaching approach. Biophys. J. 2002, 83, 3380–3392. [Google Scholar] [CrossRef]
- Van‘t Klooster, J.S.; Cheng, T.Y.; Sikkema, H.R.; Jeucken, A.; Moody, B.; Poolman, B. Periprotein lipidomes of Saccharomyces cerevisiae provide a flexible environment for conformational changes of membrane proteins. Elife 2020, 9. [Google Scholar] [CrossRef]
- Guan, X.L.; Souza, C.M.; Pichler, H.; Dewhurst, G.; Schaad, O.; Kajiwara, K.; Wakabayashi, H.; Ivanova, T.; Castillon, G.A.; Piccolis, M.; et al. Functional Interactions between Sphingolipids and Sterols in Biological Membranes Regulating Cell Physiology. Mol. Biol. Cell 2009, 20, 2083–2095. [Google Scholar] [CrossRef] [PubMed]
- Swain, E.; Baudry, K.; Stukey, J.; McDonough, V.; Germann, M.; Nickels, J.T. Sterol-dependent regulation of sphingolipid metabolism in Saccharomyces cerevisiae. J. Biol. Chem. 2002, 277, 26177–26184. [Google Scholar] [CrossRef] [PubMed]
- Solanko, L.M.; Sullivan, D.P.; Sere, Y.Y.; Szomek, M.; Lunding, A.; Solanko, K.A.; Pizovic, A.; Stanchev, L.D.; Pomorski, T.G.; Menon, A.K.; et al. Ergosterol is mainly located in the cytoplasmic leaflet of the yeast plasma membrane. Traffic 2018, 19, 198–214. [Google Scholar] [CrossRef] [PubMed]
- Castro, B.M.; de Almeida, R.F.M.; Fedorov, A.; Prieto, M. The photophysics of a Rhodamine head labeled phospholipid in the identification and characterization of membrane lipid phases. Chem. Phys. Lipids 2012, 165, 311–319. [Google Scholar] [CrossRef] [PubMed]
- Stewart, E.; Gow, N.A.; Bowen, D.V. Cytoplasmic alkalinization during germ tube formation in Candida albicans. J. Gen. Microbiol. 1988, 134, 1079–1087. [Google Scholar] [CrossRef] [PubMed]
- Mahanty, S.K.; Gupta, P.; Banerjee, U.; Fotedar, R.; Prasad, R. Defective plasma membrane H(+)-ATPase or orthovanadate resistant mutants from Candida albicans, a pathogenic yeast. Biochem. Int. 1990, 22, 11–20. [Google Scholar]
- Stock, S.D.; Hama, H.; DeWald, D.B.; Takemoto, J.Y. SEC14-dependent secretion in Saccharomyces cerevisiae. Nondependence on sphingolipid synthesis-coupled diacylglycerol production. J. Biol. Chem. 1999, 274, 12979–12983. [Google Scholar] [CrossRef]
© 2020 by the authors. Licensee MDPI, Basel, Switzerland. This article is an open access article distributed under the terms and conditions of the Creative Commons Attribution (CC BY) license (http://creativecommons.org/licenses/by/4.0/).