Abstract
Investigating the extinction properties in dense molecular clouds is of significant importance for understanding the behavior of interstellar dust and its impact on observations. In this study, we comprehensively examined the extinction law in the Ophiuchus cloud across a wavelength range from 0.8 m to 8 m. To achieve this, we analyzed NIR and MIR data obtained from the UKIDSS GCS and the Spitzer c2d survey, respectively. By fitting a series of color–color diagrams, we determined color-excess ratios for seven passbands. These ratios were then directly converted to derive the relative extinction law . Our findings demonstrate that the Ophiuchus cloud exhibits a characteristic of flat MIR extinction, consistent with previous studies. Additionally, our results reveal variations in the extinction law with extinction depth, indicating a flatter trend from the NIR to MIR bands as extinction increases. Notably, our analysis reveals no significant difference in the MIR extinction law among the four dark clouds: L1712, L1689, L1709, and L1688. However, distinct variations were observed in the extinction law for regions outside the dark clouds, specifically L1688N and L1688W. These regions displayed lower color-excess ratios in the Spitzer/IRAC bands. This observation lends support to the dust growth occurring in the dense regions of the Ophiuchus cloud.
1. Introduction
Interstellar dust is a crucial constituent of the interstellar medium (ISM). The physical characteristics of interstellar dust, including its composition, size distribution, and shape, can exhibit significant variations across different interstellar environments [1]. Numerous detailed dust models have been developed to accurately replicate the properties of dust in a diffuse medium [2,3,4]. However, with an increase in environmental density, dust grains undergo two pivotal evolutionary processes that modify their physical properties. These processes include coagulation, where dust particles collide and merge to form larger grains, and condensation, where gaseous molecules adhere to the surface of dust grains, leading to the formation of ice mantles [5,6,7]. However, the nature of dust evolution in dense environments remains poorly understood. Gaining a comprehensive understanding of the properties of interstellar dust in dense environments is essential for unraveling the formation and evolution of stars and their planetary systems [8,9,10].
The observational characteristic that characterizes dust properties is the extinction law, which depicts the wavelength-dependent variation of extinction. The extinction law is commonly employed to infer dust properties, including size distribution and composition [11]. Over the past few decades, the extinction law in optical and ultraviolet bands has proven valuable in investigating the diffuse interstellar medium, allowing for its characterization through a single parameter (i.e., ) [11,12]. In the near-infrared (NIR) band, spanning 1–3 , the extinction law has been found to exhibit an approximately universal power-law form [13,14]. The power-law index may vary from a sightline to another in the range of 1.6–2.4 (see the review by Matsunaga et al. [15]).
However, the extinction law in the mid-infrared (MIR) band, spanning 3–8 m, lacks a comprehensive description or explanation. The measurement of the extinction law is generally based on the estimation of the entire molecular cloud, but the density of the environment within the same cloud is not uniform. Dust grains in denser environments are more likely to undergo growth, altering their size and composition, thus introducing variations in the infrared extinction law. Nevertheless, the variability of the infrared extinction law with respect to environmental conditions (e.g., temperature and density) remains inadequately investigated. Early studies suggested that the MIR extinction law did not show significant variability [16,17]. Subsequent studies revealed that in dense interstellar environments, the MIR extinction law tends to exhibit a flat behavior, aligning with the Weingartner and Draine [18] (hereafter WD01) model. However, Cambrésy et al. [19] found a “transition” occurs in the MIR extinction law when mag, displaying a flatter behavior compared to the WD01 model. Dust growth is suggested to account for this flattened MIR extinction, requiring the dust size to reach approximately several microns [20,21]. Ascenso et al. [22] found that the MIR extinction curves of two dark cloud cores in the Pipe Nebula exhibit a flatter trend compared to the extinction curves predicted by the WD01 dust model, although there exist some disparities between them. In conclusion, notable uncertainties persist in the MIR extinction law within dense environments, primarily attributable to observational constraints concerning accuracy and depth. The question of its universality or its dependence on extinction depth remains a subject of debate.
In order to investigate variations in the extinction law, we chose the nearby Ophiuchus cloud, which exhibits active star formation. The Ophiuchus cloud is located at a distance of approximately 135 pc [23] and is situated at a high galactic latitude. It shows no contamination from background clouds. Consequently, we can consider all stars within the region as background stars. The Ophiuchus cloud is also well known for its diverse range of star-forming environments, including dense dark clouds and translucent clouds. This characteristic enables us to study possible variations of the extinction law within a single cloud.
In this work, we combine deep NIR and MIR data to study the extinction law in the Ophiuchus cloud. In Section 2, we present the infrared data we used in this paper. Section 3 describes the methods and analysis for obtaining the IR extinction law. Section 4 presents the results and discussions. We present a summary in Section 5.
2. Observations
We obtained the NIR and MIR observations of Ophiuchus cloud from two catalogs: the United Kingdom Infrared Deep Sky Survey (UKIDSS) Galactic Cluster Survey (GCS) and the Spitzer Cores to Disks (c2d) Project.
2.1. The UKIDSS GCS
The UKIDSS GCS is a comprehensive survey aimed at providing homogenous data on a number of open star clusters, star forming regions, and associations [24]. This survey utilized the United Kingdom Infrared Telescope (UKIRT) Wide Field Camera (WFCAM) and observed in the bands [25]. The effective wavelengths and full-widths at half-maximum (FWHM) of the UKIDSS filters are presented in Table 1. The data from the UKIDSS GCS can be accessed through the WFCAM Science Archive (http://surveys.roe.ac.uk/wsa, accessed on 1 August 2022). The JHK filters of UKIDSS have significantly deeper detection limits, approximately 3.5 mag deeper than the JHKs bands of the Two Micron All Sky Survey (2MASS), which enables the penatration into regions with up to mag. In this study, the observation from UKIDSS GCS covers a area of about 6 × 4 square degrees toward the Ophiuchus cloud. Details regarding the photometric system and calibration can be found in Hewett et al. [26] and Hodgkin et al. [27], respectively.

Table 1.
Basic properties of all photometric bands used in this work, as well as the detection limits and the number of sources in our merged catalog for the Ophiuchus cloud.
2.2. Spitzer c2d Project
The Spitzer c2d project is an extensive survey focused on star-forming regions within the Milky Way [28]. This survey employed the Infrared Array Camera (IRAC) and Multiband Imaging Photometer (MIPS) instruments onboard the Spitzer Space Telescope. The c2d survey in the Ophiuchus field encompasses an area of approximately eight square degrees. The dataset comprises imaging observations in four IRAC bands at [3.6], [4.5], [5.8], and [8.0] m, as well as in two MIPS bands at [24] and [70] m. We only use the Spitzer/IRAC bands in this work. The data from Spitzer c2d project is available through the Spitzer Science Center’s website (https://irsa.ipac.caltech.edu/data/SPITZER/C2D/, accessed on 4 January 2023).
Figure 1 presents the observation coverages of UKIDSS and Spitzer, overlaid on the extinction map calculated by Juvela and Montillaud [29] using the 2MASS survey. In a related study, Lombardi et al. [30] presented the first extinction map of Ophiuchus based on the 2MASS data by using the Near-Infrared Color Excess Revisited (NICER [9]) method. Additionally, Figure 1 displays the positions of six specific sub-regions, namely L1712, L1689, L1709, L1688, L1688N, and L1688W, which will be further explored and discussed in Section 4.4.
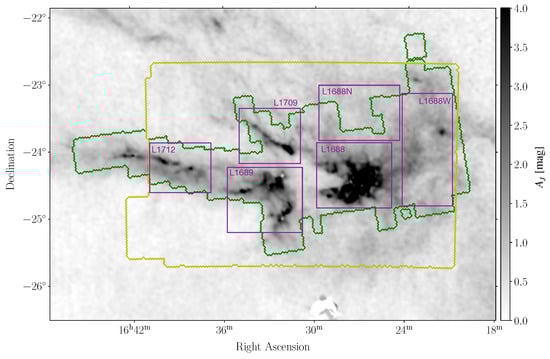
Figure 1.
The extinction map of the Ophiuchus cloud determined by Juvela and Montillaud [29] using the 2MASS survey. The resolution of the map is ∼3.0 arcmin. The irregular outlines in green and yellow indicate the spatial coverage of the Spitzer and UKIDSS observations, respectively. The entire region is subdivided into six distinct sub-regions, delineated by solid-line rectangles, namely L1712, L1689, L1709, L1688, L1688N, and L1688W.
2.3. Control of the Data Quality
To determine the extinction law of Ophiuchus cloud in both NIR and MIR bands, we utilized the TOPCAT [31] software (version 4.8-6) to cross-match the UKIDSS and Spitzer catalogs described above. The matching radius was set to be 1 arcsecond to obtain sources with simultaneous observations. For the UKIDSS data, we first adopt a strict cut on uncertainties for UKIDSS bands by requiring photometric magnitude errors smaller than 0.1 mag. Furthermore, the values of “pstar” flag were restricted to be greater than 0.99, to eliminate non-stellar sources such as galaxies and extended sources. As a result, the obtained dataset exhibits limiting magnitudes of 19.4, 17.8, and 16.9 mag in bands.
For the Spitzer data, we applied quality criteria to select sources classified as “star” according to the “OType” flag, and we retained only those sources with a signal-to-noise ratio (SNR) greater than five. The resulting limiting magnitudes for the four IRAC bands are 16.6, 15.9, 15.3, and 14.8 mag. Moreover, we excluded YSOs within the cloud as identified by Grasser et al. [32]. The number counts of all bands under data quality control are tabulated in Table 1.
3. Methods and Analysis
3.1. Determination of the Extinction Law
In this study, we investigate the wavelength-dependent extinction law using a technique similar to that employed by Indebetouw et al. [33]. However, we deviate from their approach by measuring the color-excess ratios instead of . Initially, we determine the color-excess ratios by fitting the loci of the stellar population on the color–color diagram (i.e., vs. ). Subsequently, we determine the relative extinction law from and :
The value of is often adopted to be , as measured by Indebetouw et al. [33] using the 2MASS survey. However, it is crucial to question this assumption. To address this, we recalculate using the color-excess ratio obtained from the vs. diagram. Although the UKIDSS photometry is calibrated relative to 2MASS, systematic biases were found in the photometry between UKIDSS and 2MASS [19]. This recalculation is necessary due to the considerable differences in filters between UKIDSS and 2MASS. Furthermore, it is important to note that the NIR extinction law may exhibit variations depending on the interstellar environment. We assume a power-law form for the extinction law in the NIR bands, given by . Consequently, the color-excess ratio can be used to derive the value of the power-law index using the following relationship:
where , , and are the effective wavelengths of the UKIDSS bands, respectively. Hence, our initial step involves deriving and the relative extinction in the NIR, specifically and , for each sample using the UKIDSS data.
The estimation of color-excess ratios is performed by constructing a color–color diagram, specifically vs. . The positioning of star populations on the color–color diagram is influenced by multiple factors, including their intrinsic colors, extinction, and photometric errors. In this investigation, the Ophiuchus cloud exhibits significant extinction, with exceeding 4 mag (see Figure 1). Moreover, the observed spans a wide range, with exceeding 7 mag. The intrinsic color indices typically display a dispersion of approximately 0.2 mag. Additionally, we have exclusively selected sources with photometric errors below 0.1 mag for our analysis. Consequently, the dominant factor shifting the stars along the reddening vector in the color–color diagram is the effect of extinction.
When conducting a linear fit to the vs. color–color diagram, we apply a removal technique to identify and exclude outliers in a single iteration. Additionally, we exclude sources with mag from the analysis.
3.2. Non-Linearity of Extinction Coefficients
It is widely acknowledged in the literature that the effective wavelengths of filters undergo a gradual shift toward longer wavelengths [34,35,36]. Consequently, the non-linearity in the extinction calculation (i.e., Equations (1) and (2)) becomes significant. In previous studies, this non-linear effect has been commonly regarded as negligible. However, with the increasing depth of extinction, this effect becomes more prominent and cannot be disregarded. The effective wavelength of a filter is determined by convolving the stellar spectra with the filter transmission curve:
where represents the intrinsic flux of the stellar spectra, and denotes the relative response function of the filter. The effective wavelength when the extinction is defined as the static effective wavelength , which is listed in Table 1. However, the effective wavelength is subject to shifting relative to static wavelength due to extinction . To analyze the “shifting effect”, we utilize a K0III-type stellar spectrum from Castelli and Kurucz [37] with an effective temperature of 4750 K, = 2.5, and solar metallicity. We assume the extinction law of the WD01 model. The left panels in Figure 2 depict the ratio of the effective wavelength at to the static wavelength as a function of the reddening . With the exception of the effective wavelength of the IRAC [8.0] band, which shifts toward shorter wavelengths, the effective wavelengths of all other bands shift toward longer wavelengths. This difference can be attributed to the 9.8 m extinction feature caused by silicate dust. The effective wavelengths of most bands have relative changes of a few per cent over the range of considered reddening mag.
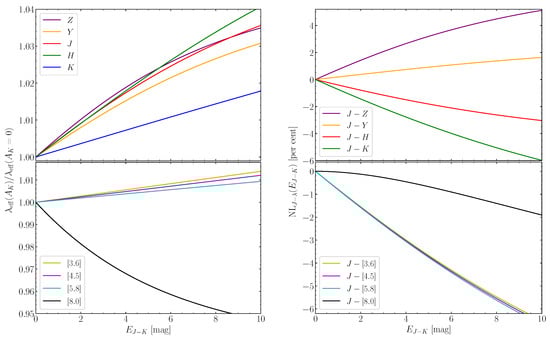
Figure 2.
Left panels: The ratio of effective wavelength at to static wavelength at () as a function of . Right panels: The non-linear correction factor () as a function of . The lines in different colors represent the filters of UKIDSS and Spitzer. We adopted a stellar spectrum of a typical K0III-type star and extinction curve of the WD01 = 5.5 model.
The extinction in the band is calculated using the following formula:
The color excess between two photometric systems is equal to . The shift effect of the effective wavelength can be corrected by applying an extinction correction to the observed data, which depends on the extinction law and the amount of reddening along the line of sight. According to Sanders et al. [38], the non-linear correction factor for the color (denoted as ) as a function of reddening is defined as follows:
We apply a correction for the typical non-linear effects by considering a K0III-type stellar model described above, combined with the WD01 = 5.5 extinction law. The observed colors of stars are corrected using the formula , where we approximate as . The right panels of Figure 2 illustrate the variation of the non-linear correction factors for UKIDSS and Spitzer/IRAC bands as a function of .
4. Results and Discussions
4.1. Determination of
As mentioned in Section 3.1, in order to convert the color-excess ratio into the relative extinction , it is necessary to measure the NIR extinction law . Utilizing the photometric data from UKIDSS, we initially performed a linear fit on the vs. color–color diagram, yielding . As depicted in Figure 3, it is evident that the best-fitting line exhibits an excellent linear relationship with the observations, accompanied by minimal error. For comparison, we divided the dataset into bins with variable widths. We then calculated the mean and standard deviation of the corresponding values within each bin. It is clearly seen that these mean points exhibit a remarkable alignment with the best-fit line by fitting the observed data directly. The distribution of residuals in the histogram further confirms that the fitting results do not exhibit significant systematic biases in relation to the data (see the inset in Figure 3).
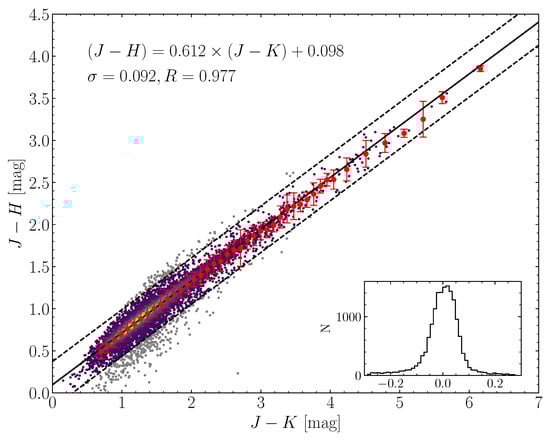
Figure 3.
The vs. diagram for sources observed by both Spitzer and UKIDSS in the Ophiuchus cloud, where the color scale represents the number density. The black solid line denotes the best linear fit to the points after a 3 removal, whose parameters are also shown in the figure. The range is shown in dashed lines, and the outliers are shown in gray. The inset is the histogram of the residuals between best-fit line and observed points.
Previous studies have investigated the NIR extinction law in the Ophiuchus cloud by employing different methodologies and photometric systems [39,40,41]. Kenyon et al. [40] obtained a value of , while Naoi et al. [41] reported a range of = 1.60–1.69, which exhibited slight variations depending on the location within the cloud. In our analysis using UKIDSS data in the Ophiuchus cloud, we derived a value of approximately , demonstrating excellent agreement with their findings.
According to the conversion in Equation (2), using the derived and the static effective wavelengths for the UKIDSS bands ( 1.248 m, 1.627 m, and 2.188 m, as shown in Table 1), we yield a power-law index of . Consequently, the extinctions for the J and H bands are determined to be and , respectively. Previous studies have reported varying values of , which depend on the interstellar environment and the specific photometric system used in the telescopes. These studies include Rieke and Lebofsky [42] who obtained = 2.52 toward the Galactic Center using the IRTF; Indebetouw et al. [33], who reported = 2.50 by averaging two different sight-lines using the 2MASS survey; Nishiyama et al. [43], who found = 3.02 toward the Galactic Center using the 2MASS survey; Fritz et al. [44], who derived = 3.07 toward the Galactic Center using hydrogen lines; Gordon et al. [45], who derived the = 2.53 for the average diffuse extinction; and Sanders et al. [38], who obtained = 3.23 toward the inner region of the Milky Way using the VVV survey. In our study, we employ the UKIRT photometric system, and the derived value of will be used to calculate the relative extinction in other bands.
4.2. Determination of
To investigate the overall extinction law of the Ophiuchus cloud, we conducted an analysis of the color–color diagrams depicting the relationship between and across various bands, as illustrated in Figure 4 and Figure 5. The objective was to determine the slope of the color–color relations through linear fitting, which represents the color-excess ratio denoted as . In Figure 5, noticeable photometric outliers were observed, characterized by unconventional colors, such as stars exhibiting values ranging from 0 to 2 mag but displaying significantly large values. These outliers likely correspond to sources with infrared excess resulting from circumstellar dust. To address this issue, a 3 removal procedure was applied in a single iteration. Initially, all data points were fitted, and the residuals between the points and the best-fit line were calculated. Subsequently, data points beyond 3 of the standard deviation of residuals were excluded. As depicted in Figure 4 and Figure 5, the gray points represent the outliers that were not considered in the final fitting process. Following this removal step, the remaining sources were refitted to obtain the definitive fitting results. The resulting color-excess ratios are tabulated in Table 2.
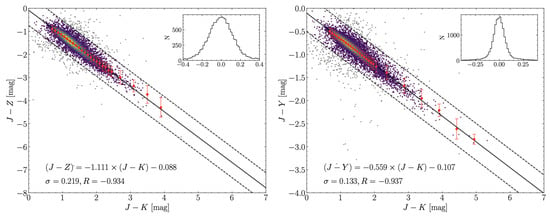
Figure 4.
Color vs. color diagrams vs. for UKIDSS Z and Y bands. The conventions of symbols and lines are the same as in Figure 3.
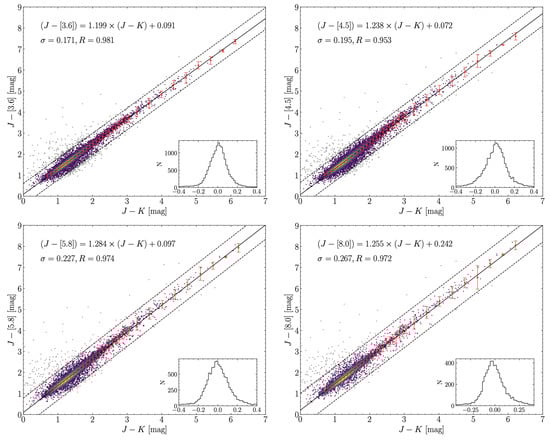
Figure 5.
Color vs. color diagrams vs. for Spitzer/IRAC [3.6], [4.5], [5.8], and [8.0] bands. The conventions of symbols and lines are the same as in Figure 3.
Table 2.
Results for the color-excess ratio , as well as relative extinction from of our adoption and of Indebetouw et al. [33].
By utilizing the derived and , we employed Equation (1) to calculate the extinction relative to the K band . The calculated values are presented in Table 2. The uncertainties associated with were determined by propagating the uncertainties from both and . Additionally, for comparison purposes, we computed the extinction using obtained from Indebetouw et al. [33]. It is important to note that a smaller value of leads to a flatter relationship, resulting in larger values of in the IRAC bands and smaller values of in the UKIDSS bands.
Figure 6 presented the extinction law derived for the Ophiuchus cloud in the wavelength range of 0.8–8 m. The extinction curves predicted by the WD01 models with and [18] and previous measurements [22,35,38] of the infrared extinction law are also shown for comparison. The WD01 models with = 3.1 and = 5.5 are generally used to represent the extinction laws in the diffuse and dense ISM, respectively. In the NIR (0.8–3 ), the predicted extinction laws from the WD01 models with and exhibit minimal differences. The derived in the NIR also follow a power-law form and are slightly steeper than the WD01 models. Our results lie between the WD01 models and those of Sanders et al. [38]. These findings confirm that the NIR extinction law may generally follow a universal power-law form, although the power index may vary due to differences in the interstellar environment or photometric systems.
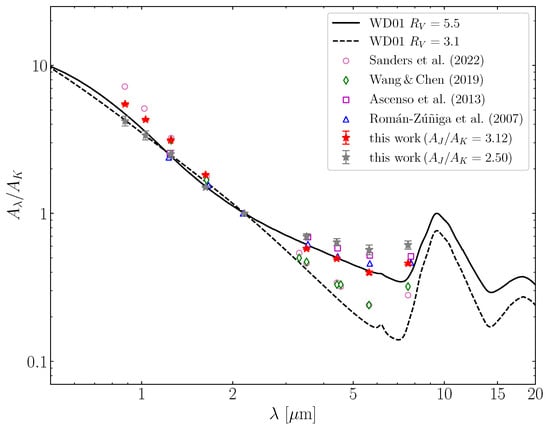
Figure 6.
Comparison of the extinction laws derived in this work with previous determinations [16,22,35,38] and model predictions [18]. The extinction determined by adopting and are shown with red and gray stars, respectively. The extinction laws as predicted from models by WD01 and are displayed black solid and dashed lines, respectively.
In the MIR range of 3–8 , the extinction predicted by the WD01 model is noticeably higher than that of the WD01 model. By using instead of , the derived values of show an increase of approximately 33%, 43%, 29%, and 20% for the [3.6], [4.5], [5.8], and [8.0] bands, respectively. Consequently, the extinction law in the MIR appears to be significantly flatter than the prediction of the WD01 model, as illustrated in Figure 6.
Previous studies by Ascenso et al. [22] and Román-Zúñiga et al. [16] have investigated the extinction law in dark cloud cores using the color-excess ratio method. They employed the value from Indebetouw et al. [33] and derived a MIR extinction law that was significantly flatter than the WD01 model. In contrast, Figure 6 in our study demonstrates that our results, based on the adoption of from Indebetouw et al. [33], closely resemble the extinction law obtained by Ascenso et al. [22]. It can be observed that when measuring the extinction law using color-excess ratio method, employing different or can lead to significantly different relative extinction laws. Overall, by utilizing our derived value of for Ophiuchus cloud, our findings reveal a notable characteristic of a flat MIR extinction. This measurement closely aligns with the extinction curve predicted by the WD01 = 5.5 model [18] and is in agreement with previous measurements [46,47].
4.3. Dependence on Extinction Depth
The observational data utilized in this study cover a wide range of extinction values within the Ophiuchus molecular cloud, spanning approximately mag. This corresponds to an approximate extinction range of mag, considering an intrinsic color of mag and assuming an extinction law of predicted by the WD01 model. The extensive coverage enables the investigation of variations in the extinction law within the same cloud as a function of extinction depth. Following the division scheme proposed by Chapman et al. [46], the data in this study are categorized into four sub-samples based on extinction: , , , and . The corresponding observed color ranges are , , , and . Subsequently, a linear fit is performed for each sub-sample to derive the color-excess ratio , and the results are presented in Table 3. It can be observed that, except for the sub-sample with , the variation of with increasing is minimal, remaining approximately around 0.6. However, for the four Spitzer/IRAC bands, there is a noticeable trend of decreasing with increasing .
Table 3.
Results for the color-excess ratio within various ranges of . The numbers of sources used for each sub-sample are also listed.
Based on the obtained values for each sub-sample as listed in Table 4, we can further calculate the power-law index and for the NIR extinction law using Equation (2). By utilizing the derived values for each sub-sample, we are able to calculate the extinction ratios . These results are presented in Table 4 and visualized in Figure 7. It is evident that the extinction law becomes flatter with increasing . Specifically, the values of in the NIR bands decrease, while those in the MIR bands increase with increasing . Overall, our findings are consistent with the study conducted by Chapman et al. [46], who also observed a similar trend of the extinction law becoming flatter with increasing extinction. However, it should be noted that there are significant uncertainties in the results of the sub-sample with .
Table 4.
Results for the relative extinction within various ranges of .
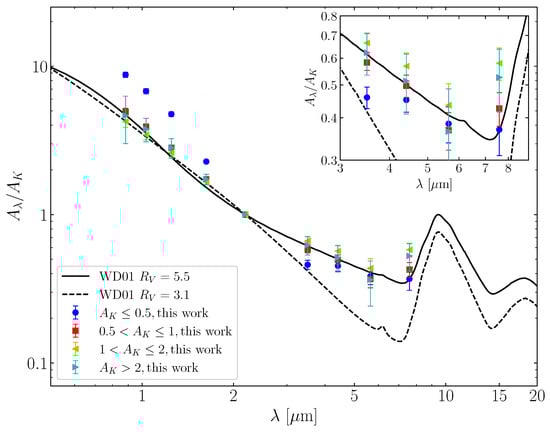
Figure 7.
Comparison of the extinction in various ranges. The extinction law as predicted from models by WD01 and are displayed black solid and dashed lines, respectively. The inset is the zoom-in view of the MIR extinction.
For the sub-sample with , we observed a greatly higher NIR color-excess ratio of compared to the sub-samples with where the ratio was approximately . Consequently, the calculated values of in the bands for this sub-sample exhibited a steeper slope compared to the other sub-samples. In general, the NIR values exhibited a notable decrease with increasing , except for the sub-sample with , which displayed very large uncertainties. The sources with likely trace regions outside the dark clouds, while the sources with are more likely to be located within the interior of the dark clouds. This finding suggests that there is dust grain growth occurring with increasing extinction depth within the dark clouds. However, it is worth noting that the values for the sub-sample with in the Spitzer/IRAC bands demonstrated a very flat extinction law, which is significantly flatter than the extinction law predicted by the WD01 = 3.1 model, and only slightly smaller than the WD01 = 5.5 model. This suggests the presence of a significant amount of large-sized dust grains in the outer regions of the dark cloud. One possible explanation for these observations is that the dust surrounding the dark cloud has undergone evolutionary growth, not limited to the interior of the cloud itself. Another hypothesis proposed by Ascenso et al. [22] is the influence of outflows generated by star formation activities within the dark cloud.
The variability of extinction laws has been a subject of significant controversy in previous studies. Equation (1) emphasizes the high sensitivity of the NIR color-excess ratio to the effective wavelength chosen by photometric systems. Wang and Jiang [13] pointed out that different photometric systems can lead to differences of more than 10% when calculating and . Previous investigations have utilized diverse photometric filters, examined various interstellar environments, and explored a wide range of extinction depths. Wang and Jiang [13] reported the universality of the NIR extinction law based on 2MASS photometry, finding and . Meingast et al. [36] studied the extinction law in Orion using Visible and Infrared Survey Telescope for Astronomy (VISTA) data and obtained , without discerning a significant trend in the NIR extinction law with respect to extinction depth. However, Kenyon et al. [40] discovered a trend of shallowing slope in the NIR extinction with increasing extinction, which was subsequently confirmed by studies conducted by Naoi et al. [41,48]. In the MIR regime, Chapman et al. [46] and McClure [49] investigated star-forming regions and observed a flattening trend of with increasing . In contrast, Xue et al. [50] did not detect a noticeable trend in their measurements, which can be attributed to differences in the studied targets. Specifically, Xue et al. [50] primarily focused on dust grains in the diffuse ISM, whereas our study of the Ophiuchus cloud explores how a denser environment promotes dust growth.
4.4. Spatial Variations across the Cloud
We now turn our attention to investigating the spatial variation of the extinction law within the Ophiuchus cloud. The Ophiuchus region consists of multiple dark clouds, namely L1712, L1689, L1709, and L1688, arranged in an east-to-west orientation (see Figure 1). Additionally, we selected two regions located to the north and west of L1688, referred to as L1688N and L1688W, respectively. For each of these sub-regions, we performed the fitting procedure and obtained the NIR extinction power-law index by fitting the versus color–color diagram. The color-excess ratios, , were determined for the Spitzer/IRAC bands. Figure 8 displays the corresponding values of and for these sub-regions.
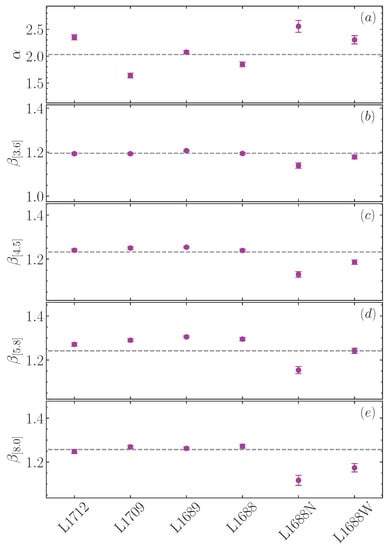
Figure 8.
The panels show the NIR extinction power-law index (panel a) and color-excess ratios in the Spitzer/IRAC [3.6], [4.5], [5.8], and [8.0] bands (panels b–e) for the sub-regions of Ophiuchus cloud as defined in Figure 1. The gray dashed lines represent the overall values of the parameters for the entire Ophiuchus cloud, as listed in Table 2.
Our findings reveal variations in the NIR extinction law within the same cloud, with differences exceeding 25%. Specifically, regions L1712, L1688N, and L1688W, characterized by relatively low extinction, exhibit higher values of compared to other regions. This trend is consistent with the results presented in Section 4.3, where the sub-sample with lower-extinction demonstrates the higher value of compared to other high-extinction samples. In a previous study by Naoi et al. [48], it was noted that L1712 exhibits a larger value of () compared to L1688 (), based on observations using the SIRIUS infrared camera on the IRSF 1.4 m telescope at SAAO. Stead and Hoare [34] investigated the NIR extinction slope using data from the UKIDSS Galactic Plane Survey and found a nearly constant value of 2.14 across different sightlines. Maíz Apellániz et al. [51] argue that different measurement methods may contribute to the observed variations in the NIR extinction, suggesting that the NIR extinction does not strictly follow a power law. In a study by Nogueras-Lara et al. [52], it was observed that the value for the band () is larger than that for the band (). This suggests that the extinction in the K band tends to flatten, indicating that color-excess relationships constructed based on the bands, such as vs. or , still require further investigation.
Furthermore, we observed that the MIR color-excess ratio remains relatively unchanged in the four dark clouds, namely L1712, L1689, L1709, and L1688, which is consistent with the overall results obtained for the entire Ophiuchus molecular cloud in Section 4.2. However, the other two regions, L1688N and L1688W, exhibit relatively lower values of . These regions are located outside the dark clouds and have lower levels of extinction. This finding aligns with the conclusions presented in Section 4.3 and further supports the hypothesis of dust growth toward the inner regions of the dark clouds.
5. Conclusions
In this study, we investigated the infrared extinction law of the nearby Ophiuchus molecular cloud using the NIR data from UKIDSS GCS and the MIR data from Spitzer c2d survey. To accurately analyze the observed colors, we carefully considered the non-linear effects arising from the response curves of the filters. We applied corrections based on the extinction law with WD01 and incorporated stellar template spectra. Employing the color-excess ratio method, we derived the relative extinction law for the Ophiuchus molecular cloud, covering the UKIDSS bands and the Spitzer/IRAC [3.6], [4.5], [5.8], and [8.0] bands. Additionally, we investigated the variations of the extinction law in relation to the depth of extinction and the spatial environment of the cloud. Our study yields the following main conclusions:
- We obtained the UKIDSS NIR color-excess ratios for the entire Ophiuchus cloud to be approximately , corresponding to and when assuming a power-law NIR extinction law. The relative extinctions, compared to the K band, were also calculated for other wavelength bands, and the measurement results are summarized in Table 2. Additionally, we observed that the derived MIR extinction law in the ∼3–8 m range exhibits a flat behavior and closely resembles the WD01 model extinction law with = 5.5. In contrast, the NIR extinction law exhibited a steeper slope compared to the extinction law of WD01 = 5.5.
- We examined the variation of the extinction law with increasing extinction depth by analyzing the average extinction laws of four sub-samples classified into different extinction bins: , , , and . Instead of assuming a uniform value of , we calculated the specific for each sub-sample using and then derived for other wavelength bands. Our analysis revealed a noticeable trend of a flatter extinction law from the NIR to MIR bands as the extinction increased. This observed trend is consistent with previous studies conducted by Naoi et al. [41] and Chapman et al. [46].
- We also discussed the spatial variation of the extinction law within the Ophiuchus molecular cloud. Our analysis revealed no significant difference in the MIR extinction law among the four dark clouds, namely L1712, L1689, L1709, and L1688. However, we observed noticeable variations in the extinction law for the regions located outside the dark clouds, specifically L1688N and L1688W. These regions exhibited a lower color-excess ratio in the Spitzer/IRAC bands. These findings provide further support for dust growth in the dense regions of the Ophiuchus cloud.
Author Contributions
Conceptualization, J.L. and X.C.; methodology, J.L. and X.C.; software, J.L.; validation, J.L.; formal analysis, J.L.; investigation, J.L. and X.C.; resources, J.L. and X.C.; data curation, J.L. and X.C.; writing—original draft preparation, J.L.; writing—review and editing, J.L. and X.C.; visualization, J.L. and X.C.; supervision, X.C.; project administration, J.L. and X.C.; funding acquisition, X.C. All authors have read and agreed to the published version of the manuscript.
Funding
This research was funded by the National Key R&D program of China (2022YFA1603102), the National Natural Science Foundation of China (11873002, 12011530065, 11590781). X.C. thanks to Guangdong Province Universities and Colleges Pearl River Scholar Funded Scheme (2019).
Data Availability Statement
The data can be accessed from the WFCAM Science Archive (http://surveys.roe.ac.uk/wsa, accessed on 1 August 2022) and the website of Spitzer Science Center (https://irsa.ipac.caltech.edu/data/SPITZER/C2D/, accessed on 4 January 2023).
Acknowledgments
We are very grateful to the anonymous referees for their helpful comments and suggestions, which highly improved the paper. We thank He Zhao for his very helpful discussions.
Conflicts of Interest
The authors declare no conflict of interest.
References
- Draine, B.T. Interstellar Dust Grains. Annu. Rev. Astron. Astrophys. 2003, 41, 241–289. [Google Scholar] [CrossRef]
- Zubko, V.; Dwek, E.; Arendt, R.G. Interstellar Dust Models Consistent with Extinction, Emission, and Abundance Constraints. Astrophys. J. Suppl. Ser. 2004, 152, 211–249. [Google Scholar] [CrossRef]
- Compiègne, M.; Verstraete, L.; Jones, A.; Bernard, J.P.; Boulanger, F.; Flagey, N.; Le Bourlot, J.; Paradis, D.; Ysard, N. The global dust SED: Tracing the nature and evolution of dust with DustEM. Astron. Astrophys. 2011, 525, A103. [Google Scholar] [CrossRef]
- Hensley, B.S.; Draine, B.T. Observational Constraints on the Physical Properties of Interstellar Dust in the Post-Planck Era. Astrophys. J. 2021, 906, 73. [Google Scholar] [CrossRef]
- Whittet, D.C.B.; Gerakines, P.A.; Tielens, A.G.G.M.; Adamson, A.J.; Boogert, A.C.A.; Chiar, J.E.; de Graauw, T.; Ehrenfreund, P.; Prusti, T.; Schutte, W.A.; et al. Detection of Abundant CO2 Ice in the Quiescent Dark Cloud Medium toward Elias 16. Astrophys. J. Lett. 1998, 498, L159–L163. [Google Scholar] [CrossRef]
- Ossenkopf, V.; Henning, T. Dust opacities for protostellar cores. Astron. Astrophys. 1994, 291, 943–959. [Google Scholar]
- Ormel, C.W.; Min, M.; Tielens, A.G.G.M.; Dominik, C.; Paszun, D. Dust coagulation and fragmentation in molecular clouds. II. The opacity of the dust aggregate size distribution. Astron. Astrophys. 2011, 532, A43. [Google Scholar] [CrossRef]
- Lada, C.J.; Lada, E.A.; Clemens, D.P.; Bally, J. Dust Extinction and Molecular Gas in the Dark Cloud IC 5146. Astrophys. J. 1994, 429, 694. [Google Scholar] [CrossRef]
- Lombardi, M.; Alves, J. Mapping the interstellar dust with near-infrared observations: An optimized multi-band technique. Astron. Astrophys. 2001, 377, 1023–1034. [Google Scholar] [CrossRef]
- Alves, J.F.; Lada, C.J.; Lada, E.A. Internal structure of a cold dark molecular cloud inferred from the extinction of background starlight. Nature 2001, 409, 159–161. [Google Scholar] [CrossRef]
- Fitzpatrick, E.L. Correcting for the Effects of Interstellar Extinction. Publ. Astron. Soc. Pac. 1999, 111, 63–75. [Google Scholar] [CrossRef]
- Cardelli, J.A.; Clayton, G.C.; Mathis, J.S. The relationship between infrared, optical, and ultraviolet extinction. Astrophys. J. 1989, 345, 245–256. [Google Scholar] [CrossRef]
- Wang, S.; Jiang, B.W. Universality of the Near-infrared Extinction Law Based on the APOGEE Survey. Astrophys. J. Lett. 2014, 788, L12. [Google Scholar] [CrossRef]
- Schultheis, M.; Kordopatis, G.; Recio-Blanco, A.; de Laverny, P.; Hill, V.; Gilmore, G.; Alfaro, E.J.; Costado, M.T.; Bensby, T.; Damiani, F.; et al. The Gaia-ESO Survey: Tracing interstellar extinction. Astron. Astrophys. 2015, 577, A77. [Google Scholar] [CrossRef]
- Matsunaga, N.; Bono, G.; Chen, X.; de Grijs, R.; Inno, L.; Nishiyama, S. Impact of Distance Determinations on Galactic Structure. I. Young and Intermediate-Age Tracers. Space Sci. Rev. 2018, 214, 74. [Google Scholar] [CrossRef]
- Román-Zúñiga, C.G.; Lada, C.J.; Muench, A.; Alves, J.F. The Infrared Extinction Law at Extreme Depth in a Dark Cloud Core. Astrophys. J. 2007, 664, 357–362. [Google Scholar] [CrossRef]
- Gao, J.; Jiang, B.W.; Li, A. Mid-Infrared Extinction and its Variation with Galactic Longitude. Astrophys. J. 2009, 707, 89–102. [Google Scholar] [CrossRef]
- Weingartner, J.C.; Draine, B.T. Dust Grain-Size Distributions and Extinction in the Milky Way, Large Magellanic Cloud, and Small Magellanic Cloud. Astrophys. J. 2001, 548, 296–309. [Google Scholar] [CrossRef]
- Cambrésy, L.; Rho, J.; Marshall, D.J.; Reach, W.T. Variation of the extinction law in the Trifid nebula. Astron. Astrophys. 2011, 527, A141. [Google Scholar] [CrossRef]
- Wang, S.; Li, A.; Jiang, B.W. Very Large Interstellar Grains as Evidenced by the Mid-infrared Extinction. Astrophys. J. 2015, 811, 38. [Google Scholar] [CrossRef]
- Wang, S.; Li, A.; Jiang, B.W. The interstellar oxygen crisis, or where have all the oxygen atoms gone? Mon. Not. R. Astron. Soc. 2015, 454, 569–575. [Google Scholar] [CrossRef]
- Ascenso, J.; Lada, C.J.; Alves, J.; Román-Zúñiga, C.G.; Lombardi, M. The mid-infrared extinction law in the darkest cores of the Pipe Nebula. Astron. Astrophys. 2013, 549, A135. [Google Scholar] [CrossRef][Green Version]
- Mamajek, E.E. On the distance to the Ophiuchus star-forming region. Astron. Nachrichten 2008, 329, 10. [Google Scholar] [CrossRef]
- Casewell, S.; Hambly, N. The UKIDSS Galactic Clusters Survey. In Proceedings of the Thirty Years of Astronomical Discovery with UKIRT, Edinburgh, UK, 14–16 September 2009; Adamson, A., Davies, J., Robson, I., Eds.; Springer: Dordrecht, The Netherlands, 2013; Volume 37, p. 291. [Google Scholar] [CrossRef]
- Lawrence, A.; Warren, S.J.; Almaini, O.; Edge, A.C.; Hambly, N.C.; Jameson, R.F.; Lucas, P.; Casali, M.; Adamson, A.; Dye, S.; et al. The UKIRT Infrared Deep Sky Survey (UKIDSS). Mon. Not. R. Astron. Soc. 2007, 379, 1599–1617. [Google Scholar] [CrossRef]
- Hewett, P.C.; Warren, S.J.; Leggett, S.K.; Hodgkin, S.T. The UKIRT Infrared Deep Sky Survey ZY JHK photometric system: Passbands and synthetic colours. Mon. Not. R. Astron. Soc. 2006, 367, 454–468. [Google Scholar] [CrossRef]
- Hodgkin, S.T.; Irwin, M.J.; Hewett, P.C.; Warren, S.J. The UKIRT wide field camera ZYJHK photometric system: Calibration from 2MASS. Mon. Not. R. Astron. Soc. 2009, 394, 675–692. [Google Scholar] [CrossRef]
- Evans, N.J., II; Allen, L.E.; Blake, G.A.; Boogert, A.C.A.; Bourke, T.; Harvey, P.M.; Kessler, J.E.; Koerner, D.W.; Lee, C.W.; Mundy, L.G.; et al. From Molecular Cores to Planet-forming Disks: An SIRTF Legacy Program. Publ. Astron. Soc. Pac. 2003, 115, 965–980. [Google Scholar] [CrossRef]
- Juvela, M.; Montillaud, J. Allsky NICER and NICEST extinction maps based on the 2MASS near-infrared survey. Astron. Astrophys. 2016, 585, A38. [Google Scholar] [CrossRef]
- Lombardi, M.; Lada, C.J.; Alves, J. 2MASS wide field extinction maps. II. The Ophiuchus and the Lupus cloud complexes. Astron. Astrophys. 2008, 489, 143–156. [Google Scholar] [CrossRef]
- Taylor, M.B. TOPCAT & STIL: Starlink Table/VOTable Processing Software. In Proceedings of the Astronomical Data Analysis Software and Systems XIV, Pasadena, CA, USA, 24–27 October 2004; Shopbell, P., Britton, M., Ebert, R., Eds.; Astronomical Society of the Pacific Conference Series; Astronomical Society of the Pacific: San Francisco, CA, USA, 2005; Volume 347, p. 29. [Google Scholar]
- Grasser, N.; Ratzenböck, S.; Alves, J.; Großschedl, J.; Meingast, S.; Zucker, C.; Hacar, A.; Lada, C.; Goodman, A.; Lombardi, M.; et al. The ρ Ophiuchi region revisited with Gaia EDR3. Two young populations, new members, and old impostors. Astron. Astrophys. 2021, 652, A2. [Google Scholar] [CrossRef]
- Indebetouw, R.; Mathis, J.S.; Babler, B.L.; Meade, M.R.; Watson, C.; Whitney, B.A.; Wolff, M.J.; Wolfire, M.G.; Cohen, M.; Bania, T.M.; et al. The Wavelength Dependence of Interstellar Extinction from 1.25 to 8.0 μm Using GLIMPSE Data. Astrophys. J. 2005, 619, 931–938. [Google Scholar] [CrossRef]
- Stead, J.J.; Hoare, M.G. The slope of the near-infrared extinction law. Mon. Not. R. Astron. Soc. 2009, 400, 731–742. [Google Scholar] [CrossRef]
- Wang, S.; Chen, X. The Optical to Mid-infrared Extinction Law Based on the APOGEE, Gaia DR2, Pan-STARRS1, SDSS, APASS, 2MASS, and WISE Surveys. Astrophys. J. 2019, 877, 116. [Google Scholar] [CrossRef]
- Meingast, S.; Alves, J.; Lombardi, M. VISION—Vienna Survey in Orion. II. Infrared extinction in Orion A. Astron. Astrophys. 2018, 614, A65. [Google Scholar] [CrossRef]
- Castelli, F.; Kurucz, R.L. New Grids of ATLAS9 Model Atmospheres. In Proceedings of the Modelling of Stellar Atmospheres, Uppsala, Sweden, 17–21 June 2002; Piskunov, N., Weiss, W.W., Gray, D.F., Eds.; Astronomical Society of the Pacific Conference Series; Astronomical Society of the Pacific: San Francisco, CA, USA, 2003; Volume 210, p. A20. [Google Scholar] [CrossRef]
- Sanders, J.L.; Smith, L.; González-Fernández, C.; Lucas, P.; Minniti, D. The extinction law in the inner 3 × 3 deg2 of the Milky Way and the red clump absolute magnitude in the inner bar-bulge. Mon. Not. R. Astron. Soc. 2022, 514, 2407–2424. [Google Scholar] [CrossRef]
- Harris, D.H.; Woolf, N.J.; Rieke, G.H. Ice mantles and abnormal extinction in the Rho Ophiuchi cloud. Astrophys. J. 1978, 226, 829–838. [Google Scholar] [CrossRef]
- Kenyon, S.J.; Lada, E.A.; Barsony, M. The Near-Infrared Extinction Law and Limits on the Pre-Main-Sequence Population of the rho Ophiuchi Dark Cloud. Astron. J. 1998, 115, 252–262. [Google Scholar] [CrossRef]
- Naoi, T.; Tamura, M.; Nakajima, Y.; Nagata, T.; Suto, H.; Murakawa, K.; Kandori, R.; Sasaki, S.; Baba, D.; Kato, D.; et al. Near-Infrared Extinction Law in the ρ Ophiuchi and Chamaeleon Dark Clouds. Astrophys. J. 2006, 640, 373–382. [Google Scholar] [CrossRef]
- Rieke, G.H.; Lebofsky, M.J. The interstellar extinction law from 1 to 13 microns. Astrophys. J. 1985, 288, 618–621. [Google Scholar] [CrossRef]
- Nishiyama, S.; Tamura, M.; Hatano, H.; Kato, D.; Tanabé, T.; Sugitani, K.; Nagata, T. Interstellar Extinction Law Toward the Galactic Center III: J, H, KS Bands in the 2MASS and the MKO Systems, and 3.6, 4.5, 5.8, 8.0 μm in the Spitzer/IRAC System. Astrophys. J. 2009, 696, 1407–1417. [Google Scholar] [CrossRef]
- Fritz, T.K.; Gillessen, S.; Dodds-Eden, K.; Lutz, D.; Genzel, R.; Raab, W.; Ott, T.; Pfuhl, O.; Eisenhauer, F.; Yusef-Zadeh, F. Line Derived Infrared Extinction toward the Galactic Center. Astrophys. J. 2011, 737, 73. [Google Scholar] [CrossRef]
- Gordon, K.D.; Misselt, K.A.; Bouwman, J.; Clayton, G.C.; Decleir, M.; Hines, D.C.; Pendleton, Y.; Rieke, G.; Smith, J.D.T.; Whittet, D.C.B. Milky Way Mid-Infrared Spitzer Spectroscopic Extinction Curves: Continuum and Silicate Features. Astrophys. J. 2021, 916, 33. [Google Scholar] [CrossRef]
- Chapman, N.L.; Mundy, L.G.; Lai, S.P.; Evans, N.J., II. The Mid-Infrared Extinction Law in the Ophiuchus, Perseus, and Serpens Molecular Clouds. Astrophys. J. 2009, 690, 496–511. [Google Scholar] [CrossRef]
- Flaherty, K.M.; Pipher, J.L.; Megeath, S.T.; Winston, E.M.; Gutermuth, R.A.; Muzerolle, J.; Allen, L.E.; Fazio, G.G. Infrared Extinction toward Nearby Star-forming Regions. Astrophys. J. 2007, 663, 1069–1082. [Google Scholar] [CrossRef]
- Naoi, T.; Tamura, M.; Nagata, T.; Nakajima, Y.; Suto, H.; Murakawa, K.; Kandori, R.; Sasaki, S.; Nishiyama, S.; Oasa, Y.; et al. Near-Infrared Extinction in the Coalsack Globule 2. Astrophys. J. 2007, 658, 1114–1118. [Google Scholar] [CrossRef]
- McClure, M. Observational 5–20 μm Interstellar Extinction Curves Toward Star-Forming Regions Derived From Spitzer IRS Spectra. Astrophys. J. Lett. 2009, 693, L81–L85. [Google Scholar] [CrossRef]
- Xue, M.; Jiang, B.W.; Gao, J.; Liu, J.; Wang, S.; Li, A. A Precise Determination of the Mid-infrared Interstellar Extinction Law Based on the APOGEE Spectroscopic Survey. Astrophys. J. Suppl. Ser. 2016, 224, 23. [Google Scholar] [CrossRef]
- Maíz Apellániz, J.; Pantaleoni González, M.; Barbá, R.H.; García-Lario, P.; Nogueras-Lara, F. Galactic extinction laws—I. A global NIR analysis with 2MASS photometry. Mon. Not. R. Astron. Soc. 2020, 496, 4951–4963. [Google Scholar] [CrossRef]
- Nogueras-Lara, F.; Schödel, R.; Najarro, F.; Gallego-Calvente, A.T.; Gallego-Cano, E.; Shahzamanian, B.; Neumayer, N. Variability of the near-infrared extinction curve towards the Galactic centre. Astron. Astrophys. 2019, 630, L3. [Google Scholar] [CrossRef]


Disclaimer/Publisher’s Note: The statements, opinions and data contained in all publications are solely those of the individual author(s) and contributor(s) and not of MDPI and/or the editor(s). MDPI and/or the editor(s) disclaim responsibility for any injury to people or property resulting from any ideas, methods, instructions or products referred to in the content. |
© 2023 by the authors. Licensee MDPI, Basel, Switzerland. This article is an open access article distributed under the terms and conditions of the Creative Commons Attribution (CC BY) license (https://creativecommons.org/licenses/by/4.0/).