Article

Pilot Search for Axion-Like Particles by a Three-Beam Stimulated Resonant Photon Collider with Short Pulse Lasers

1
Graduate School of Advanced Science and Engineering, Hiroshima University, Kagamiyama, Higashi-Hiroshima 739-8526, Japan
2
Institute for Chemical Research, Kyoto University Uji, Kyoto 611-0011, Japan
3
Graduate School of Science, Kyoto University, Sakyouku, Kyoto 606-8502, Japan
4
Research Institute of Science and Technology, Tokai University, 4-1-1 Kitakaname, Hiratsuka 259-1292, Japan
*
Author to whom correspondence should be addressed.
Universe 2023, 9(3), 123; https://doi.org/10.3390/universe9030123
Submission received: 31 January 2023 / Revised: 18 February 2023 / Accepted: 22 February 2023 / Published: 28 February 2023
(This article belongs to the Special Issue Origins and Natures of Inflation, Dark Matter and Dark Energy)

Abstract

:
Toward the systematic search for axion-like particles in the eV mass range, we proposed the concept of a stimulated resonant photon collider by focusing three short pulse lasers into a vacuum. In order to realize such a collider, we have performed a proof-of-principle experiment with a set of large incident angles between three beams to overcome the expected difficulty to ensure the space–time overlap between short pulse lasers and also established a method to evaluate the bias on the polarization states, which is useful for a future variable–incident–angle collision system. In this paper, we present a result from the pilot search with the developed system and the method. The search result was consistent with null. We thus have set the upper limit on the minimum ALP-photon coupling down to 1.5 × 10 4 GeV 1 at the ALP mass of 1.53 eV with a confidence level of 95%.

1. Introduction

Present space observations consistently estimate that 95% of the energy density balance of the Universe is occupied by dark matter and dark energy. Among the dark components, axion [1,2,3,4] is one of the most rational candidates for cold dark matter (CDM) [5,6,7], which is supposed to be created via spontaneous breaking of the Peccei–Quinn symmetry [8] in order to solve the strong CP problem [9]. Furthermore, axion-like particles (ALPs), which set free the relation between mass and coupling unlike the QCD axion, are also widely discussed. Some of them are scalar-type of fields such as dilaton [10] and chameleon [11] in the context of dark energy.
In this paper, we focus on the following interaction Lagrangian between a pseudoscalar-type ALP, ϕ a , and two photons
L = 1 4 g M F μ ν F ˜ μ ν ϕ a
where F μ ν = μ A ν ν A μ is the field strength tensor and its dual F ˜ μ ν 1 2 ϵ μ ν α β F α β with the Levi–Civita symbol ϵ i j k l , and g is a dimensionless constant while M is an energy at which a global continuous symmetry is broken.
Among many types of ALPs, a model, miracle [12], unifying inflation and dark matter into a single pseudoscalar-type ALP predicts the ALP mass and its coupling to photons in a range overlapping with those of the benchmark QCD axion models [3,4,13,14] in the eV mass range. Moreover, very recently, a scenario of thermal production of cold “hot dark matter” [15] and a new kind of axion model from the Grand Unified Theory (GUT) based on SU(5) × U(1) P Q [16] predict ALPs in the eV mass range as well. Therefore, specifically, the ALP mass range in O ( 0.1 1 ) eV at the coupling g / M 10 11 GeV 1 is the intended range of this study. A typical photon energy of laser fields, O ( 1 ) eV, is thus suitable for a photon collider targeting this mass range.
We have proposed a method to directly produce an ALP resonance state and simultaneously stimulate its decay by combining two-color (creation and inducing) laser fields and focusing them together with a single lens element in vacuum, which is defined as stimulated resonant photon collisions (SRPC) in a quasi-parallel collision system (QPS) [17]. In order to satisfy a resonance condition for the direct production of an ALP, the range of the center-of-mass system energy, E c m s , between two photons selected from a focused creation laser beam must include the ALP mass, m a . Thus, the condition is simply expressed as
E c m s = 2 ω c sin θ c = m a
with a common creation laser photon energy ω c and an angle 2 θ c between the two photons. Since a typical photon energy in lasers is around eV, SRPC in QPS has been employed as a way to access sub-eV ALPs with a long focal length [18,19,20,21,22,23].
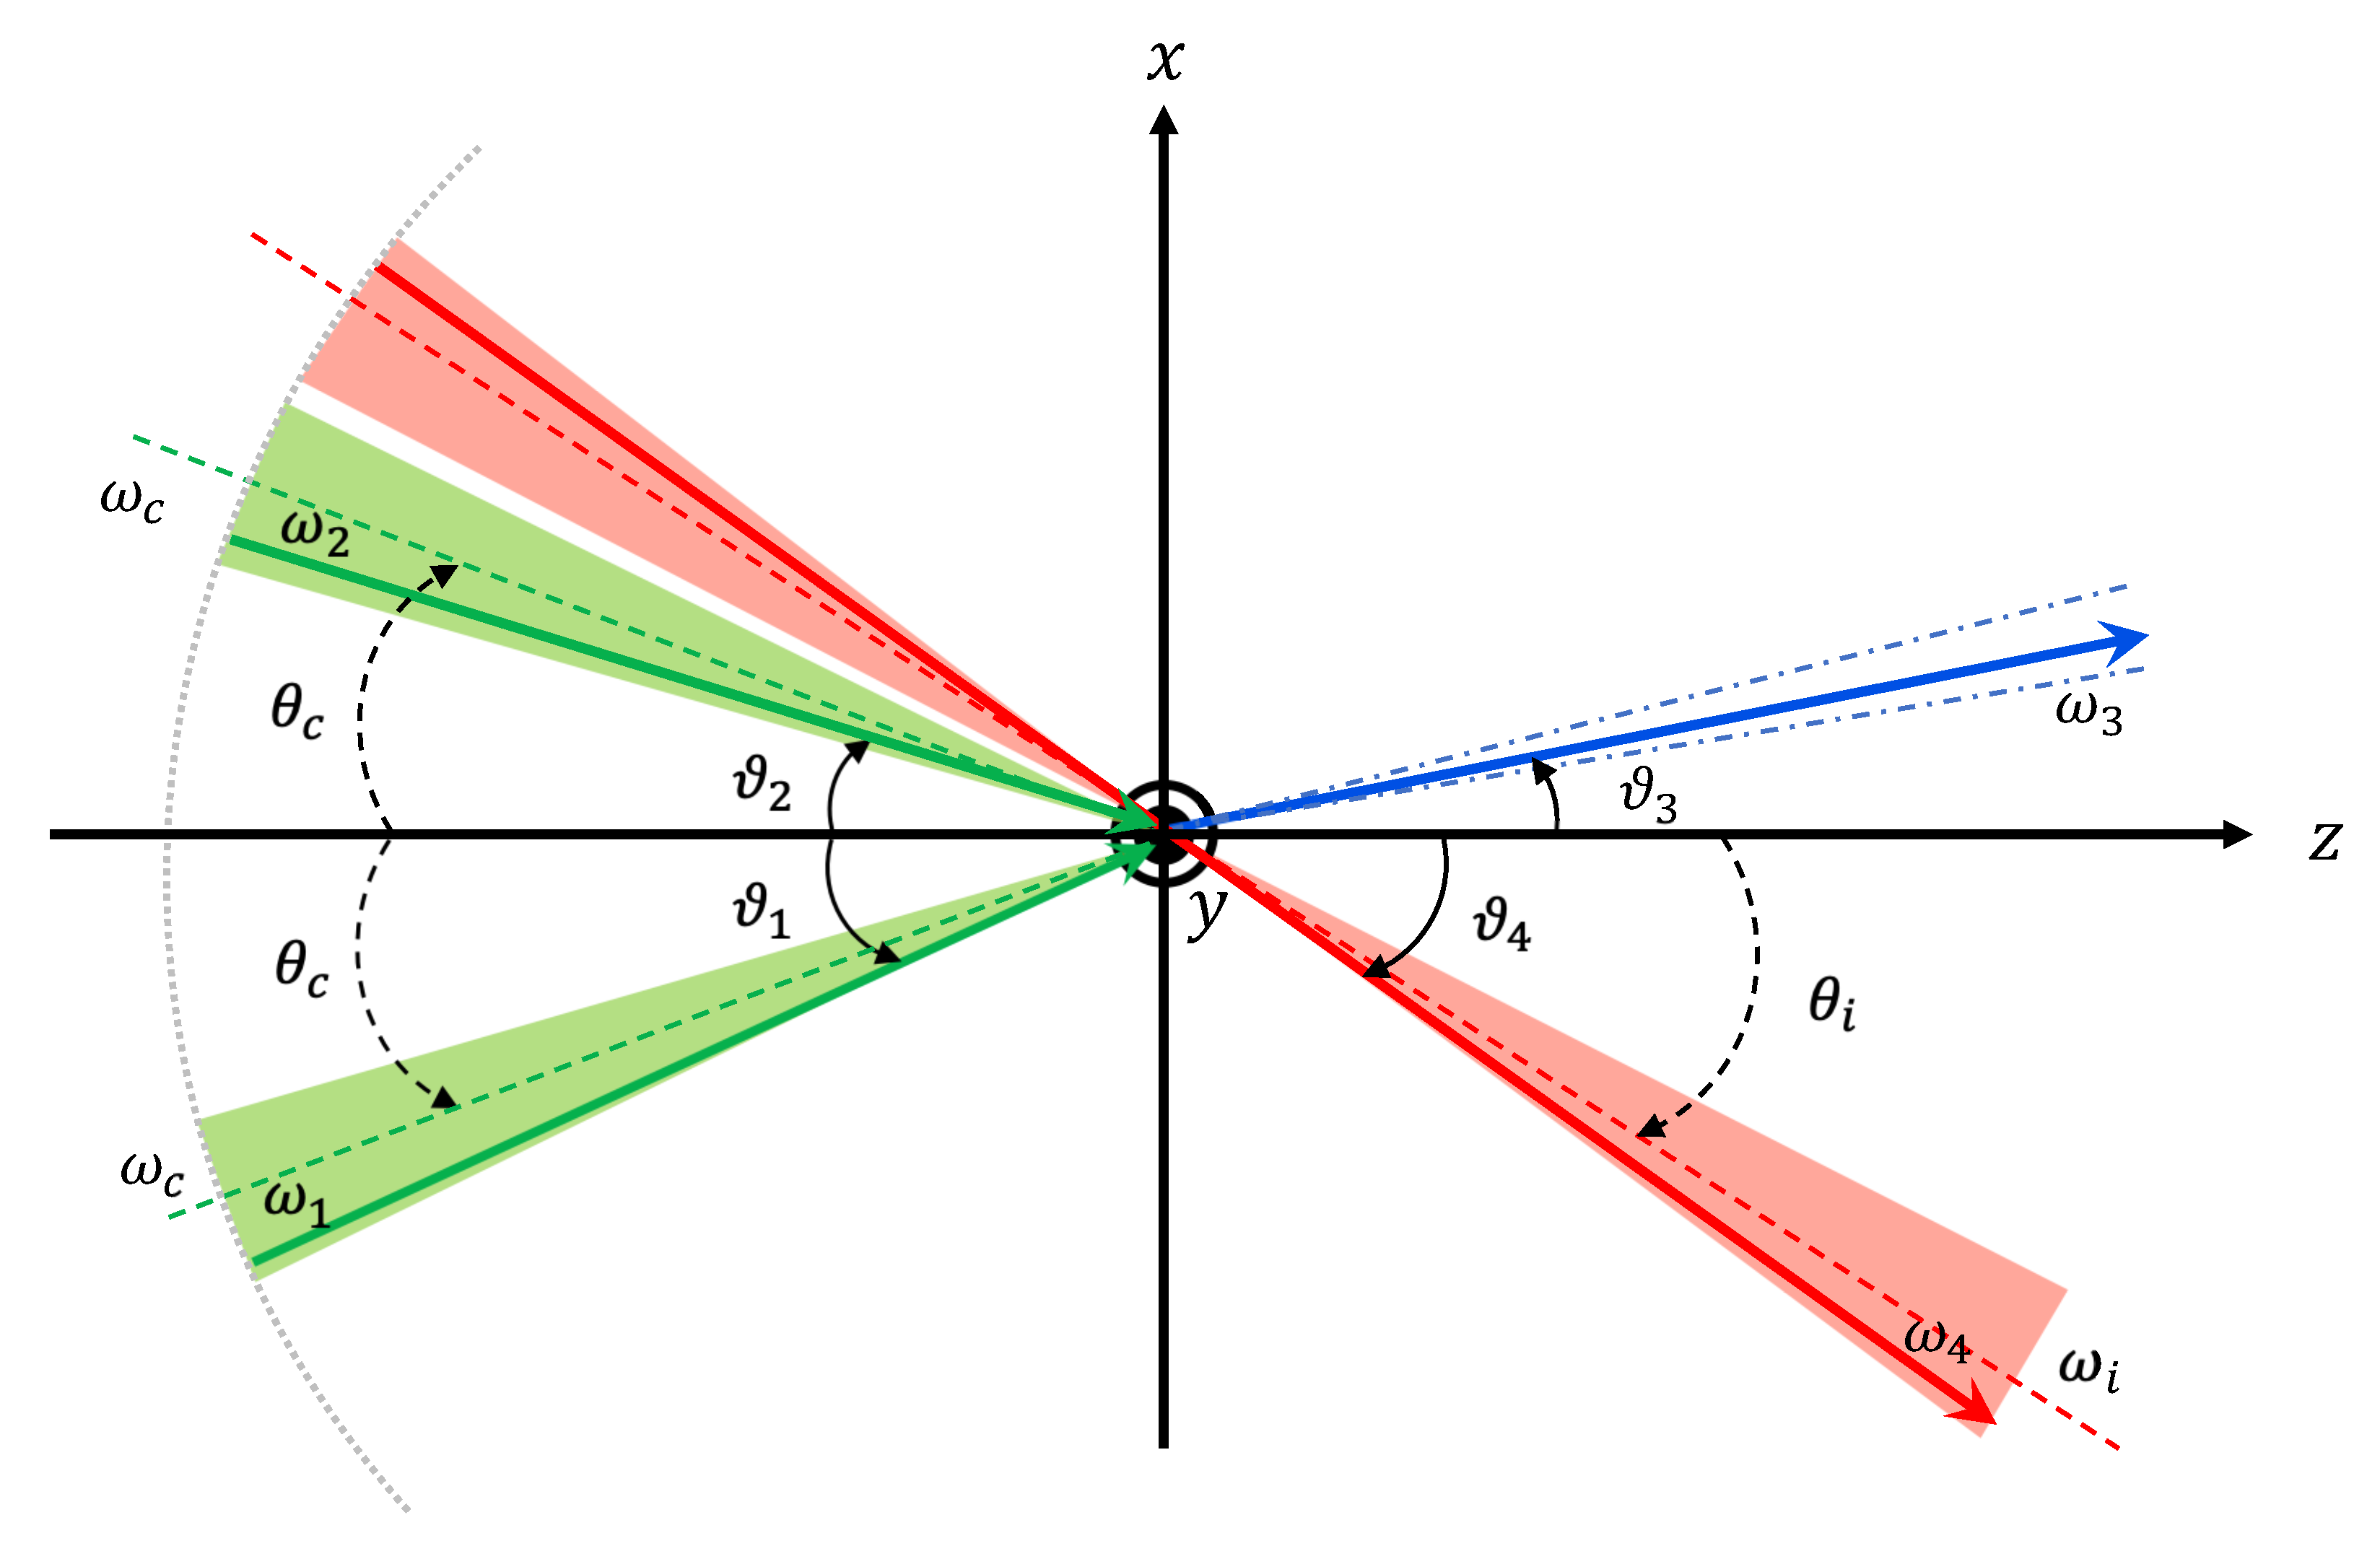
In order to access a higher mass range above eV, unless an unrealistically short focal length is assumed, we cannot access a higher mass in QPS if we keep the same photon energy in the beams. On the other hand, increasing photon energy by more than one order magnitude via optical nonlinear effects is a trade-off with reduction of the beam intensity, that is, the sensitivity to weak coupling domains is reduced. We thus have extended the formulation for SRPC with a single focused beam after combining two lasers in QPS [24] to SRPC with three separated focused beams ( t SRPC) [25] as illustrated in Figure 1. We can introduce a symmetric incident angle of θ c for the two beam axes of creation lasers (green); however, two incident photons from the focused two beams indeed have different incident angles ϑ 1 and ϑ 2 from θ c with different energies ω 1 and ω 2 from ω c , respectively, in general. The incident angle fluctuations around the beam axes are caused by momentum fluctuations at around the focal point, while energy uncertainties are caused by nearly Fourier transform limited short-pulsed lasers. These fluctuations are, in principle, unavoidable due to the uncertainty principle in momentum-energy space. Accordingly the exact resonance condition is modified as
E c m s = 2 ω 1 ω 2 sin ϑ 1 + ϑ 2 2 = m a .
The inducing beam with the central energy ω i (red) is simultaneously focused into the overlapping focal points between the two creation beams, and part of the beam represented as ω 4 enhances the interaction rate of the stimulated scattering resulting in emission of signal photons with the energy ω 3 (blue), which satisfies energy–momentum conservation. In order to reflect realistic energy and momentum distributions in the three beams, numerical calculations are eventually required to evaluate the stimulated interaction rate [25]. Thanks to the broadening of E c m s due to these uncertainties, however, the sensitivity to a target ALP mass will also have a wide resolution around the mass, which allows a quick mass scan if we vary θ c with a consistent step with the mass resolution.
On the other hand, synchronization of tightly confined pulses in space–time is required for t SRPC, which increases the experimental difficulty. In a photodetector with electric amplification, the time resolution is O ( 10 ) ps at most. For the duration of creation laser pulses about 40 fs, such a conventional detection technique is not applicable for ensuring synchronization of creation laser beams. Therefore, we consider utilization of nonlinear optical effects in a thin BBO crystal. Second harmonic generation (SHG) via the 2nd order nonlinear optical effect in BBO can be used for the synchronization between two creation beams. As for the three-beam synchronization, the third order nonlinear optical effect, four-wave mixing (FWM), in the same crystal can be used. For the purpose of synchronization, the atomic processes are quite important, while the atomic FWM becomes the dominant background source with respect to FWM in vacuum, that is, generation of ω 3 photons via ALP-exchange in t SRPC. This is because both atomic and ALP-exchange processes require energy–momentum conservation between four photons, and the signal photon energy ω 3 becomes kinematically almost identical.
In this paper, we will present a result of the pilot ALP search based t SRPC in the air as a proof-of-principle experiment that demonstrates that the aforementioned method practically works to guarantee the space–time synchronization between the three beams by setting a large collision angle of the creation lasers at θ c = 30 deg to learn the real technical complications toward the continuous mass scanning by systematically varying θ c in the near future search.
In the following sections, we describe the experimental setup and the synchronization methods in the pilot ALP search, the method for analyzing the acquired data, how to set the exclusion limits, and, finally, conclude the search results and discuss future plans toward the continuous ALP mass scanning.

2. Experimental Setup
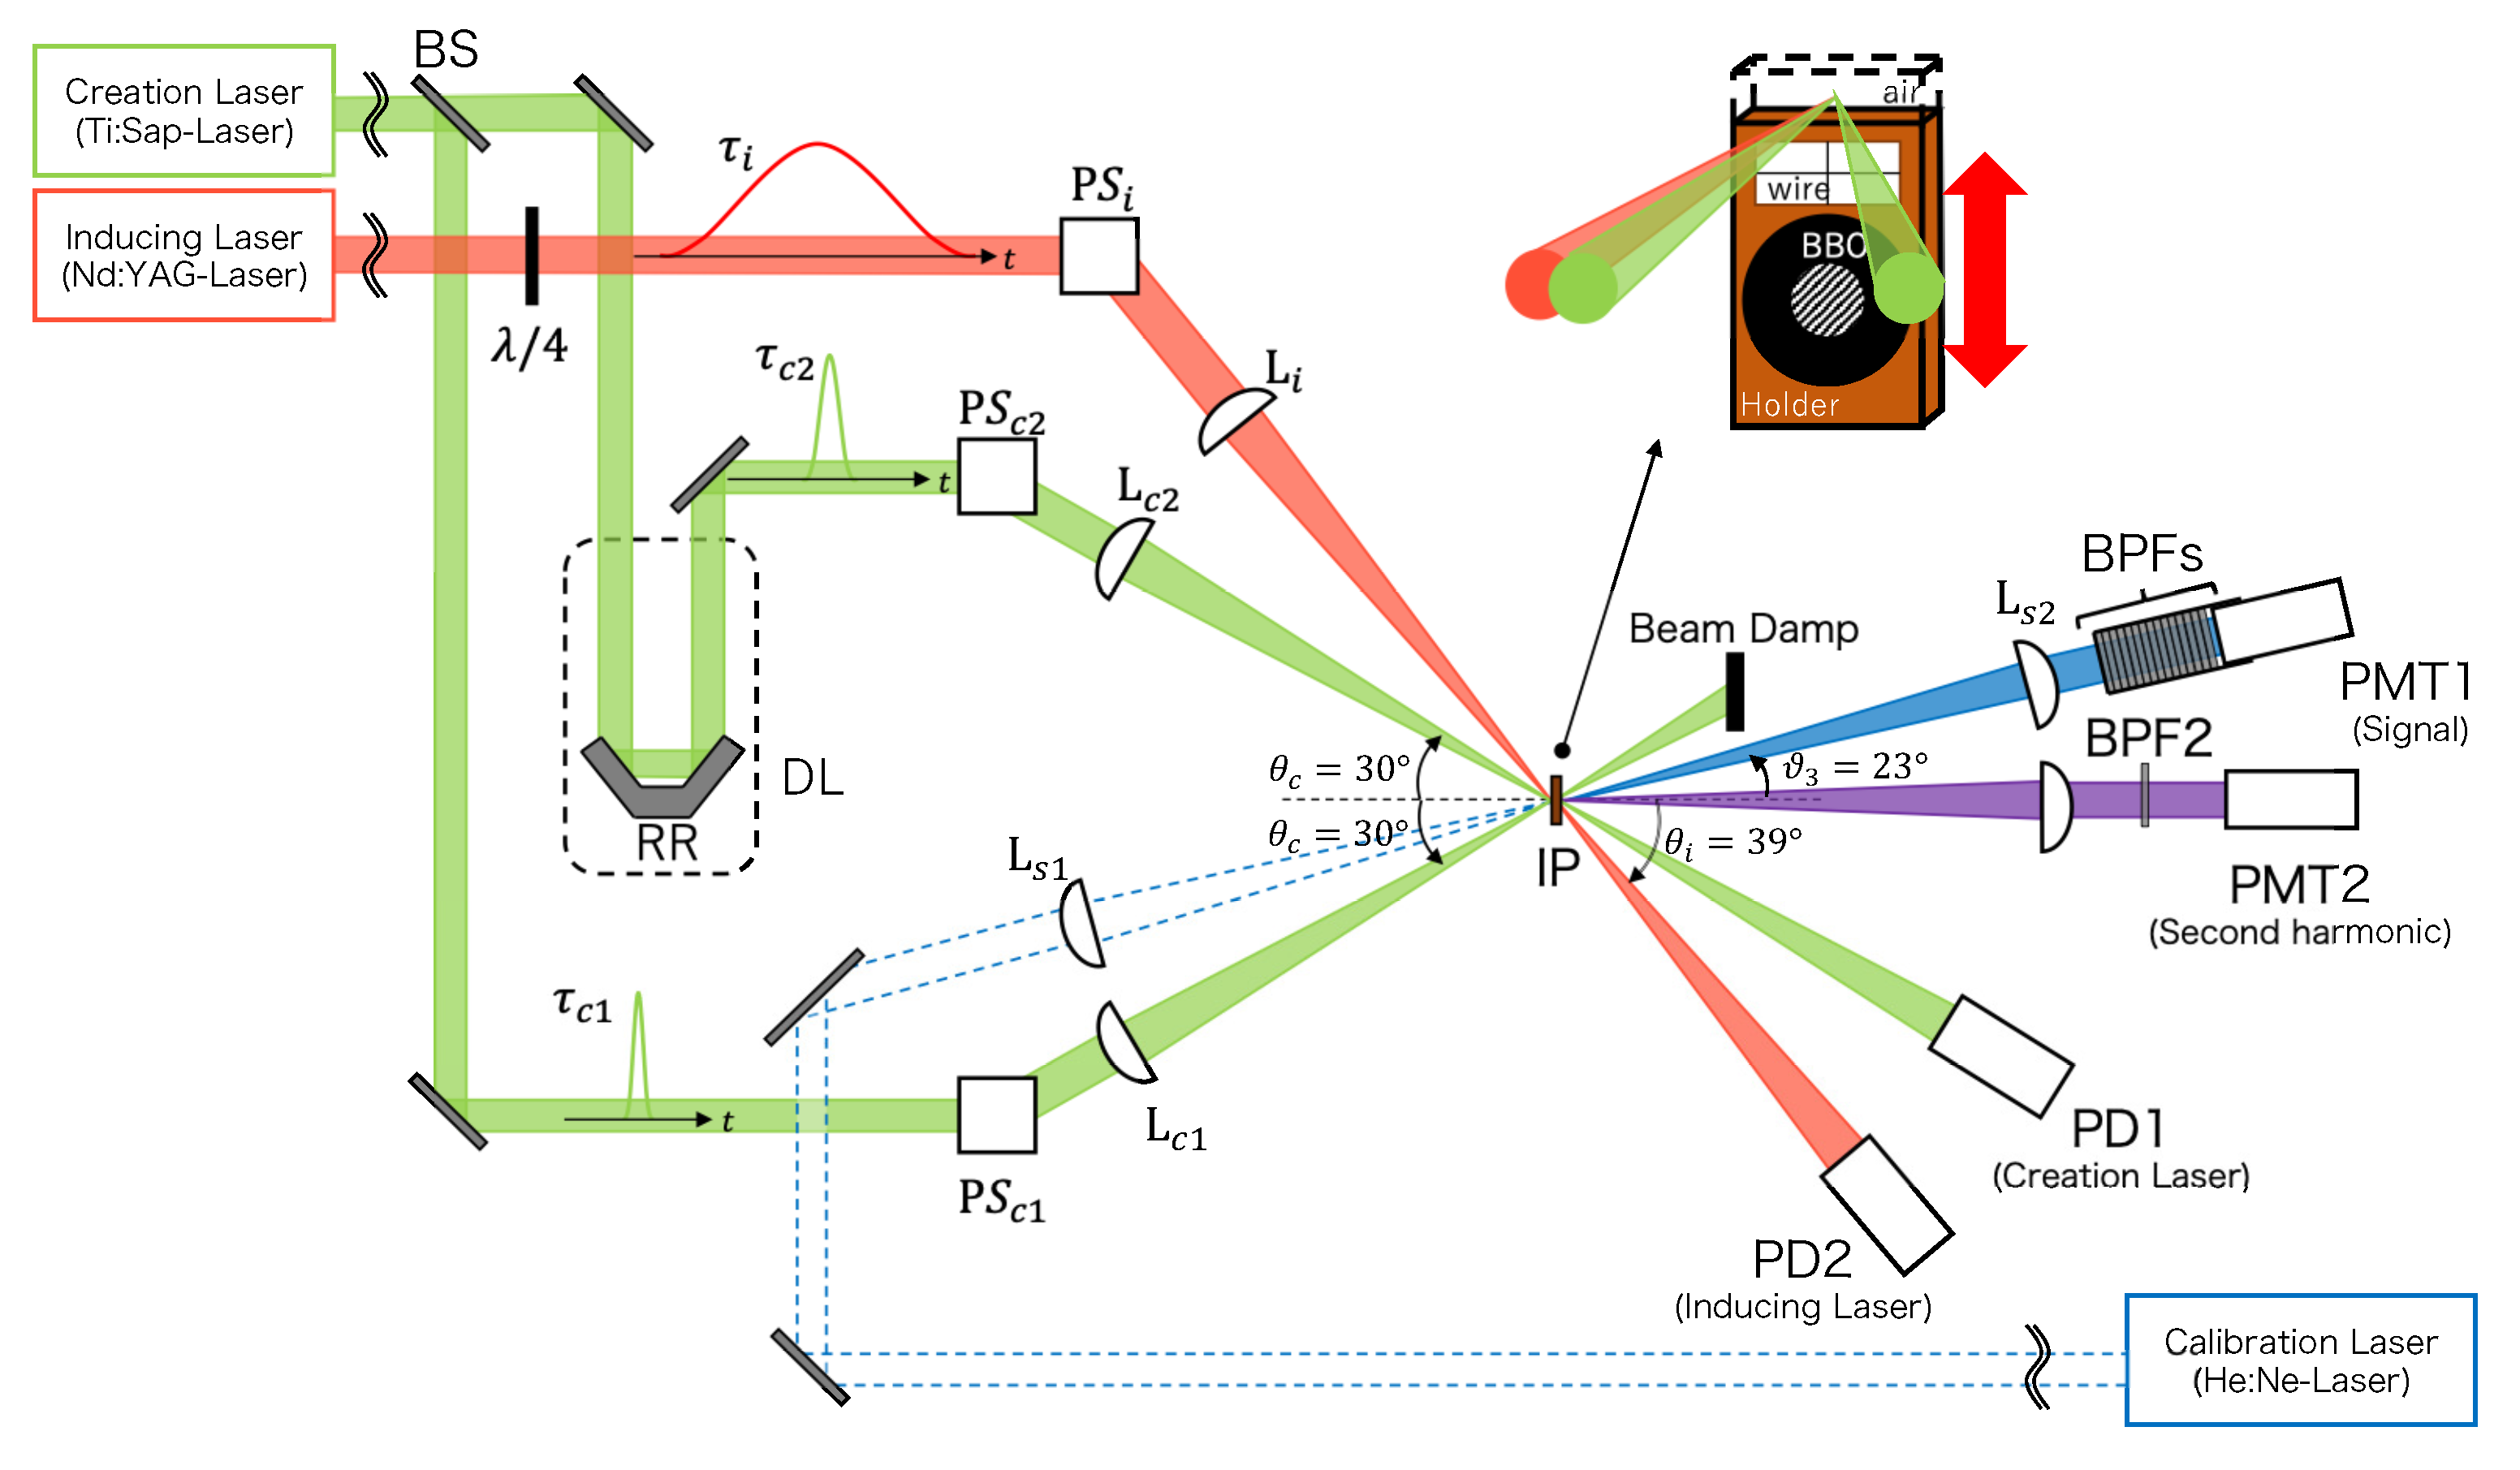
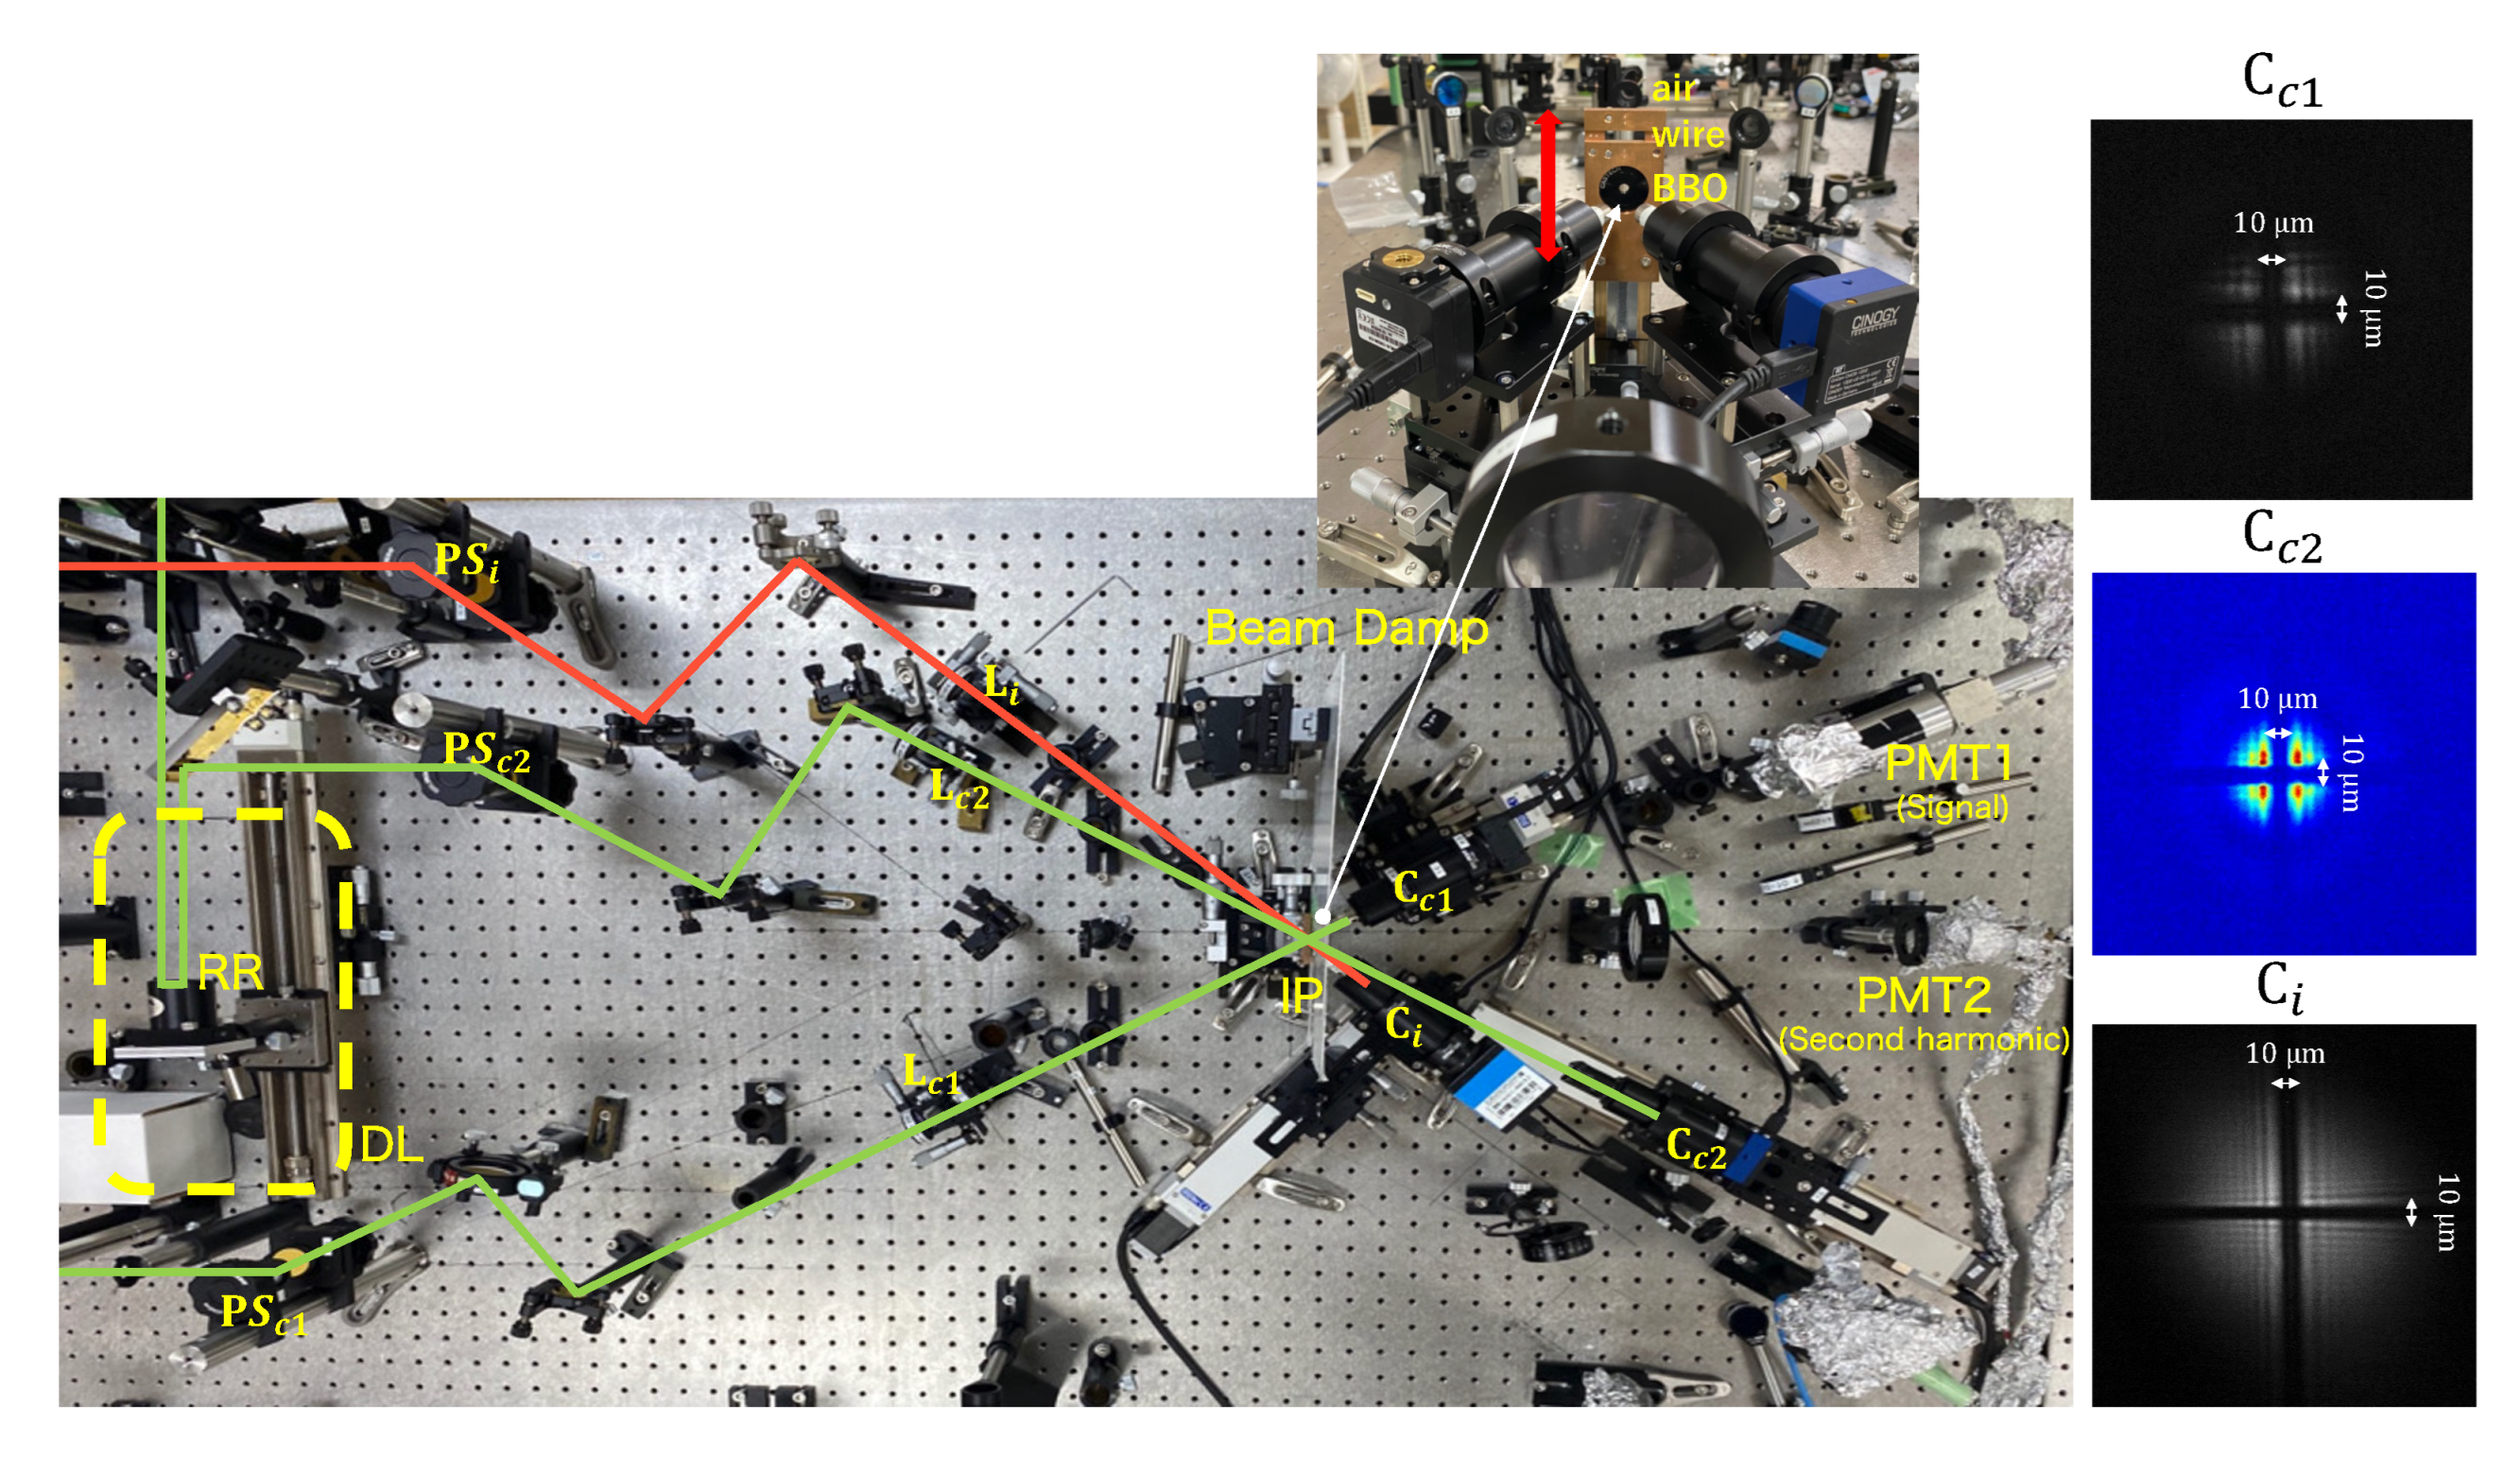
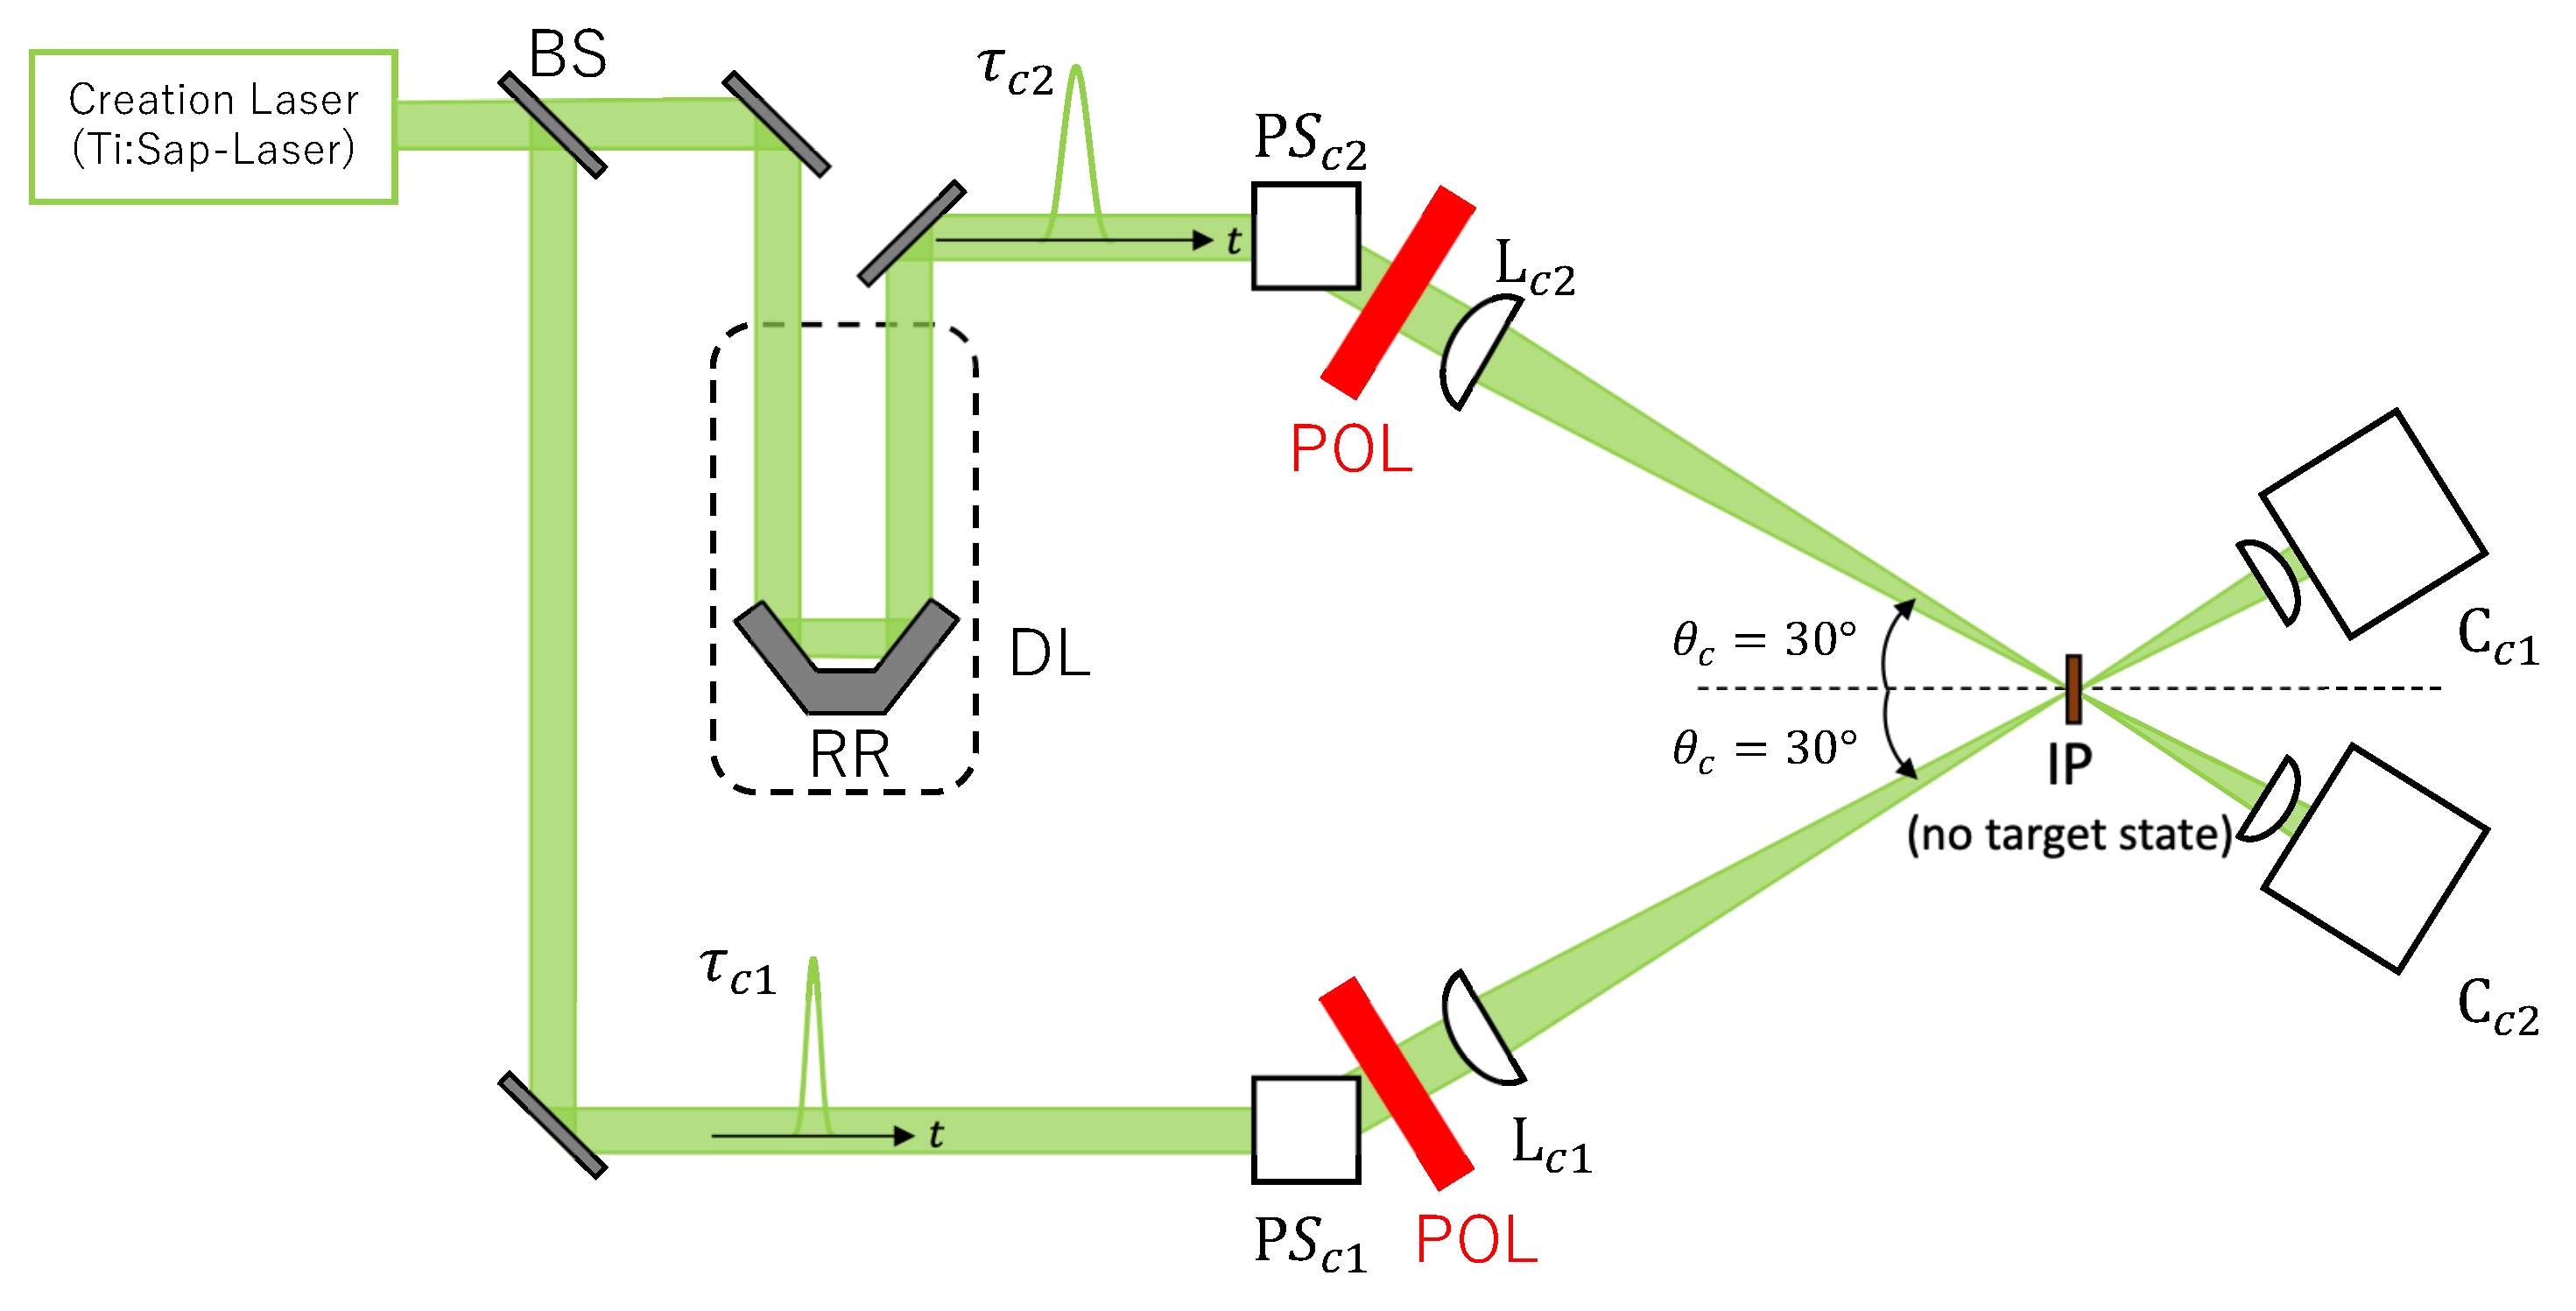
Figure 2 and Figure 3 show a schematic drawing of the searching setup and the photographs of the setup with the three focused laser spots at a thin cross-wire target, respectively. We used a Ti:Sapphire laser (T 6 -system) with ∼40 fs duration and a Nd:YAG laser with 9 ns duration for the creation and inducing fields, respectively. Both of them are available in the Institute for Chemical Research in Kyoto University. The central wavelengths of these lasers were 808 nm and 1064 nm, respectively. Creation laser pulses were injected into a beam splitter (BS) and bifurcated to prepare for two creation fields with the guaranteed synchronization. In this case, one of the creation lasers transmits BS, so the duration of the pulse is slightly elongated. Therefore, in principle, there is a finite duration difference in the two pulses ( τ c 1 , τ c 2 ). The central wavelength of signal photons is expected to be 651 nm via FWM: ω c 1 + ω c 2 ω i with creation photon energies ω c 1 and ω c 2 , respectively, and inducing photon energy ω i 
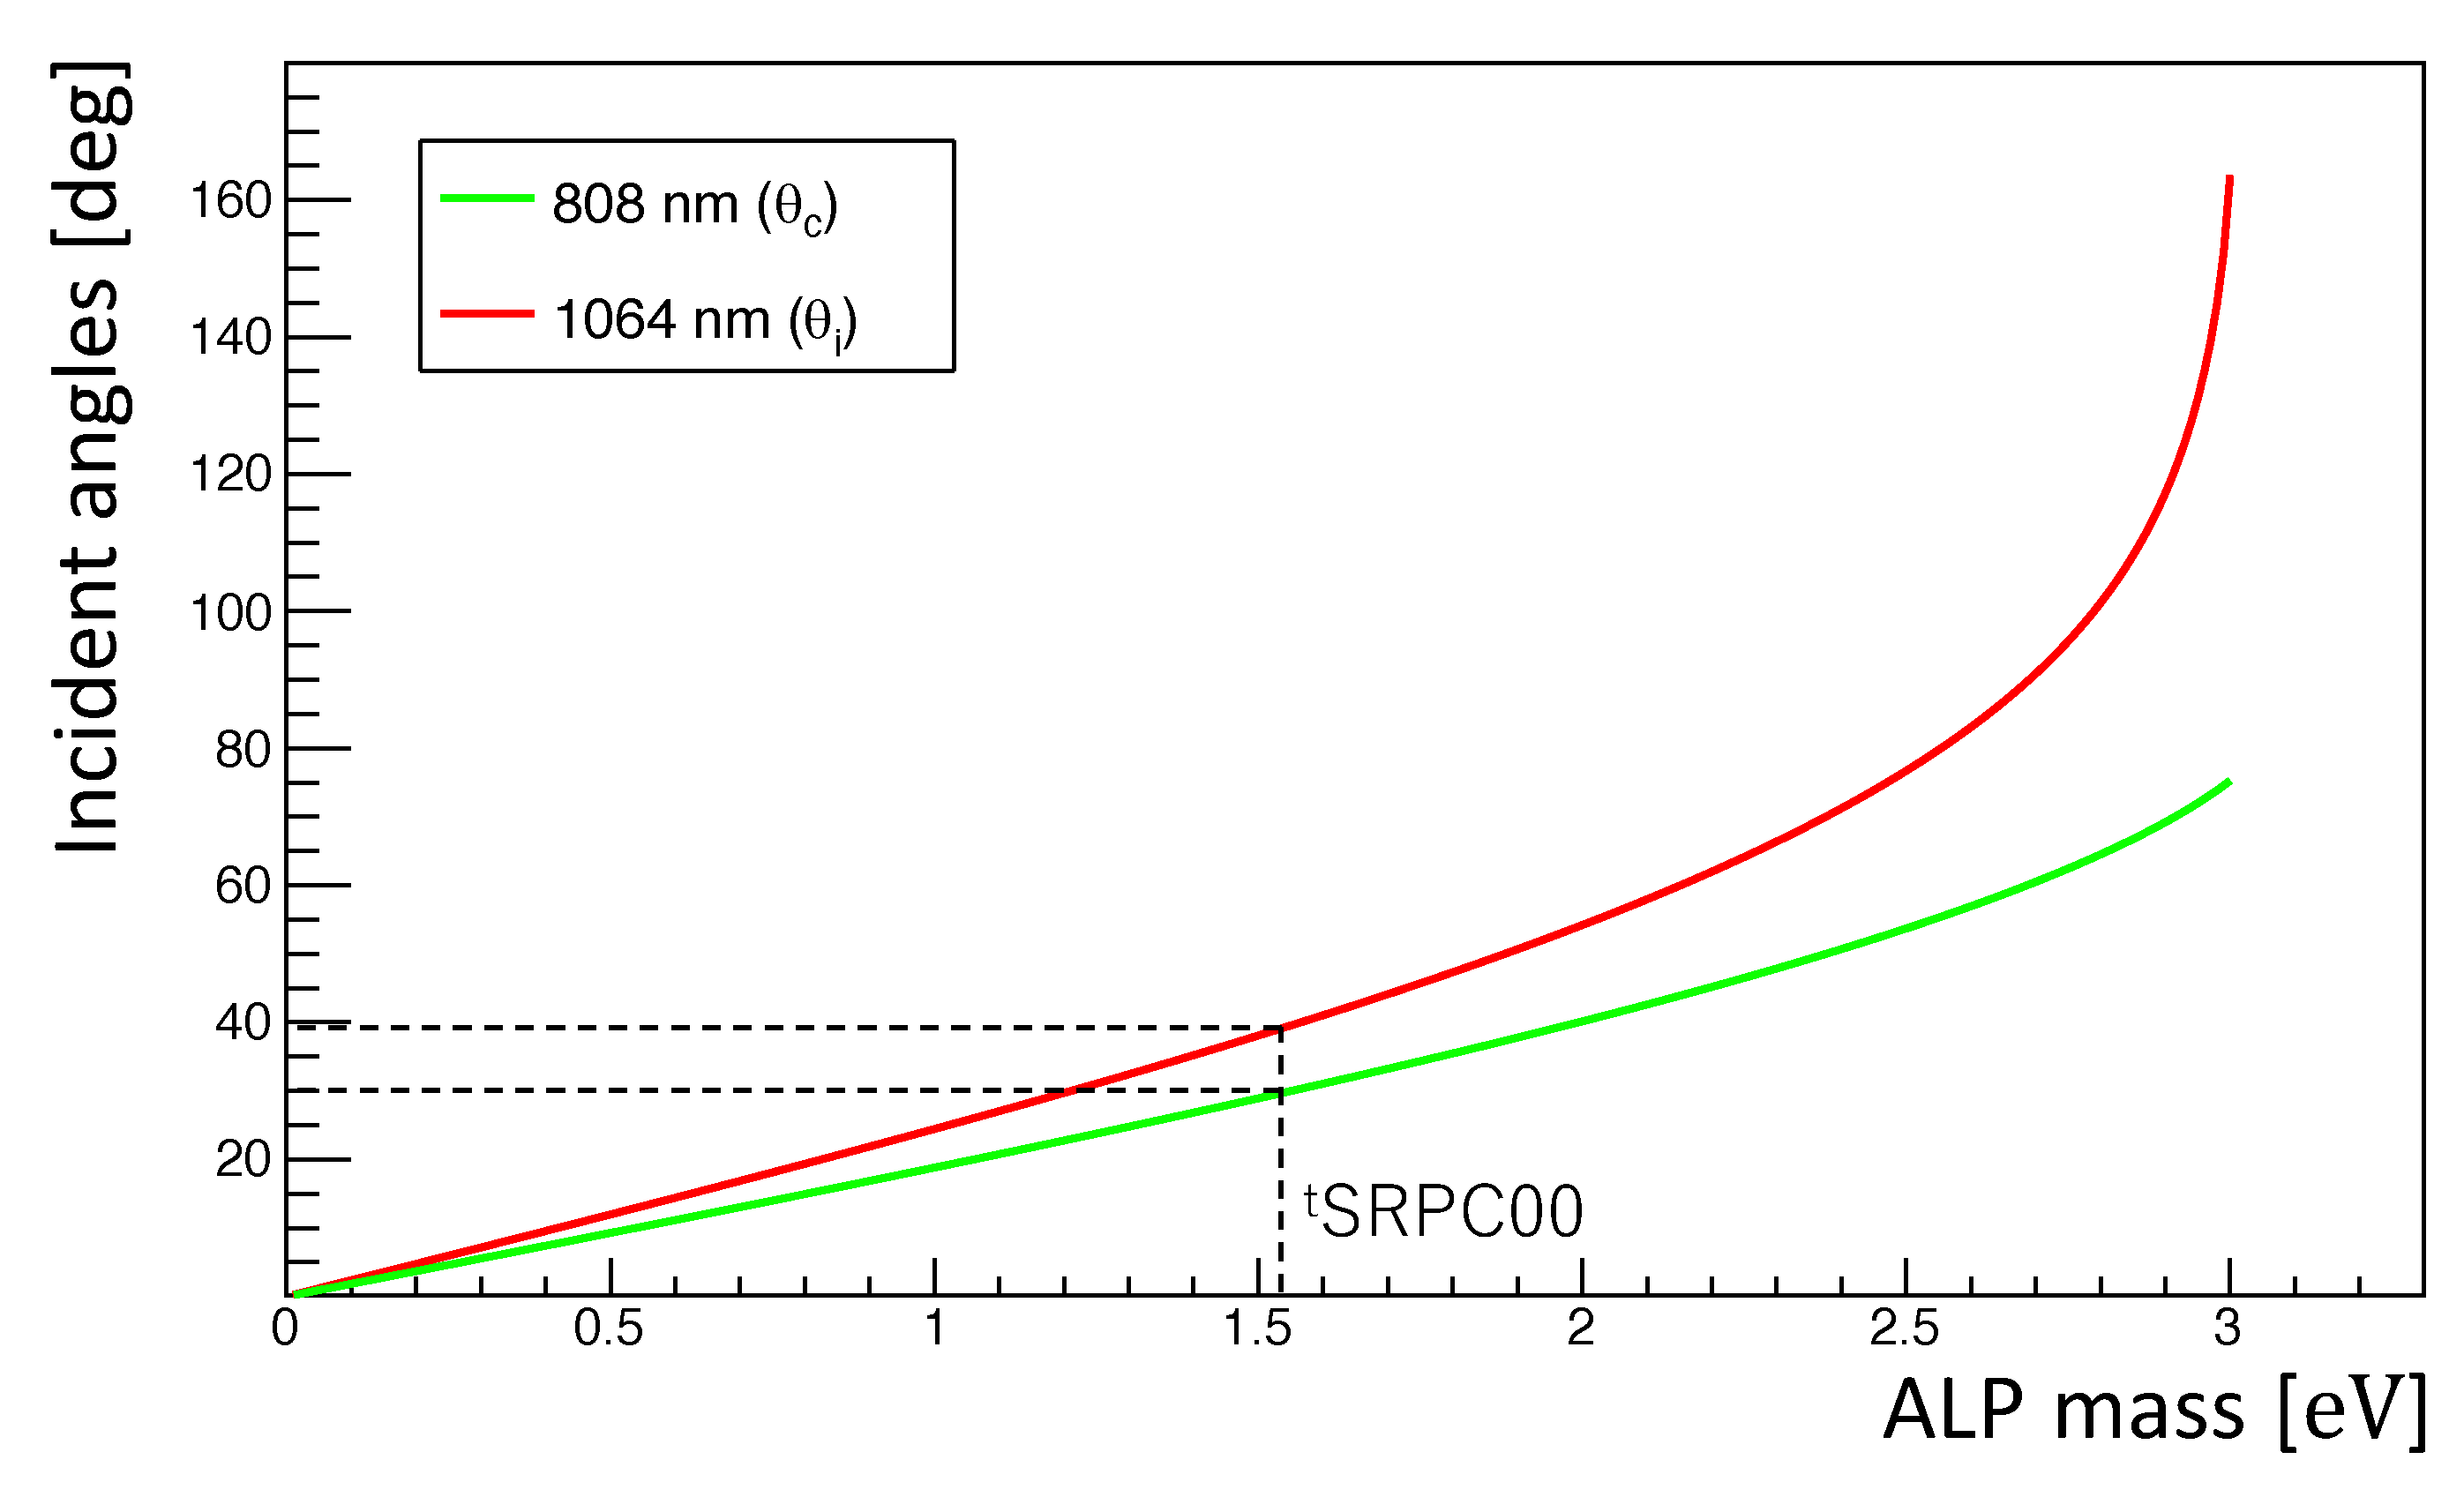
. In addition to energy conservation, momentum conservation requires the following angle relation: θ i = 39 . 1 and the most probable ϑ 3 = 22 . 7 for θ c = 30 . 0 resulting in the resonant mass m a = 1.53 eV with respect to the given central photon energies. Spacetime synchronization at the interaction point (IP) is required between two creation pulses branched at BS. Thus, a delay line (DL) equipped with a retroreflector (RR) was constructed on an motorized-stage at one of the creation laser paths (upper green line in Figure 2). By adjusting the position of RR along DL, the timing for the two pulse incidence at IP can be synchronized. In contrast, the inducing laser pulses were electrically triggered by a clock source synchronized with an upstream oscillator dedicated for the creation laser, and the injection timing was controlled by a Q-switch based on arrival times to two fast photodiodes (PD1, PD2) for one of two creation pulses and for inducing pulses by looking at an oscilloscope.
Individual beams were focused into IP via periscopes (PS c 1 , PS c 2 , PS i ) at 30 for the creation lasers and 39 for the inducing laser as shown in Figure 2. These incident angles and signal outgoing angle were determined so that the central signal wavelength from FWM becomes 651 nm via energy–momentum conservation.
Typically, a mirror is designed to maximize reflectivity at an angle of incidence (AOI) of 45 and thus a reflection angle of 45 which can maintain linearly polarized states with respect to linearly polarized incident beams. A periscope (PS) consists of a pair of mirrors aligned vertically with AOI of 45 while it can emit a beam in any directions by changing the optical axis (beam height). Thus, in the near future, we will be able to scan collision angles between the two creation beams by the introduction of PS. However, if we use PS to rotate emission directions at arbitrarily large angles, polarization states of beams will become elliptic in general. Furthermore, one of the creation laser paths contains RR, and it can also be a source of changing elliptical polarization states. Therefore, it is necessary to introduce complex Jones vectors for representing the polarization vectors with two independent angle parameters. The two angles representing the polarization state of the two creation lasers were determined by measuring Stokes parameters as explained in Appendix A. On the other hand, the inducing laser was set to circular polarization (left-handed) using a λ / 4 plate. This is because the theoretical interface is prepared for generally polarized states for the creation lasers and circularly polarized states for the inducing laser [24] in order to avoid complication on the numerical calculations to estimate inducible momentum ranges in the final state [21,24].
The two creation lasers and the inducing laser were focused at IP with lenses L c 1 , L c 2 and L i , respectively, with a common focal length of f = 300 mm as shown in Figure 2. IP was equipped with a special holder vertically consisting of a cross-wire of 10 μ m thickness, a BBO crystal which is a nonlinear crystal of 50 μ m thickness, and a no target state (air) as shown in the insets of Figure 2 and Figure 3. By attaching this special holder to the z-axis stage, cross-wire (spatial overlap), BBO (time synchronization), and no target state (search experiment) can be switched independently of the other optical elements. The camera systems (C c 1 , C c 2 , C i ) and photodetectors were located downstream from IP. Since individual camera systems are installed on motorized-stages, they can be moved to appropriate positions for checking the spatial overlap of the three beam spots, the time synchronization between the two or three laser pulses and performing searches, depending on the purposes. The spatial overlap was ensured by aligning the center of individual laser spots to the crossed point of the two thin wires as shown in the three pictures in Figure 3. The beam waist for the inducing laser was enlarged compared to those of the creation lasers so that the creation laser spots could be stably included in the volume of the inducing field.
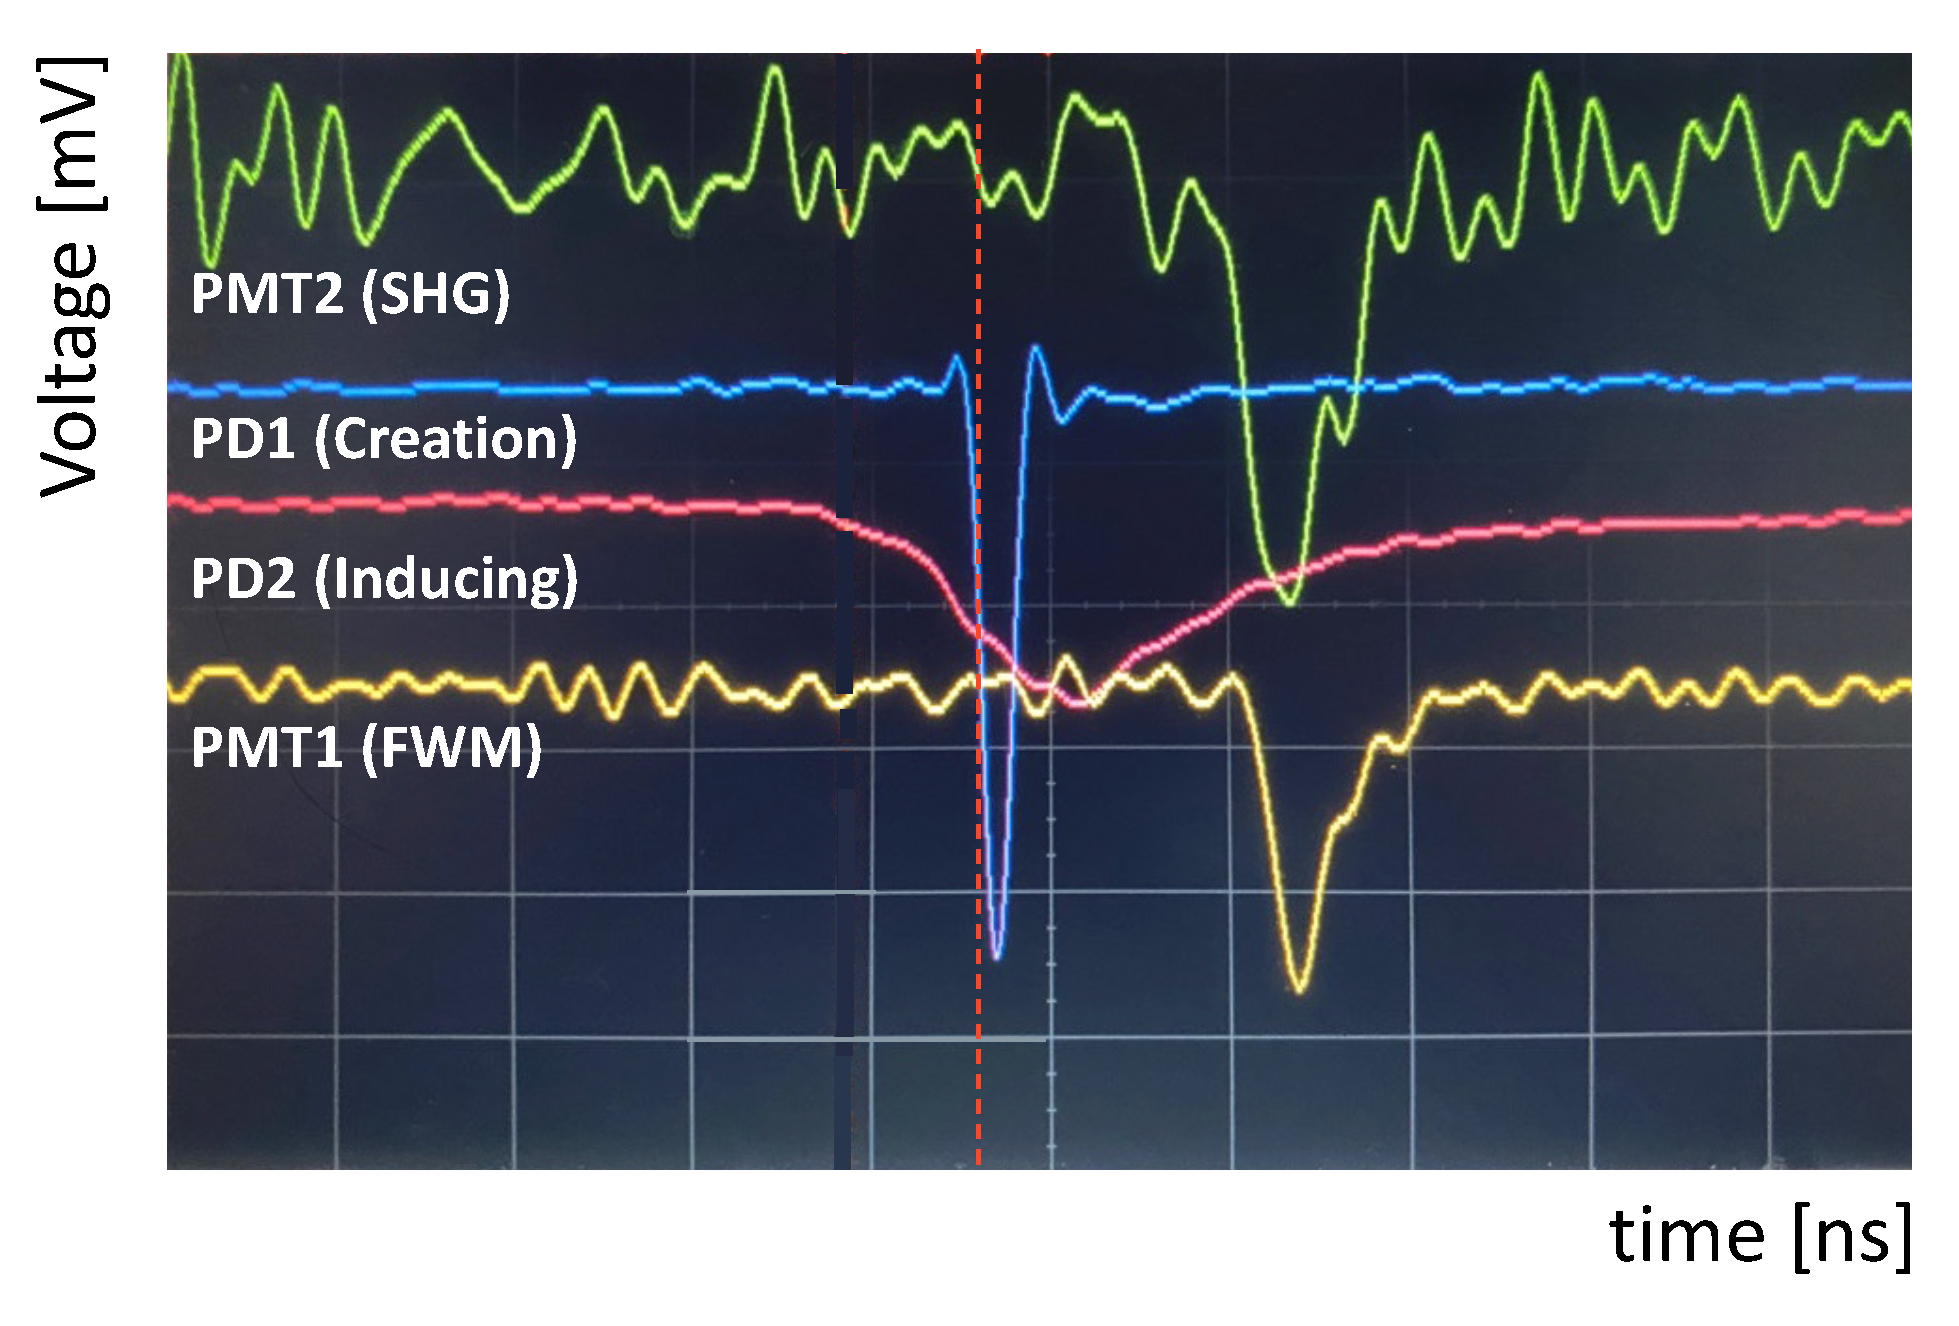
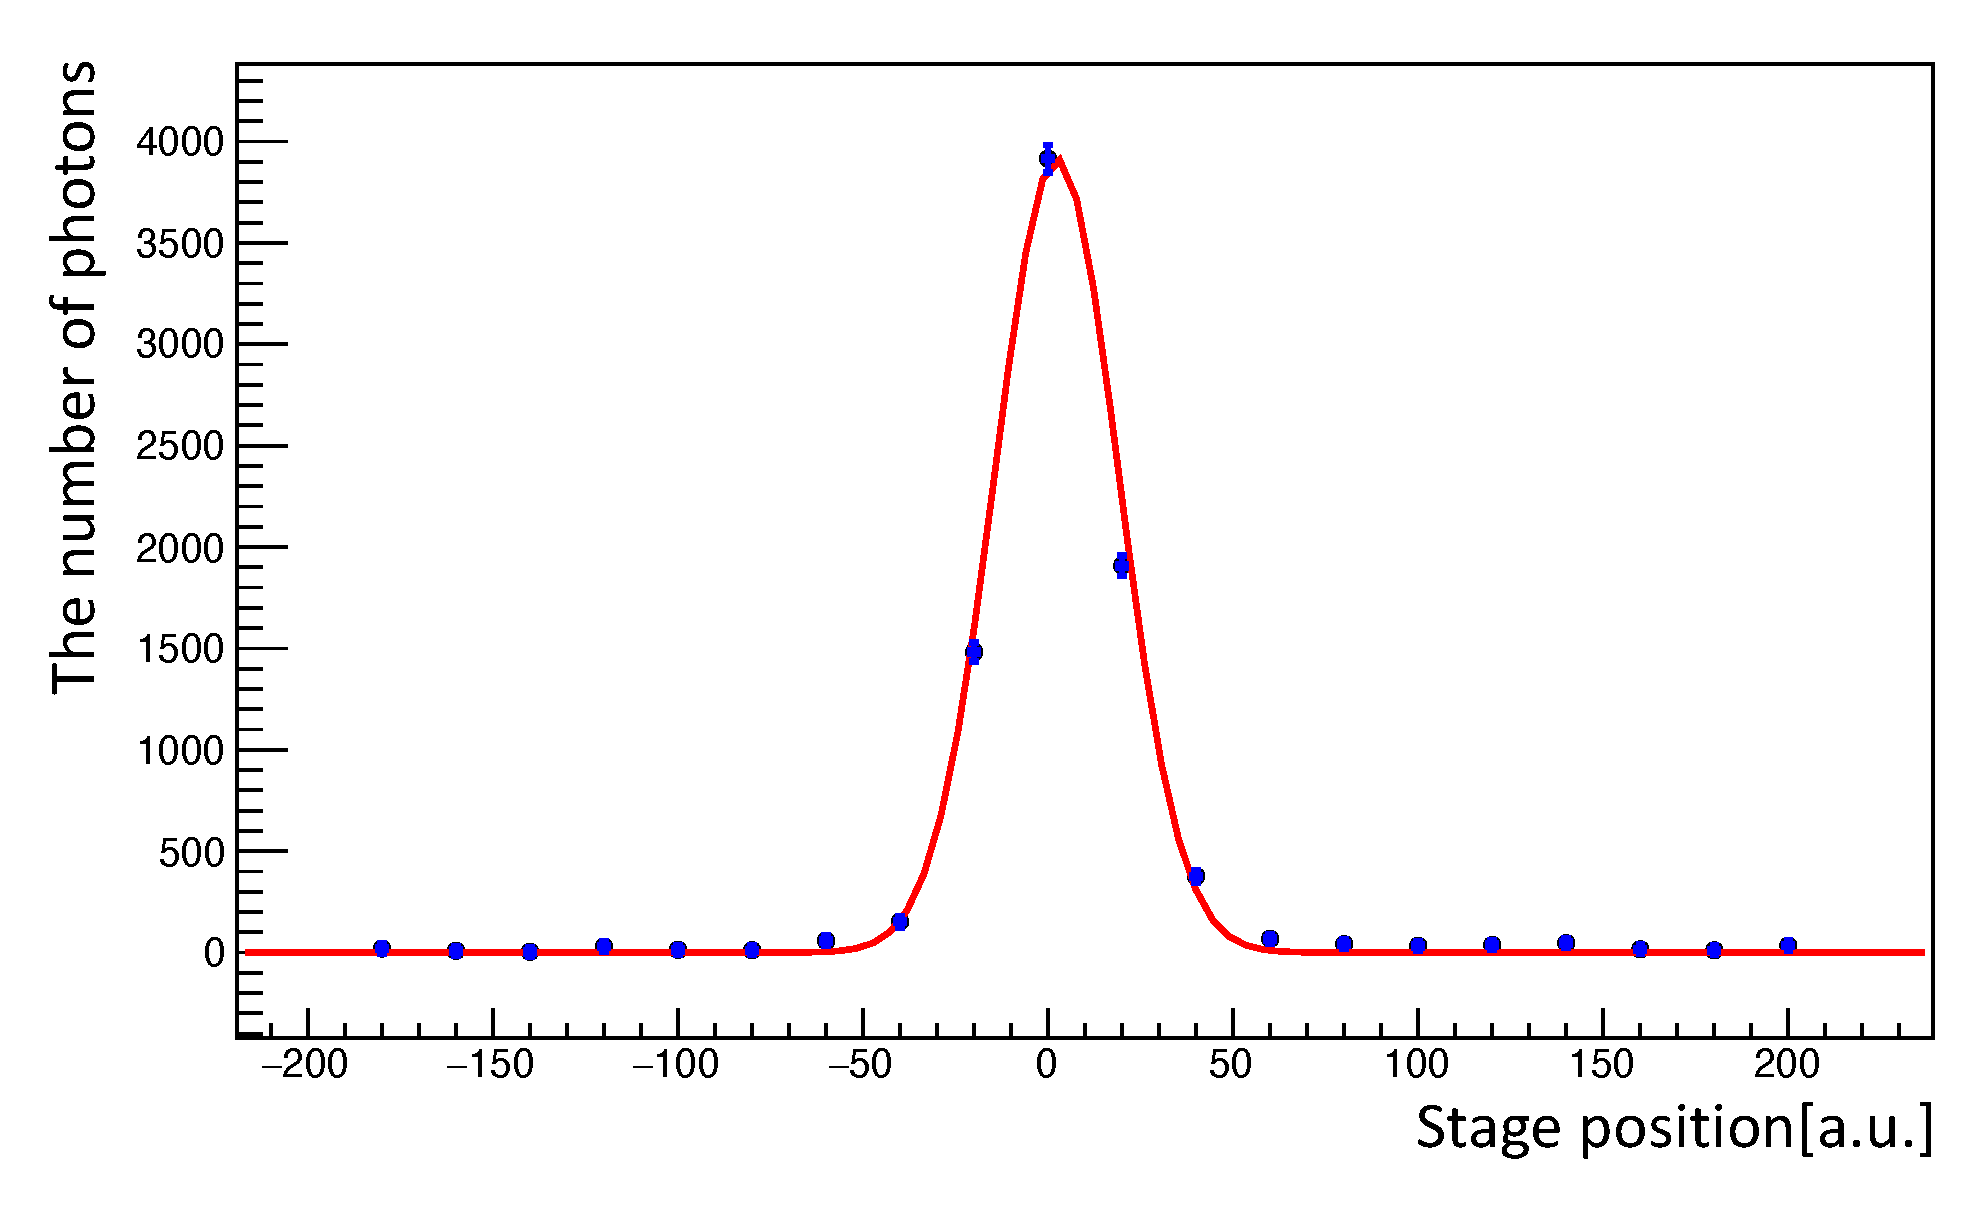
After ensuring the spatial overlap between the three beams at IP, time synchronization was first performed with the two creation lasers. The duration of the creation laser pulses was ∼40 fs. It is impossible to ensure synchronization using a conventional photodetector due to the limited time resolution of at most ∼10 ps. Therefore, space–time synchronization was confirmed by observing second harmonic generation from the BBO crystal, which is known as a fast nonlinear optical effect with O (fs) resolution when two high-intensity pulses spatiotemporally overlap. DL was actually adjusted by measuring the number of second harmonic photons as a function of RR position. In addition to the two creation pulse overlap, when the inducing laser spatiotemporally overlaps with the creation pulses, FWM in BBO may also be produced. A second harmonic from the two creation pulses and FWM from the three pulse overlap emerge at different angles. We note that FWM must conserve energy–momentum, while the second harmonic conserves energy but not necessarily momentum because translation symmetry is broken in the BBO crystal.
Second harmonic was detected using a photomultiplier tube (PMT2) by selecting a second harmonic of the creation laser wavelength, 404 nm, by a band-pass filter (BPF2). Fifteen band-pass filters (BPFs) were placed in front of the PMT for FWM detection (PMT1) in order to mainly remove residual beam photons. The BPFs were installed in multiple layers of three types of BPFs so that they eliminate wavelengths of the creation laser and the second harmonic of the creation laser, the inducing laser and its second harmonic. In this way, PMT1 can detect photons only in the proper energy band consistent with FWM. Second harmonic and FWM photons from BBO ensured the space–time synchronization of the three lasers. Since the duration of the inducing laser was 9 ns, the time resolutions of a typical photo-device, ∼40 ps, were sufficient to adjust arrival time difference between second harmonic and FWM photons, both of which were measured with photomultipliers with the same time resolution of 0.75 ns. After the space–time synchronization between the three beams was ensured, the vertical position of the holder was set at the no-target position, and we conducted the search experiment.

3. Space–Time Synchronization

As shown in the pictures of the three beam spots in Figure 3 (right), the centers of the three beams’ focal spots were adjusted at the crossed point of the crossed wires of 10 μ m thickness. This guarantees the spatial overlap between the three beams.
Figure 4 shows a picture of oscilloscope waveforms when space–time synchronization between three beams was satisfied, where photodiode signals PD1 (creation laser), PD2 (inducing laser), and signals from photomultipliers PMT2 (second harmonic generation from BBO), PMT1(four-wave mixing from BBO) in Figure 2 are simultaneously displayed. When the BBO crystal was inserted to the position of IP, we clearly confirmed the time synchronization between the three beams.
For a fine timing tuning between the two creation short pulses, we took a look at the number of FWM photons detected by PMT1 as a function of stage position in the delay line (DL) in Figure 2. Figure 5 shows the clear peak structure at the best synchronization point.

4. Data Analysis

PMT1 detects photons from various background sources in addition to signal photons via FWM. The number of photons detected by PMT1 contains photons or photon-like events in the following four categories: the number of signal photons, n s i g , originating from the combination between the creation and inducing laser pulses, the number of background photons, n c , originating from only the creation laser pulses, the number of background photons, n i , originating from only the inducing laser pulses, and the number of noise photons, n p 
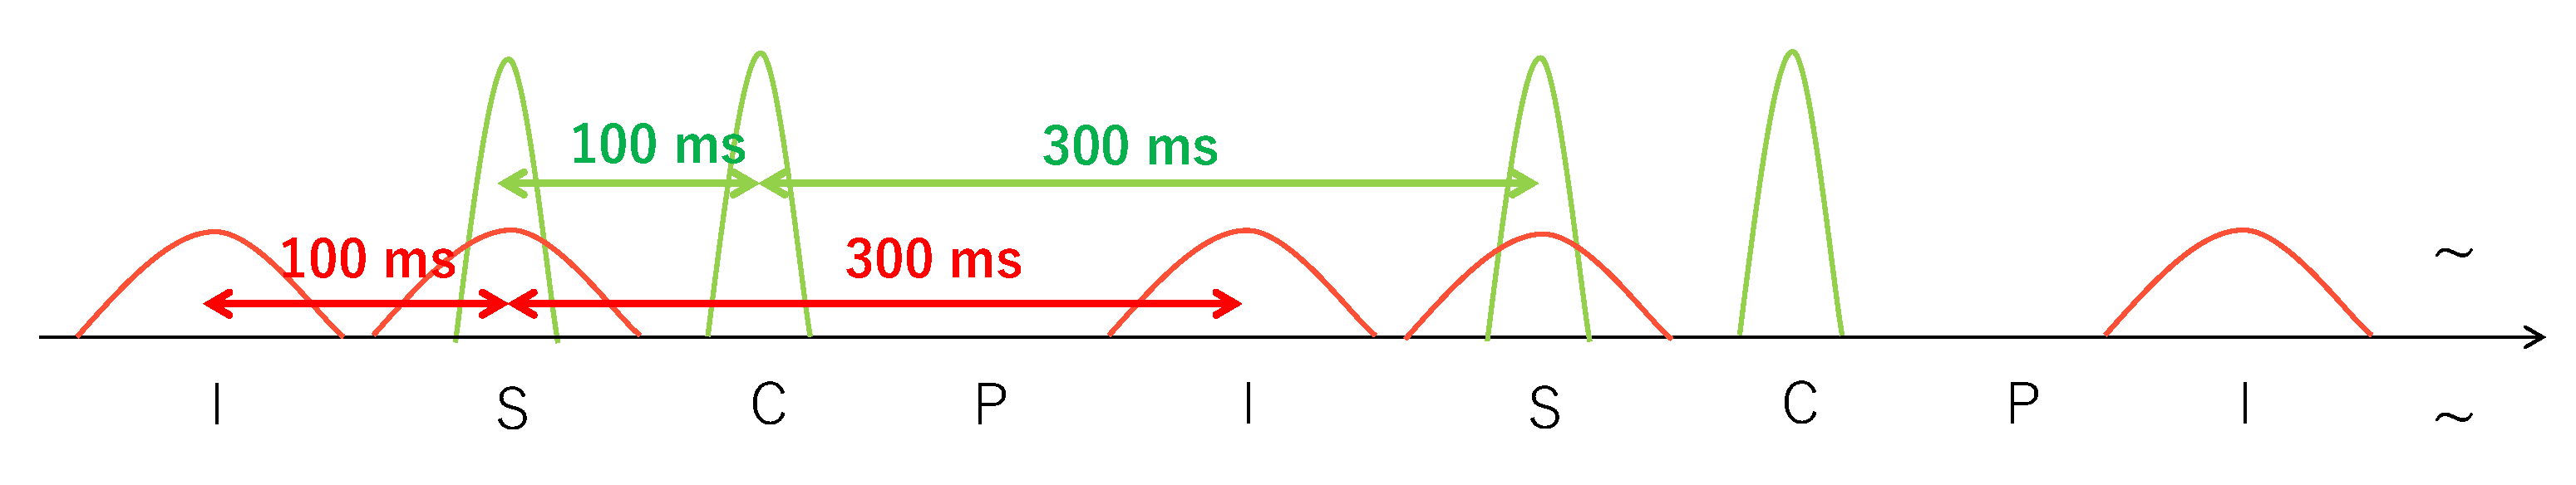
, when no beam exists, that is, pedestal. In order to extract the number of signal photons, the number of photons in the above three background categories must be subtracted. Therefore, in the search experiment, both the creation and inducing laser pulses were injected at different irregular intervals of 5 Hz as illustrated in Figure 6 in order to successively form the four patterns. The number of measured photons in each pattern is expressed as Equation (4). The number of photons detected in P-pattern, N P , is the pedestal component from environmental noises including thermal noise from PMT1. The number of photons detected in C- and I-pattern, N C , and N I , respectively, include the number of photons originating from individual laser focus such as plasma creation on top of the pedestals. The number of photons detected in S-pattern, N S , includes the number of signal photons on top of all the other background sources:
N S = n s i g + n c + n i + n p N C = n c + n p N I = n i + n p N P = n p
These four patterns were substituted into Equation (5), in order to extract the observed number of FWM photons
n o b s = N S ( N C N P ) ( N I N P ) N P .
In the search, the two photodiodes (PD1, PD2) were placed downstream of the interaction point (IP) in Figure 2. Four patterns, S, I, C, and P, were defined based on analog waveforms obtained from PD1 and PD2 assigned for the creation and inducing lasers, respectively. The number of photons was reconstructed from the voltage–time relation of analog signals from PMT1 with a waveform digitizer and applying a peak-finding algorithm to simultaneously determine the number of photons and their arrival times from falling edges of amplitudes of waveforms. The details of these instruments and the peak analysis method are described in [22].
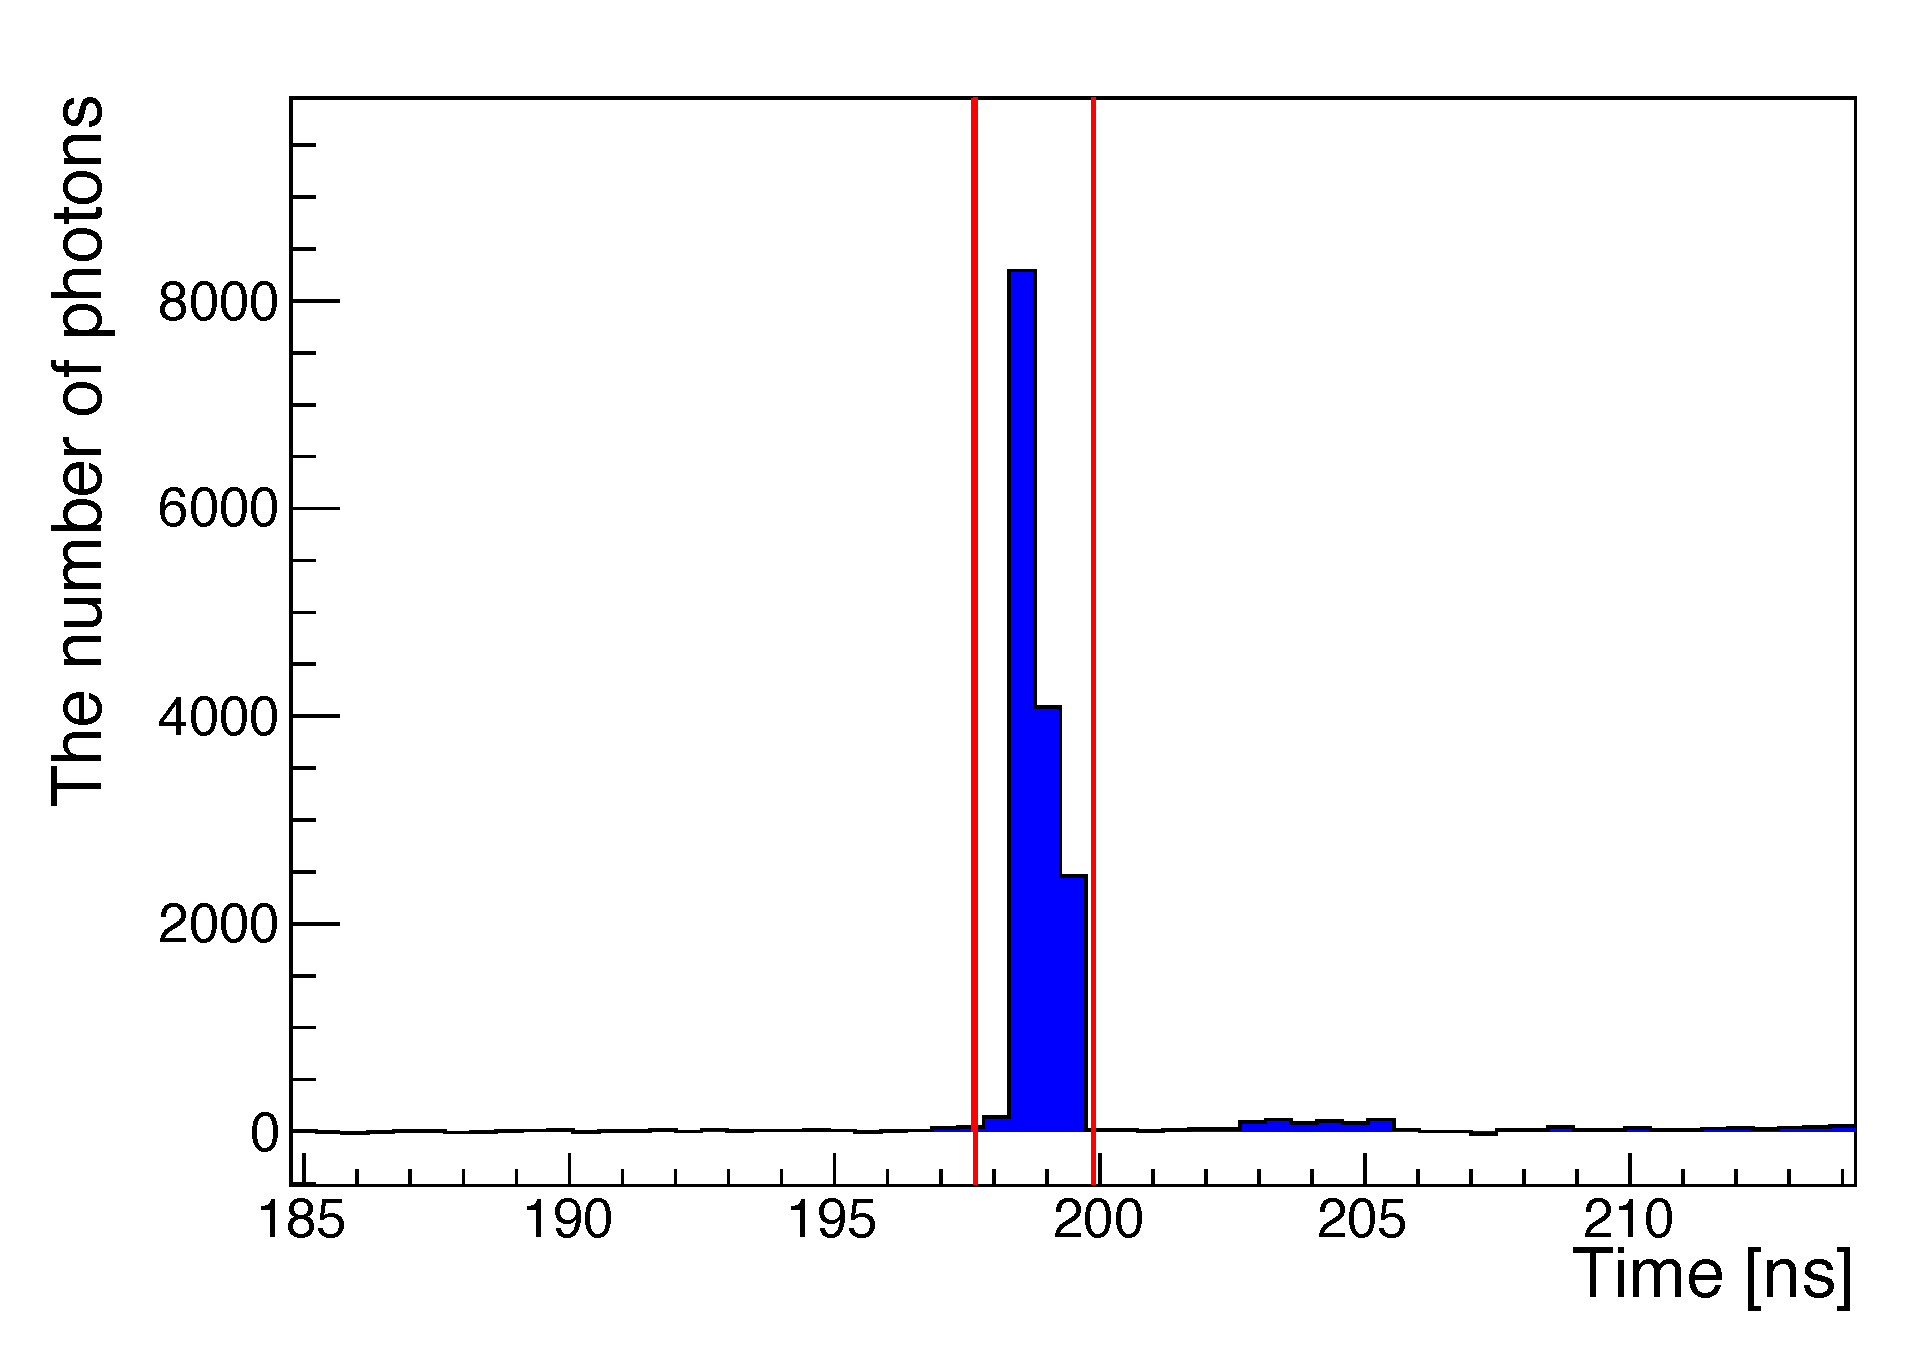
In advance of the search, the expected arrival time of FWM photons in vacuum was determined by the arrival timing of FWM photons in BBO, which ensures space–time synchronization between focused three laser pulses. Figure 7 shows the arrival time distribution of FWM photons from BBO, where 1000 shots in S-pattern without background subtraction from the other patterns are shown. In the following analysis, n o b s always implies the number of observed FWM photons by integrating photon-like charges in PMT1 within the arrival time window of 2.5 ns, which is indicated by the two vertical lines in Figure 7.

5. Search Results

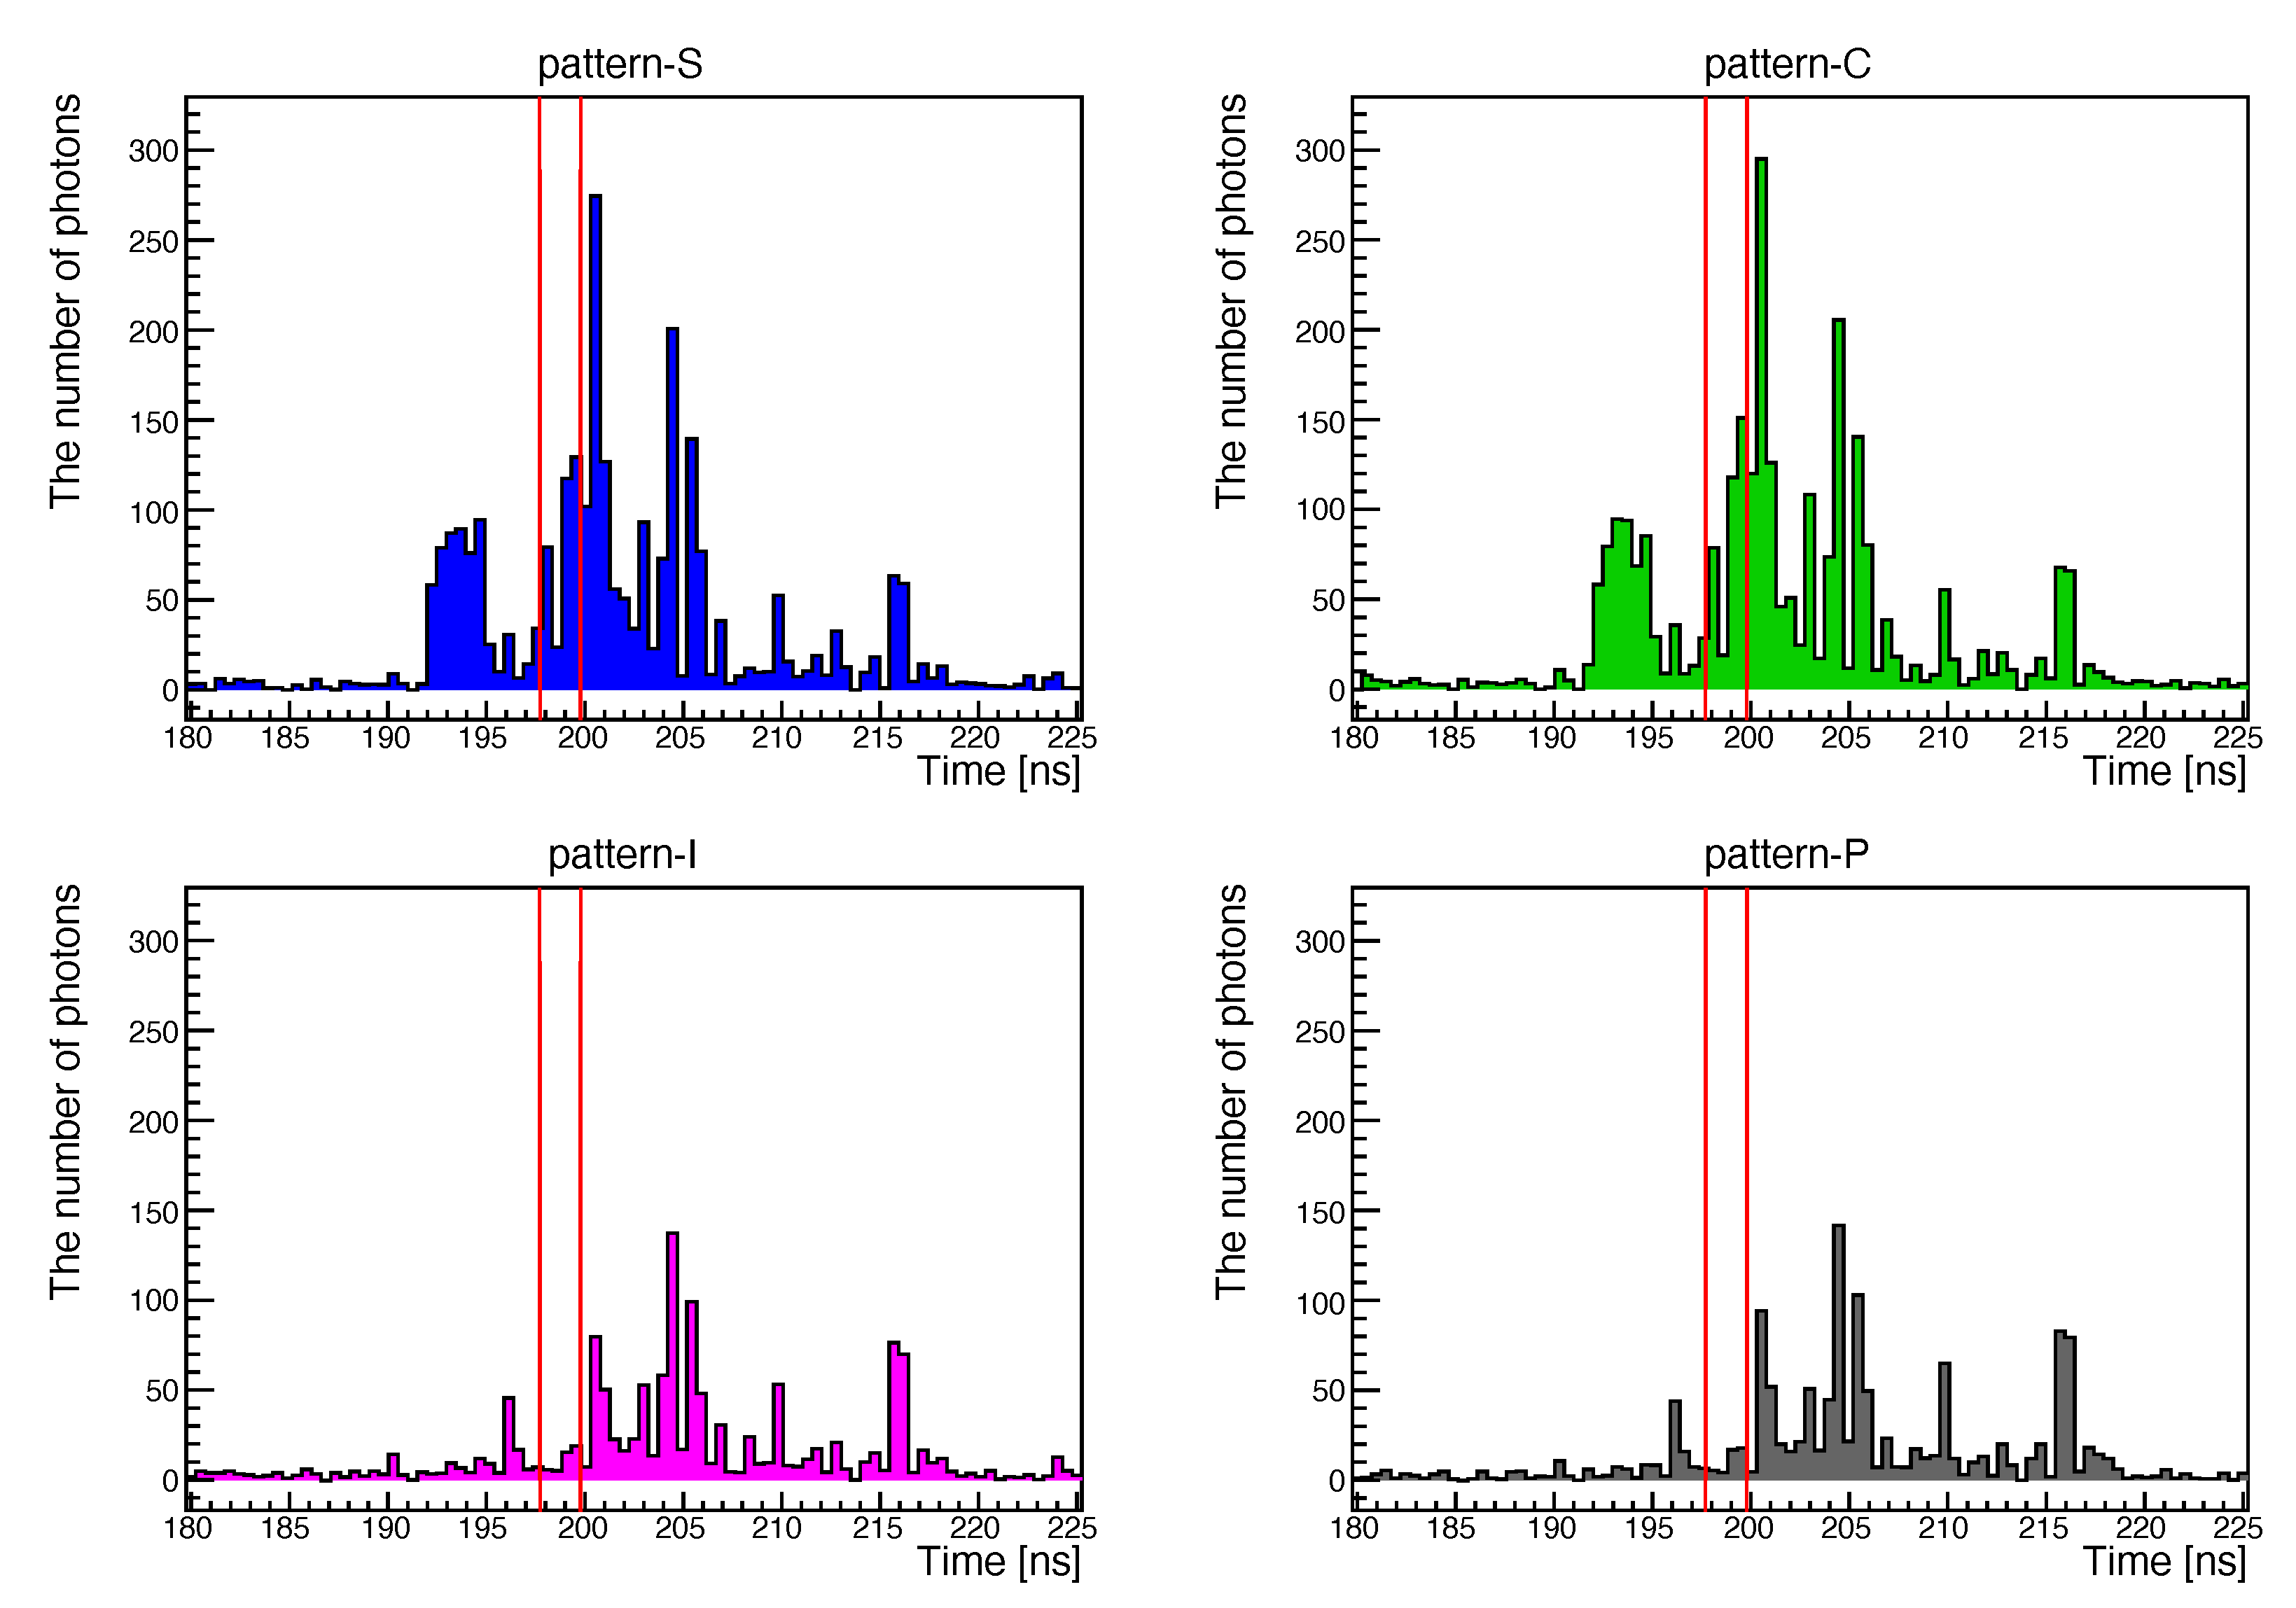
Figure 8 shows arrival time distributions of photons in individual patterns. The histograms in S, C, I, and P patterns are shown in the upper left (blue), upper right (green), lower left (pink), and lower right (gray), respectively. The expected arrival time windows were indicated by the two vertical lines. The total number of laser shots was 48,000 in the four patterns and thus the valid statistics in the S-pattern was 12,000 shots. 
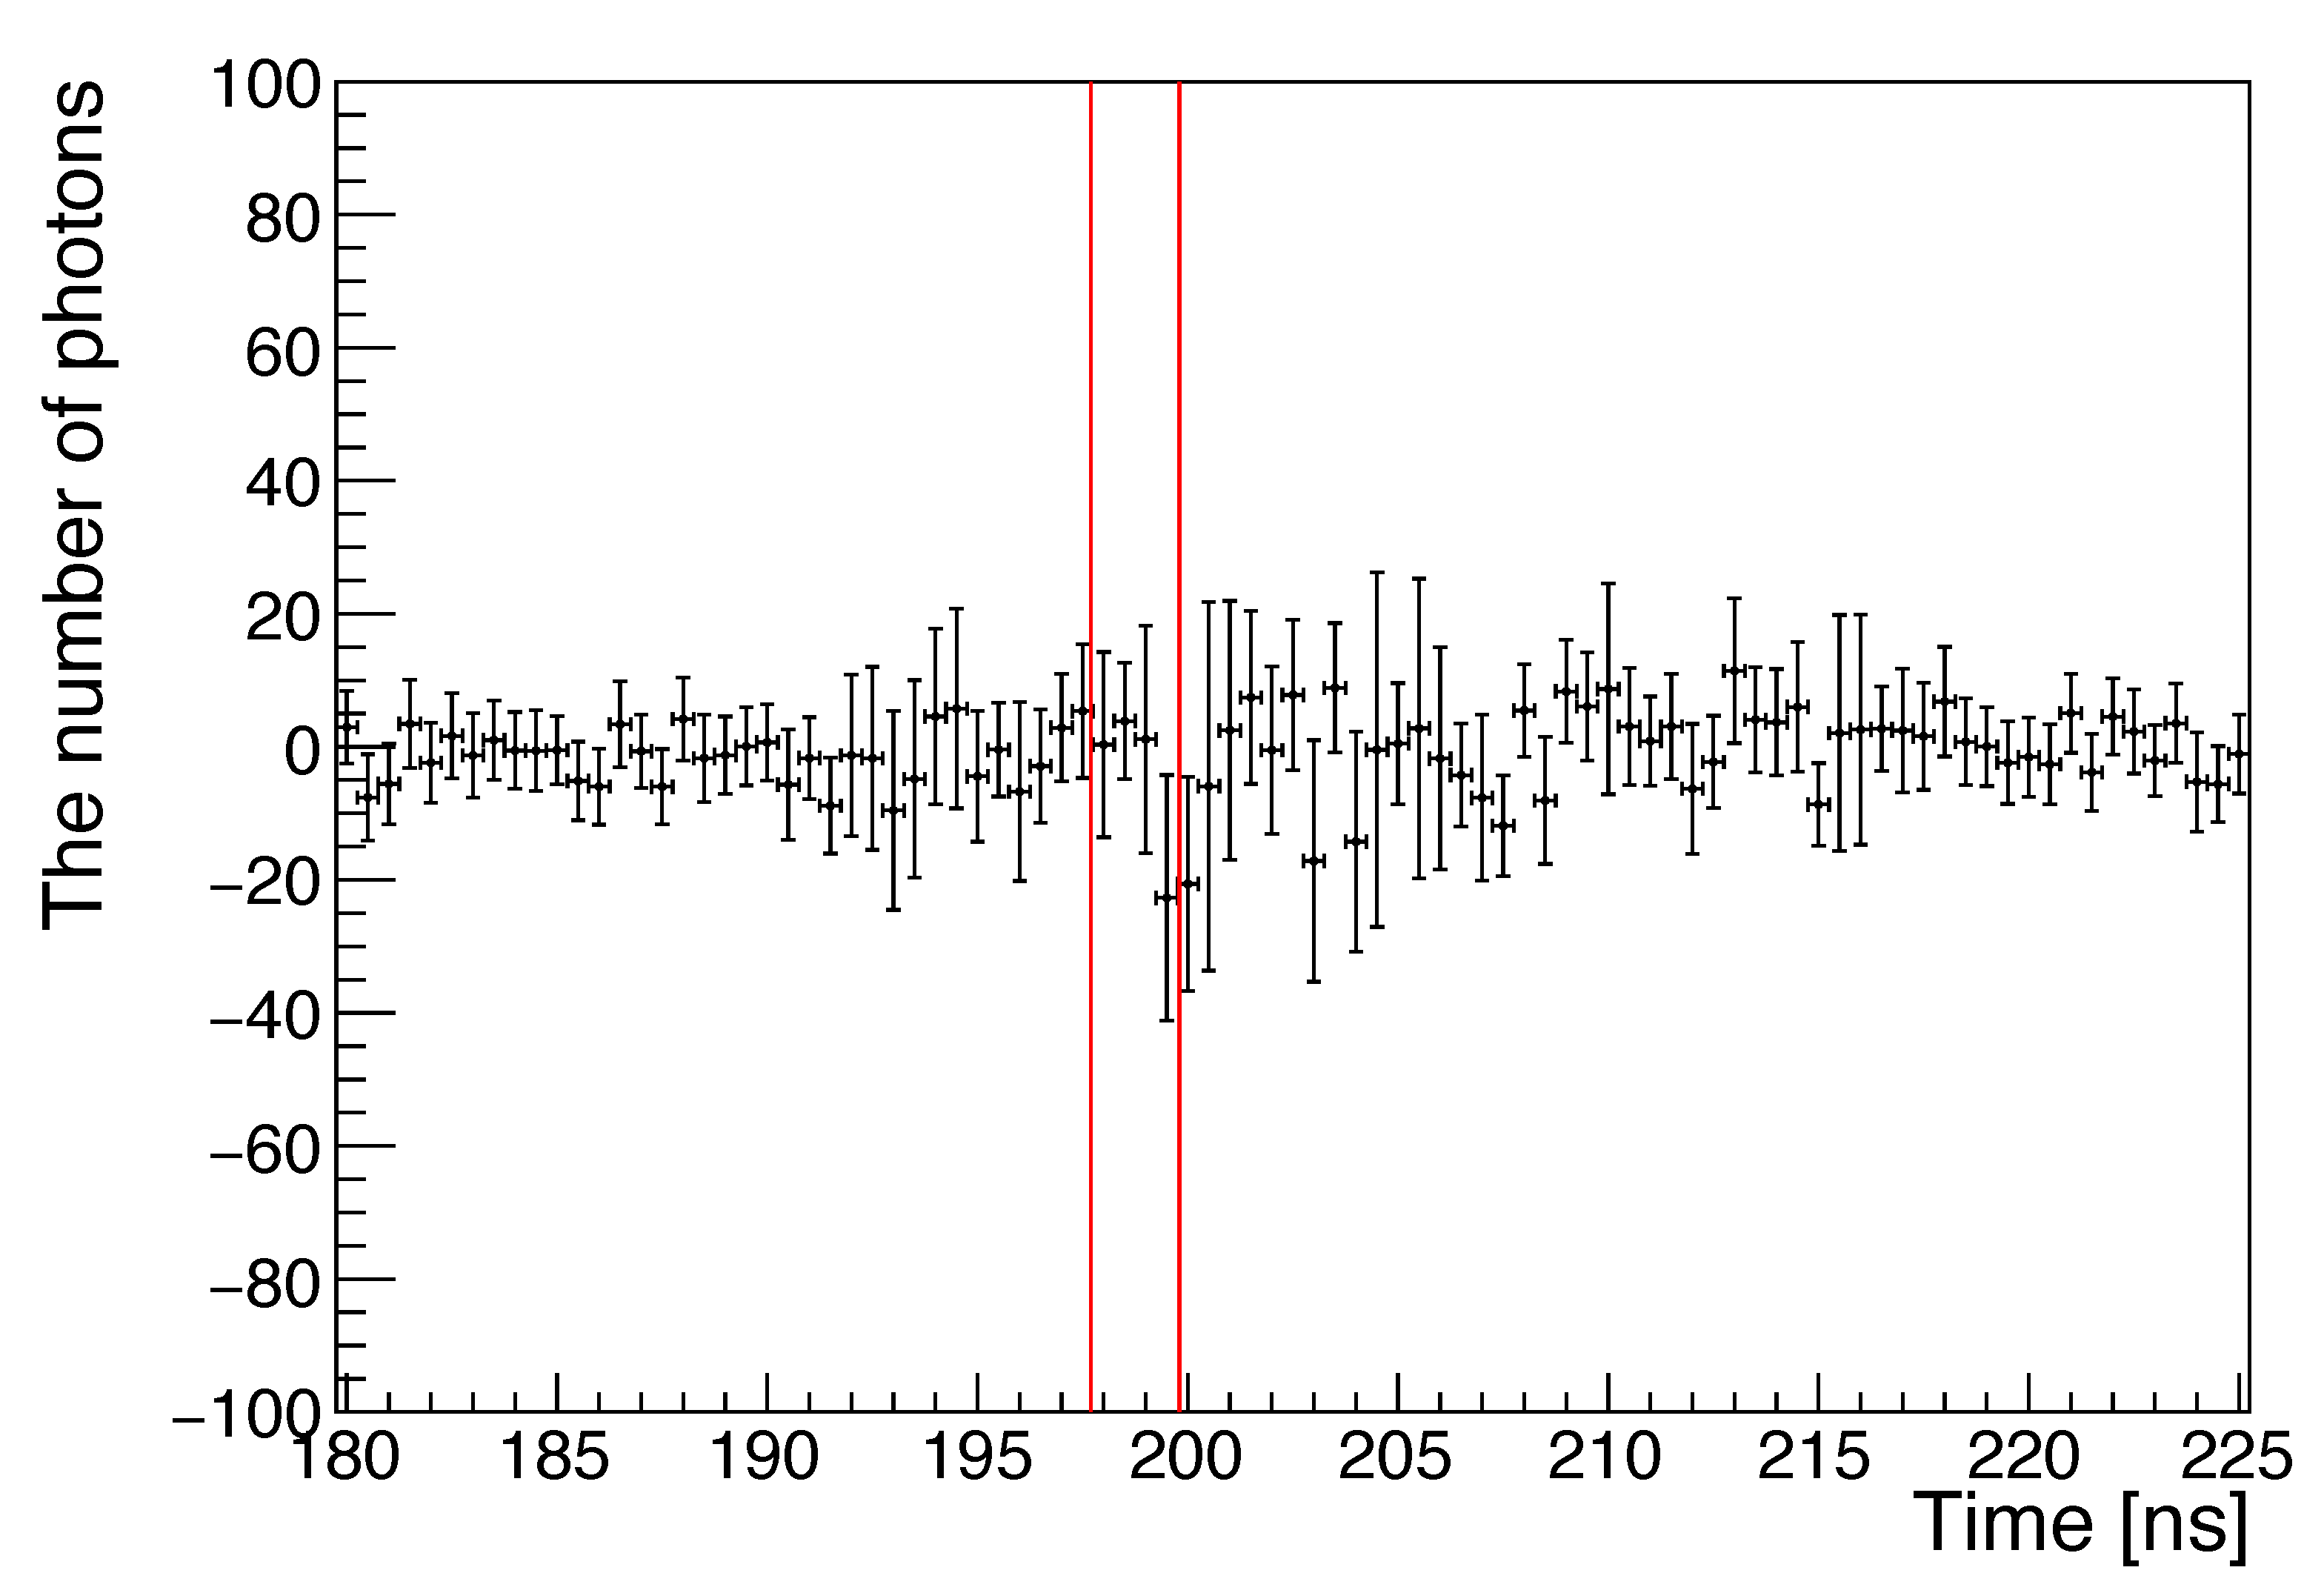
Figure 9 shows arrival time distributions after subtraction with Equation (5). The interval between the two vertical lines represents the expected arrival time window of FWM photons. Thus, the number of FWM photons was evaluated by summing charges in PMT1 within this window and dividing the sum by a single-photon equivalent charge. As a result, the observed number of FWM photons, n o b s , was null within the error size as follows:
n o b s = 17.4 ± 28.4 ( stat . ) ± 9.8 ( syst . I ) ± 5.4 ( syst . I I ) + 22.4 15.2 ( syst . I I I ) .
The first systematic error (syst. I ) was estimated by calculating the root-mean-square of the number of photon-like noise excluding the expected arrival time window of FWM photons. This corresponds to the baseline uncertainty of the PMT1 connected to the waveform digitizer in the real noise environment. The second systematic error (syst. I I ) was obtained by changing the default internal threshold 1.3 mV in the peak finder from 1.2 to 1.4 mV with the assumption of the uniform distribution. The details of the peak finding method are explained in [20,22]. The third systematic error (syst. I I I ) was evaluated by changing the expected arrival time window size for FWM photons from 1.5 ns to 3.5 ns with respect to the most likely arrival time window of 2.5 ns.

6. Exclusion Region in the Coupling-Mass Relation for ALP-Exchange

Since we have obtained the null result in Section 5, we set an exclusion region in the coupling-mass relation for the ALP exchange based on the formulation for the signal photon yield given in [25] and the measured total error size as follows. The signal photons yield in stimulated resonant scattering per pulse collision, Y c + i , is expressed as [25]
Y c + i N 1 N 2 N 4 D t h r e e s / L 3 Σ ¯ I L 3 / s ,
where N 1 ( = N c 1 ) , N 2 ( = N c 2 ) , and N 4 ( = N i ) are the average numbers of photons containing individual lasers, respectively, D t h r e e is a factor representing the space–time overlap of focused three beams at the interaction point [25], and Σ ¯ I is the volume-wise interaction rate [21,24]. Individual units are given in [ ] with length L and time s.
Based on the set of experimental parameters P summarized in Table 1, the observed number of FWM photons via an ALP exchange with the mass m a and the coupling g / M to two photons is expressed as
n o b s = Y c + i m a , g / M ; P N s h o t ϵ ,
where N s h o t is the number of shots in the S-pattern, and ϵ is the overall detection efficiency. A coupling constant g / M can be evaluated by solving Equation (8) for an ALP mass m a and a given observed number of photons n o b s .
When counting photon-like peaks by the peak finding algorithm in waveforms, fluctuations of the baseline may produce both positive and negative amplitudes resulting in negative numbers of photon-like peaks as well as positive ones. Thus, even if the mean value is zero, we assume a Gaussian distribution to be the most natural null hypothesis. The confidence level for this null hypothesis is defined as
1 α = 1 2 π σ μ δ μ + δ e ( x μ ) 2 / 2 σ 2 d x = erf δ 2 σ ,
where μ is the expected value of x according to the hypothesis and σ is the standard deviation. In the search, the expected value x corresponds to the number of FWM photons n o b s , and σ is one standard deviation δ n o b s . Based on (6) which indicates μ = 0 because of the null result, we determined the acceptance-uncorrected uncertainty δ n o b s around n o b s = 0 as the root mean square of all the error components as follows:
δ n o b s = 28 . 4 2 + 9 . 8 2 + 5 . 4 2 + 22 . 4 2 37.9
where the larger error on the positive side (+22.4) was used for syst. I I I in (6). In order to set a 95% confidence level, 2 α = 0.05 with δ = 2.24 was used to obtain the one-sided upper limit by excluding x + δ [26]. The upper limit in the relation m a vs. g / M was estimated by numerically solving Equation (11) with δ n o b s in (10) for the set of experimental parameters P in Table 1
2.24 δ n o b s = Y c + i m a , g / M ; P N s h o t ϵ ,
where N s h o t = 12,000, and the overall efficiency ϵ ϵ o p t ϵ d e t with the optical path acceptance from IP to PMT1, ϵ o p t , and the single photon detection efficiency of PMT1, ϵ d e t , were substituted. ϵ o p t was obtained by using the continuous He:Ne laser mimicking the path of signal photons as indicated in Figure 2 by taking the ratio between the laser intensity at IP and that measured at the PMT1 position with a common CCD camera. ϵ d e t was measured in advance using another pulse laser combined with a beam splitter system so that an equal number of photons were prepared between the two paths. By taking the ratio between the number of incident photons in one path and the number of counted photons by PMT1 in the other path, ϵ d e t was determined.
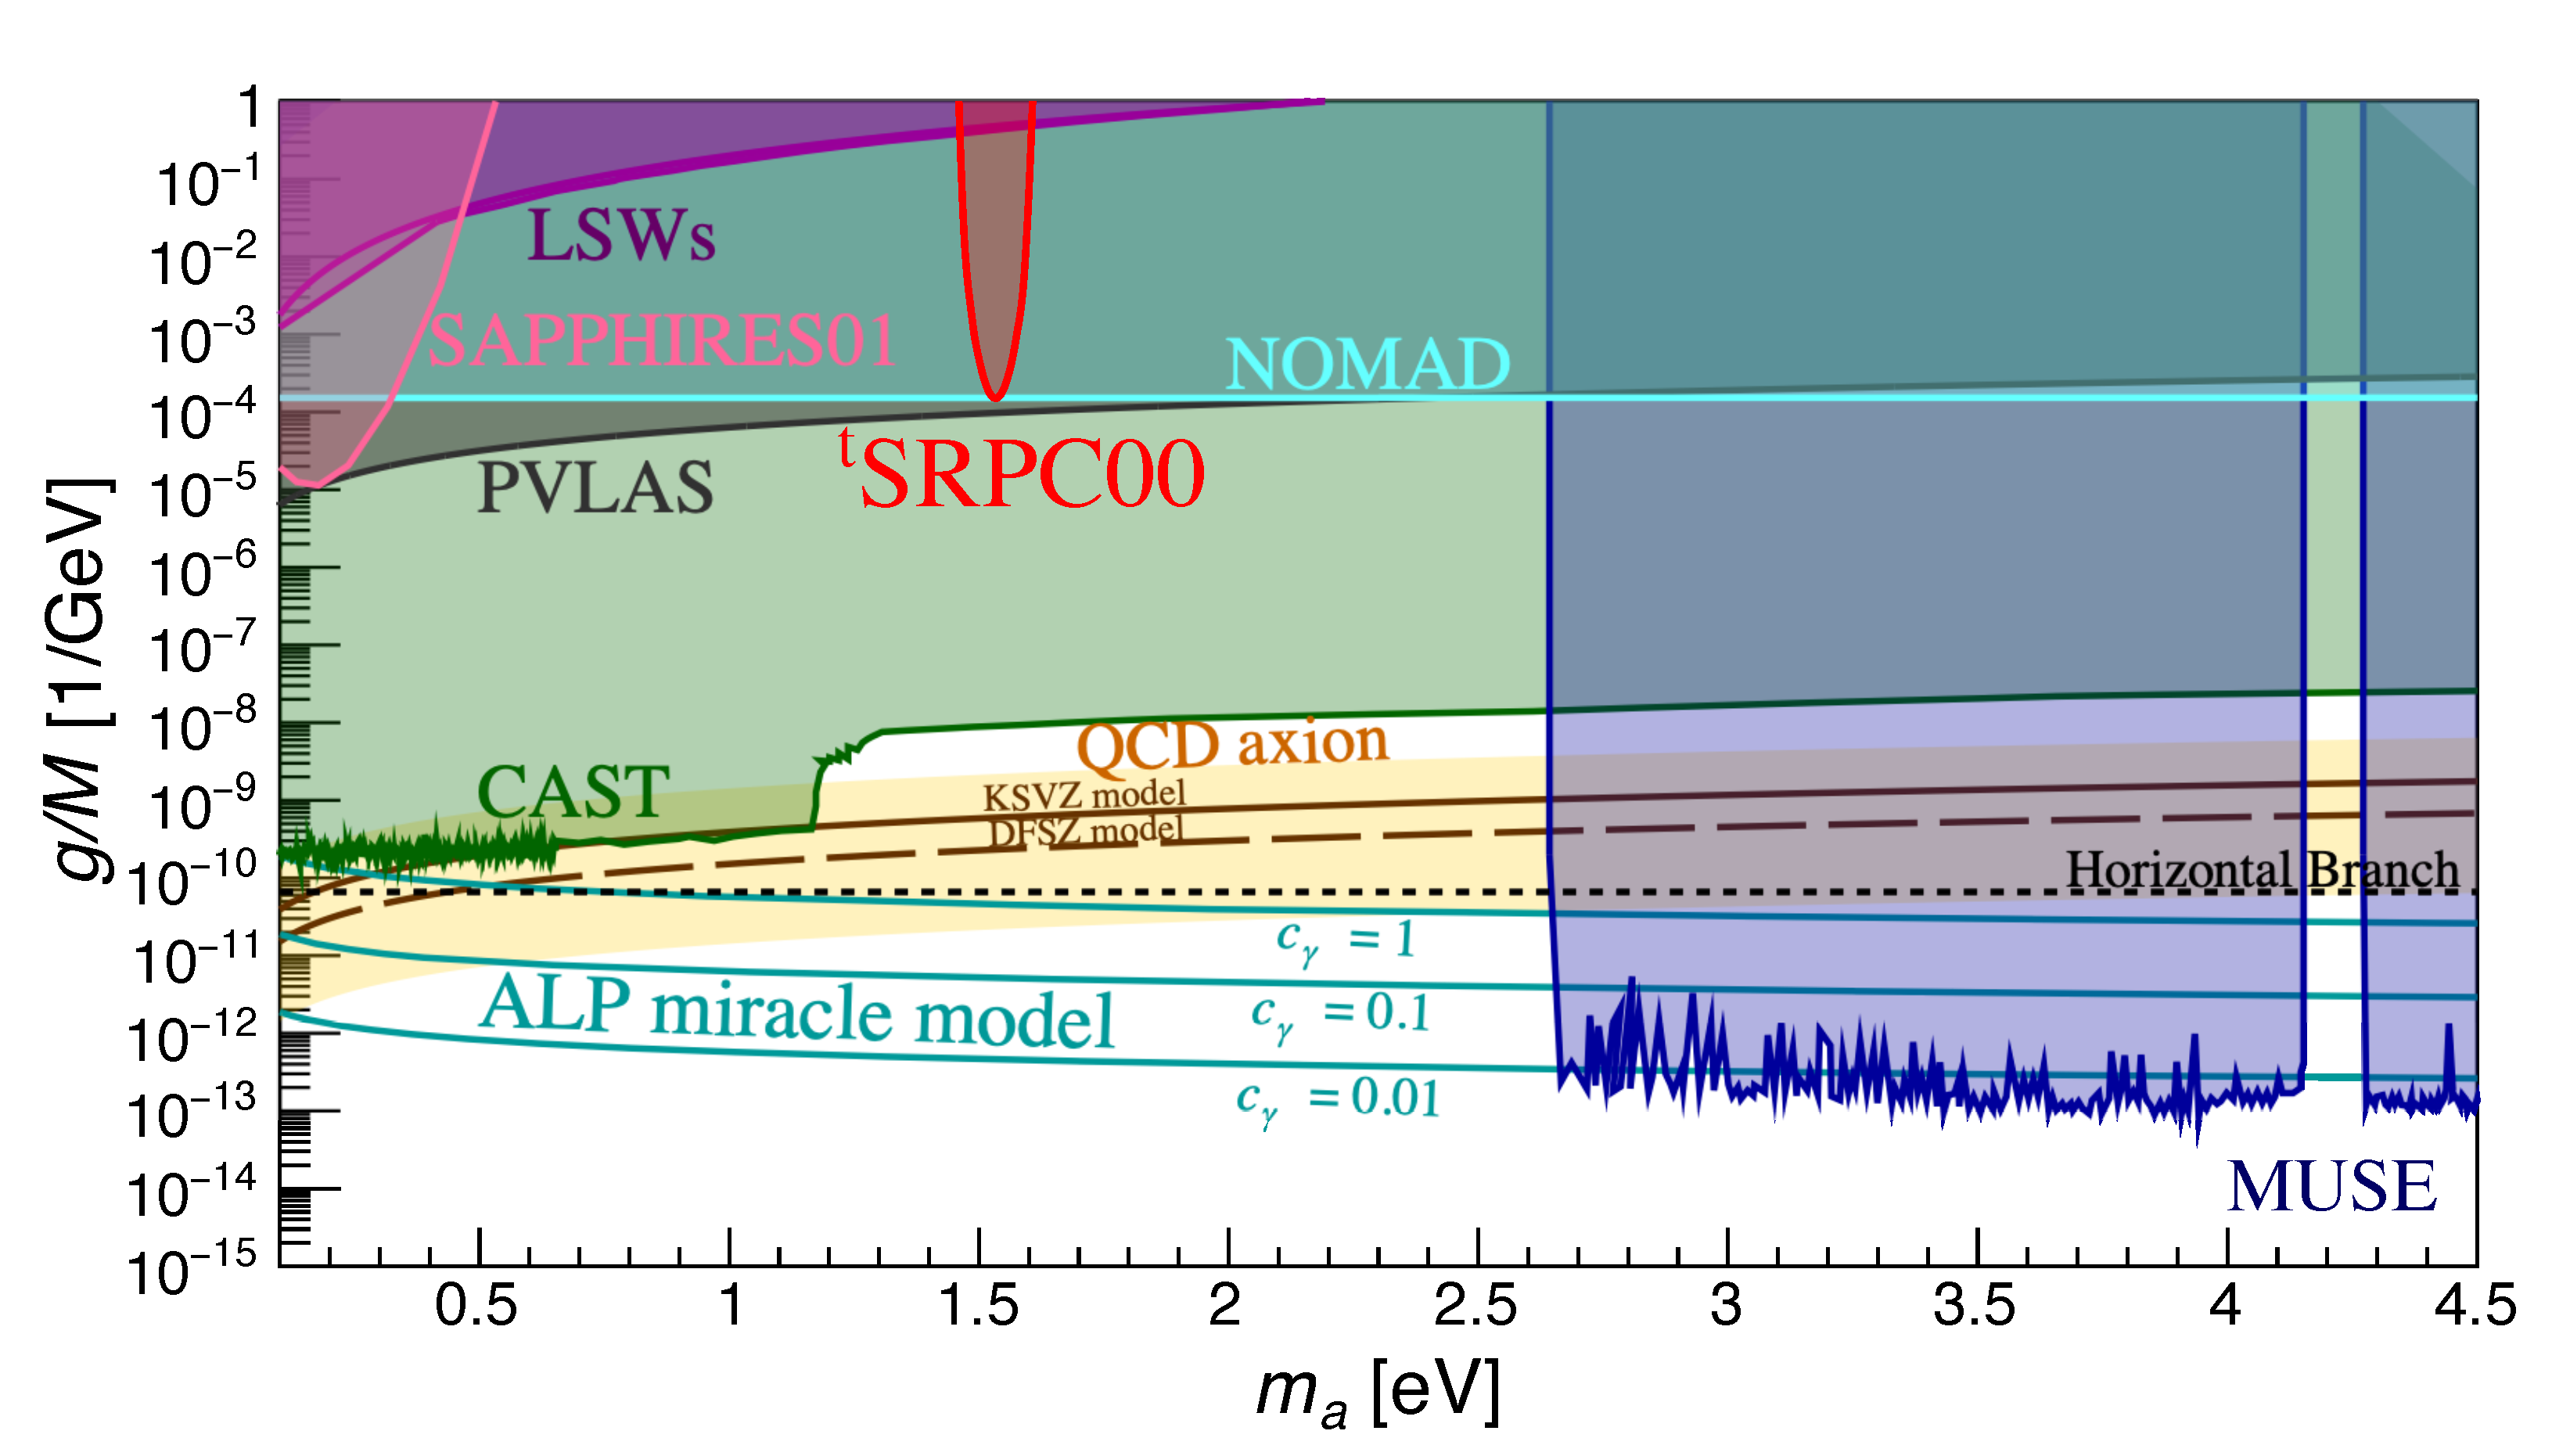
Figure 10 shows the upper limit in the coupling-mass relation from this search, the three-beam stimulated resonant photon collider ( t SRPC00) enclosed by the red solid curve. The limit was set at a 95% confidence level by assuming only pseudoscalar-type ALP exchanges. The most sensitive ALP mass in this search is expected to be m a = 1.53 eV because the creation lasers have a fixed collision angle of 30 . In reality, however, the sensitivity is not limited to m a = 1.53 eV because of energy and momentum uncertainties of focused short pulse lasers. These uncertainties are exactly taken into account in the numerical calculation based on Equation (7) [25]. The magenta area indicates the excluded range based on SRPC in quasi-parallel collision geometry (SAPPHIRES01) [23]. The purple areas are excluded regions by the Light Shining through a Wall (LSW) experiments (ALPS [27] and OSQAR [28]). The gray area shows the excluded region by the vacuum magnetic birefringence (VMB) experiment (PVLAS [29]). The light-cyan horizontal solid line indicates the upper limit from the search for eV (pseudo)scalar penetrating particles in the SPS neutrino beam (NOMAD) [30]. The horizontal dotted line indicates the upper limit from the Horizontal Branch observation [31]. The blue areas indicate exclusion regions from the optical MUSE-faint survey [32]. The green area is the excluded region by the helioscope experiment CAST [33,34,35,36]. We also put predictions from the benchmark QCD axion models. The yellow band and the upper solid brown line are the predictions from the KSVZ model [3,4] with 0.07 < E / N 1.95 < 7 and E / N = 0 , respectively, while the bottom dashed brown line is the prediction from the DFSZ model [13,14] with E / N = 8 / 3 . The cyan lines are the predictions from the ALP miracle model [12] with the intrinsic parameters c γ = 1 , 0.1 , 0.01 .

7. Conclusions and Future Prospects

We presented a result of the pilot ALP search by a three-beam stimulated resonant photon collider ( t SRPC) with focused short pulse lasers in the air as a proof-of-principle experiment. We demonstrated that the space–time synchronization between a pair of short creation laser pulses with a large incident angle of 30 deg, and a relatively long-duration inducing laser pulse can be ensured by atomic four-wave mixing with a thin BBO crystal positioned at the interaction point. The search result was consistent with null, and we could successfully obtain an exclusion region in the minimum coupling g / M = 1.5 × 10 4 GeV 1 at m = 1.53 eV based on the formulation dedicated for t SRPC [25]. We found the solutions to technical complications to handle three focused short-pulsed beams and the impact on the physics, in particular, on the polarization states of creation beams by the introduction of periscopes, which is an important optical element to realize variable incident angles at a t SRPC.
The pilot search was indeed performed at a narrow mass range indicated by the angle points as a function of ALP mass as shown in Figure 11. Our prospect is to cover the broad mass range in the eV scale [25]. Toward the continuous mass scanning over the eV range with much higher laser intensity in the near future, the technical solutions developed in this pilot search will enable a realistic designing for a more compact t SRPC operational in a vacuum chamber. Although the pilot search with the low laser intensity looks dominated by the large systematic uncertainty, the uncertainty is actually dominated by electric noise in the experimental environment, which is independent of the increase of laser intensity, while the signal yield is increased by the cube of laser intensity. Therefore, the method we demonstrated opens up a new window toward very feeble coupling of ALPs to photons by increasing laser intensity in the near future.

Author Contributions

Conceptualization, K.H.; methodology, K.H.; software, Y.K. and F.I.; validation, Y.K., T.K. and S.M.; formal analysis, F.I. and Y.K.; investigation, T.K.; resources, S.T. and M.H.; data curation, F.I., T.H. and Y.K.; writing—original draft preparation, F.I. and K.H.; writing—review and editing, Y.K., T.H. and K.H.; visualization, F.I. and K.H.; supervision, K.H.; project administration, K.H.; funding acquisition, K.H. All authors have read and agreed to the published version of the manuscript.

Funding

This research was funded by Grants-in-Aid for Scientific Research Nos. 21H04474 from the Ministry of Education, Culture, Sports, Science, and Technology (MEXT) of Japan.

Institutional Review Board Statement

Not applicable.

Informed Consent Statement

Not applicable.

Data Availability Statement

Not applicable.

Acknowledgments

The T 6 system was financially supported by the MEXT Quantum Leap Flagship Program (JPMXS0118070187) and the program for advanced research equipment platforms (JPMXS0450300521). Kensuke Homma acknowledges the support of the Collaborative Research Program of the Institute for Chemical Research at Kyoto University (Grant Nos. 2018-83, 2019-72, 2020-85, 2021-88, and 2022-101) and Grants-in-Aid for Scientific Research Nos. 17H02897, 18H04354, 19K21880, and 21H04474 from the Ministry of Education, Culture, Sports, Science, and Technology (MEXT) of Japan. Yuri Kirita acknowledges support from the JST, the establishment of university fellowships for the creation of science and technology innovation, Grant No. JPMJFS2129, and a Grant-in-Aid for JSPS fellows No. 22J13756 from the Ministry of Education, Culture, Sports, Science, and Technology (MEXT) of Japan.

Conflicts of Interest

The authors declare no conflict of interest.

Appendix A. Two Angle Parameters for Jones Vectors Representing General Polarization States

As mentioned in Section 2, incident angles of individual lasers were set at 30 for the two creation lasers with respect to the horizontal dashed line including IP as shown in Figure A1 through periscopes PS c 1 and PS c 2 , respectively. We adopted PS to introduce a large collision angle because it could reflect a laser beam to any angles changing the beam height thanks to a vertical pair of mirrors with an incident angle of 45 and a reflection angle of 45 inside PS. However, if the output direction is rotated by PS to a large angle, a linear polarization state of an incident laser beam becomes elliptically polarized. Therefore, it is necessary to measure Stokes parameters to obtain ellipticity angle ϵ and tilt angle θ of a complex Jones vector defined as follows that represents elliptically polarized states in general
e 1 e 2 = cos θ sin θ sin θ cos θ cos ϵ i sin ϵ = cos θ cos ϵ + i sin θ sin ϵ sin θ cos ϵ i cos θ sin ϵ .
Figure A1. Schematic view of the setup to evaluate two angle parameters to define Jones vectors for the two creation lasers based on Stokes parameters. A polarizer (POL) was placed between a periscope (PS) and a lens (L) in each beamline. Stokes parameters were obtained by measuring transmitted laser intensity through POL at four different rotation angles by using individual cameras C c 1 and C c 2 assigned for the two creation lasers.
Universe 09 00123 g0a1
Complex Jones vectors were actually implemented to polarization vectors in four-vector form e ( 0 , e 1 , e 2 , 0 ) to define vertex factors for the ALP-photon coupling in the numerical calculation to obtain volume-wise interaction rates Σ ¯ I in Equation (7) (see Ref. [24] in more detail).
To obtain these two angles in complex Jones vectors for the two creation lasers, a polarizer (POL) was placed between a periscope (PS) and a lens (L) for each of the two creation laser lines as shown in Figure A1. Rotation angles of POL around the optical axis were set to select a linear polarization direction of 0 (horizontal), 90 (vertical), 45 , and 135 . The Stokes parameters, which can be converted into the two angle parameters for complex Jones vectors, were obtained by measuring laser intensities monitored by cameras (C c 1 , C c 2 ) after laser lights pass through a rotated POL set at the four rotation angles above. A set of Stokes parameters can be related to two angle parameters of a complex Jones vector as follows:
S 0 S 1 S 2 S 3 = | E H | 2 + | E V | 2 | E H | 2 | E V | 2 | E 45 | 2 | E 135 | 2 | E L | 2 | E R | 2 = S 0 1 cos 2 ϵ cos 2 θ cos 2 ϵ sin 2 θ sin 2 ϵ
where E H , E V , E 45 , E 135 , a n d E L , E R are the amplitudes for linear polarization cases with the polarization direction of horizontal, vertical, 45 , 135 , and for left- and right-handed circular polarization cases, respectively. In the search experiment, we did not measure the right-handed and left-handed laser amplitudes because we only have to obtain the two angle parameters: ϵ k and θ k for k = c 1 , c 2 from S 0 , S 1 and S 2 .
The two angle parameters for the Jones vector in the creation laser path without retroreflector (RR) (lower side of the green optical path in Figure A1) were ϵ c 1 = 0.41 rad, θ c 1 = 0.30 rad, while those in the path with RR were ϵ c 2 = 0.91 rad, θ c 2 = 0.31 rad as summarized in the following relation:
S c 10 S c 11 S c 12 S c 13 = A c 1 2 1 cos 2 ϵ c 1 cos 2 θ c 1 cos 2 ϵ c 1 sin 2 θ c 1 sin 2 ϵ c 1 = A c 1 2 1 cos 0.82 cos 0.60 cos 0.82 sin 0.60 sin 0.82
S c 20 S c 21 S c 22 S c 23 = A c 2 2 1 cos 2 ϵ c 2 cos 2 θ c 2 cos 2 ϵ c 2 sin 2 θ c 2 sin 2 ϵ c 2 = A c 2 2 1 cos 1.82 cos 0.62 cos 1.82 sin 0.62 sin 1.82
where A c 1 , c 2 2 correspond to intensities measured by C c 1 , c 2 , respectively. The ellipticity angle for the creation laser containing RR was closer to π / 4 than that of the other creation laser because the incident angle of 45 and the reflection angle of 45 were not guaranteed within RR, while the tilt angles were opposite to each other as expected. Therefore, the two creation lasers indeed had very different angle parameters, and these factors were taken into account for the numerical calculation to set the exclusion region.

References

  1. Weinberg, S. A New Light Boson? Phys. Rev. Lett. 1978, 40, 223. [Google Scholar] [CrossRef]
  2. Wilczek, F. Problem of Strong P and T Invariance in the Presence of Instantons. Phys. Rev. Lett. 1978, 40, 271. [Google Scholar] [CrossRef]
  3. Kim, J.E. Weak-Interaction Singlet and Strong CP Invariance. Phys. Rev. Lett. 1979, 43, 103. [Google Scholar] [CrossRef]
  4. Shifman, M.A.; Vainshtein, A.I.; Zakharov, V.I. Can confinement ensure natural CP invariance of strong interactions? Nucl. Phys. B 1980, 166, 493. [Google Scholar] [CrossRef]
  5. Preskill, J.; Wise, M.B.; Wilczek, F. Cosmology of the invisible axion. Phys. Lett. B 1983, 120, 127. [Google Scholar] [CrossRef] [Green Version]
  6. Abbott, L.F.; Sikivie, P. A cosmological bound on the invisible axion. Phys. Lett. 1983, B120, 133. [Google Scholar] [CrossRef]
  7. Dine, M.; Fischler, W. The not-so-harmless axion. Phys. Lett. 1983, B120, 137. [Google Scholar] [CrossRef]
  8. Peccei, R.D.; Quinn, H.R. CP Conservation in the Presence of Pseudoparticles. Phys. Rev. Lett. 1977, 38, 1440. [Google Scholar] [CrossRef] [Green Version]
  9. Peccei, R.D. The strong CP problem and Axions. Lect. Notes Phys. 2008, 741, 3–17. [Google Scholar]
  10. Fujii, Y.; Maeda, K. The Scalar-Tensor Theory of Gravitation; Cambridge University Press: Cambridge, UK, 2003. [Google Scholar]
  11. Katsuragawa, T.; Matsuzaki, S.; Homma, K. Hunting dark energy with pressure-dependent photon-photon scattering. Phys. Rev. D 2022, 106, 044011. [Google Scholar] [CrossRef]
  12. Daido, R.; Takahashi, F.; Yin, W. The ALP miracle revisited. J. High Energy Phys. 2018, 2, 104. [Google Scholar] [CrossRef] [Green Version]
  13. Dine, M.; Fischler, W.; Srednicki, M. A simple solution to the strong CP problem with a harmless axion. Phys. Lett. 1981, 104, 199–202. [Google Scholar] [CrossRef]
  14. Zhitnitsky, A. On Possible Suppression of the Axion Hadron Interactions. Sov. J. Nucl. Phys. 1980, 31, 260. [Google Scholar]
  15. Yin, W. Thermal production of cold “hot dark matter” around eV. arXiv 2023, arXiv:2301.08735. [Google Scholar]
  16. Takahashi, F.; Yin, W. Hadrophobic Axion from GUT. arXiv 2023, arXiv:2301.10757. [Google Scholar]
  17. Fujii, Y.; Homma, K. An Approach toward the Laboratory Search for the Scalar Field as a Candidate of Dark Energy. Prog. Theor. Phys. 2011, 126, 531, Erratum in Prog. Theor. Exp. Phys. 2014, 2014, 089203. [Google Scholar] [CrossRef] [Green Version]
  18. Homma, K.; Hasebe, T.; Kume, K. The first search for sub-eV scalar fields via four-wave mixing at a quasi-parallel laser collider. Prog. Theor. Exp. Phys. 2014, 2014, 083C01. [Google Scholar] [CrossRef] [Green Version]
  19. Hasebe, T.; Homma, K.; Nakamiya, Y.; Matsuura, K.; Otani, K.; Hashida, M.; Inoue, S.; Sakabe, S. Search for sub-eV scalar and pseudoscalar resonances via four-wave mixing with a laser collider. Prog. Theo. Exp. Phys. 2015, 2015, 073C01. [Google Scholar] [CrossRef] [Green Version]
  20. Nobuhiro, A.; Hirahara, Y.; Homma, K.; Kirita, Y.; Ozaki, T.; Nakamiya, Y.; Hashida, M.; Inoue, S.; Sakabe, S. Extended search for sub-eV axion-like resonances via four-wave mixing with a quasi-parallel laser collider in a high-quality vacuum system. Prog. Theo. Exp. Phys. 2020, 2020, 073C01. [Google Scholar] [CrossRef]
  21. Homma, K.; Kirita, Y. Stimulated radar collider for probing gravitationally weak coupling pseudo Nambu-Goldstone bosons. J. High Energy Phys. 2020, 9, 095. [Google Scholar] [CrossRef]
  22. Homma, K. et al. [SAPPHIRES]. Search for sub-eV axion-like resonance states via stimulated quasi-parallel laser collisions with the parameterization including fully asymmetric collisional geometry. J. High Energy Phys. 2021, 12, 108. [Google Scholar]
  23. Kirita, Y. et al. [SAPPHIRES]. Search for sub-eV axion-like resonance states via stimulated quasi-parallel laser collisions with the parameterization including fully asymmetric collisional geometry. J. High Energy Phys. 2022, 10, 176. [Google Scholar]
  24. Homma, K.; Kirita, Y.; Ishibashi, F. Perspective of Direct Search for Dark Components in the Universe with Multi-Wavelengths Stimulated Resonant Photon-Photon Colliders. Universe 2021, 7, 479. [Google Scholar] [CrossRef]
  25. Homma, K.; Ishibashi, F.; Kirita, Y.; Hasada, T. Sensitivity to axion-like particles with a three-beam stimulated resonant photon collider around the eV mass range. Universe 2023, 9, 20. [Google Scholar] [CrossRef]
  26. Beringer, J. et al. [Particle Data Group]. Review of Particle Physics. Phys. Rev. D 2012, 86, 010001. [Google Scholar] [CrossRef] [Green Version]
  27. Ehret, K. et al. [ALPS]. New ALPS results on hidden-sector lightweights. Phys. Lett. B 2010, 689, 149. [Google Scholar] [CrossRef]
  28. Ballou, R. et al. [OSQAR]. New exclusion limits on scalar and pseudoscalar axionlike particles from light shining through a wall. Phys. Rev. D 2015, 92, 092002. [Google Scholar] [CrossRef] [Green Version]
  29. Ejlli, A.; Della Valle, F.; Gastaldi, U.; Messineo, G.; Pengo, R.; Ruoso, G.; Zavattini, G. The PVLAS experiment: A 25 year effort to measure vacuum magnetic birefringence. Phys. Rep. 2020, 871, 201374. [Google Scholar] [CrossRef]
  30. Astier, P. et al. [NOMAD]. Search for eV (pseudo)scalar pene- trating particles in the SPS neutrino beam. Phys. Lett. B 2000, 479, 371–380. [Google Scholar] [CrossRef] [Green Version]
  31. Ayala, A.; Domínguez, I.; Giannotti, M.; Mirizzi, A.; Straniero, O. Revisiting the Bound on Axion-Photon Coupling from Globular Clusters. Phys. Rev. Lett. 2014, 113, 191302. [Google Scholar] [CrossRef] [Green Version]
  32. Regis, M.; Taoso, M.; Vaz, D.; Brinchmann, J.; Zoutendijk, S.L.; Bouché, N.F.; Steinmetz, M. Searching for light in the darkness: Bounds on ALP dark matter with the optical MUSE-faint survey. Phys. Lett. B 2021, 814, 136075. [Google Scholar] [CrossRef]
  33. Arik, E. et al. [CAST]. Probing eV-scale axions with CAST. J. Cosmol. Astropart. Phys. 2009, 2, 8. [Google Scholar]
  34. Arik, M. et al. [CAST]. Search for Sub-eV Mass Solar Axions by the CERN Axion Solar Telescope with 3He Buffer Gas. Phys. Rev. Lett. 2011, 107, 261302. [Google Scholar] [CrossRef] [PubMed] [Green Version]
  35. Arik, M. et al. [CAST]. Search for Solar Axions by the CERN Axion Solar Telescope with 3He Buffer Gas: Closing the Hot Dark Matter Gap. Phys. Rev. Lett. 2014, 112, 091302. [Google Scholar]
  36. Anastassopoulos, V. et al. [CAST]. New CAST limit on the axion–photon interaction. Nat. Phys. 2017, 13, 584. [Google Scholar] [CrossRef] [Green Version]
Figure 1. Concept of a three-beam stimulated resonant photon collider ( t SRPC) with focused coherent beams.
Universe 09 00123 g001
Figure 2. Schematic drawing of the search setup.
Universe 09 00123 g002
Figure 3. Photographs of the search setup (left) and the three focused laser spots (right) at a common thin cross-wire target.
Universe 09 00123 g003
Figure 4. Photograph of oscilloscope waveforms from the four photodetectors in Figure 2. Four-wave mixing (FWM) photons were clearly observed when a thin BBO crystal was positioned at IP.
Universe 09 00123 g004
Figure 5. Observed number of FWM photons as a function of stage position in the delay line for a fine timing tuning between two creation laser pulses when a thin BBO crystal was positioned at IP.
Universe 09 00123 g005
Figure 6. Four patterns of the beam combination between the two laser pulses where the green and red pulses are respectively creation and inducing laser pulses. The classifications are: S for two laser pulses, C for only the creation laser pulses, I for only the inducing laser pulses, and P for pedestals without laser pulses.
Universe 09 00123 g006
Figure 7. Arrival time distribution of FWM photons via the atomic process when a BBO crystal was placed at IP and space–time synchronization was ensured by PMT1. The red lines thus provide the expected time window for FWM photons via ALP-exchange to arrive.
Universe 09 00123 g007
Figure 8. Arrival time distributions of photons with no target state (air) at IP. The histograms in the upper left, upper right, lower left, and lower right correspond to S, C, I, and P patterns of beam combinations, respectively. The interval between the two red lines in the S-pattern indicates the expected time windows for FWM photons via ALP-exchange to arrive.
Universe 09 00123 g008
Figure 9. Arrival time distribution of reconstructed photons after subtraction between the four patterns based on Equation (5) over the entire time range in Figure 8. The interval between the two red lines indicates the expected time windows for FWM photons via ALP-exchange to arrive.
Universe 09 00123 g009
Figure 10. Upper limit in the parameter space of the coupling-mass relation (region enclosed by the red solid curve) evaluated at a 95% confidence level for the pseudoscalar field exchange achieved by the three-beam stimulated resonant photon collider ( t SRPC00). The magenta area indicates the excluded range based on SRPC in quasi-parallel collision geometry (SAPPHIRES01) [23]. The purple areas are excluded regions by the Light Shining through a Wall (LSW) experiments (ALPS [27] and OSQAR [28]). The gray area shows the excluded region by the vacuum magnetic birefringence (VMB) experiment (PVLAS [29]). The light-cyan horizontal solid line indicates the upper limit from the search for eV (pseudo)scalar penetrating particles in the SPS neutrino beam (NOMAD) [30]. The horizontal dotted line indicates the upper limit from the Horizontal Branch observation [31]. The blue areas indicate the excluded regions from the optical MUSE-faint survey [32]. The green area is the excluded region by the helioscope experiment CAST [33,34,35,36]. The yellow band and the upper solid brown line are the predictions of QCD axion by the KSVZ model [3,4] with 0.07 < E / N 1.95 < 7 and E / N = 0 , respectively. The bottom dashed brown line is the prediction from the DFSZ model [13,14] with E / N = 8 / 3 . The cyan lines are the predictions from the ALP miracle model [12] with the intrinsic parameter values c γ = 1 , 0.1 , 0.01 , respectively.
Universe 09 00123 g010
Figure 11. Expected incident angles of creation and inducing lasers, θ c and θ i , respectively, as a function of ALP mass when two wavelengths of creation (808 nm) and inducing lasers (1064 nm) are assumed, resulting in the fixed wavelength of FWM signals, 651 nm, in vacuum.
Universe 09 00123 g011
Table 1. Experimental parameters used to obtain the upper limit.
ParameterValue
Central wavelength of creation laser, λ c 1 808 nm
Relative linewidth of creation laser, δ ω c 1 / < ω c 1 > 1.7 × 10 2
Duration time of creation laser, τ c 1 (38.8 ± 1.4) fs (FWHM)
Measured creation laser energy per τ c 1 , E c 1 (1.21 ± 0.13) μ J
Creation energy fraction within 3 σ x y focal spot, f c 1 0.82
Effective creation energy per τ c 1 within 3 σ x y focal spot E c 1 f c 1 = 1.0 μ J
Effective number of creation photons, N c 1 4.0 × 10 12 photons
Beam diameter of creation laser beam, d c 1 (5.0 ± 0.5) mm
Polarization (see Appendix A) ϵ c 1 = 0.41 rad, θ c 1 = 0.30 rad
Central wavelength of creation laser, λ c 2 808 nm
Relative linewidth of creation laser, δ ω c 2 / < ω c 2 > 1.7 × 10 2
Duration time of creation laser, τ c 2 (39.2 ± 1.7) fs (FWHM)
Measured creation laser energy per τ c 2 , E c 2 (1.52 ± 0.14) μ J
Creation energy fraction within 3 σ x y focal spot, f c 2 0.85
Effective creation energy per τ c 2 within 3 σ x y focal spot E c 2 f c 2 = 1.3 μ J
Effective number of creation photons, N c 2 5.2 × 10 12 photons
Beam diameter of creation laser beam, d c 2 (5.0 ± 0.5) mm
Polarization (see Appendix A) ϵ c 2 = 0.91 rad, θ c 2 = 0.31 rad
Central wavelength of inducing laser, λ i 1064 nm
Relative linewidth of inducing laser, δ ω i / < ω i > 1.0 × 10 4
Duration time of inducing laser beam, τ i b e a m 9 ns (two standard deviation)
Measured inducing laser energy per τ i b e a m , E i ( 1.58 ± 0.05 ) μ J
Linewidth-based duration time of inducing laser, τ i / 2 / ( 2 δ ω i ) = 2.8 ps
Inducing energy fraction within 3 σ x y focal spot, f i 0.88
Effective inducing energy per τ i within 3 σ x y focal spot E i ( τ i / τ i b e a m ) f i = 0.87 nJ
Effective number of inducing photons, N i 4.7 × 10 9 photons
Beam diameter of inducing laser beam, d i ( 3.0 ± 0.5 ) mm
Polarizationcircular (left-handed state)
Common focal length of lens, f300.0 mm
Single-photon detection efficiency, ϵ d e t 1.4%
Efficiency of optical path from IP to PMT, ϵ o p t 53%
Total number of shots in trigger pattern S, N s h o t 12,000 shots
δ n o b s 37.9
Disclaimer/Publisher’s Note: The statements, opinions and data contained in all publications are solely those of the individual author(s) and contributor(s) and not of MDPI and/or the editor(s). MDPI and/or the editor(s) disclaim responsibility for any injury to people or property resulting from any ideas, methods, instructions or products referred to in the content.

