Abstract
The NA62 experiment at CERN Super Proton Synchrotron (SPS) is currently taking data to measure the ultra-rare decay . This decay, whose Branching Ratio (BR) is predicted with high precision within the Standard Model (SM), is one of the best candidates to reveal the indirect effects of New Physics (NP) at the highest mass scales. The NA62 experiment is designed to measure BR ( with a decay-in-flight technique, novel for this channel. NA62 took data in 2016, 2017 and 2018; statistics collected in 2016 allows NA62 to reach the SM sensitivity for this decay, reaching the single event sensitivity (SES) and showing the proof of principle of the experiment. The preliminary result on BR ( from the analysis of the 2016 data set is described.
1. Introduction
The process is a flavor-changing neutral current (FCNC) decay proceeding through box and electroweak penguin diagrams. A quadratic GIM mechanism and the transition of the quark top into the quark down make this process extremely rare. The Standard Model (SM) predicts [1]:
where the precision on the external inputs dominates the uncertainty. The theoretical accuracy, on the contrary, is at the level of 2%, as the SM Branching Ratio (BR) includes next-to-leading order (NLO) QCD corrections to the top quark contribution, NLO corrections to the charm quark contribution [2,3], and NLO electroweak corrections [4].
The decay is extremely sensitive to New Physics (NP), probing the highest mass scales among the rare meson decays. The largest deviations from the SM are expected in models with new sources of flavor violation due to weaker constraints from B physics [5,6].
The experiments E787 and E949 at Brookhaven National Laboratory (BNL) studied the decay using a kaon-decay-at-rest technique. The result of their measure was [7,8]:
The NA62 experiment at CERN aims to precisely measure with a novel decay-in-flight technique. Here, the first result of NA62 from the analysis of data collected in 2016 is reported, corresponding to about 5% fraction of the statistics collected by NA62 during a full-year data-taking period.
2. The NA62 Experiment
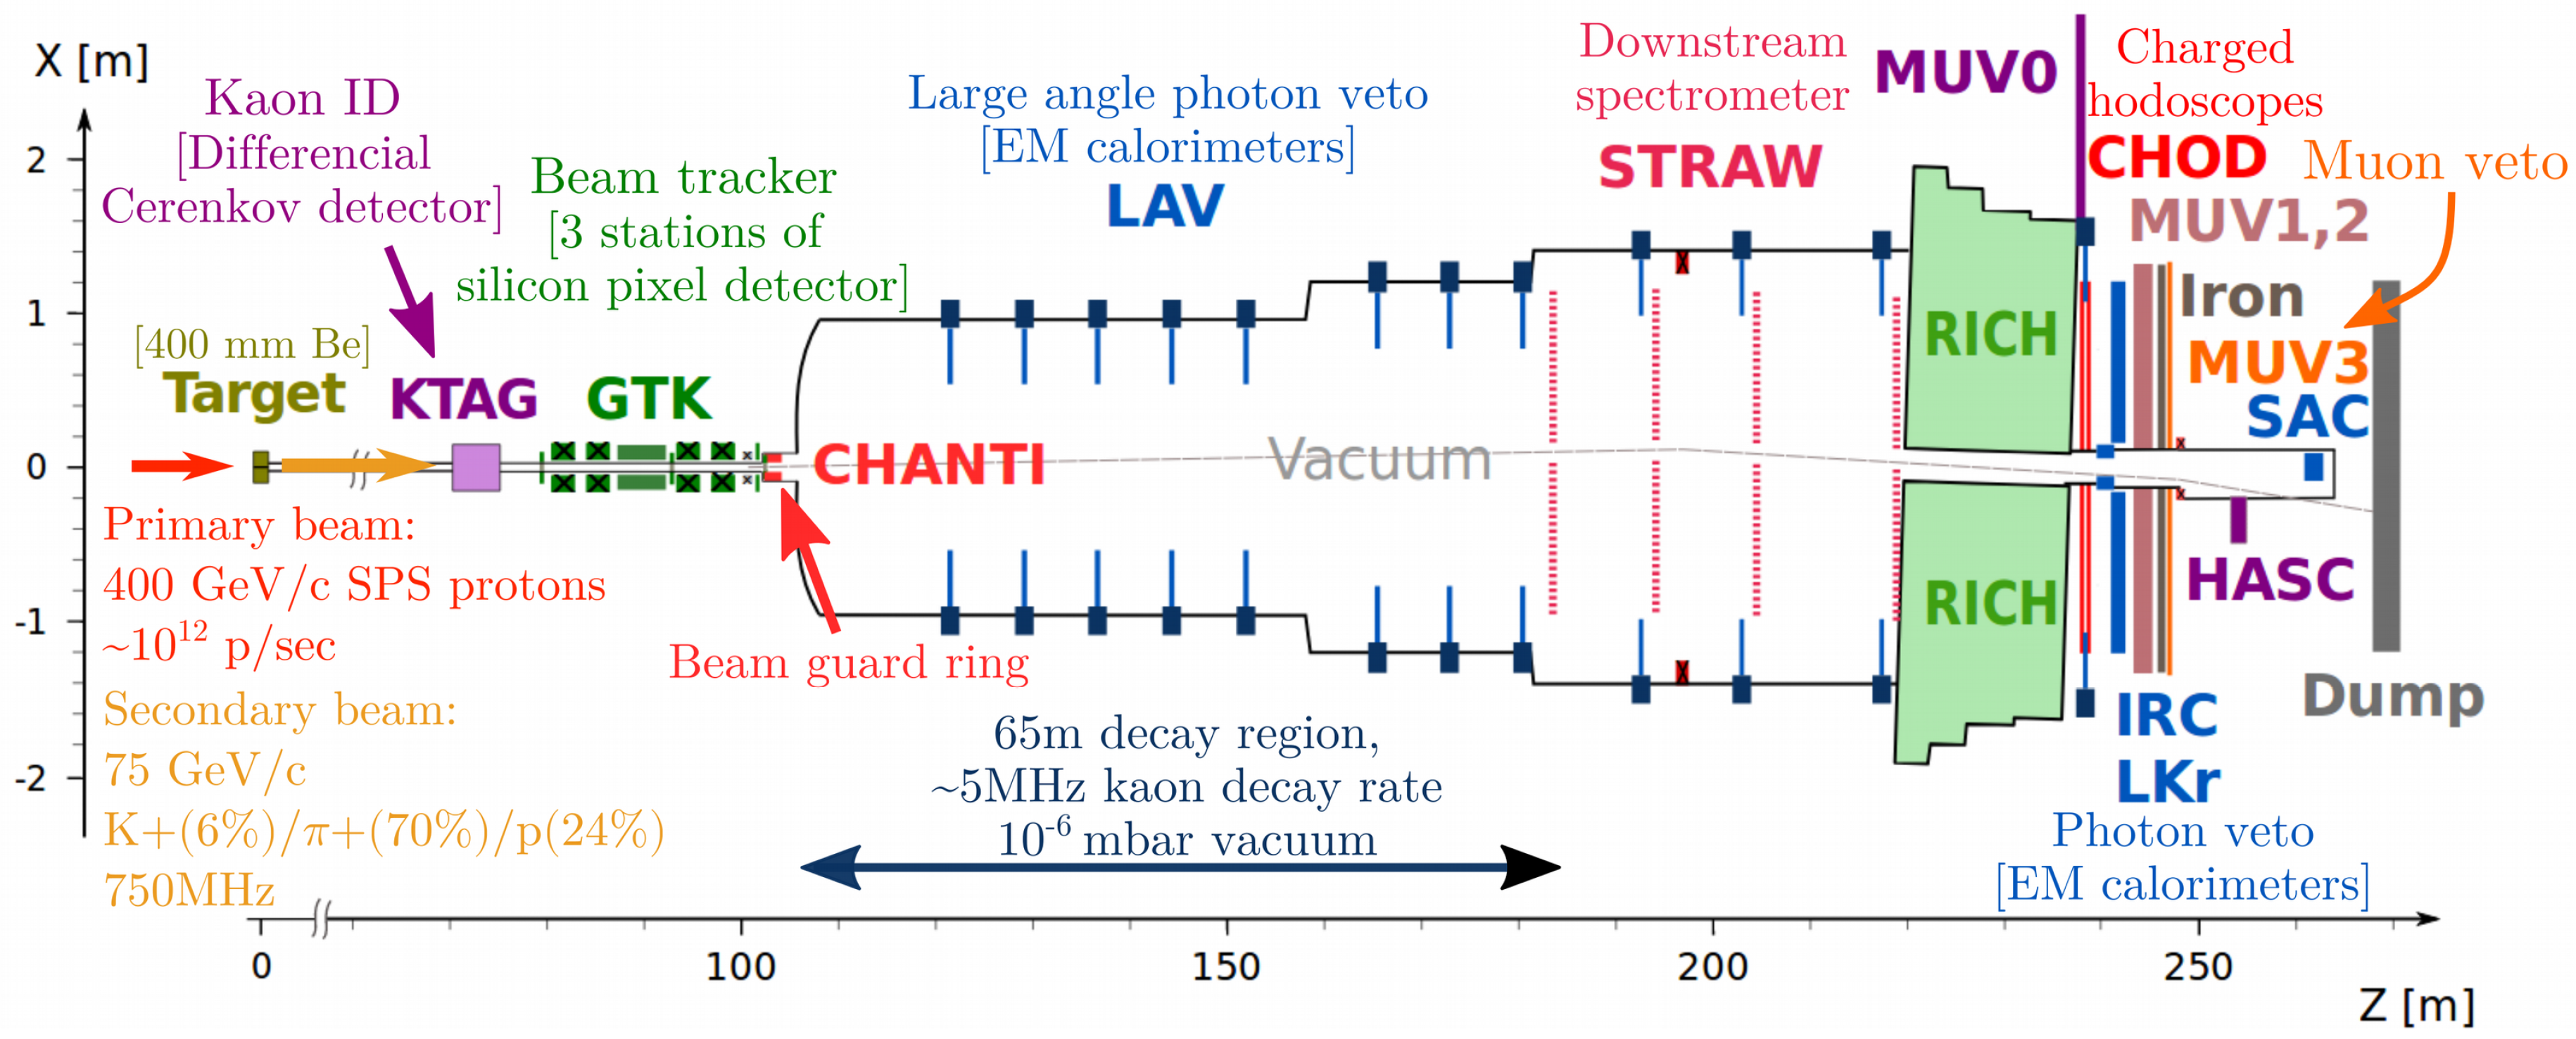
A 400 GeV/c proton beam extracted from the SPS impinges on a Beryllium target, producing a 75 GeV/c positively charged hadron beam, of nominally 750 MHz, which contains 6% of kaons, 24% of protons and 70% of pions [9]. With the so-called “decay-in-flight” technique, the 6% content of positive kaons decays in the 65 m-long fiducial volume (FV). The NA62 detectors shown in Figure 1 are briefly described in this section.

Figure 1.
NA62 schematic layout; all the detectors are visible [9].
The particle tracking system is composed of the upstream GigaTracker (GTK), used to measure direction and momentum of the incoming beam, and the downstream Straw Spectrometer, used to track the final state charged particles.
The particle identification system is composed of the KTAG, a Cherenkov differential detector used to tag upstream kaons, the RICH, a downstream Cherenkov detector providing pion/muon/electron identification, and the MUVs, a downstream set of hadronic calorimeters (MUV1 and MUV2) and a muon detector (MUV3).
While searching for rare decays, the ability to reject products of background processes is essential; NA62 uses a hermetic and extremely efficient veto system, to reach a signal to background ratio of 10:1. The charged particle veto is performed by CHANTI and HASC, whereas the photon veto is composed of LAV, LKr and SAV. Their task is to veto photons, mainly produced by decays from the decay (one of the main background processes to ) and emitted at several angles with respect to the beam axis.
Information from CHOD (a plastic scintillator hodoscope used for triggering and timing), RICH, MUV3 and LKr is built up online to issue Level 0 (L0) trigger conditions. Software-based information from KTAG, CHOD, LAV and Spectrometer provides requirement for the L1 and L2 trigger levels [9]. Data triggered by the trigger (PNN) are taken concurrently with downscaled samples for rare kaon decays studies and minimum bias. The NA62 apparatus has been commissioned in 2015 and 2016. In 2016 NA62 has collected about kaon decays for the trigger stream at 20–40% of nominal intensity.
3. Principle of Measurement
The signature of a decay is one positive kaon in the initial state and one positive pion with missing energy in the final state. The main kinematic variable is the squared missing mass, defined as
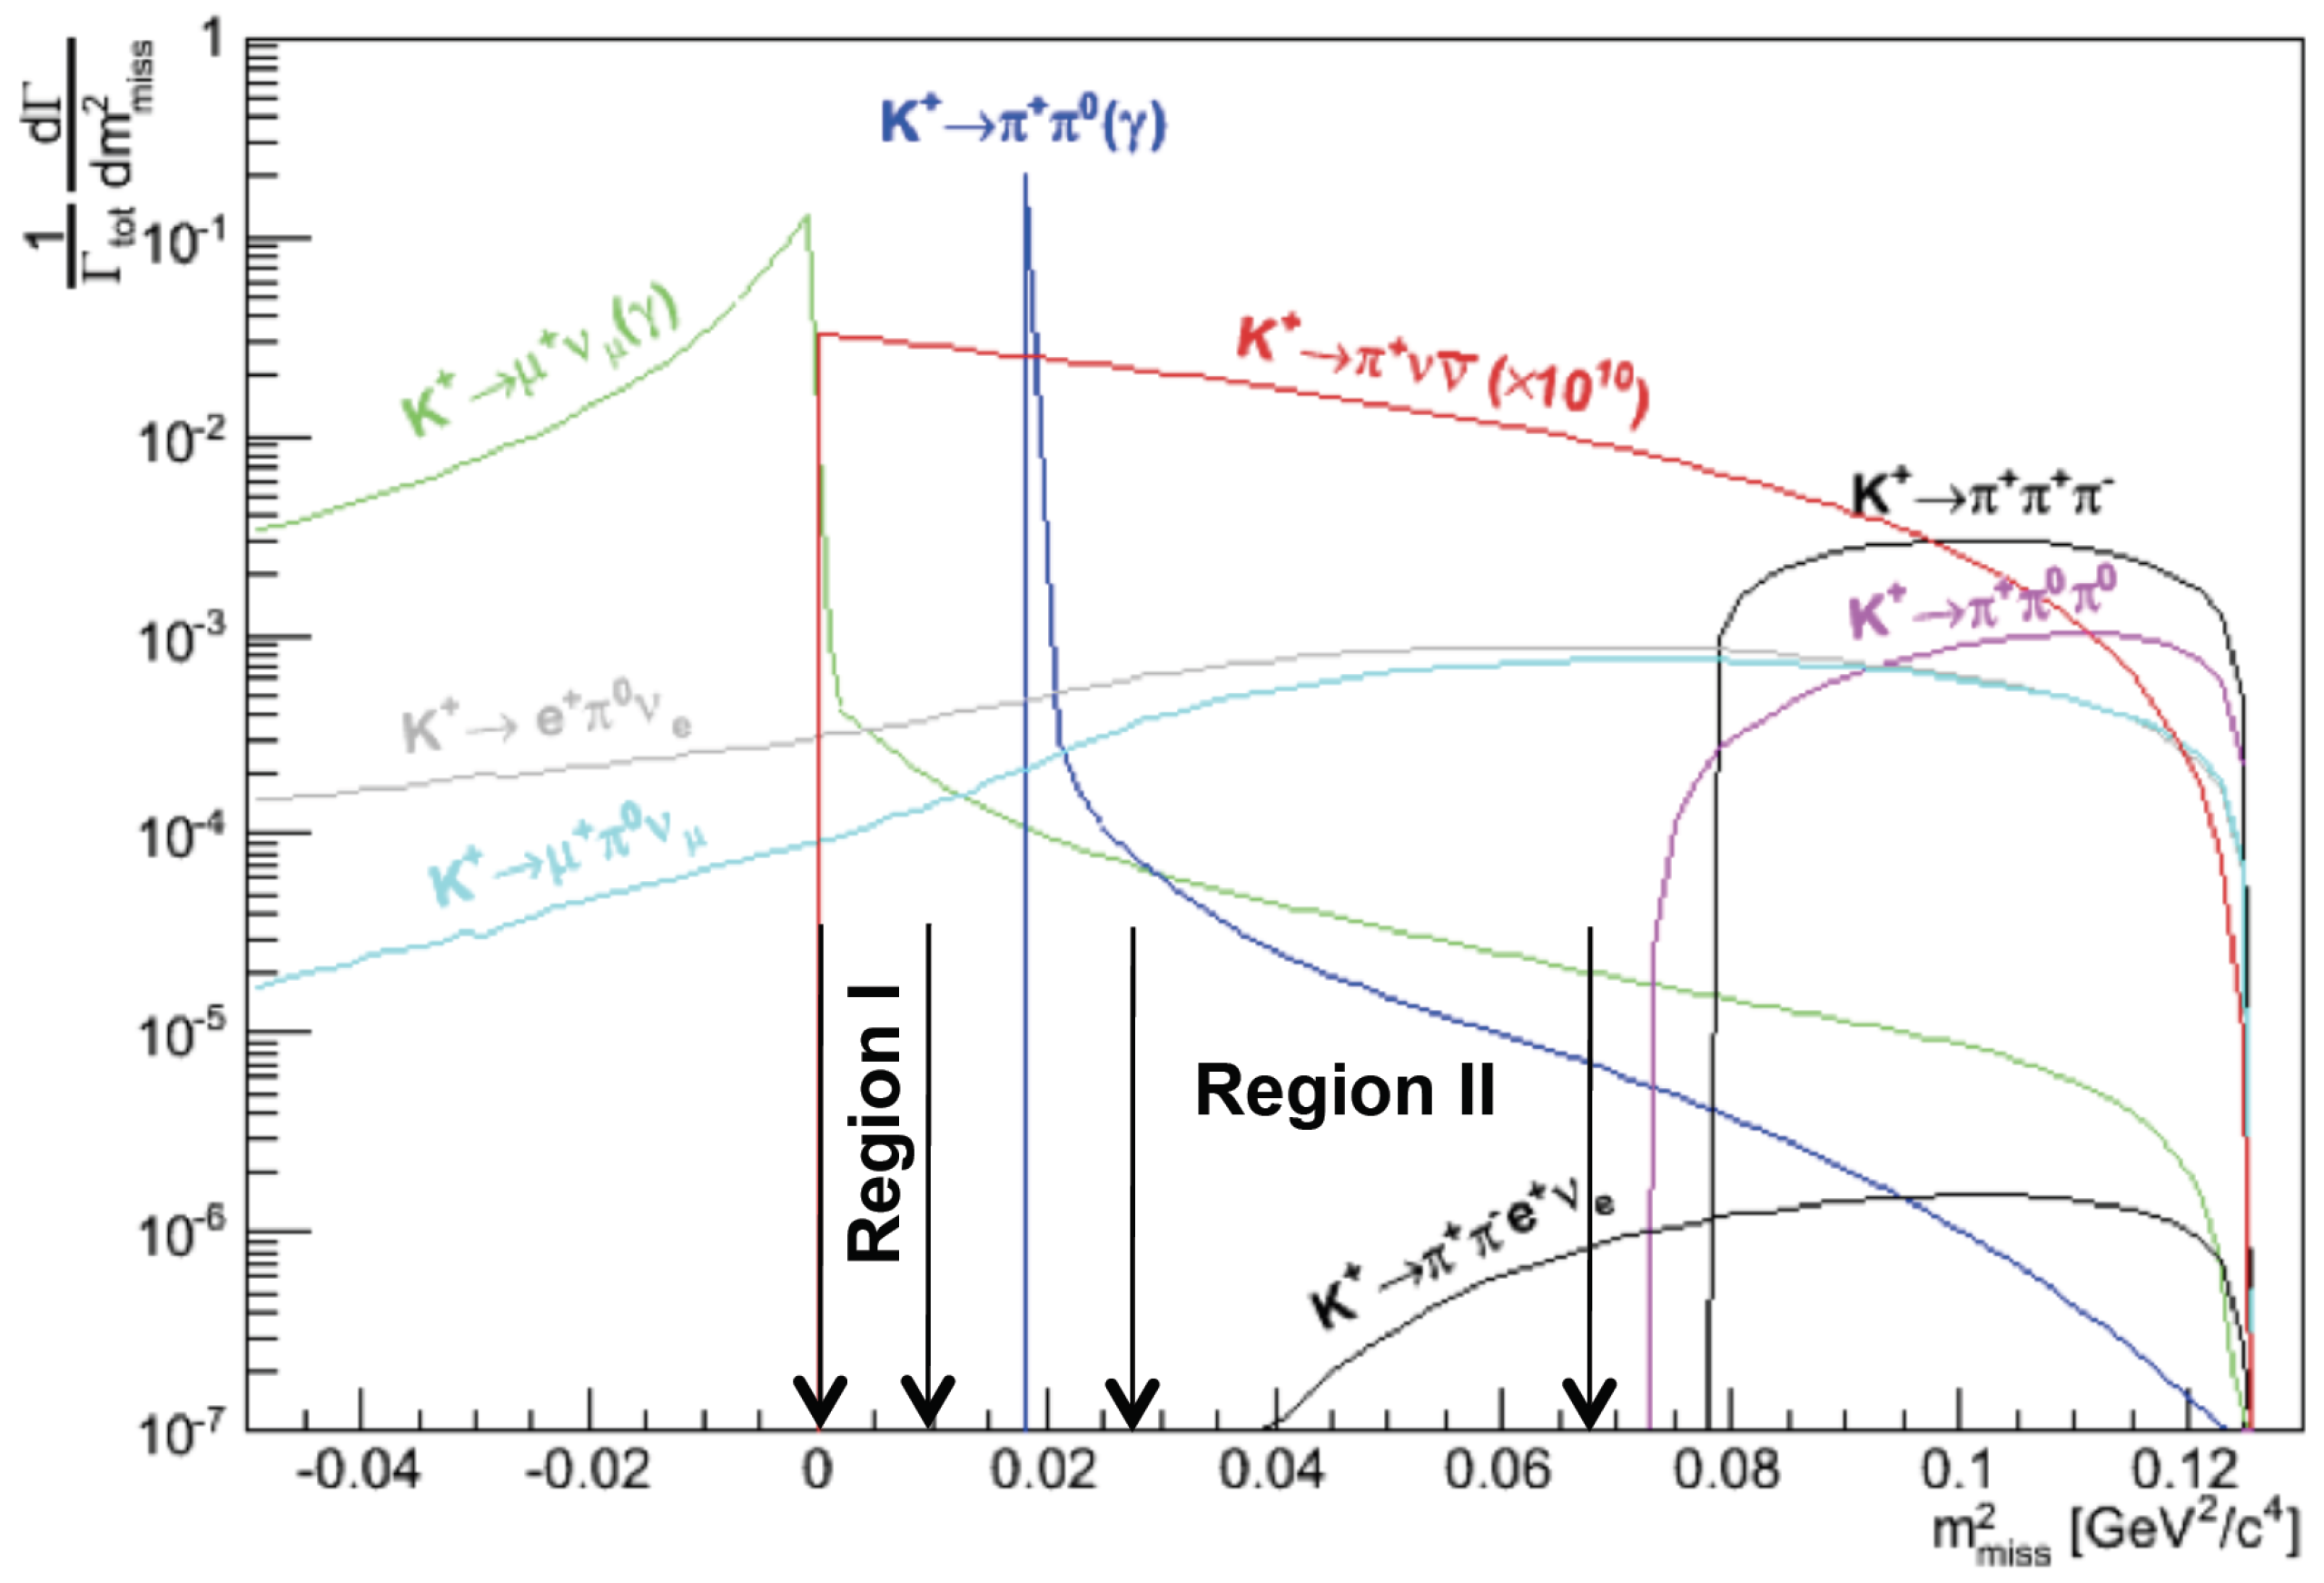
where and are the four-momenta of the kaon and pion, respectively. The neutrino-antineutrino pair carries away a large fraction of the momentum, resulting in a broadly distributed missing mass, as shown in Figure 2.
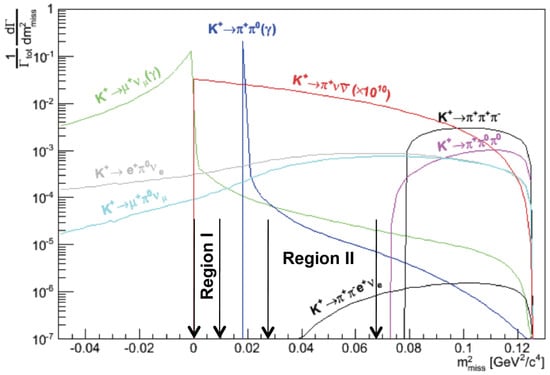
Figure 2.
Squared missing mass distribution of K+ decays relevant to the measurement. The variable is computed under the hypothesis that the charged particle in the final state is a positive pion. The signal (red line) is multiplied by 1010 for visibility. Two regions where to search for the signal are also shown.
The search for signals occurs in two regions of the squared missing mass spectrum, across the peak. Possible background sources are:
- the main decay modes, and , which can enter the signal regions through non-Gaussian resolution and radiative tails of the squared missing mass;
- , through non-Gaussian resolution tails;
- and rarer processes such as , broadly distributed across the signal regions because of the neutrinos in the final state;
- events mimicking a decay, either originated along the beam line via inelastic interactions of the beam particles with the setup or produced by kaons that decay before entering the FV downstream to the last station of the GTK.
Each source of background requires different rejection procedures, depending on the kinematics and on the type of charged particle in the final state. The estimation of the expected background remaining after the event selection is performed separately for each process. A blind procedure was adopted for the 2016 analysis, with signal and control regions kept masked as long as the evaluation of expected signal and background was not complete. The analysis makes use of the data acquired with the dedicated PNN trigger and with a minimum bias trigger, called the control trigger.
4. Event Selection
The selection proceeds through:
- definition of a positive kaon decay with a charged particle in the final state;
- positive pion identification;
- rejection of events with photons or any other activity in the final state;
- kinematic selection and definition of the signal regions.
Signals in RICH, LKr and CHOD detectors are spatially associated with tracks reconstructed in the Spectrometer to identify and timestamp the pions. A kaon is identified by the KTAG and traced by the GTK; the kaon is matched to the candidate pion, exploiting the O(100 ps) time coincidence resolution between KTAG, GTK and RICH, and the O(1 mm) resolution of the closest distance of approach (CDA) between the Spectrometer and GTK tracks. The calorimeters and the RICH provide pion identification against muons and positrons. The LAV, LKr, IRC and SAC ensure rejection of photons with direction from 0 up to 50 mrad with respect to the beam axis; the time coincidence between extra energy in these detectors and the pion is the main veto condition, with typical veto time windows ranging from to ns.
An about 50 m-long fiducial decay region is chosen, starting from about 10 m downstream of the last GTK station. The selection of kaon decays in this region makes use of criteria based on the reconstructed decay vertex, the pion position extrapolated back at the entrance of the fiducial region, the pion emission angle, and extra activity in the CHANTI and the GTK.
The analysis is restricted to 15 GeV/c 35 GeV/c. This cut halves the signal acceptance but improves significantly the detection and exploits the optimal range for identification and rejection.
The squared missing mass is used to discriminate between signal and background kinematics, where the kaon (pion) four-momentum is measured by the GTK (Spectrometer) under the hypothesis of the kaon (pion) mass.
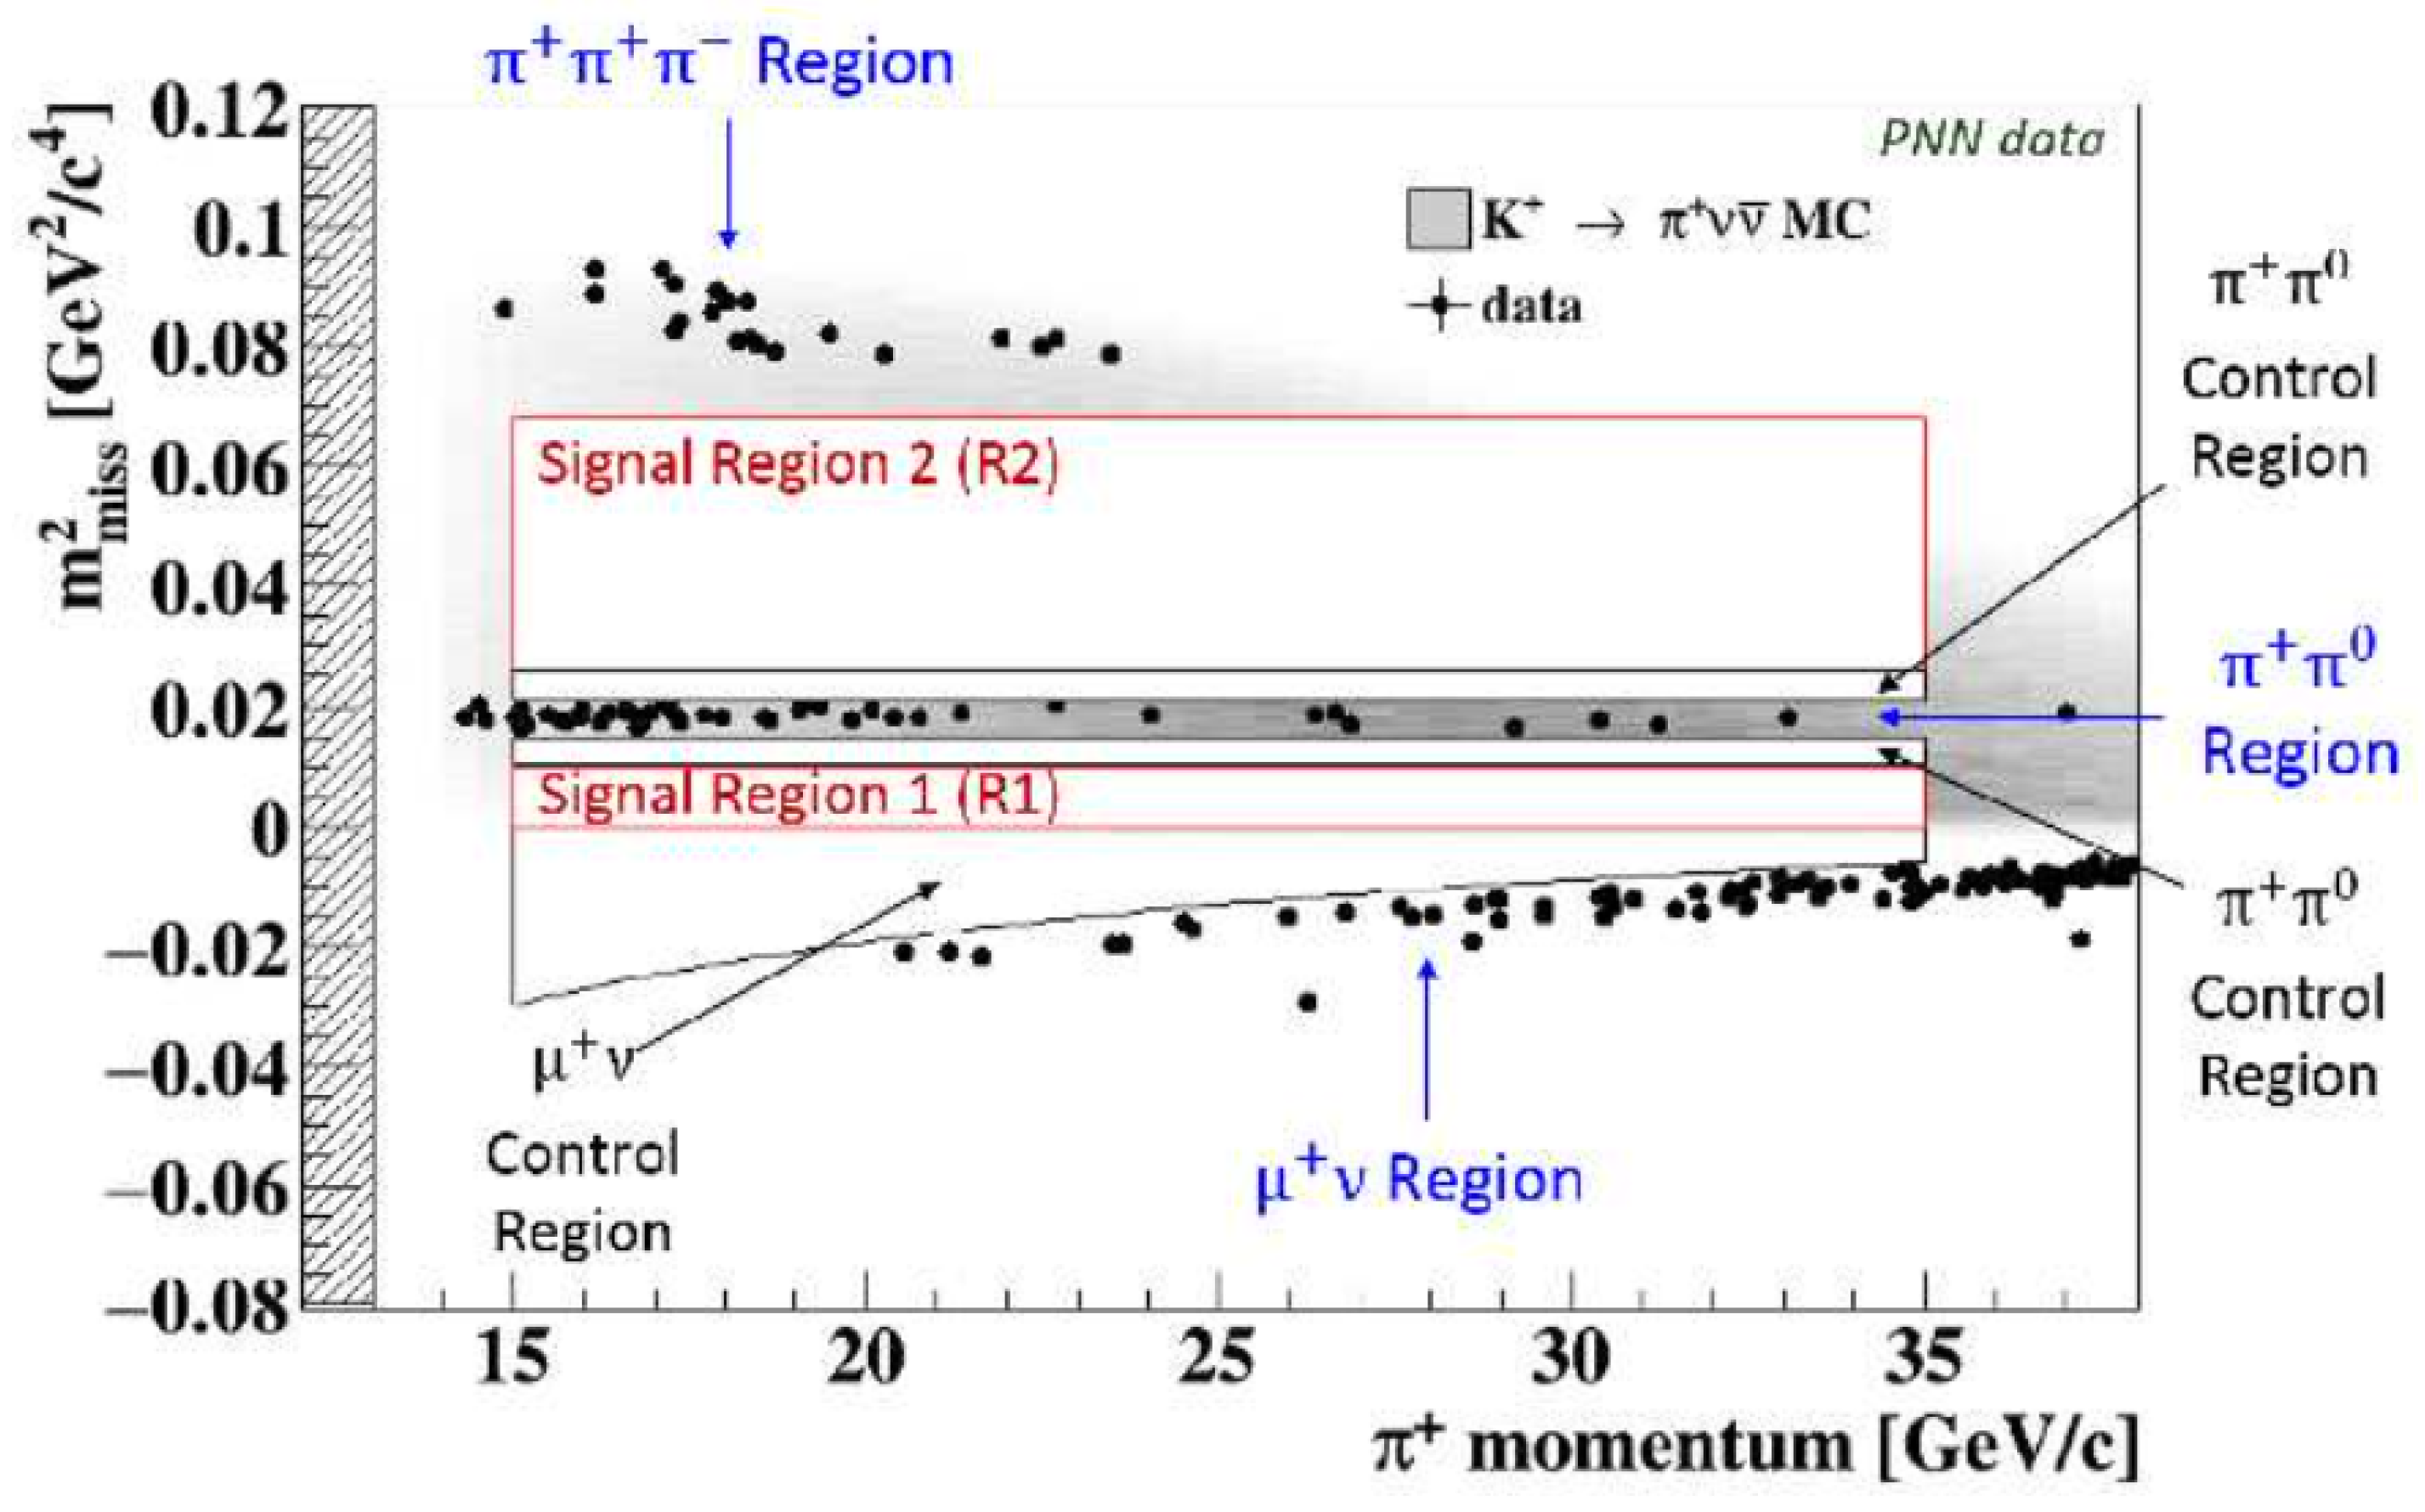
Figure 3 shows the distribution of the remaining events in the plane, with being the magnitude of the pion three-momentum. This plane defines three background regions, mostly populated by , and decays; signal regions below and above the region are called Signal Region 1 (SR1) and 2 (SR2) respectively; three control regions are defined adjacent to the regions and above the region.
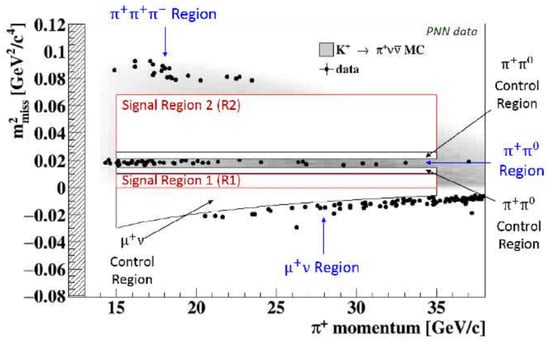
Figure 3.
Squared missing mass as a function of the pion three-momentum for PNN-triggered data events (dots) passing the event selection, except for the cuts on and . The grey area corresponds to the distribution of MC events, with darker (lighter) grey indicating more (less) populated regions. Red (black) lines define the signal (control) regions and are masked. Three background regions are also visible.
5. Single Event Sensitivity
We define the Single Event Sensitivity (SES) as , where is the number of decays and is the signal efficiency for the selection, which is about 2.6%. The number of kaons is , measured using a sample of and computed with the following , where is the number of decays selected on control data using the same criteria, except for the photon and the cut on the squared missing mass; is the selection acceptance and it is about 4% overall; is the BR of and D = 400 is the downscaling factor of the control trigger.
The final measured SES and the corresponding number of SM decays expected in SR1 and SR2 are
The external error to comes from the uncertainty on .
6. Background Estimation
Background from decaying in the fiducial region comes primarily from , , and processes (see Table 1).

Table 1.
Summary of the background estimation for the analysis on 2016 data.
To estimate the fraction of these decays remaining in the signal regions, the assumption is made that rejection for , particle identification for and multiplicity rejection, i.e., extra activity in CHOD and Spectrometer, for are independent from the cuts defining the signal regions. The number of expected events from these processes in the signal regions, , is computed as ; here, is the number of remaining PNN-triggered events in the corresponding background region after the event selection, except the cut on the squared missing mass; is the fraction of background events entering the signal regions through the reconstructed tails of the corresponding peak. The fraction , called tails, is modeled on control samples selected on data and eventually corrected for biases induced by the selection criteria using MC simulations; expected background in control regions is derived similarly.
After unblinding the control regions, one event is observed, whereas are expected; moreover, after unblinding the control region, two events are observed, while are expected. The decays could enter primarily SR2; multiplicity rejection and kinematic cuts turn out to be very effective and the expected background is found to be almost negligible. Background from is expected in SR2 as well, and it is suppressed by multiplicity rejection, particle identification and kinematics.
For what concerns events mimicking a decay, as defined in Section 3, the rejection is achieved through a geometrical cut and the fact that the distribution of the time coincidence between KTAG-RICH and GTK-KTAG suggests an accidental source for these events.
Summing up the various contributions, the overall final expected background in SR1 and SR2 is .
7. Results
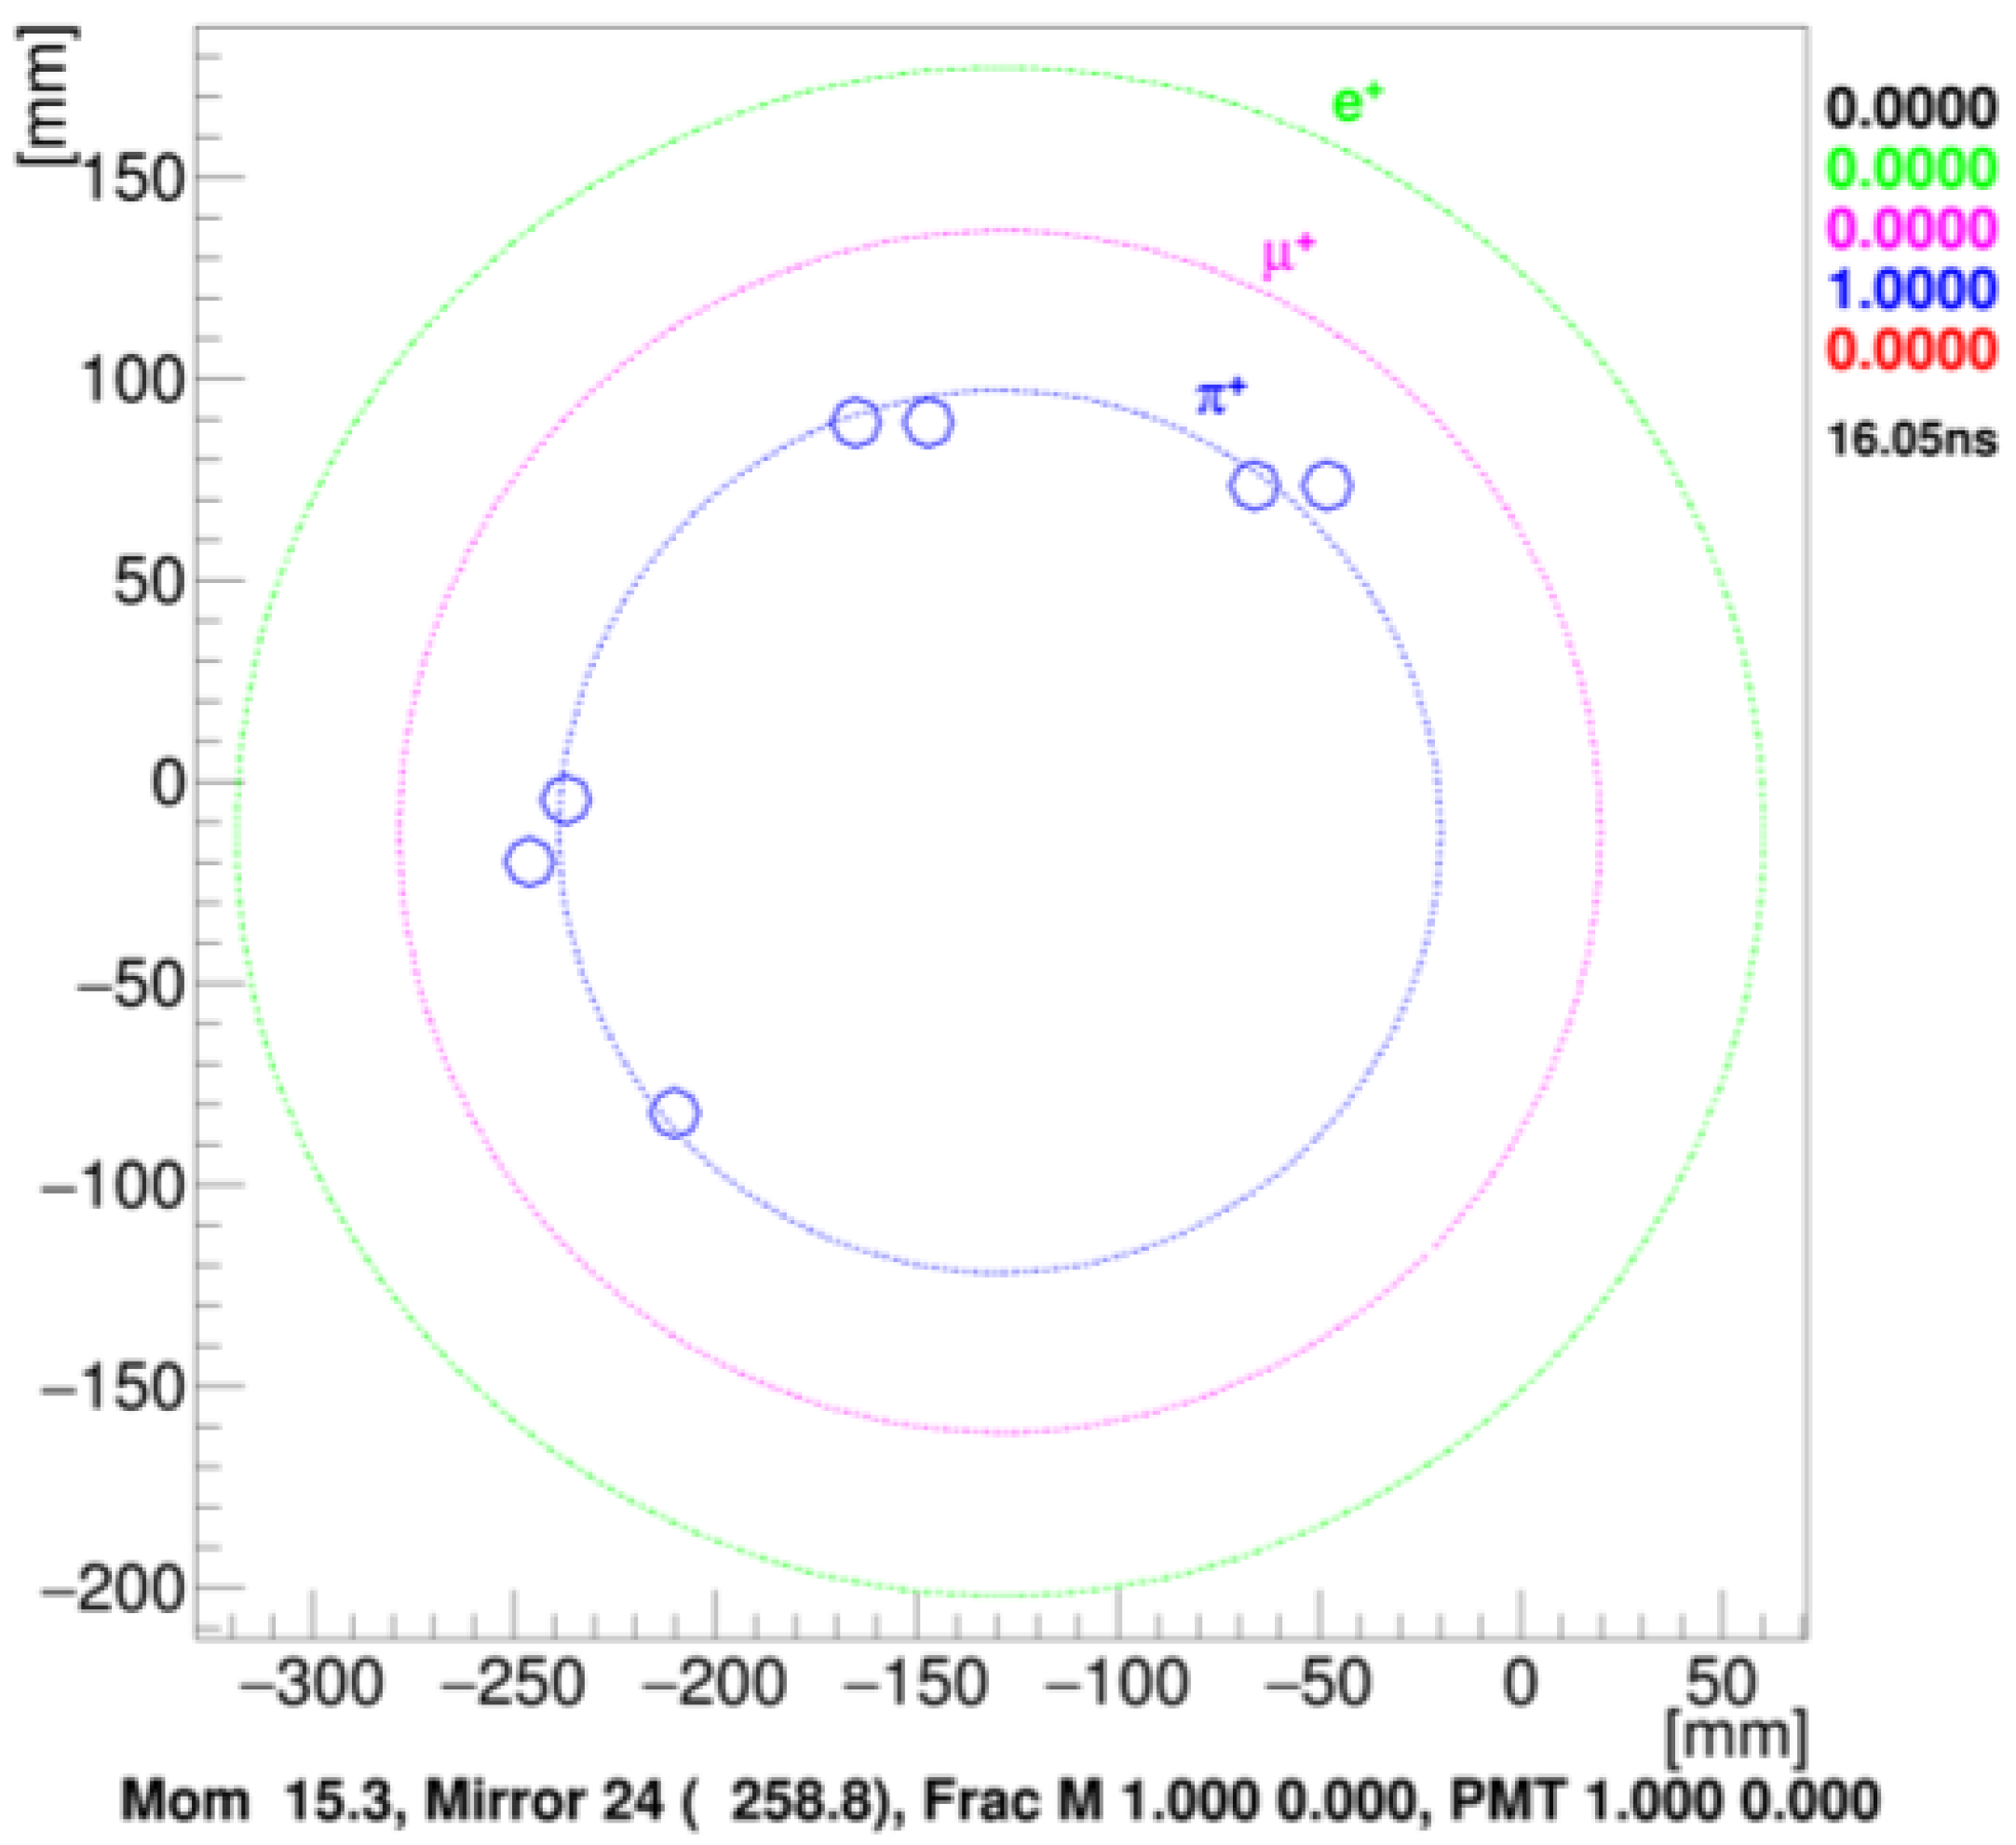
After unblinding the signal regions, one event is found in SR2, as shown in Figure 4; the corresponding pion has a momentum of 15.3 GeV/c, with the RICH clearly indicating that it is a pion (Figure 5). Using the confidence level (CL) method described in [10], the observed upper limit on at 95% CL is
where the corresponding expected limit is
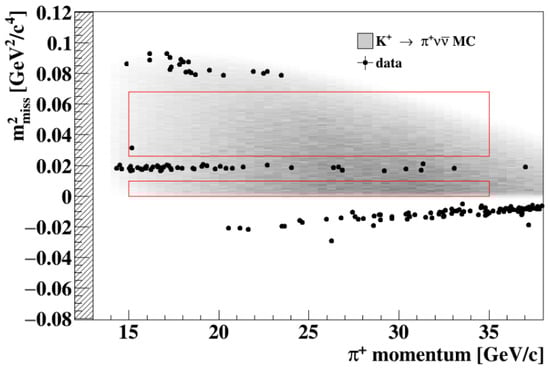
Figure 4.
Squared missing mass as a function of the pion three-momentum for PNN-triggered data events (dots) passing the event selection, except for the cuts on and . The grey area corresponds to the distribution of MC events; red lines define the signal regions. The event observed in SR2 is shown.
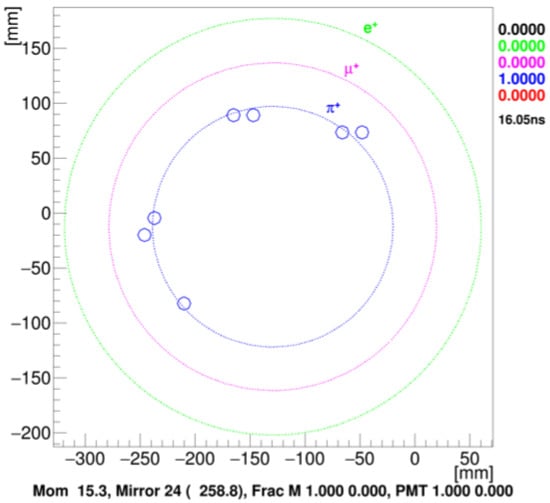
Figure 5.
Position of the hits in the RICH forming the ring associated with the pion of the observed event in SR2, as given by the RICH event display. The circles illustrate the positron, muon, and pion hypotheses, showing a perfect agreement of the observed event with the pion hypothesis.
8. Conclusions
The first search for the decay with an in-flight kaon-decay technique is reported by the NA62 collaboration. The data collected in 2016 amount to about 1% of the total data-taking of the NA62 experiment in 2016–2018. The single event sensitivity is found to be . The analysis has shown one candidate event compatible with the SM expectation (0.27) and with the background expectation (0.15). Interpreting the candidate as background leads to the upper limit at 95% CL on . The NA62 experiment has already collected more than 20 times the statistics presented here, and the analysis of this larger data sample is in progress.
Funding
The cost of the experiment and of its auxiliary systems were supported by the funding agencies of the Collaboration Institutes. We are particularly indebted to: F.R.S.-FNRS (Fonds de la Recherche Scientifique—FNRS), Belgium; BMES (Ministry of Education, Youth and Science), Bulgaria; MEYS (Ministry of Education, Youth and Sports), Czech Republic; BMBF (Bundesministerium für Bildung und Forschung) contracts 05H09UM5, 05H12UM5 and 05H15UMCNA, Germany; INFN (Istituto Nazionale di Fisica Nucleare), Italy; MIUR (Ministero dell’Istruzione, dell’ Università e della Ricerca), Italy; CONACyT (Consejo Nacional de Ciencia y Tecnología), Mexico; IFA (Institute of Atomic Physics), Romania; INR-RAS (Institute for Nuclear Research of the Russian Academy of Sciences), Moscow, Russia; JINR (Joint Institute for Nuclear Research), Dubna, Russia; NRC (National Research Center) “Kurchatov Institute” and MESRF (Ministry of Education and Science of the Russian Federation), Russia; MESRS (Ministry of Education, Science, Research and Sport), Slovakia; CERN (European Organization for Nuclear Research), Switzerland; STFC (Science and Technology Facilities Council), United Kingdom; NSF (National Science Foundation) Award Number 1506088, U.S.A.; ERC (The European Research Council) “UniversaLepto” advanced grant 268062, “KaonLepton” starting grant 336581, Europe. Individuals have received support from: Charles University (project GA U.K. number 404716), Czech Republic; Ministry of Education, Universities and Research (MIUR “Futuro in ricerca 2012” grant RBFR12JF2Z, Project GAP), Italy; The Royal Society (grants UF100308, UF0758946), United Kingdom; The Science and Technology Facilities Council (Rutherford fellowships ST/J00412X/1, ST/M005798/1), United Kingdom; The European Research Council (ERC “UniversaLepto” advanced grant 268062, ERC “KaonLepton” starting grant 336581).
Conflicts of Interest
The authors declare no conflicts of interest.
References
- Buras, A.J.; Buttazzo, D.; Girrbach-Noe, J.; Knegjens, R. and in the Standard Model: Status and Perspectives. J. High Energy Phys. 2015, 2015, 033. [Google Scholar] [CrossRef]
- Buchalla, G.; Buras, A.J. The rare decays , and B → l+l−: An Update. Nucl. Phys. B 1999, 548, 309. [Google Scholar] [CrossRef]
- Buras, A.J.; Gorbahn, M.; Haisch, U.; Nierste, U. Charm quark contribution to at next-to-next-to-leading order. J. High Energy Phys. 2006, 2006, 002. [Google Scholar] [CrossRef]
- Brod, J.; Gorbahn, M.; Stamou, E. Two-loop electroweak corrections for the decays. Phys. Rev. D 2011, 83, 034030. [Google Scholar] [CrossRef]
- Blanke, M.; Buras, A.J.; Recksiegel, S. Quark flavour observables in the Littlest Higgs model with T-parity after LHC Run 1. Eur. Phys. J. C 2016, 76, 182. [Google Scholar] [CrossRef] [PubMed]
- Blanke, M.; Buras, A.J.; Duling, B.; Gemmler, K.; Gori, S. Rare K and B Decays in a Warped Extra Dimension with Custodial Protection. J. High Energy Phys. 2009, 2009, 0903. [Google Scholar]
- Artamonov, A.V.; et al.; [E949 Collaboration] New Measurement of the Branching Ratio. Phys. Rev. Lett. 2008, 101, 191802. [Google Scholar] [PubMed]
- Artamonov, A.V.; et al.; [E949 Collaboration] Study of the decay in the momentum region 140 < Pπ < 199 MeV/c. Phys. Rev. D 2008, 79, 092004. [Google Scholar] [CrossRef]
- The NA62 Collaboration. The beam and detector of the NA62 experiment at CERN. J. Instrum. 2017, 12, 05025. [Google Scholar]
- Read, A.L. Presentation of search results: The CL(s) technique. J. Phys. G 2002, 28, 2693. [Google Scholar] [CrossRef]

© 2018 by the author. Licensee MDPI, Basel, Switzerland. This article is an open access article distributed under the terms and conditions of the Creative Commons Attribution (CC BY) license (http://creativecommons.org/licenses/by/4.0/).