1. Introduction
Over billions of years, the Martian atmosphere, a thin envelope dominated by carbon dioxide (CO
2), went through a remarkable development, changing from a thicker, warmer state that could support liquid water to the cold, dry climate it is today [
1]. A primary catalyst of this transition is atmospheric escape, a phenomenon intensified by solar extreme ultraviolet (EUV) radiation and interactions with solar wind [
2]. Although the gradual degradation of Mars’ atmosphere has been well examined, the impact of transient solar phenomena, especially solar flares, remains little comprehended, despite their capacity to introduce substantial energy into the thermosphere within minutes to hours [
3,
4]. Solar flares, abrupt emissions of radiation across X-ray to EUV wavelengths, can temporarily increase Mars’ thermospheric temperatures by several hundred kelvins, modify photochemical equilibria, and enhance atmospheric escape [
5,
6]. Solar flares are categorized based on their peak X-ray flux, with X-class flares (≥10
−4 W/m
2) releasing approximately 10 times more energy than M-class flares (≥10
−5 W/m
2) [
7]. These phenomena induce sudden ionization and thermal elevation in planetary atmospheres; however, their impacts on Mars differ from those on Earth, owing to Mars’ absence of a global magnetic field and reduced atmospheric density [
8]. X-class flares may have elevated Mars’ thermospheric density by about 200% at exobase altitudes over 200 km during the 2003 Halloween solar storms [
9].
The Mars Atmosphere and Volatile Evolution (MAVEN) mission, active since 2014, offers an unparalleled opportunity to analyze flare-driven dynamics using in situ data. MAVEN’s array of sensors, comprising the Neutral Gas and Ion Mass Spectrometer (NGIMS) and the Extreme Ultraviolet Monitor (EUVM), record altitude-resolved variations in density, temperature, and composition during solar eruptions [
10,
11]. The upper atmosphere of Mars reacts quickly to solar flares, and recent research using MAVEN data has shown that flares increase ion escape rates [
6] and disrupt photochemical cycles [
12]. The temperature rose by 58–155 K during M-class flares [
4] and 100 K during the historic X8.2 flare in September 2017 [
5]. These observations demonstrate how sensitive the thermosphere is to flare energy deposition, especially for inert species like argon (Ar), which are accurate indicators of thermal expansion [
4]. Nevertheless, these investigations have predominantly concentrated on individual flare occurrences or simulated responses without clarifying class-specific mechanisms [
13,
14]. This oversight is significant; if X-class flares provoke nonlinear alterations in atmospheric loss rates relative to smaller events, their cumulative impact throughout Mars’ history could alter assessments of volatiles expelled into space, a crucial inquiry in understanding the planet’s climatic evolution [
15,
16].
The composition of the Martian thermosphere makes responding to flares even more challenging. While atomic oxygen (O) predominates at higher elevations and shows a steeper scale height due to photochemical production, carbon dioxide (CO
2), the dominant species below ~150 km, cools effectively via infrared emission [
8,
13]. Increased ionization and dissociation rates caused by flare-enhanced EUV irradiance change the O/CO
2 ratio and redistribute energy among species [
5,
12]. However, the relationship among flare magnitude, compositional changes, and thermospheric heating is still unclear. Global circulation models (GCMs) indicate that the deposition energy of flares is dependent on atmospheric structure and irradiance intensity, but there is insufficient observational support for these predictions [
8,
17]. To separate these effects and improve forecast models of atmospheric behavior in the face of severe space weather, a methodical comparison of flare class impacts is therefore necessary. However, there are significant gaps in our knowledge of space weather’s role in planetary evolution because the class-dependent impacts of how X-class (extreme) versus M-class (moderate) flare events affect the atmosphere differently have never been quantitatively determined. This discrepancy makes it difficult to simulate how Mars’ atmosphere would have changed in the presumed “active” state of the early Sun, when flares would have happened orders of magnitude more often [
18,
19]. Crucially, there is a nonlinear relationship between flare irradiance and thermospheric reaction. Studies conducted on Earth show that finite energy dissipation rates cause higher atmospheric heating to saturate at severe EUV fluxes [
20]; nevertheless, Mars’ fragile atmosphere does not have such limits. Rare X-class events may cause disproportionate, nonlinear effects that alter atmospheric structure and escape routes, whereas smaller flares (such as M-class) may dominate cumulative energy input because of their higher frequency. A species-specific strategy is needed to separate these dynamics: photochemically active species (CO
2, CO, O) record the interaction of dissociation, radiative cooling, and vertical transport, whereas inert gases (Ar, N
2) act as tracers of thermal expansion.
This study is the first to quantitatively compare class-dependent responses in situ using simultaneous MAVEN NGIMS and EUVM data, and it introduces a novel perspective by comparing the thermospheric reactions, such as recovery timelines, altitude-dependent heating rates, and photochemical perturbations of the X8.2 flare (10 September 2017) to the M6.0 flare (17 September 2017). On 10 September 2017, the X8.2 flare was immediately visible from Earth and Mars and could be viewed at the Sun’s western edge. In contrast, the M6 flare on 17 September 2017 took place on the Sun’s far side, meaning that the accompanying CME, rather than the flare itself, dominated Mars’ UV observations. Their energy spectra differ significantly because of their highly disparate flare sites and emission kinds. Consequently, X-ray intensity ratios alone cannot account for atmospheric variations. We find altitude-resolved density, temperature, and compositional alterations by separating flare magnitude and spectrum influences on five important species (CO2, Ar, N2, O, and CO) using simultaneous MAVEN EUV irradiance and NGIMS neutral species data, the first such integrated dataset for Martian flares. We relate energy deposition processes to scale height changes, flare-driven dissociation rates, and the O/CO2 ratio, a crucial photochemical indicator. In contrast to the irradiance–response linearity expectations, the X8.2 flare produced nonlinear saturation effects in heating and photochemistry. In contrast, the M6.0 flare demonstrated the mitigating effect of radiative cooling, as CO2 stabilized within 1–2 orbits after the outburst. These results give empirical restrictions on energy partitioning between thermal expansion, dissociation, and cooling, redefine flare-driven escape mechanisms, and cast doubt on assumptions in atmospheric models. This study improves scenarios for historical atmospheric loss and predicts space weather impacts on present and future Mars exploration by connecting stellar activity to planetary atmospheric evolution. It highlights the significant contribution of rare X-class flares to the formation of weakly buffered atmospheres.
This paper is structured as follows:
Section 2 describes the MAVEN datasets and methodology;
Section 3 presents altitude-resolved flare responses;
Section 4 discusses mechanisms of heating, photochemistry, and recovery; and
Section 5 explores implications for Mars’ climate history and exoplanetary science.
2. Dataset and Methodology
Since September 2014, MAVEN has been in orbit above Mars, utilizing nine onboard scientific instruments to study how the Sun and solar wind interact with the upper atmosphere and Martian magnetosphere [
21]. With periapsis close to 150 km and apoapsis close to 6200 km during a 4.5 h period, it has an extremely eccentric orbit.
The MAVEN NGIMS instrument provides the neutral species densities utilized in this investigation [
11]. From periapsis (about 150–160 km for typical science activities) to approximately 300 km, the NGIMS is a quadrupole mass spectrometer that can measure precise density profiles of different components of the Martian neutral atmosphere. For every periapsis pass, a 20 min collecting period is used, with individual measurements obtained every two seconds. The MAVEN Extreme Ultraviolet Monitor (EUVM) sensor provides information on solar X-ray/EUV radiation incidents on Mars [
10]. Observations of flare irradiance are conducted using the MAVEN EUVM band of 0 to 7 nm from the level 2 data package version 11 revision 1 [
5].
The following criteria are applied in this work to the flare-affected neutral density profiles from NGMIS datasets [
22]. The flare occurrence was monitored by EUVM at Mars. The X8.2 flare on 10 September 2017 and the M6.0 flare on 17 September 2017 were chosen due to their temporal alignment with MAVEN’s periapsis passes on the dayside solar zenith angle < 90° and their peak indices (>10
−4 W/m
2 for X-class and >10
−5 W/m
2 for M-class) [
4,
5]. The M6.0 solar flare, as estimated by EUVM, was on the Sun’s far side as seen from Earth. The intensity of the M6.0 flare on 17 September 2017 is based on MAVEN EUVM observations, since this event was not visible to Earth-based GOES satellites (
https://lasp.colorado.edu/maven/sdc/public/pages/notebook/events/index.html#/ (accessed on 22 July 2025)). For NGIMS to detect the atmospheric density during the flare phase, the spacecraft must pass by the periapsis during that time. During these orbits, a Neutral Gas and Ion Mass Spectrometer (NGIMS) generated neutral density profiles for Ar, CO
2, N
2, CO, and O, with an emphasis on altitude ranges of 150–350 km to capture thermospheric and exobase areas [
11]. The csn (only closed source neutral products Ar, CO
2, He, N
2) and cso (all neutral products Ar, CO
2, He, N
2,CO, O
2, O, NO) neutral abundance files serve as the foundation for all level 2 version 7 revision 3 NGIMS data [
23], and they are limited to the incoming half of the passes. Using the Solar Energetic Particle sensor from MAVEN, periods that coincided with eclipses or solar energetic particle (SEP) occurrences were removed [
24]. Additionally, we left out global dust storms, which also affect the Martian upper atmosphere; during the dust storm season, the ionosphere’s peak height is greater and its peak density is lower than it is during the non-dust storm season [
25].
To establish baseline variability and rule out non-flare-driven perturbations, data from ten pre-flare and post-flare orbits about the solar event as well as the X-class flare peak around 10 September 2017 16:45 UTC [
5] and the M-class flare peak around 17 September 2017 12:10 UTC were included. We note that the pre-flare orbits for X8.2 (10 September 2017) occur after the M3.7 flare on 09 September 2017, and thus may include atmospheric effects from both events. We use the density scale height H, which is defined as
where H is scale height, k is the Boltzmann constant, T is temperature, m
s is the mass of each individual species, g is the gravity of Mars, z is altitude,
is density, and at a reference altitude, density is
. Using
over isothermal altitude ranges for linear fit is the result of combining Equations (1) and (2) [
26]. Altitude bins were created to separate processes particular to a species, such as 193–211 km for N
2 and 182–198 km for CO
2. To maintain isothermal assumptions, bins for inert species (Ar, N
2) matched their scale heights (H = 15–25 km) [
4,
8]. Narrower bins (<200 km) minimized background and diurnal fluctuation by resolving photochemical gradients in reactive species (CO
2, O, and CO), whereas wider bins (>200 km) caught diffusive equilibrium [
5,
13]. In total, ≥50 data points per bin were guaranteed by optimizing bins for MAVEN’s 2 s sampling cadence. In order to reduce stochastic noise, temperatures were averaged across three consecutive orbits, and scale height uncertainties were propagated from NGIMS density errors (±15% for Ar, ±20% for CO
2) [
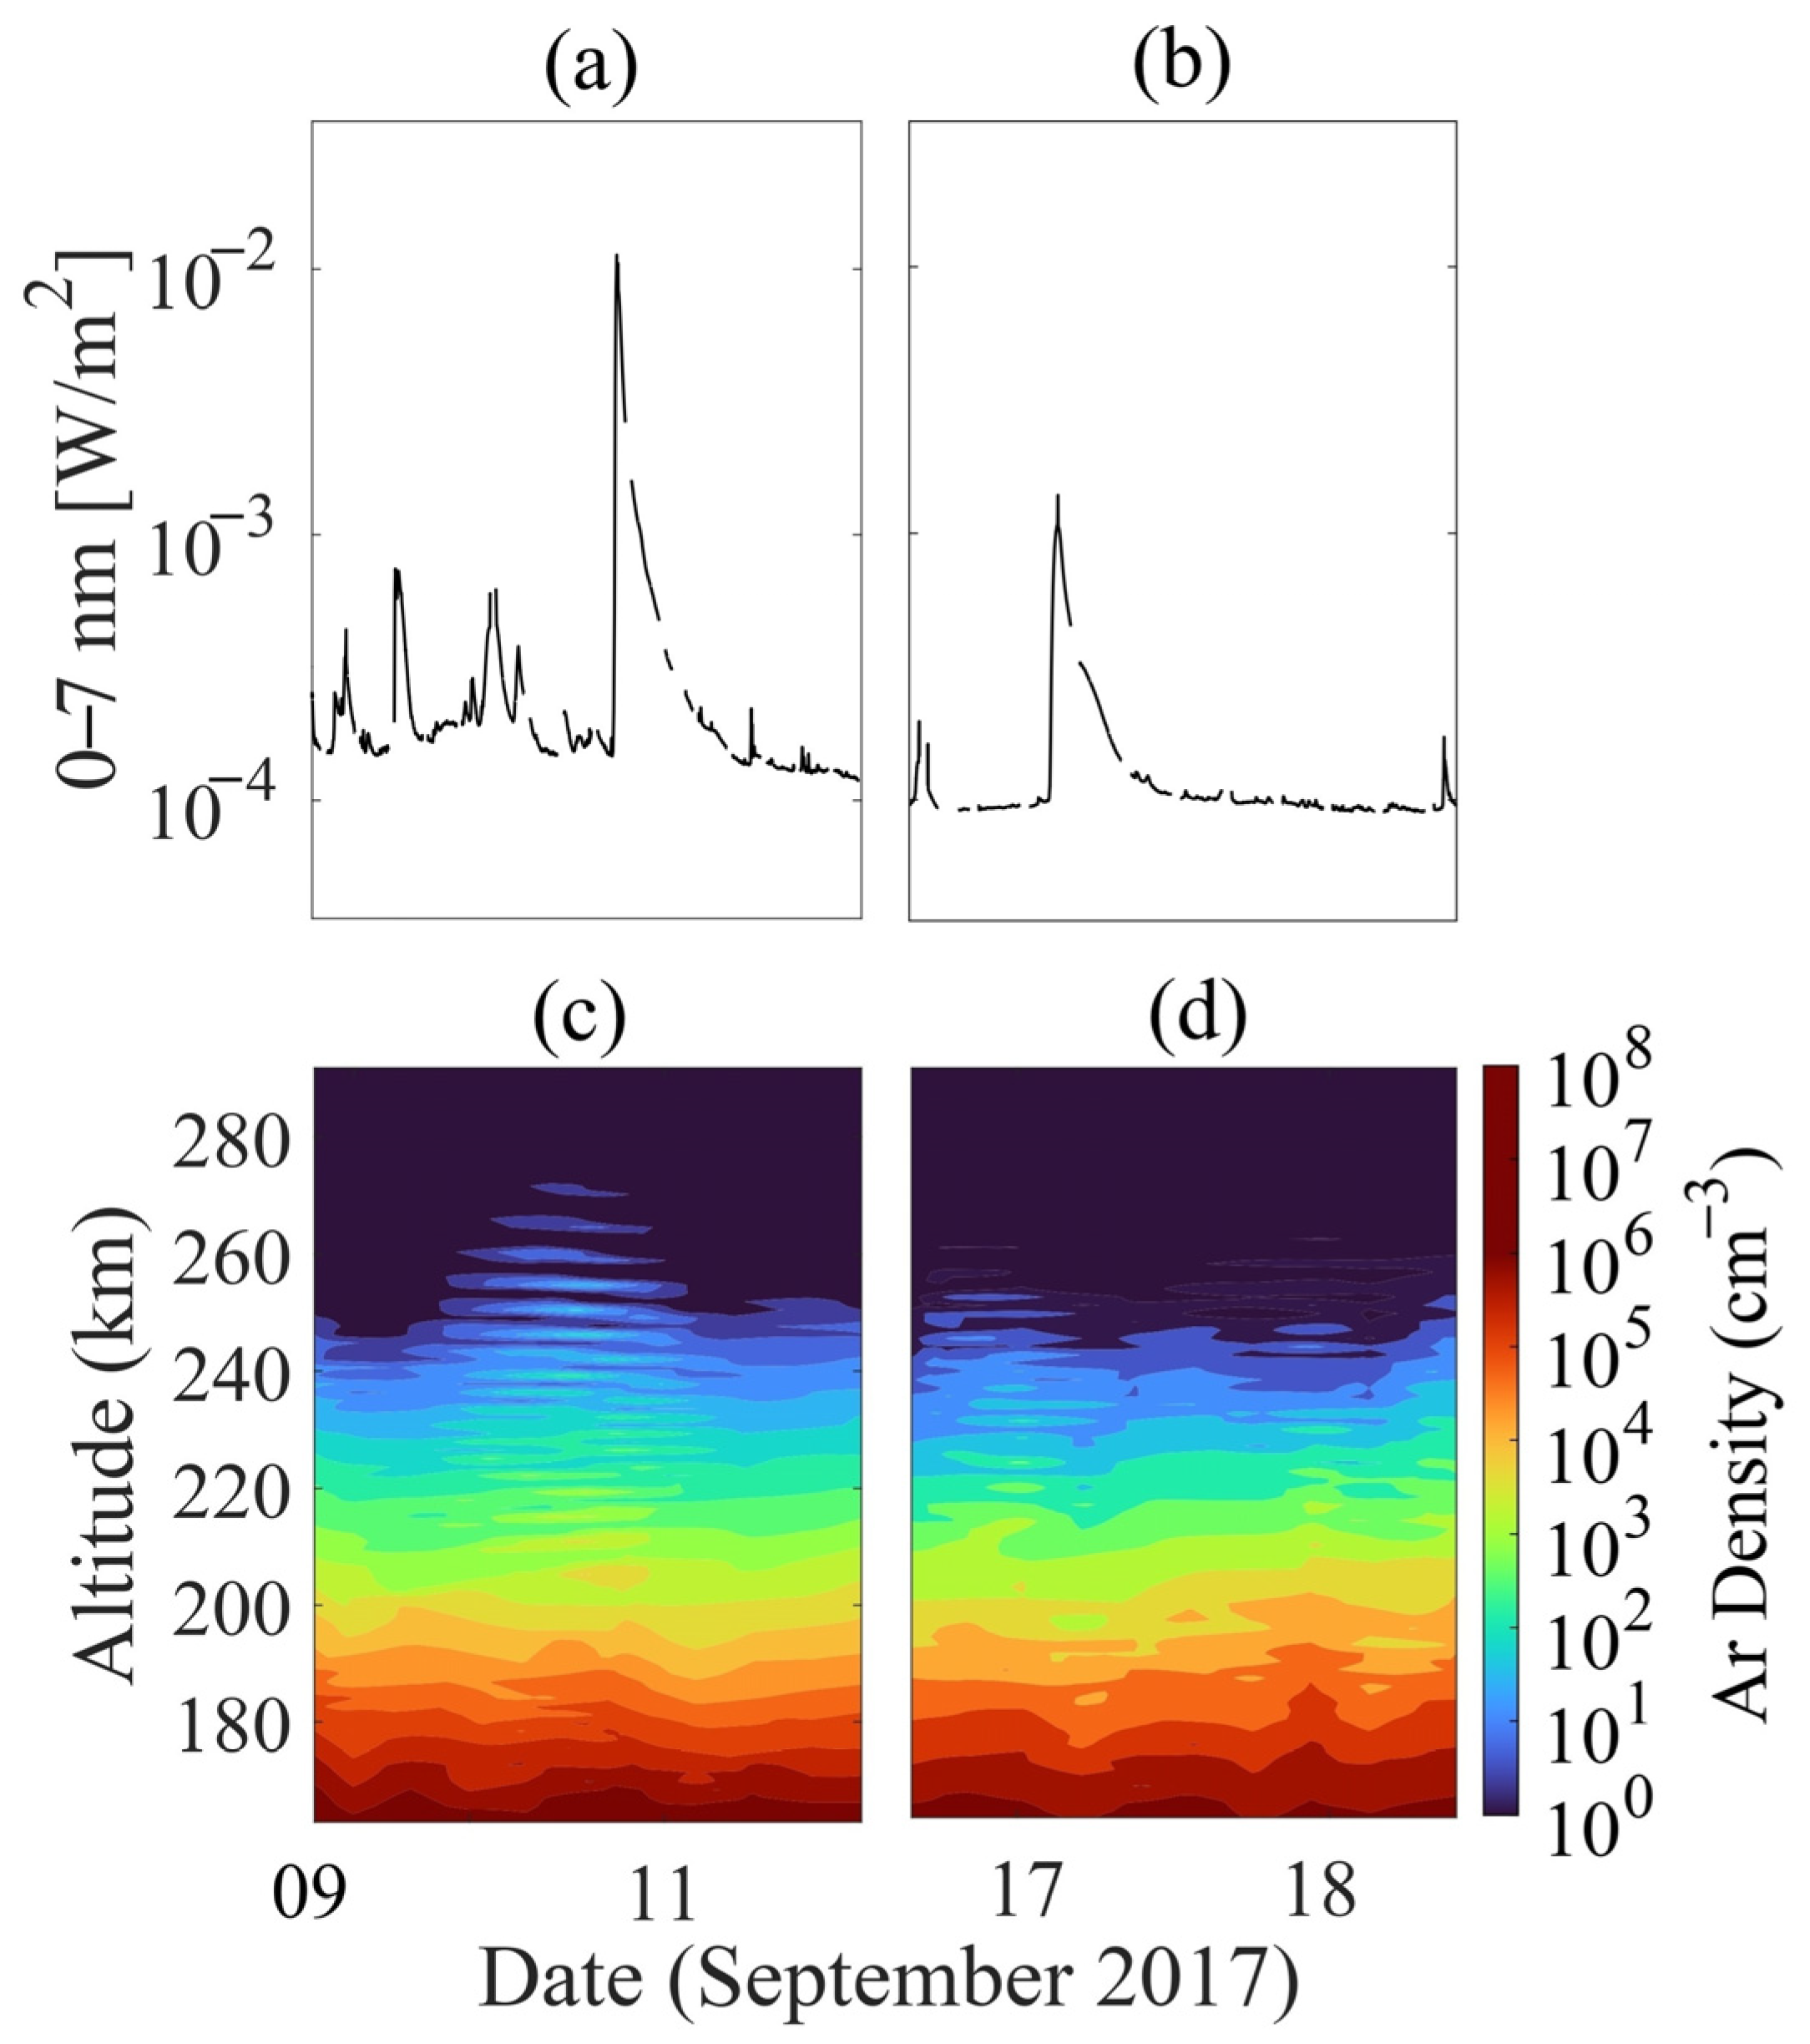
11]. The arrival of the EUV X-class flare peak and the relationship between atmospheric heating will be the main topics of this investigation. The time series (UTC) of the NGIMS Ar data as a function of altitude are shown in
Figure 1c (10 September) and
Figure 1d (17 September). The EUVM 0 to 7 nm irradiances are shown in
Figure 1a,b for the X 8.2 and M 6.0 flares, respectively. The flare’s arrival is marked by a peak in the neutral densities of Ar in
Figure 1c,d [
5].
3. Results
The MAVEN NGIMS data in
Table 1 shows that both the X8.2 flare (10 September 2017) [
5] and M6.0 flare (17 September 2017) caused different thermospheric reactions, with heating rates and density increases that varied with altitude. For Ar and N
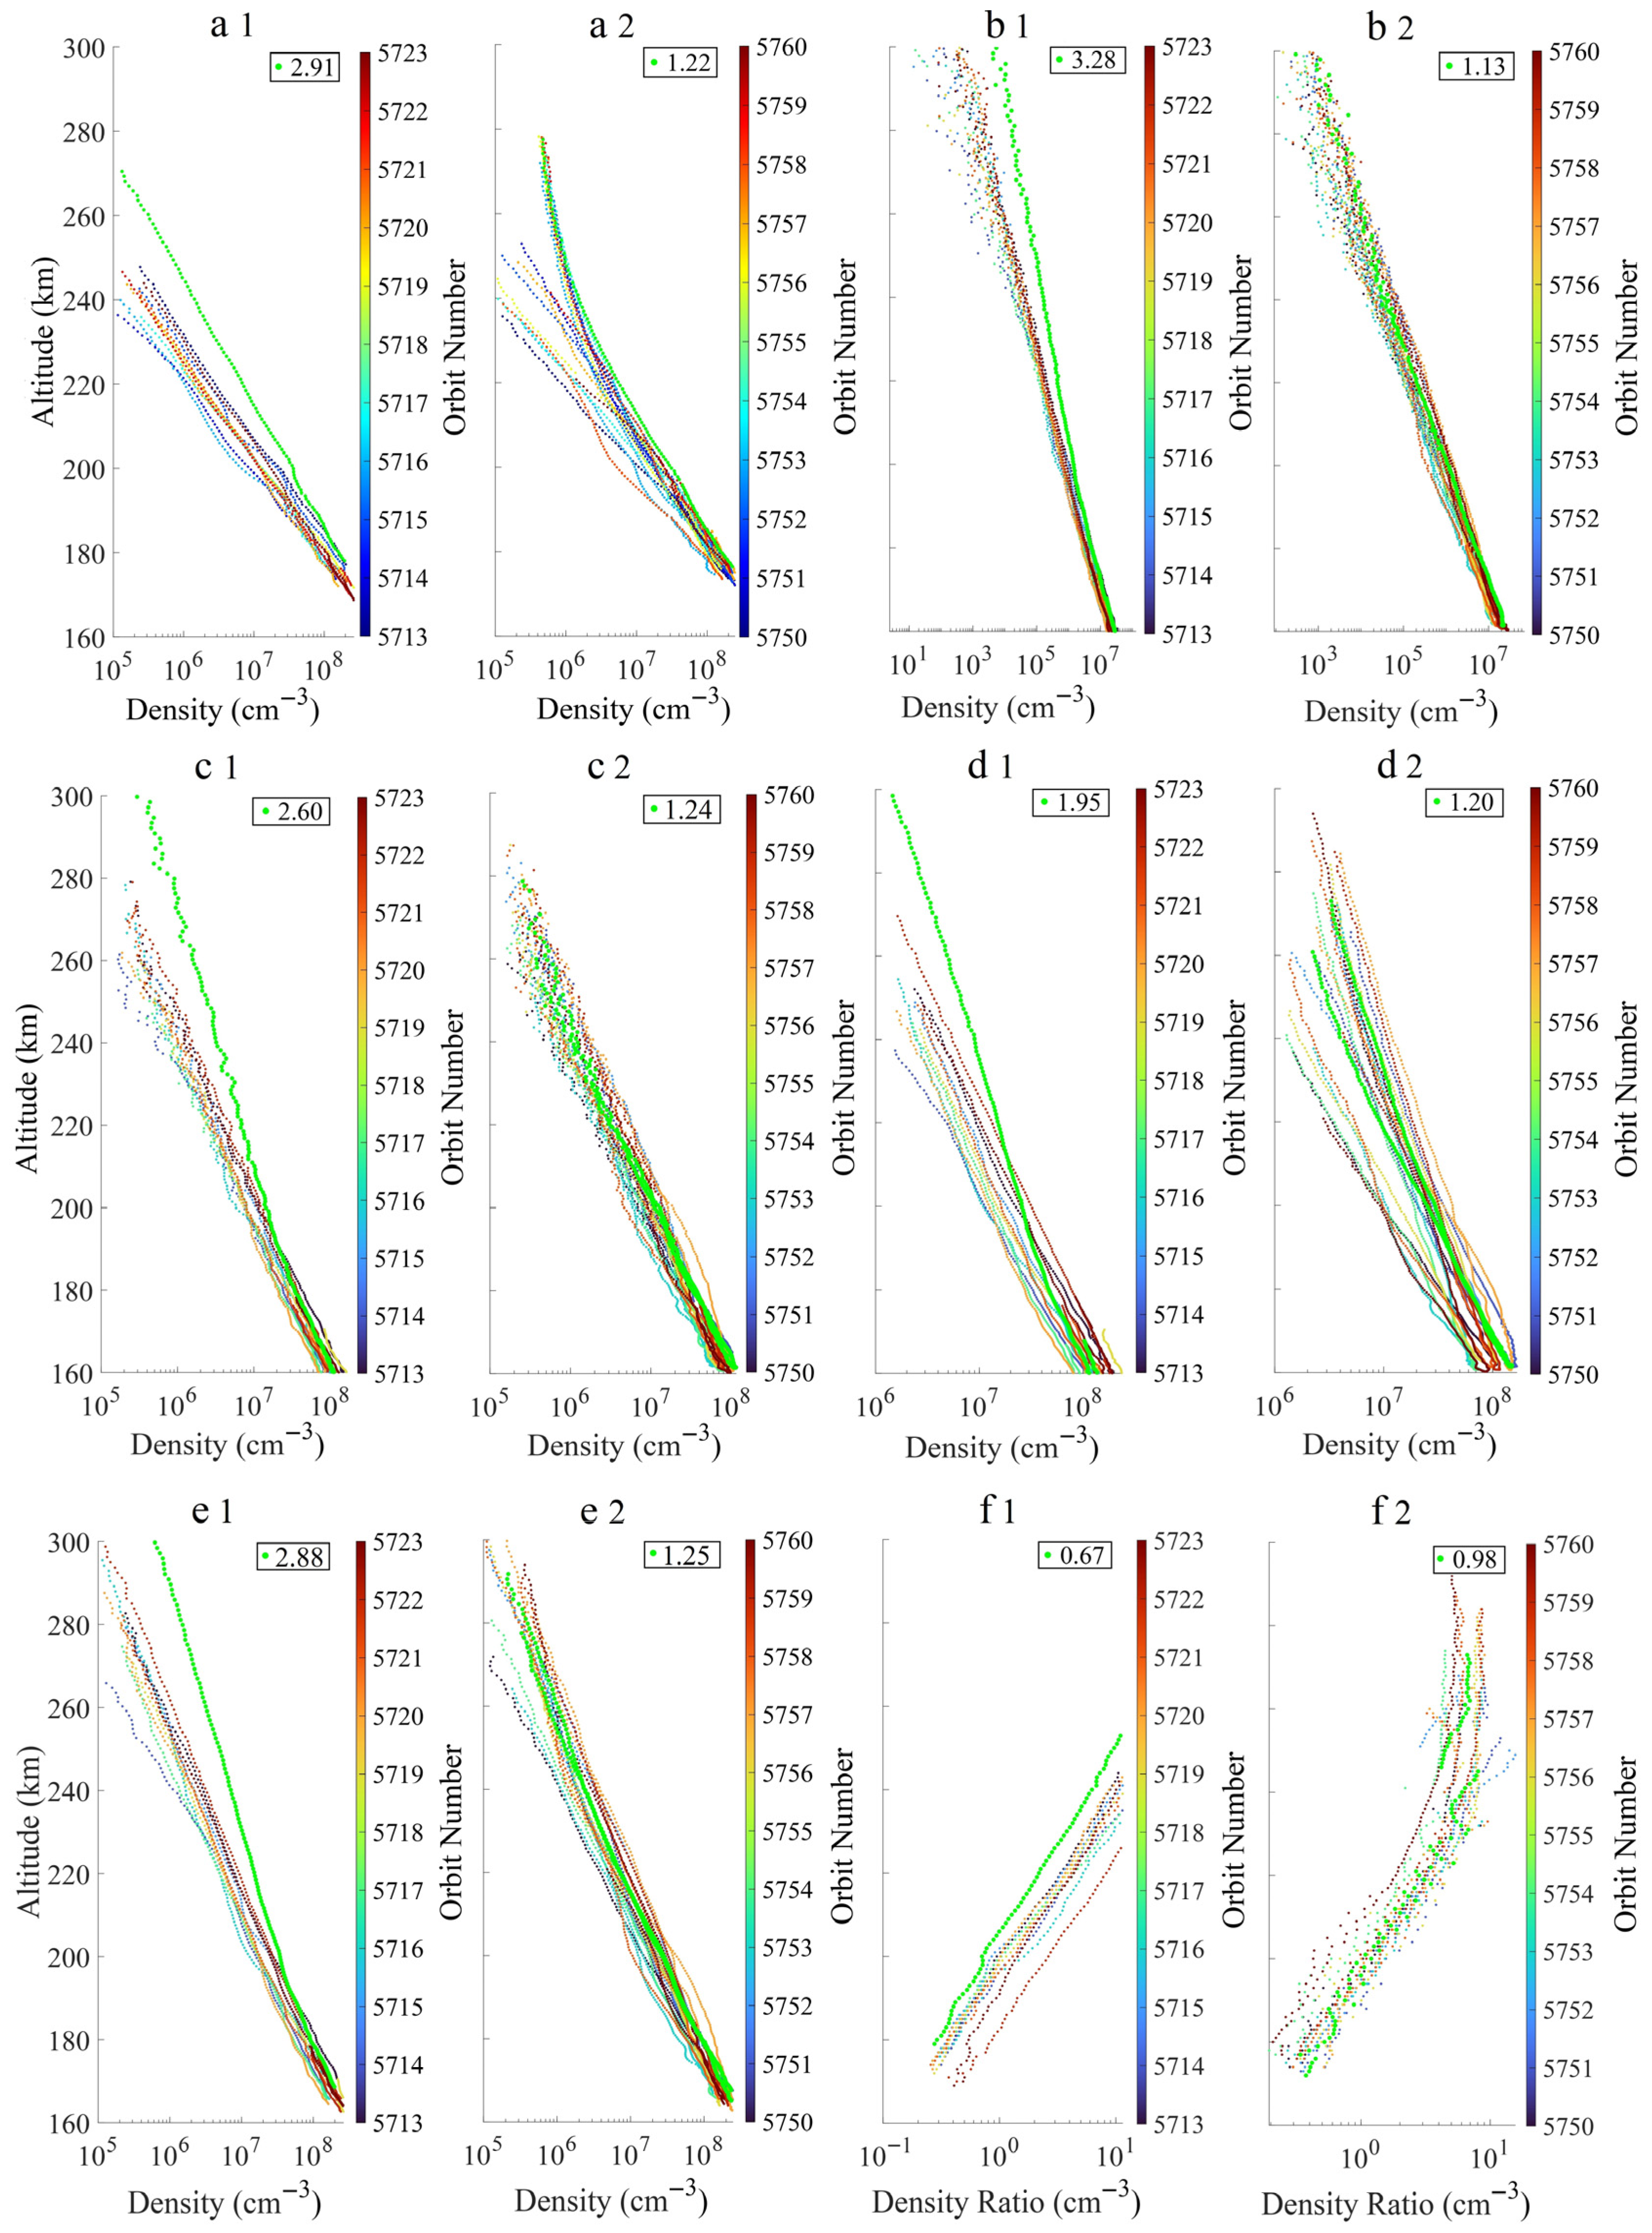
2, the X8.2 flare produced 3–5× density increases at exobase altitudes (200–260 km), whereas M6.0 produced 1.1–1.4× improvements, as shown in
Figure 2(b1,b2,c1,c2), respectively. During X8.2, CO
2, which was predominant below 200 km, showed a 1.79× density boost at 182–198 km, while for M6.0, it was 1.22×—see
Table 1. In
Figure 2(d1,d2), atomic oxygen (O), which is produced photochemically by CO
2 dissociation, increased 1.95× at 192–259 km during X8.2 but only 1.20× during M6.0 [
13]. A consequence of CO
2 photolysis, carbon monoxide (CO) showed the biggest difference, being 2.88× denser at 214–257 km during X8.2 compared to 1.25× for M6.0 as shown in
Table 1 and
Figure 2(e1,e2), due to increased vertical transport and EUV-driven dissociation [
5]. During severe flares, when decreased atmospheric density lessens collisional cooling, this altitude-dependent response indicates increased Extreme Ultraviolet Monitor (EUV) energy deposition at higher altitudes. Although inert species such as Ar displayed ΔT > 100 K during X8.2, CO
2’s strong 15 µm radiative cooling caused only modest temperature rises (ΔT = +40 K for X8.2, +19 K for M6.0) [
8].
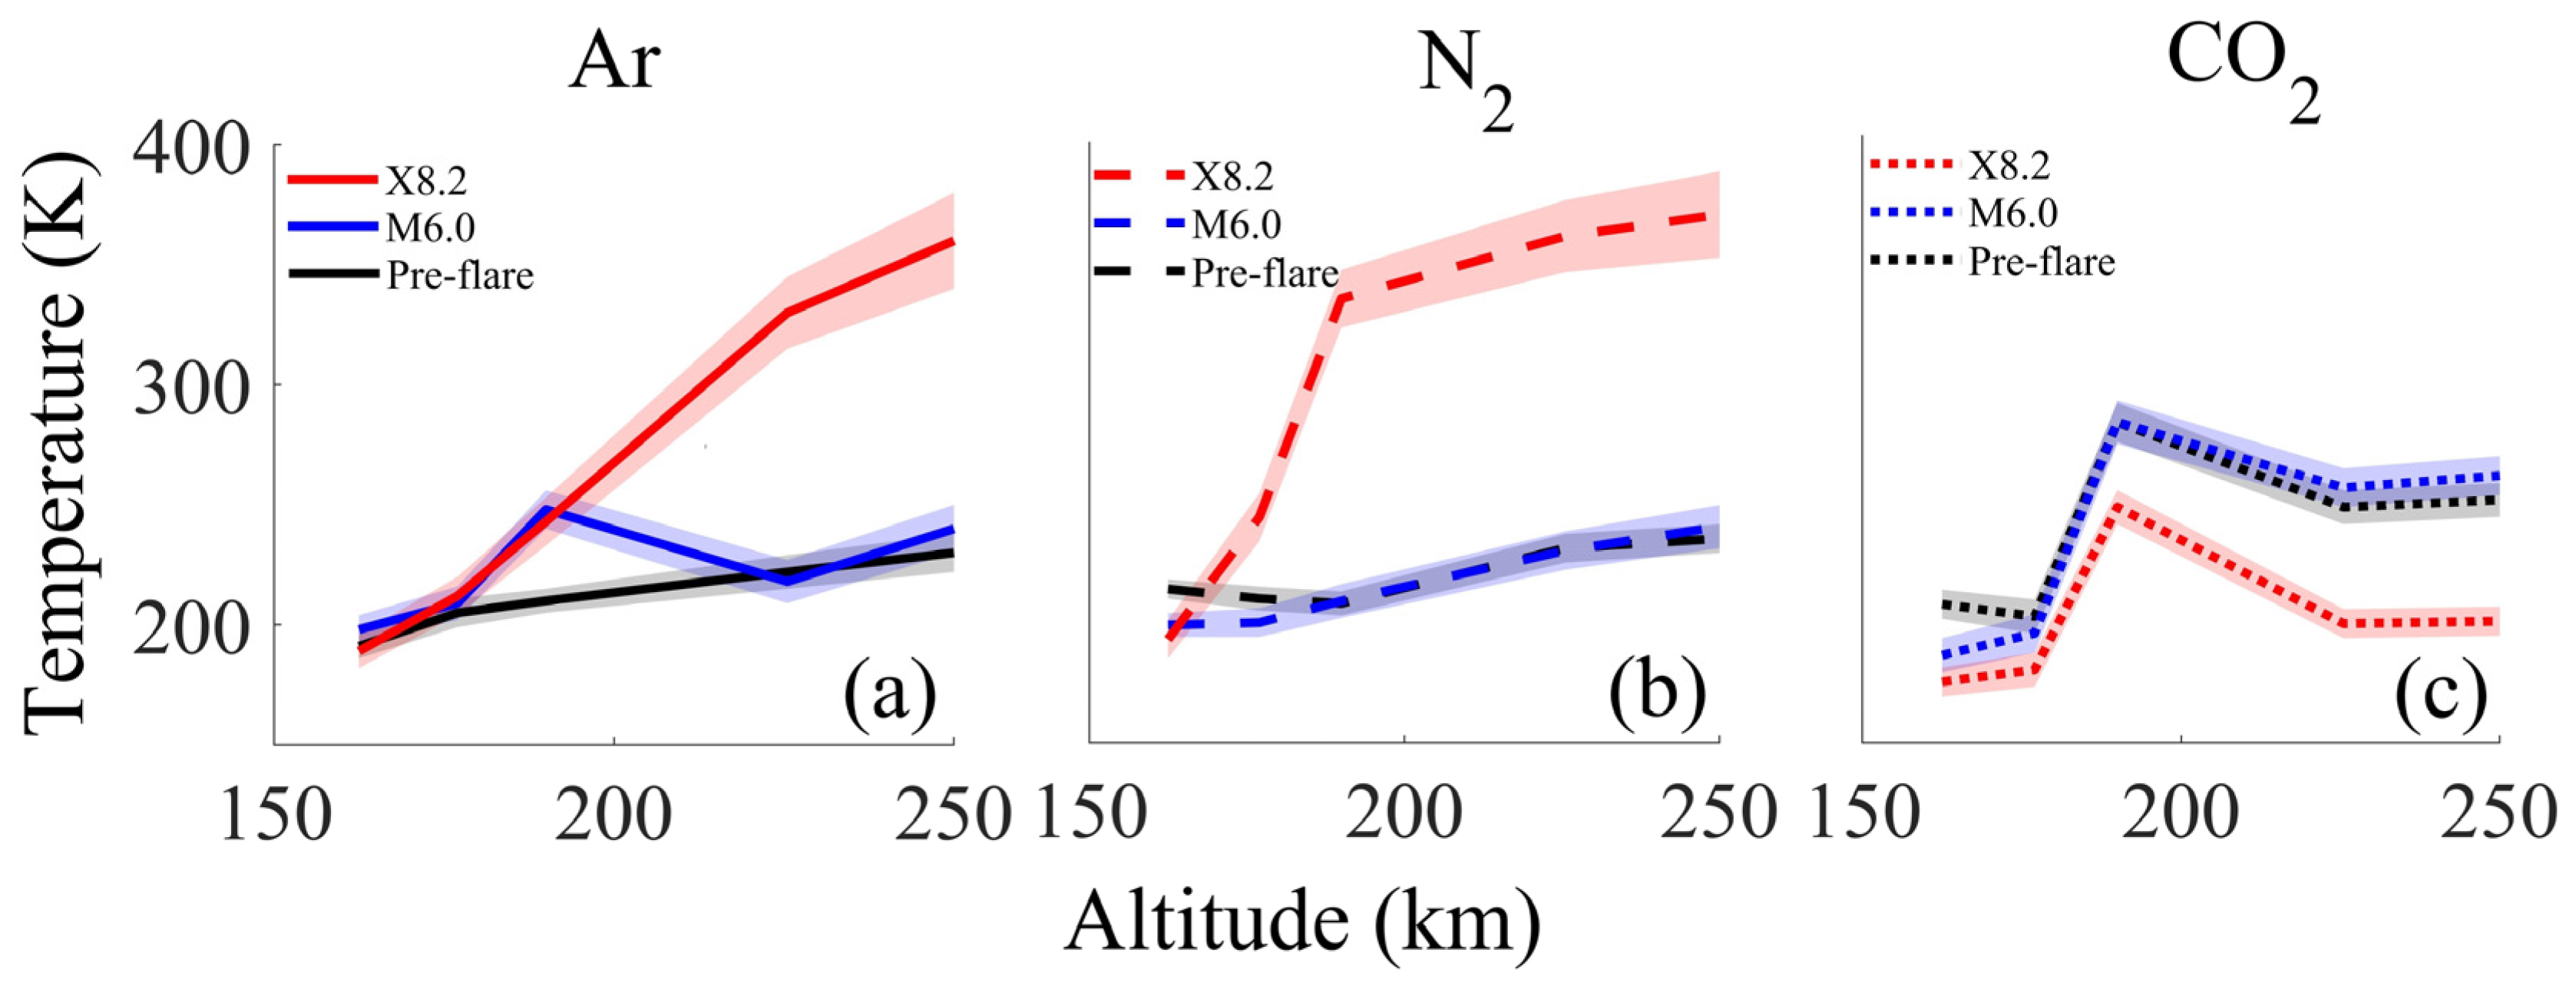
During the X8.2 flare, N
2 showed a major temperature rise (ΔT = +126 K at 193–211 km), as shown in
Figure 3b, which followed the altitude-dependent reaction pattern of Ar [
12]. During M6.0 at 192–259 km, O displayed a distinct response: its temperature decreased by 39 K despite a rise in density as seen in
Table 1, most likely as a result of post-flare radiative cooling surpassing photochemical heating [
2].
Figure 3c shows that CO exhibited modest heating (ΔT = +122 K for X8.2, +6 K for M6.0), and its density improvements were linked to CO
2 dissociation instead of direct EUV absorption. Since CO
2 concentrations increased more quickly at lower altitudes and O production lagged at higher altitudes, the O/CO
2 ratio showed the most obvious class-dependent difference, declining by 46% at 225 km during X8.2 compared to 15% for M6.0, as shown in
Figure 2(f1,f2). This demonstrates the way that intense flares intensify compositional gradients, causing the thermosphere’s mass and energy to be redistributed vertically.
All species showed flare-class dependent scale height (H) expansions, with the X8.2 flare causing noticeably greater increases than M6.0 in
Table 1. The most noticeable reaction was seen in argon (Ar), an inert tracer of thermal expansion; during X8.2, at 196–259 km, H rose by 36% (20.8 km vs. 15.3 km pre-flare), corresponding with a ΔT = +104 K, whereas M6.0 only produced a 6% H increase (16.2 km) and ΔT = +37 K as seen in
Figure 3a and
Table 1. This pattern was reflected in molecular nitrogen (N
2), where H expanded by 60% (26.8 km vs. 16.7 km) during X8.2 at 193–211 km (ΔT = +126 K), whereas M6.0 had a 9% increase (18.2 km) as shown in
Figure 3b and
Table 1. This discrepancy results from the preferential heating of lighter species, such as N
2, by flare-induced ionospheric currents during X8.2 [
12]. Despite being dominant below 200 km, as shown in
Figure 3c, carbon dioxide (CO
2) only demonstrated modest increases in height (19% during X8.2, 2% during M6.0, as seen in
Table 1) because of effective radiative cooling at 15 µm, which reduced temperature gains (ΔT = +40 K and +19 K, respectively) [
8]. Atomic oxygen (O), on the other hand, showed rare behavior; during X8.2, photochemical production from CO
2 dissociation concentrated O at higher altitudes, causing its height to steepen by 34% (25.4 km vs. 18.9 km pre-flare) despite a moderate ΔT = +94 K [
13]. However, during M6.0, O’s height rose by 4% (19.6 km) despite a 39 K decline in temperature in
Table 1, most likely as a result of vertical mixing that redistributed O higher in spite of cooling [
2].
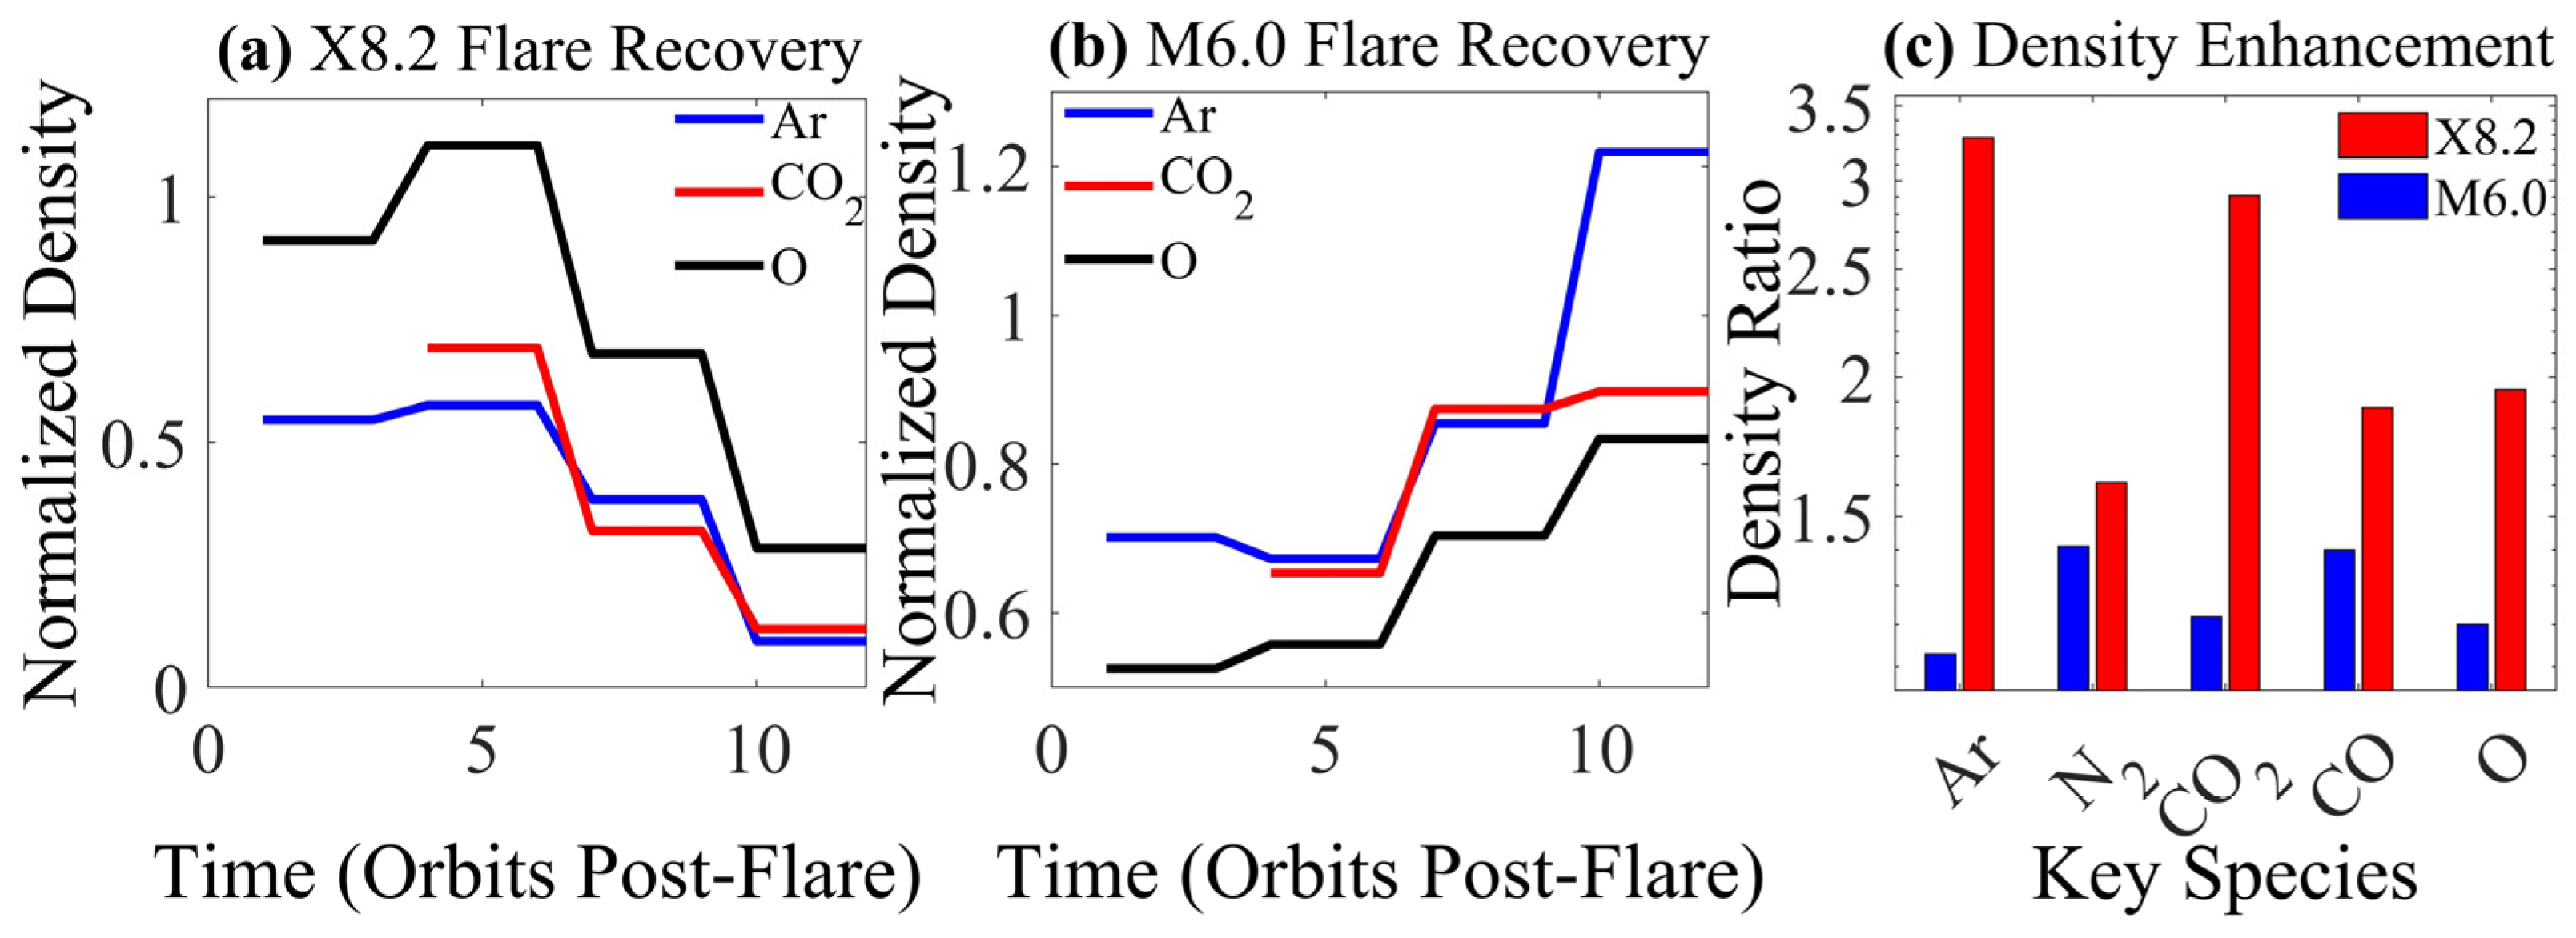
O densities normalized within around 8 orbits for M6.0, indicating that photochemical forcing lasted for a shorter period. In
Figure 4a,b, the recovery of carbon monoxide (CO), a byproduct of CO
2 dissociation, was intermediate. While M6.0’s CO stabilized in 4 orbits, post-X8.2 CO concentrations at 214–257 km dropped to near baseline within 7 orbits, which is consistent with its reliance on CO
2’s fast radiative cooling [
5].
Inert species (Ar, N
2), which lack effective cooling routes, exhibit extended thermal relaxation in contrast to CO
2’s quick recovery. Because of longer recombination durations and vertical transport delays, reactive species (O, CO) recover more slowly during X-class flares [
13]. While X8.2’s intense heating changed the composition and structure of the atmosphere for more than half a Martian day, which had consequences for long-term escape mechanisms, the M6.0 flare’s lesser energy deposition allowed all species to re-equilibrate more quickly [
2]. Even though the X8.2 flare had a 13× larger soft X-ray flux than M6.0, its effects were nonlinear in relation to its irradiance, producing 2.5× higher ΔT and 3× bigger Ar density improvements, as shown in
Figure 4c and
Table 1. Due to Mars’ poor atmospheric heat capacity, intense EUV fluxes heat the thermosphere more quickly than energy can be released, causing this saturation effect [
20]. This nonlinearity was best shown by carbon dioxide (CO
2), whose density rose 1.79× during X8.2 compared to 1.22× during M6.0 at 182–198 km.
However, because of fast radiative cooling at 15 µm, temperature increases were very small (ΔT = +40 K vs. +19 K) [
8]. Atomic oxygen (O) showed a counterintuitive temperature decline of 39 K during M6.0, despite a 1.95× density increase during X8.2 (compared to 1.20× for M6.0) at 192–259 km in
Table 1. This illustrates conflicting mechanisms: M6.0’s lesser forcing let radiative cooling predominate, but X8.2’s strong EUV flux pushed photochemical O generation and vertical transport [
13]. The biggest nonlinear response was seen by carbon monoxide (CO), a dissociation product of CO
2, whose concentrations increased 2.88× during X8.2 at 214–257 km as opposed to 1.25× during M6.0, with ΔT = +122 K vs. +6 K (
Table 1). This discrepancy emphasizes how CO is dependent on both thermal expansion and EUV-driven CO
2 dissociation, both of which are enhanced during intense flares [
5]. The greatest class difference in heating processes was seen in molecular nitrogen (N
2), whose density rose 1.61× during X8.2 (compared to 1.42× for M6.0) at 193–211 km, together with ΔT = +126 K vs. +19 K, as seen in
Table 1. Lighter species such as N
2 showed enhanced thermal sensitivity during the X8.2 flare, with temperature elevations (+126 K) far surpassing those of heavier species, reflecting class-dependent variations aligned with flare-induced energy deposition [
12]. The inert property of argon (Ar) isolated it from photochemical or ionospheric interactions, and it showed thermally driven expansion (ΔT = +104 K vs. +37 K), as seen in
Figure 3a. These findings point to a basic difference in inert species (Ar, N
2) scale with thermal energy deposition until atmospheric heat capacity limitations are met, whereas reactive species (CO, O) behave nonlinearly because of photochemical thresholds. The difficulty of forecasting flare consequences on weakly buffered atmospheres, such as Mars’, is highlighted by the discrepancy between irradiance and reaction.
4. Discussion
A basic understanding of thermospheric energy partitioning, photochemical processes, and atmospheric development during extreme space weather is provided by the observed class-dependent reactions of Mars’ upper atmosphere to X8.2 and M6.0 flares. Flare irradiance and thermospheric heating have a nonlinear connection, with X8.2 producing proportionally bigger impacts than its 13× higher soft X-ray flux over M6.0. This underscores the crucial importance of Mars’ limited atmospheric heat capacity. Ref. [
20] anticipated this saturation effect for poorly buffered atmospheres, which implies that strong X-class flares may produce near-maximal thermospheric heating with declining returns beyond irradiance thresholds. The two dominant processes are (1) thermal expansion for inert species (Ar, N
2) and (2) photochemical forcing for reactive species (CO
2, CO, O), as seen by the bifurcation in species-specific responses. Ar and N
2 showed flare-class-dependent heating that was directly related to EUV energy deposition because they lacked effective cooling routes. On the other hand, CO
2’s weak temperature response, even with notable density increases, confirms the regulating function of radiative cooling at 15 µm [
8]. This duality is further demonstrated by the rapid O/CO
2 ratio fall at constant altitudes, as shown in
Figure 2(f1,f2), where X-class flares amplify a vertical compositional gradient due to the lagging O generation at higher altitudes and the increased CO
2 levels at lower altitudes caused by EUV absorption.
Notably, the intense heating of N
2 during X8.2 (ΔT = +126 K) was much higher than that of the M6.0 flare (ΔT= +19 K), demonstrating a pronounced difference in thermospheric reactions to flare intensity. This class-dependent difference implies that X-class flares produce different energy deposition routes that enhance neutral heating in addition to direct EUV contributions, which sets them apart from smaller M-class occurrences. X-class flares seem to change thermospheric dynamics at a systemic level, possibly through greater ion–neutral interactions or unmeasured thermal pathways, whereas M-class flares mainly drive photochemical and radiative processes. Likewise, the extended increase in O densities after X8.2 suggests that intense flare photochemical products remain long after irradiance fades, which may affect nightside chemistry and escape mechanisms. The slow relaxation of Ar and O (>10 orbits of MAVEN satellite) contrasted with the quick recovery of CO
2 (1–2 orbits) highlights different cooling mechanisms. The radiative efficiency of CO
2 enables rapid energy dissipation, whereas atomic oxygen and inert species depend on slower thermal conduction and recombination, respectively. Because global circulation models (GCMs) frequently overlook the vertical movement of photochemical products like O and CO, this discrepancy may understate the short-term flare impacts on CO
2-dominated areas [
17]. Mars’ atmospheric escape history is further influenced by the striking differences between the impacts of M6.0 and X8.2. For light species (H, O), prolonged heating during X-class flares may improve Jeans escape, while sputtering by flare-energized ions may hasten the loss of heavy species (CO
2, N
2), processes that are crucial during the early Sun’s active phase [
2]. These days, X-class flares probably outnumber smaller, more common occurrences in terms of cumulative escape, albeit being less frequent.


