

Associations of Estimated Pulse Wave Velocity with Body Mass Index and Waist Circumference among General Korean Adults

 , ,
, ,
Abstract
:
1. Introduction
2. Methods
2.1. Study Population
2.2. Clinical Data
2.3. ePWV Calculation
2.4. Statistical Analysis
3. Results
4. Discussion
4.1. Association between Arterial Stiffness and Body Fat Parameters
4.2. BMI vs. WC
4.3. The Usefulness of ePWV
4.4. Mechanisms
4.5. Clinical Implications
4.6. Study Limitations
5. Conclusions
Author Contributions
Funding
Institutional Review Board Statement
Informed Consent Statement
Data Availability Statement
Conflicts of Interest
References
- Powell-Wiley, T.M.; Poirier, P.; Burke, L.E.; Després, J.P.; Gordon-Larsen, P.; Lavie, C.J.; Lear, S.A.; Ndumele, C.E.; Neeland, I.J.; Sanders, P.; et al. Obesity and Cardiovascular Disease: A Scientific Statement From the American Heart Association. Circulation 2021, 143, e984–e1010. [Google Scholar] [CrossRef] [PubMed]
- Lu, Y.; Hajifathalian, K.; Ezzati, M.; Woodward, M.; Rimm, E.B.; Danaei, G. Metabolic mediators of the effects of body-mass index, overweight, and obesity on coronary heart disease and stroke: A pooled analysis of 97 prospective cohorts with 1.8 million participants. Lancet 2014, 383, 970–983. [Google Scholar] [CrossRef] [PubMed]
- Jee, S.H.; Sull, J.W.; Park, J.; Lee, S.Y.; Ohrr, H.; Guallar, E.; Samet, J.M. Body-mass index and mortality in Korean men and women. N. Engl. J. Med. 2006, 355, 779–787. [Google Scholar] [CrossRef] [PubMed]
- Whitlock, G.; Lewington, S.; Sherliker, P.; Clarke, R.; Emberson, J.; Halsey, J.; Qizilbash, N.; Collins, R.; Peto, R. Body-mass index and cause-specific mortality in 900,000 adults: Collaborative analyses of 57 prospective studies. Lancet 2009, 373, 1083–1096. [Google Scholar] [CrossRef] [PubMed]
- Kim, B.Y.; Kang, S.M.; Kang, J.H.; Kang, S.Y.; Kim, K.K.; Kim, K.B.; Kim, B.; Kim, S.J.; Kim, Y.H.; Kim, J.H.; et al. 2020 Korean Society for the Study of Obesity Guidelines for the Management of Obesity in Korea. J. Obes. Metab. Syndr. 2021, 30, 81–92. [Google Scholar] [CrossRef]
- Després, J.-P. Visceral Obesity with Excess Ectopic Fat: A Prevalent and High-Risk Condition Requiring Concerted Clinical and Public Health Actions. Cardiometab. Syndr. J. 2021, 1, 1–17. [Google Scholar] [CrossRef]
- Ross, R.; Neeland, I.J.; Yamashita, S.; Shai, I.; Seidell, J.; Magni, P.; Santos, R.D.; Arsenault, B.; Cuevas, A.; Hu, F.B.; et al. Waist circumference as a vital sign in clinical practice: A Consensus Statement from the IAS and ICCR Working Group on Visceral Obesity. Nat. Rev. Endocrinol. 2020, 16, 177–189. [Google Scholar] [CrossRef]
- Bodenant, M.; Kuulasmaa, K.; Wagner, A.; Kee, F.; Palmieri, L.; Ferrario, M.M.; Montaye, M.; Amouyel, P.; Dallongeville, J. Measures of abdominal adiposity and the risk of stroke: The MOnica Risk, Genetics, Archiving and Monograph (MORGAM) study. Stroke 2011, 42, 2872–2877. [Google Scholar] [CrossRef]
- Lee, C.M.; Huxley, R.R.; Wildman, R.P.; Woodward, M. Indices of abdominal obesity are better discriminators of cardiovascular risk factors than BMI: A meta-analysis. J. Clin. Epidemiol. 2008, 61, 646–653. [Google Scholar] [CrossRef]
- Zhang, C.; Rexrode, K.M.; van Dam, R.M.; Li, T.Y.; Hu, F.B. Abdominal obesity and the risk of all-cause, cardiovascular, and cancer mortality: Sixteen years of follow-up in US women. Circulation 2008, 117, 1658–1667. [Google Scholar] [CrossRef]
- Teixeira, J.E.; Bragada, J.A.; Bragada, J.P.; Coelho, J.P.; Pinto, I.G.; Reis, L.P.; Fernandes, P.O.; Morais, J.E.; Magalhães, P.M. Structural Equation Modelling for Predicting the Relative Contribution of Each Component in the Metabolic Syndrome Status Change. Int. J. Environ. Res. Public Health 2022, 19, 3384. [Google Scholar] [CrossRef]
- Chirinos, J.A.; Segers, P.; Hughes, T.; Townsend, R. Large-Artery Stiffness in Health and Disease: JACC State-of-the-Art Review. J. Am. Coll. Cardiol. 2019, 74, 1237–1263. [Google Scholar] [CrossRef] [PubMed]
- Cavalcante, J.L.; Lima, J.A.; Redheuil, A.; Al-Mallah, M.H. Aortic stiffness: Current understanding and future directions. J. Am. Coll. Cardiol. 2011, 57, 1511–1522. [Google Scholar] [CrossRef]
- Vlachopoulos, C.; Aznaouridis, K.; Stefanadis, C. Prediction of cardiovascular events and all-cause mortality with arterial stiffness: A systematic review and meta-analysis. J. Am. Coll. Cardiol. 2010, 55, 1318–1327. [Google Scholar] [CrossRef]
- Ohkuma, T.; Ninomiya, T.; Tomiyama, H.; Kario, K.; Hoshide, S.; Kita, Y.; Inoguchi, T.; Maeda, Y.; Kohara, K.; Tabara, Y.; et al. Brachial-Ankle Pulse Wave Velocity and the Risk Prediction of Cardiovascular Disease: An Individual Participant Data Meta-Analysis. Hypertension 2017, 69, 1045–1052. [Google Scholar] [CrossRef] [PubMed]
- Weber, T. The Role of Arterial Stiffness and Central Hemodynamics in Heart Failure. Int. J. Heart Fail. 2020, 2, 209–230. [Google Scholar] [CrossRef] [PubMed]
- Kim, H.L.; Kim, S.H. Pulse Wave Velocity in Atherosclerosis. Front. Cardiovasc. Med. 2019, 6, 41. [Google Scholar] [CrossRef]
- Greve, S.V.; Blicher, M.K.; Kruger, R.; Sehestedt, T.; Gram-Kampmann, E.; Rasmussen, S.; Vishram, J.K.; Boutouyrie, P.; Laurent, S.; Olsen, M.H. Estimated carotid-femoral pulse wave velocity has similar predictive value as measured carotid-femoral pulse wave velocity. J. Hypertens. 2016, 34, 1279–1289. [Google Scholar] [CrossRef]
- Ji, C.; Gao, J.; Huang, Z.; Chen, S.; Wang, G.; Wu, S.; Jonas, J.B. Estimated pulse wave velocity and cardiovascular events in Chinese. Int. J. Cardiol. Hypertens. 2020, 7, 100063. [Google Scholar] [CrossRef]
- Vlachopoulos, C.; Terentes-Printzios, D.; Laurent, S.; Nilsson, P.M.; Protogerou, A.D.; Aznaouridis, K.; Xaplanteris, P.; Koutagiar, I.; Tomiyama, H.; Yamashina, A.; et al. Association of Estimated Pulse Wave Velocity with Survival: A Secondary Analysis of SPRINT. JAMA Netw. Open 2019, 2, e1912831. [Google Scholar] [CrossRef]
- Wu, L.D.; Chu, P.; Kong, C.H.; Shi, Y.; Zhu, M.H.; Xia, Y.Y.; Li, Z.; Zhang, J.X.; Chen, S.L. Estimated pulse wave velocity is associated with all-cause mortality and cardiovascular mortality among adults with diabetes. Front. Cardiovasc. Med. 2023, 10, 1157163. [Google Scholar] [CrossRef]
- Kim, B.S.; Lee, Y.; Park, J.K.; Lim, Y.H.; Shin, J.H. Association of the Estimated Pulse Wave Velocity with Cardio-Vascular Disease Outcomes among Men and Women Aged 40–69 Years in the Korean Population: An 18-Year Follow-Up Report on the Ansung-Ansan Cohort in the Korean Genome Environment Study. J. Pers. Med. 2022, 12, 1511. [Google Scholar] [CrossRef]
- Kim, H.L.; Lim, W.H.; Seo, J.B.; Kim, S.H.; Zo, J.H.; Kim, M.A. Association between Body Mass Index and Arterial Stiffness. Cardiometab. Syndr. J. 2022, 2, 49–57. [Google Scholar] [CrossRef]
- Rider, O.J.; Tayal, U.; Francis, J.M.; Ali, M.K.; Robinson, M.R.; Byrne, J.P.; Clarke, K.; Neubauer, S. The effect of obesity and weight loss on aortic pulse wave velocity as assessed by magnetic resonance imaging. Obesity 2010, 18, 2311–2316. [Google Scholar] [CrossRef]
- Ounis-Skali, N.; Bentley-Lewis, R.; Mitchell, G.F.; Solomon, S.; Seely, E.W. Central aortic pulsatile hemodynamics in obese premenopausal women. J. Am. Soc. Hypertens. 2007, 1, 341–346. [Google Scholar] [CrossRef]
- Heleniak, Z.; Illersperger, S.; Brakemeier, S.; Dębska-Ślizień, A.; Budde, K.; Halleck, F. Obesity, Fat Tissue Parameters, and Arterial Stiffness in Renal Transplant Recipients. Transplant. Proc. 2020, 52, 2341–2346. [Google Scholar] [CrossRef] [PubMed]
- Rodrigues, S.L.; Baldo, M.P.; Lani, L.; Nogueira, L.; Mill, J.G.; Sa Cunha, R. Body mass index is not independently associated with increased aortic stiffness in a Brazilian population. Am. J. Hypertens. 2012, 25, 1064–1069. [Google Scholar] [CrossRef] [PubMed]
- Strasser, B.; Arvandi, M.; Pasha, E.P.; Haley, A.P.; Stanforth, P.; Tanaka, H. Abdominal obesity is associated with arterial stiffness in middle-aged adults. Nutr. Metab. Cardiovasc. Dis. 2015, 25, 495–502. [Google Scholar] [CrossRef] [PubMed]
- Tang, B.; Luo, F.; Zhao, J.; Ma, J.; Tan, I.; Butlin, M.; Avolio, A.; Zuo, J. Relationship between body mass index and arterial stiffness in a health assessment Chinese population. Medicine 2020, 99, e18793. [Google Scholar] [CrossRef]
- Wildman, R.P.; Mackey, R.H.; Bostom, A.; Thompson, T.; Sutton-Tyrrell, K. Measures of obesity are associated with vascular stiffness in young and older adults. Hypertension 2003, 42, 468–473. [Google Scholar] [CrossRef]
- Kim, H.L.; Ahn, D.W.; Kim, S.H.; Lee, D.S.; Yoon, S.H.; Zo, J.H.; Kim, M.A.; Jeong, J.B. Association between body fat parameters and arterial stiffness. Sci. Rep. 2021, 11, 20536. [Google Scholar] [CrossRef] [PubMed]
- Choi, H.S.; Cho, Y.H.; Lee, S.Y.; Park, E.J.; Kim, Y.J.; Lee, J.G.; Yi, Y.H.; Tak, Y.J.; Hwang, H.R.; Lee, S.H. Association between new anthropometric parameters and arterial stiffness based on brachial-ankle pulse wave velocity. Diabetes Metab. Syndr. Obes. 2019, 12, 1727–1733. [Google Scholar] [CrossRef] [PubMed]
- Zhang, J.; Fang, L.; Qiu, L.; Huang, L.; Zhu, W.; Yu, Y. Comparison of the ability to identify arterial stiffness between two new anthropometric indices and classical obesity indices in Chinese adults. Atherosclerosis 2017, 263, 263–271. [Google Scholar] [CrossRef]
- Einstadter, D.; Bolen, S.D.; Misak, J.E.; Bar-Shain, D.S.; Cebul, R.D. Association of Repeated Measurements with Blood Pressure Control in Primary Care. JAMA Intern. Med. 2018, 178, 858–860. [Google Scholar] [CrossRef]
- Williams, B.; Mancia, G.; Spiering, W.; Agabiti Rosei, E.; Azizi, M.; Burnier, M.; Clement, D.L.; Coca, A.; de Simone, G.; Dominiczak, A.; et al. 2018 ESC/ESH Guidelines for the management of arterial hypertension. Eur. Heart J. 2018, 39, 3021–3104. [Google Scholar] [CrossRef]
- O’Brien, E.; Petrie, J.; Littler, W.; de Swiet, M.; Padfield, P.L.; Altman, D.G.; Bland, M.; Coats, A.; Atkins, N. An outline of the revised British Hypertension Society protocol for the evaluation of blood pressure measuring devices. J. Hypertens. 1993, 11, 677–679. [Google Scholar] [CrossRef] [PubMed]
- Marcoulides, K.M.; Raykov, T. Evaluation of Variance Inflation Factors in Regression Models Using Latent Variable Modeling Methods. Educ. Psychol. Meas. 2019, 79, 874–882. [Google Scholar] [CrossRef] [PubMed]
- Nattino, G.; Pennell, M.L.; Lemeshow, S. Assessing the goodness of fit of logistic regression models in large samples: A modification of the Hosmer-Lemeshow test. Biometrics 2020, 76, 549–560. [Google Scholar] [CrossRef] [PubMed]
- Nevill, A.M.; Stewart, A.D.; Olds, T.; Holder, R. Relationship between adiposity and body size reveals limitations of BMI. Am. J. Phys. Anthropol. 2006, 129, 151–156. [Google Scholar] [CrossRef] [PubMed]
- Heymsfield, S.B.; Scherzer, R.; Pietrobelli, A.; Lewis, C.E.; Grunfeld, C. Body mass index as a phenotypic expression of adiposity: Quantitative contribution of muscularity in a population-based sample. Int. J. Obes. 2009, 33, 1363–1373. [Google Scholar] [CrossRef]
- Laurent, S.; Cockcroft, J.; Van Bortel, L.; Boutouyrie, P.; Giannattasio, C.; Hayoz, D.; Pannier, B.; Vlachopoulos, C.; Wilkinson, I.; Struijker-Boudier, H. Expert consensus document on arterial stiffness: Methodological issues and clinical applications. Eur. Heart J. 2006, 27, 2588–2605. [Google Scholar] [CrossRef]
- Caballero, A.E. Endothelial dysfunction in obesity and insulin resistance: A road to diabetes and heart disease. Obes. Res. 2003, 11, 1278–1289. [Google Scholar] [CrossRef] [PubMed]
- Kahn, S.E.; Hull, R.L.; Utzschneider, K.M. Mechanisms linking obesity to insulin resistance and type 2 diabetes. Nature 2006, 444, 840–846. [Google Scholar] [CrossRef] [PubMed]
- Fantin, F.; Di Francesco, V.; Rossi, A.; Giuliano, K.; Marino, F.; Cazzadori, M.; Gozzoli, M.P.; Vivian, M.E.; Bosello, O.; Rajkumar, C.; et al. Abdominal obesity and subclinical vascular damage in the elderly. J. Hypertens. 2010, 28, 333–339. [Google Scholar] [CrossRef]
- Cheng, K.H.; Chu, C.S.; Lee, K.T.; Lin, T.H.; Hsieh, C.C.; Chiu, C.C.; Voon, W.C.; Sheu, S.H.; Lai, W.T. Adipocytokines and proinflammatory mediators from abdominal and epicardial adipose tissue in patients with coronary artery disease. Int. J. Obes. 2008, 32, 268–274. [Google Scholar] [CrossRef]
- Engeli, S.; Schling, P.; Gorzelniak, K.; Boschmann, M.; Janke, J.; Ailhaud, G.; Teboul, M.; Massiéra, F.; Sharma, A.M. The adipose-tissue renin-angiotensin-aldosterone system: Role in the metabolic syndrome? Int. J. Biochem. Cell Biol. 2003, 35, 807–825. [Google Scholar] [CrossRef] [PubMed]

| Characteristic | Value (n = 14,228) |
|---|---|
| Age, years | 53.4 ± 16.8 |
| Height, cm | 163 ± 9 |
| Weight, kg | 64.3 ± 12.8 |
| Body mass index, kg/m2 | 24.0 ± 3.6 |
| Waist circumference, cm | 84.2 ± 10.4 |
| Systolic blood pressure, mmHg | 119 ± 16 |
| Diastolic blood pressure, mmHg | 74.8 ± 9.8 |
| ePWV, m/s | 8.87 ± 2.27 |
| Cardiovascular risk factors | |
| Hypertension | 3867 (27.1) |
| Diabetes mellitus | 1612 (11.3) |
| Dyslipidemia | 3320 (22.6) |
| Cigarette smoking | 2243 (15.7) |
| Previous myocardial infarction | 181 (1.3) |
| Previous stroke | 343 (2.3) |
| Laboratory findings | |
| White blood cell count, per µL | 6130 ± 1720 |
| Hemoglobin, g/dL | 13.8 ± 1.5 |
| Glomerular filtration rate, mL/min/1.73 m2 | 90.9 ± 19.2 |
| Fasting glucose, mg/dL | 102 ± 23 |
| Glycated hemoglobin, % | 5.83 ± 0.83 |
| Uric acid, mg/dL | 5.13 ± 1.38 |
| Total cholesterol, mg/dL | 190 ± 38 |
| Low-density lipoprotein cholesterol, mg/dL | 114 ± 36 |
| High-density lipoprotein cholesterol, mg/dL | 52.1 ± 12.7 |
| Triglyceride, mg/dL | 128 ± 97 |
| Medications | |
| Anti-hypertensives | 3554 (24.9) |
| Anti-diabetics | 1057 (10.5) |
| Anti-dyslipidemics | 2460 (17.2) |
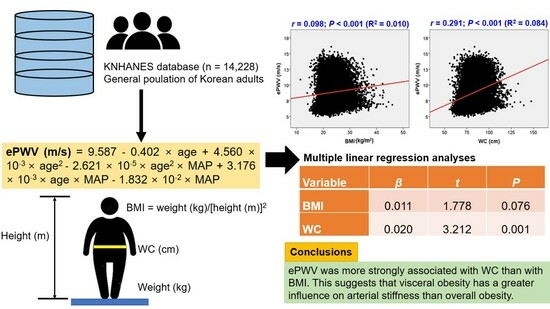
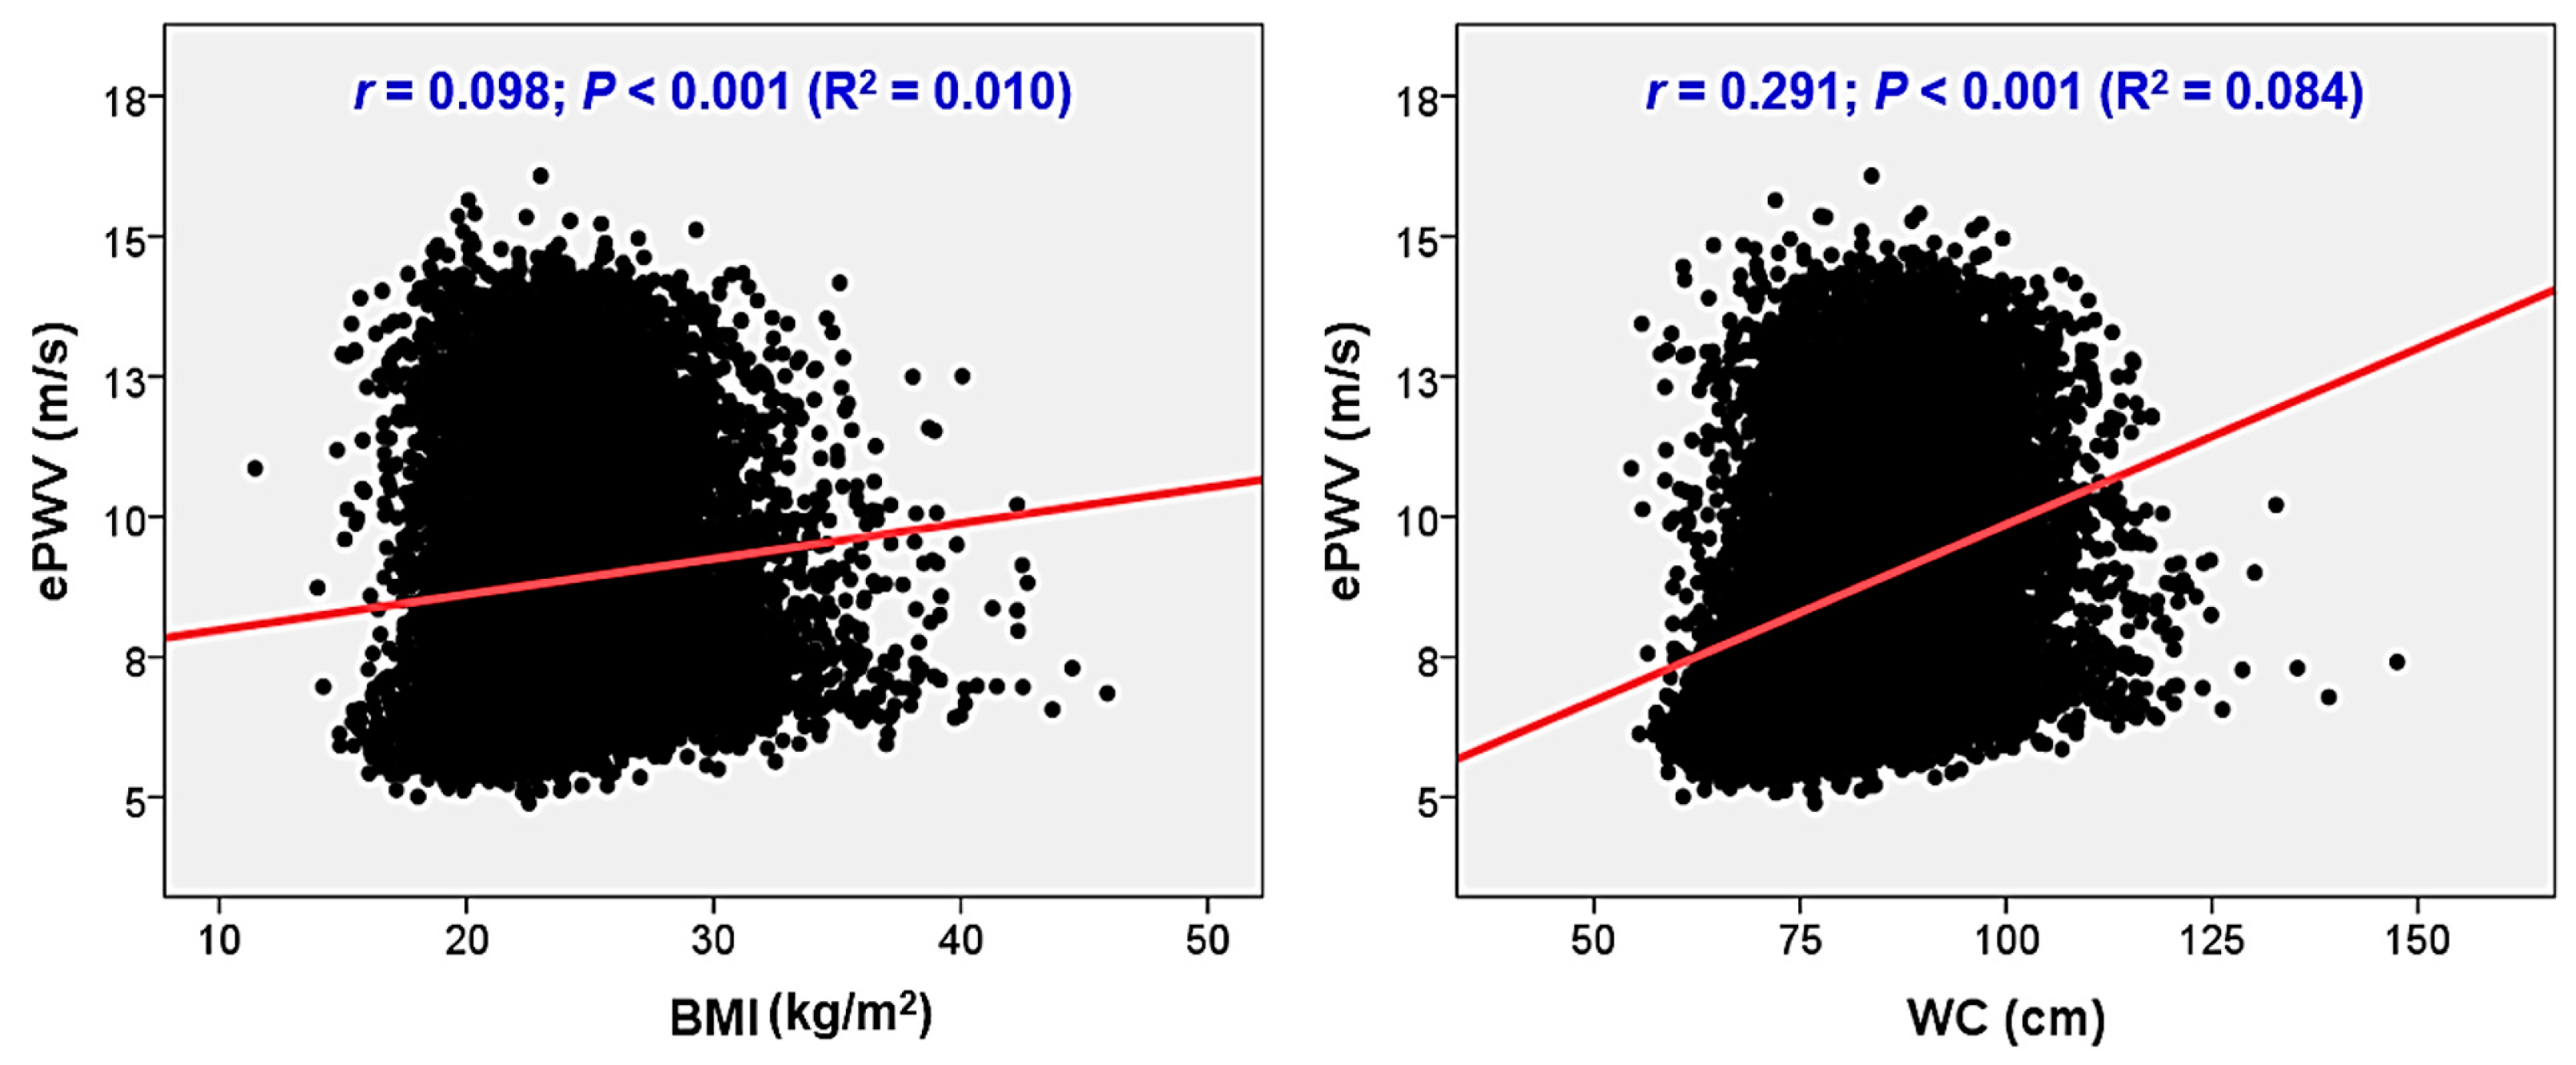
| Variable | β | t | p |
|---|---|---|---|
| BMI | 0.011 | 1.778 | 0.076 |
| WC | 0.020 | 3.212 | 0.001 |
| Variable | OR (95% CI) | p |
|---|---|---|
| BMI | ||
| The lowest tertile (11.4~22.3 kg/m2) | 1 | - |
| The middle tertile (22.4~25.2 kg/m2) | 1.38 (1.19–1.60) | <0.001 |
| The highest tertile (25.3~45.9 kg/m2) | 2.00 (1.70–2.34) | <0.001 |
| WC | ||
| The lowest tertile (54.5~79.4 cm) | 1 | - |
| The middle tertile (79.5~88.7 cm) | 1.77 (1.52–2.05) | <0.001 |
| The highest tertile (88.8~147.5 cm) | 2.76 (2.33–3.26) | <0.001 |
Disclaimer/Publisher’s Note: The statements, opinions and data contained in all publications are solely those of the individual author(s) and contributor(s) and not of MDPI and/or the editor(s). MDPI and/or the editor(s) disclaim responsibility for any injury to people or property resulting from any ideas, methods, instructions or products referred to in the content. |
© 2023 by the authors. Licensee MDPI, Basel, Switzerland. This article is an open access article distributed under the terms and conditions of the Creative Commons Attribution (CC BY) license (https://creativecommons.org/licenses/by/4.0/).
Share and Cite
Kim, H.-L.; Joh, H.S.; Lim, W.-H.; Seo, J.-B.; Kim, S.-H.; Zo, J.-H.; Kim, M.-A. Associations of Estimated Pulse Wave Velocity with Body Mass Index and Waist Circumference among General Korean Adults. Metabolites 2023, 13, 1082. https://doi.org/10.3390/metabo13101082
Kim H-L, Joh HS, Lim W-H, Seo J-B, Kim S-H, Zo J-H, Kim M-A. Associations of Estimated Pulse Wave Velocity with Body Mass Index and Waist Circumference among General Korean Adults. Metabolites. 2023; 13(10):1082. https://doi.org/10.3390/metabo13101082
Chicago/Turabian StyleKim, Hack-Lyoung, Hyun Sung Joh, Woo-Hyun Lim, Jae-Bin Seo, Sang-Hyun Kim, Joo-Hee Zo, and Myung-A Kim. 2023. "Associations of Estimated Pulse Wave Velocity with Body Mass Index and Waist Circumference among General Korean Adults" Metabolites 13, no. 10: 1082. https://doi.org/10.3390/metabo13101082
APA StyleKim, H.-L., Joh, H. S., Lim, W.-H., Seo, J.-B., Kim, S.-H., Zo, J.-H., & Kim, M.-A. (2023). Associations of Estimated Pulse Wave Velocity with Body Mass Index and Waist Circumference among General Korean Adults. Metabolites, 13(10), 1082. https://doi.org/10.3390/metabo13101082