Abstract
In these times of precision and personalized medicine, profiling patients to identify their needs is crucial to providing the best and most cost-effective treatment. In this study, we used urine metabolomics to explore the characterization of older adults with hip fractures and to explore the forecasting of patient outcomes. Overnight urine specimens were collected from 33 patients (mean age 80 ± 8 years) after hip fracture surgery during their stay at a rehabilitation hospital. The specimens were analyzed with 1H NMR spectroscopy. We performed a metabolomics study regarding assessments of frailty status, Functional Independence Measure (FIM), and Short Physical Performance Battery (SPPB). The main metabolic variations concerned 10 identified metabolites: paracetamol derivatives (4 peaks: 2.15 ppm; 2.16 ppm; 7.13 ppm and 7.15 ppm); hippuric acid; acetate; acetone; dimethylamine; glycine; alanine; lactate; valine; TMAO. At baseline, the urinary levels of these metabolites were significantly higher (i) in frail compared with non-frail patients, (ii) in persons with poorer FIM scores, and (iii) in persons with poorer compared SPPB scores. Our findings suggested that patients with increased levels of urine metabolites associated with metabolic, inflammatory, and renal disorders presented clear signs of frailty, impaired functional independence, and poor physical performance. Metabolomics could be a valuable tool to further characterize older adults, especially after major medical events.
1. Introduction
Providing the best available and most cost-effective interventions is a key issue in the context of the prevention, treatment, and rehabilitation of diseases. In these times of precision and personalized medicine, patient profiling to identify specific needs is crucial. Thus, interventions can be tailored to target specific outcomes according to the individual capacities or even to the individual abilities to be improved. Clearly, it is not a simple task to phenotype persons according to their level of functioning and their capacity to improve. Nevertheless, personalized interventions designed for disabled older adults with specific capacities could theoretically enable them to efficiently improve autonomy and functioning.
In the context of aging, characterizing older persons according to signs of frailty has gained importance during the last 20 years. For instance, the assessment of frailty using valid instruments (e.g., Fried’s frailty phenotype criteria) [1] has allowed health care professionals to evaluate patients’ risk factors before a loss of autonomy. Therefore, it could be possible to plan a tailored intervention against risk factors, such as biological, psychological, behavioral, social, and environmental factors, to provide improvements in motor skills, cognitive functions, and autonomy [2,3]. Nevertheless, the characterization of frailty is usually binary (yes/no; high risk/low risk) and does not reflect the complexity and the dynamic nature of frailty. During frailty development, subclinical signs emerge, but they are difficult to detect. However, these subclinical signs can quickly develop into clear signs when a dramatic event occurs (e.g., falls, infections), reflecting the vulnerability and decreasing resources of the older person. Metabolic abnormalities after a fall can predict short-term mortality in older patients [4]. Therefore, it would be of great importance to detect early signs of metabolic dysregulation associated with frailty [5]. Hip fracture surgery in older adults offers a model to investigate metabolic dysregulation. Osteoporotic hip fractures are a major public health problem because of their adverse effects such as substantial disability and increased mortality risk. In the United States, a quarter of a million hip fractures cost more than 8 billion dollars each year, for acute medical care and nursing home services. Future costs will be even higher as hip fracture incidence rates increase worldwide: by the year of 2050, there will be more than 4.5 million hip fractures [6]. Hip fracture treatment is expensive (cost estimation per year in Europe: 16 billion euros) [7] and rehabilitation is not always successful. Effective prevention of falls may alleviate the enormous social burden of hip fractures. Thus, metabolomic analysis could be applied to investigate metabolic profiles in older persons and to identify underlying health problems associated with frailty or age-related diseases. Previous studies have shown that the presence of some serum metabolites or dysregulated molecules in preoperative hip fracture patients is associated with complications during the postoperative period [8,9,10].
Modern technologies combined with big data management, such as metabolomics, provide new possibilities for investigating changes in metabolic states during aging and age-associated diseases or disability [11,12,13]. Such technologies could contribute to the identification of biomarkers or metabolites related to human aging and frailty development [11,12,13,14]. Targeted metabolomics analysis using 1H nuclear magnetic resonance (1H NMR) spectroscopy also provides a comprehensive analysis of metabolite profiles and furnishes key information for the further understanding of related metabolic pathways and their changes during aging and frailty processes. 1H NMR spectroscopy is sometimes considered a not very sensitive method but it is a robust and reproducible one compared to other techniques such as gas or liquid chromatography combined with mass spectrometry. Furthermore, the NMR technique does not require any sample preparation (except pH adjustment) [15,16].
In this study, urine metabolomics with 1H NMR spectroscopy was used to investigate the characterization of patients with hip fractures who underwent surgical repair and to explore the forecasting of patient outcomes. Among our patients, we analyzed the associations between each patient’s baseline urine metabolome and frailty severity, and their Functional Independence Measure (FIM) and Short Physical Performance Battery (SPPB) scores. We investigated whether urinary metabolomics of specimens collected in the rehabilitation hospital after surgery could provide relevant patterns to predict patient outcomes, such as their performance in FIM and SPPB one year later, as well as patient survival during the follow-up of 2 years. This work is an ancillary substudy of the randomized HIPFRA study where patients participated in year-long home-based exercise training [17].
2. Results
2.1. Participant Description
Thirty-three patients participated in the study (26 women and 7 men, age 80 ± 8 years). Their characteristics are described in Table 1. Age, BMI, scores of frailty, SPPB, and FIM (total, motor, and cognitive) are shown for all participants and according to their frailty status (non-frail, pre-frail, and frail). Frail participants had, as expected, a higher score of frailty compared to non-frail (p < 0.05) and pre-frail (p < 0.05) participants. For other parameters, we did not observe any significant differences among these subgroups.

Table 1.
Baseline characteristics of the participants (all and by their frailty status). Results are expressed as means ± SD.
2.2. Description of the Urine Bank Spectrum
2.2.1. Unsupervised Multivariate Analysis
We applied a principal component analysis (PCA) to the urine spectra using a bucket of 0.05 ppm. In the score plot, one spectrum was detected as an outlier. The loading and contribution plots indicate that this outlier differs from the others because of a large contribution of the peak for acetate compared with all the other spectra (Supplemental Figure S1). However, we decided to keep it in future analyses. With this first analysis, we selected peaks in the bucket with a score contribution greater than 0.5 or less than −0.5. We retained 18 peaks that were identified in the literature.
2.2.2. Identification of Metabolites of Interest in Urine
Figure 1 is a representative 1H NMR spectrum from one urine sample. The metabolites that showed interesting variabilities between all samples are presented in Table 2. We found three amino acids (alanine, valine, and glycine), and one ketone (acetone). Organic acids were also of interest, such as lactic acid, acetic acid, hippuric acid, formic acid, and citric acid. Some nitrogen derivatives complete the list: dimethylamine, methylguanidine, creatinine, dimethyl sulfone, trimethylamine-N-oxide (TMAO), and urea. Finally, some exogenous molecules were also found in the patient’s urine: derivatives from paracetamol (including acetaminophen glucuronide and acetaminophen sulfate), as well as hippuric acid, which can also be endogenous.
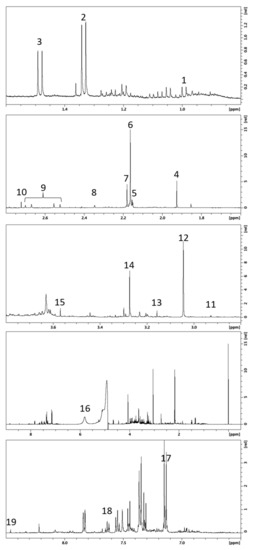
Figure 1.
Typical 500 MHz 1H NMR spectrum from one urine sample. Numbers refer to assigned metabolites presented in Table 2.
Table 2.
NMR chemical shift (δ) and Human Metabolome Database identification number (HMDB ID) for selected metabolites.
2.3. Outcome Analyses
In the following section, we present outcome analyses, including frailty status, FIM, SPPB, and mortality. Sex and age comparisons are presented in the Supplementary File (Supplementary Figures S2 and S3).
2.3.1. Frailty
Figure 2 shows multivariate analyses of the urine spectrum when comparing patients with varying frailty severity (non-frail, pre-frail, and frail). On the score plots from PCA and PLS-DA (partial least square—discriminant analysis) obtained from all patients, we can observe a trend: the non-frail and frail spots seem to be on opposite sides in the PC1 dimension, while the pre-frail spots are scattered throughout the graph (Figure 2a). When comparing only non-frail and frail patients (Figure 2d), better separation is observed.
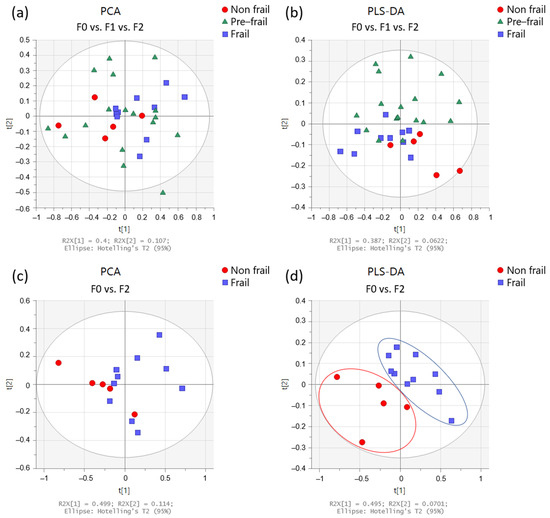
Figure 2.
Multivariate analysis obtained from urine spectra of the participants (n = 33). Score plots from PCA (left panels) and PLS-DA (right panels) according to frailty severity: (a,b) in non-frail (red circles; n = 5), pre-frail (green triangles; n = 18), and frail (blue squares; n = 10) participants, and (c,d) in non-frail (red circles) and frail (blue squares) participants.
We also performed a classical integration analysis targeting our 19 peaks using an ANOVA test to compare the three groups (non-frail, pre-frail, and frail) (Figure 3a). When the p-value was lower than 0.05, a posthoc test (Tukey) was applied to perform multiple comparisons between the groups. These results revealed a trend toward a difference between the non-frail and frail groups. As presented in Figure 3b, a Mann–Whitney test was also performed to assess the difference between the non-frail and frail groups, and the level of paracetamol derivatives was significantly higher in frail patients. Regarding hippuric acid, we observed a tendency toward higher values in frail patients.
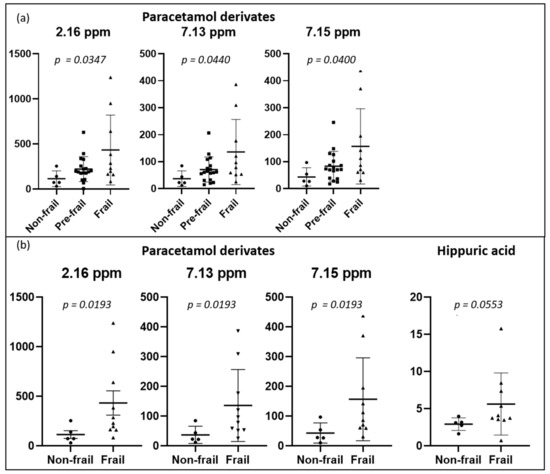
Figure 3.
Dot plots of targeted metabolites showing significant differences between groups, (a) non-frail (n = 5) vs. pre-frail (n = 18) vs. frail (n = 10) participants, and (b) non-frail vs. frail participants. Plots represent mean ± standard deviation.
2.3.2. Functional Independence Measure (FIM)
PCA and PLS-DA of the urine spectrum to compare FIM scores (total, motor, and cognitive) are presented in Figure 4. When comparing the groups with low and high total FIM scores (dichotomized by medians), we can observe a slight discrimination. However, when we compare either the motor or the cognitive component, the separation appears to be better. To understand these separations, we conducted a targeted analysis. As shown in Figure 5a, we observed an increased level of paracetamol derivatives in groups with lower scores of total, motor, and cognitive FIM. Regarding the motor component (Figure 5b), the group with lower scores (FIM ≤ 74; poorer functional independence) presented higher levels of acetate, acetone, dimethylamine, and glycine than the group with higher scores (FIM > 74; better functional independence). Regarding the cognitive component (Figure 5c), we noticed higher levels of acetone and dimethylamine in the group with lower scores (FIM ≤ 31).
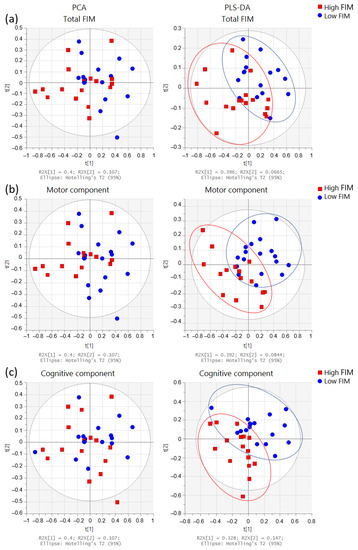
Figure 4.
Multivariate analysis obtained from the urine spectra of the participants (n = 33). Score plots from the PCA (left side) and PLS-DA (right side) for FIM scores: Comparisons between (a) total FIM: low ≤102 (n = 16) and high >102 (n = 17); (b) motor component: low ≤74 (n = 18) and high >74 (n = 15), and (c) cognitive component: low ≤31 (n = 17) and high >31 (n = 16). FIM groups were dichotomized by medians: high FIM (red squares) and low FIM (blue circles).
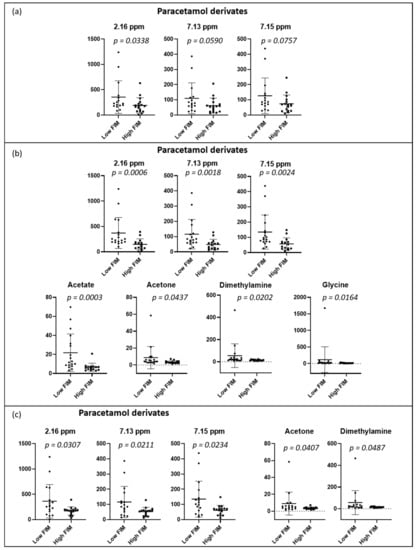
Figure 5.
Dot plots of targeted metabolites showing significant differences between groups, (a) total FIM: low ≤102 (n = 16) and high >102 (n = 17); (b) motor component: low ≤74 (n = 18) and high >74 (n = 15), and (c) cognitive component: low ≤31 (n = 17) and high >31 (n = 16). FIM groups were dichotomized with medians. Plots represent mean ± standard deviation.
2.3.3. Short Physical Performance Battery (SPPB)
PCA and PLS-DA of the urine spectrum for SPPB measured at baseline and 12 months later are presented in Figure 6. When comparing the groups at baseline (dichotomized by medians, higher scores denoting better performance), we observe a slight discrimination. When we compare the low and high total SPPB groups after 12 months, the separation remains similar. To understand these separations, we conducted a targeted analysis. As depicted in Figure 7a, we observed increased levels of the paracetamol derivatives, alanine, lactate, acetate, and acetone in the group with lower SPPB scores at baseline. After 12 months (Figure 7b), the group with lower scores presented higher levels of valine, lactate, acetone, hippuric acid, and TMAO at baseline when compared with the group with higher SPPB scores.
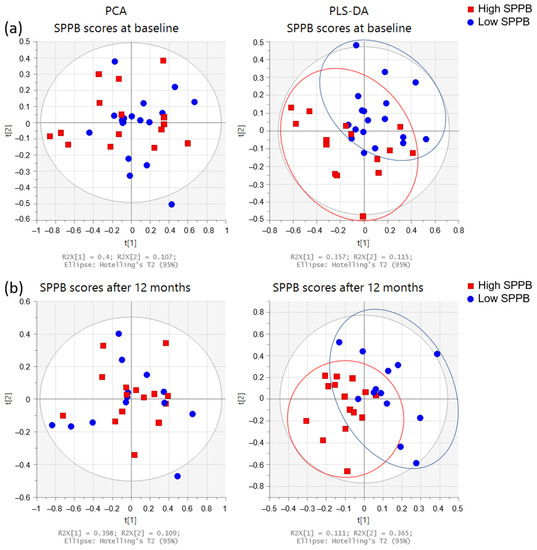
Figure 6.
Multivariate analysis of the urine spectra of the participants’ SPPB (n = 33). Score plots from PCA (left side) and PLS-DA (right side): (a) at baseline (low ≤3 (n = 18); high >3 (n = 15)), and (b) after 12 months (low ≤8 (n = 13); high >8 (n = 15)). SPPB groups were dichotomized with medians: high SPPB (red squares) and low SPPB (blue circles).
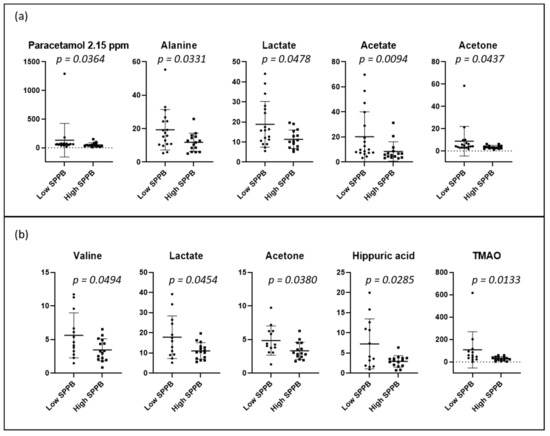
Figure 7.
Dot plots of targeted metabolites showing significant differences between groups of high and low SPPB: (a) at baseline (low ≤3 (n = 18); high >3 (n = 15)), and (b) after 12 months (low ≤8 (n = 13); high >8 (n = 15)). SPPB groups were dichotomized with medians. Plots represent mean ± standard deviation.
2.3.4. Mortality over 24 Months
The PCA and PLS-DA of the baseline urine spectra from patients during the two-year study (first randomized to exercise training or usual care; the second-year registry follow-up) are presented in Figure 8. When comparing spectra, we observed that the spectra of those patients who died were distributed on the lower left side of the PLS-DA score plot, whereas those of patients who were alive at 24 months were located on the other side, except for one spectrum. In addition, we conducted a targeted analysis. As shown in Figure 9, in patients who died, increased levels of eight urine metabolites (paracetamol derivates (2.15 ppm; 2.16 ppm; 7.13 ppm; and 7.15 ppm); hippuric acid; valine; alanine; lactate; acetate; acetone, and dimethylamine) were observed.
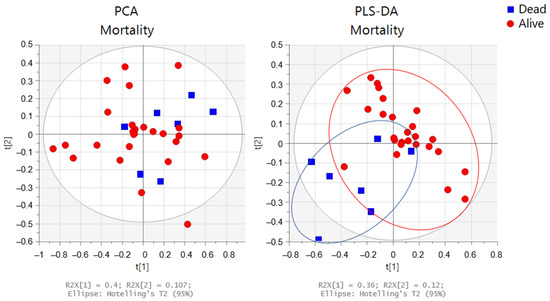
Figure 8.
Multivariate analysis obtained from the baseline urine spectra from patients who remained alive (n = 26) (red circles) or died (n = 7) (blue squares) during the two-year study. Score plots from the PCA (left side) and PLS-DA (right side).
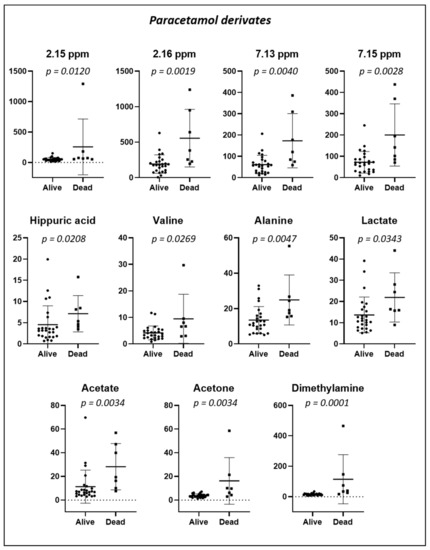
Figure 9.
Dot plots of targeted metabolites showing significant differences in urinary concentration in specimens collected at baseline from 33 patients according to whether they were alive (n = 26) or died (n = 7) during the 24-month study period. Plots represent mean ± standard deviation.
2.4. Pathway Analysis
The results of the pathway analysis are presented in a graphical output (Figure 10) and in Table 3, which presents the matched metabolic pathways. The 19 identified urine metabolites are involved in 13 metabolic pathways.
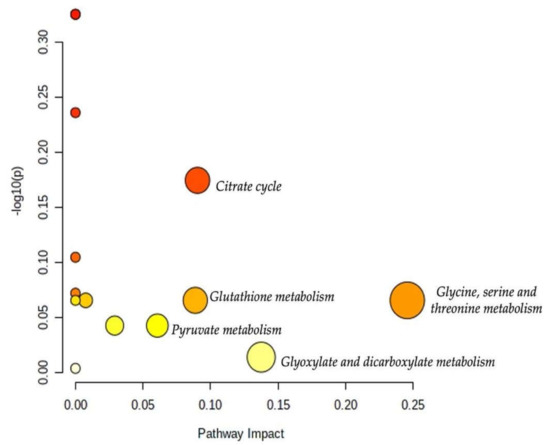
Figure 10.
Overview of the pathway analysis arranged according to the scores from the enrichment analysis (y-axis) and the topology analysis (x-axis). The color and size of each circle (pathways) are based on its p-value and pathway impact value, respectively. Circles located in the top right diagonal region represent pathways with significant metabolite changes and higher impact. The pathway names with the highest impact values (largest circles) are mentioned (glycine, serine, and threonine metabolism; glyoxylate and dicarboxylate metabolism; citrate cycle; glutathione metabolism; pyruvate metabolism).
Table 3.
Results of pathway analysis with MetaboAnalyst 5.0 (https://www.metaboanalyst.ca) indicating the total number of involved metabolites and those detected in our data based on the p-value and the impact of each metabolic pathway. Analysis performed on 20 July 2021.
As shown in Table 3, the topology analysis showed that seven pathways (glycine, serine, and threonine metabolism; glyoxylate and dicarboxylate metabolism; citrate cycle; glutathione metabolism; pyruvate metabolism; glycolysis/gluconeogenesis; primary bile acid biosynthesis) have a pathway impact. Among them, five pathways (glycine, serine, and threonine metabolism; glyoxylate and dicarboxylate metabolism; citrate cycle; glutathione metabolism; pyruvate metabolism) had an impact value higher than 0.05. However, the p-values of some of the enriched pathways were higher than 0.05 which may attenuate their impacts.
3. Discussion
In the present study, a 1H NMR-based metabolomic approach was used (1) to describe the urine metabolome in patients after hip fracture surgery, according to frailty severity (non-frail, pre-frail, and frail), functional independence (total, motor, and cognitive FIM) and physical performance (SPPB); (2) to explore the link between baseline metabolomic urinary profiles and physical performance (SPPB) after a one-year exercise program in a randomized trial, and (3) to investigate whether the urinary metabolite characteristics might predict patient survival (living or dead) over the 24-month study period. NMR-based metabolomics revealed major metabolic variations between groups with different profiles of frailty, FIM, and SPPB. These variations were quantified. The metabolic variations concerned ten identified urine metabolites: paracetamol derivatives (4 peaks: 2.15 ppm; 2.16 ppm; 7.13 ppm; and 7.15 ppm); hippuric acid; acetate; acetone; dimethylamine; glycine; alanine; lactate; valine; and TMAO.
Based on the frailty severity, our results revealed that the level of paracetamol derivatives in urine was significantly increased: (1) in frail persons (frailty score ≥ 3) in comparison to non-frail patients; (2) in persons with poor FIM scores (low level of total, motor, and cognitive independence) in comparison to persons with greater FIM scores; (3) in persons with low SPPB scores (poor physical performance) compared to persons with better FIM scores. As pain can be a major factor in worsening frailty, paracetamol is a model drug that is often used in the pain management in frail older adults [18,19,20,21,22] and also in pain relief after orthopedic surgery in older patients [23,24]. Paracetamol is metabolized in the liver and then excreted in the urine as a glucuronide or a sulfonate [18]. Aging induces a decline in the clearance of paracetamol in (frail) persons owing to decreased liver volume with age and altered activity of conjugating enzymes [18]. These issues can further explain the higher level of paracetamol derivatives in frail patients (among our patients, 23 used paracetamol orally at the time of discharge). Our results are in agreement with the observations of Koponen et al. [19], who noted that paracetamol use was more prevalent among frail compared to pre-frail or non-frail older people. Additionally, we observed an increased level of paracetamol in patients with impaired functional independence and/or with poor physical performance. Hip-fracture related pain compromises functional performance and affects activities of daily living [25], so the pain medication should be optimized to prevent pain complications. Our NMR analysis revealed that frail patients’ urine contained a higher level of paracetamol derivatives than that of non-frail patients.
Urine analysis also revealed an increased level of hippuric acid in frail patients compared with non-frail patients. Hippuric acid represents a glycine conjugate of benzoic acid [26]. Hippuric acid could be associated with hepatic function, renal clearance, and the degradation of certain dietary components [26,27]. Furthermore, it has been related to aging and geriatric syndromes in metabolomic studies [12,13,28]. Urinary hippuric excretion increases with aging [28], especially in frail people. This finding has been explained by many factors related to frailty, including age-related diseases, low fruit and vegetable intake, changes in the gut microflora, sarcopenia, inflammation, and hypomobility [10,25,26,28]. None of our patients had hippuric acid as medication, so the compound revealed in our investigation was certainly an endogenous metabolite.
Regarding FIM, urine analysis revealed significantly increased urine levels of paracetamol, acetate, acetone, dimethylamine, and glycine in patients who needed more assistance in daily activities. These metabolites, including ketone bodies, organic acids, and amino acids, are affected by the aging process and frailty and are related to impaired functional independence [29,30]. Acetone is a ketone body that is released by the liver from the adipose tissue and is excreted by the kidneys [31]. It acts as an energy source when glucose reserves are insufficient, especially during fasting. Ketone bodies increase in the case of hypoglycemia or when glucose molecules in the circulation cannot enter the cells. These substances can generate oxygen radicals and cause lipid peroxidation [32,33], which may play a role in the pathogenesis of vascular diseases and diabetes. Our analysis revealed that the excretion of ketone bodies increased in patients with low functional independence (FIM) compared to those with higher scores. This finding may be explained by glucose deficiency in these patients owing to a lower carbohydrate intake, energy metabolism imbalance, loss of appetite, and alterations in taste and smell [34,35]. Furthermore, frail people face a risk of malnutrition, which thereby contributes to a loss of muscle mass and thus a loss of muscle strength, which explains why frail patients present decreased motor FIM scores. We also observed that patients with lower FIM scores had increased acetate levels in their urine. Acetate is an anion formed by the removal of a hydrogen atom from acetic acid. It has been observed that oxidative stress phenomena are more present in older subjects with pathologies such as arthrosis and diminish in subjects who are more physically active [36]. Therefore, in patients with lower FIM who have difficulties being physically active, it is likely that a higher concentration of H2O2 (a common oxidative agent) could react with pyruvate to generate acetate (and CO2) via an oxidative decarboxylation reaction [37]. We also found an increased level of dimethylamine in patients with low FIM scores, with dimethylamine being the most abundant short-chain aliphatic amine in human urine. In older patients, a higher level of this urine metabolite has been associated with diseases related to renal and cardiovascular systems [38,39].
Regarding the SPPB, NMR-based analysis and univariate comparisons revealed that patients with poor physical performance (SPPB) vs. those with better SPPB at 12 months had higher levels of the following urine metabolites at baseline: paracetamol, acetate, acetone, hippuric acid, alanine, lactate, valine, and TMAO. Alanine, lactate, and valine are involved in antioxidant and anti-inflammatory responses [40,41,42,43]. A growing body of literature has reported that a chronic low-grade inflammatory state occurs in aging [44,45,46]. The immune system deteriorates progressively with age-related diseases [47], thereby contributing to increased circulatory inflammatory markers (TNF-alpha, IL-1beta, IL-6, COX-2, INOS) [47], impaired autophagy, redox imbalance, and increased oxidative stress [44,45]. These underlying mechanisms of aging (low-grade inflammation and oxidative stress) can influence the physical and functional ability of older adults, leading to decreased physical performance [48,49]. Accumulating evidence suggests that alanine and valine supplementation [40,41,42,43] could reduce inflammation and oxidative stress, and prevent decreased muscular strength and mass. However, our results revealed that patients with poor performance had increased urinary levels of alanine, valine, and lactate when compared to those with better performance. We can speculate that this difference could be linked to either (1) an increased β-alanine [50,51] and branched-chain amino acid supplementation [52,53] in more frail patients (however, our patients did not take supplements) or (2) a greater release of metabolites involved in the antioxidant and anti-inflammatory reactions. We also observed an increased urine level of trimethylamine N-oxide (TMAO), in patients with poor physical performance compared with those with better performance. An increased level of TMAO has often been linked to several metabolic and inflammatory disorders (obesity, higher risk of cardiovascular diseases) [54,55]. TMAO is considered to be an inflammatory mediator involved in the increased production of reactive oxygen species and the activation of the NLRP3 inflammasome in endothelial cells [56,57]. Our results demonstrated that patients with impaired physical performance had increased urine levels of metabolites involved in the systematic inflammatory response and oxidative stress (alanine, lactate, valine, and TMAO). These findings are in accordance with previous results [48,49] associating the decline in physical capacity with a state of chronic low-grade inflammation and oxidative stress that occurs with aging.
The urinary metabolite analysis taken at discharge from the rehabilitation hospital showed increased levels of paracetamol, lactate, acetate, acetone, valine, alanine, dimethylamine, and hippuric acid in patients who died during the two years following the hip fracture surgery. As discussed above, most of these urine metabolites are linked to metabolic, cardiovascular, renal, and inflammatory diseases. Our results confirmed previous findings reporting that the mortality risk increased with age-related disorders and diseases, including inflammation [58], oxidative stress [59], renal diseases [60], and malnutrition [61]. Our study should be considered a pilot study. Further metabolomic investigations are warranted to identify the metabolic profiles predisposing a higher risk of mortality.
The present study presents some limitations. The urinary samples of 33 successive patients comprise a subgroup of the randomized trial of 121 hip fracture patients. The specimen collection was difficult to organize in the hospital ward, many participants forgot that they were supposed to give a morning urinary sample, many participants were incontinent, had cognitive decline, and were unable to hold urine for the required time. However, our population is still representative of the initial population presented in the HIPFRA study [17] concerning age, frailty severity, and FIM and SPPB scores.
4. Materials and Methods
4.1. Study Design
This parallel design randomized clinical trial was conducted in one province (133,000 inhabitants) in Finland. The study received ethical approval from the Coordinating Ethics Committee of Helsinki University Hospital (Finland) in November 2014 and was registered at ClinicalTrials.gov (NCT02305433) in December 2014. The study was conducted in accordance with the Declaration of Helsinki, and all participants signed a written consent form. The study protocol [17], the results of the primary outcome [62], and of the secondary outcome functioning have been published [63].
4.2. Participants
The participants in this substudy participated in the larger HIPFRA study, for which patients with recently operated hip fractures were recruited from the rehabilitation hospital of South Karelia Social and Health Care District between December 2014 and December 2017. Patients were eligible for the study if they were at least 60 years old, living at home, able to walk indoors (walking aid allowed), had a Mini-Mental State Examination score of 12 or higher, and had a fracture that was the first operated proximal femoral fracture located in the femoral neck, pertrochanteric, or subtrochanteric region. Patients were excluded if they had contraindications to physical exercise, lived in a 24-h care facility, or had alcohol or drug abuse issues or severe illnesses with a life expectancy of less than two years. In addition, for the present subgroup study, a participant was eligible if he or she had given a urinary sample during his or her stay in the rehabilitation hospital between January 2015 and August 2017. Chronic diseases and prescribed drugs are presented in Supplementary Tables S1 and S2.
Eligible participants were randomized into two groups. The intervention group received a 12-month home-based physiotherapist-supervised training program twice a week, and the usual care group received health care services, including rehabilitation as needed [17].
4.3. Outcomes
The research physiotherapist or the research nurse performed the assessments of frailty status, Functional Independence Measure (FIM), and Short Physical Performance Battery (SPPB) at the participant’s home at baseline and after 12 months. The severity of frailty was assessed using Fried et al.’s (2001) [1] frailty phenotype classification (slightly modified), which contained five domains: exhaustion, slowness, weight loss, weakness, and physical activity. The Functional Independence Measure (FIM) [64] includes 18 tasks, of which 13 are motor (e.g., eating, toileting) and five are cognition tasks (e.g., problem solving and memory). The assessor evaluated the participant’s capability to perform the tasks by interviewing and observing the participant during the home visits. The tasks were graded using a scale from 7 (completely independent) to 1 (needs total assistance) with a maximum total score of 126. The Short Physical Performance Battery (SPPB) measures physical performance and includes three tests: a balance test, a 4-m walk, and a chair rise test, each of which are scored from 0 to 4, with a maximum total score of 12 points. Mortality over 24 months was acquired from the medical records.
4.4. Urine Sample Collection
Urine samples were collected in the rehabilitation hospital ward from voluntary patients who were potentially eligible for the HIPFRA study. For the dinner preceding the morning urine collection, the patients were advised to abstain from fish and other seafood. Morning urine samples were collected a few days before discharge. The patient needed to be able to hold urine for at least 4 h before voiding into a collection cup. The sample was taken from the first urination in the morning. The research nurse pipetted a 10-mL sample from the collection bowl, and the pipetted sample was stored in the tube without preservatives. The sample tubes were immediately frozen and preserved in a freezer at −80 °C. A urine sample could not be taken if the patient was incontinent or had a low cognitive status. After all the samples were collected, they were sent to Poitiers, France, in a dry ice container for analysis. Thirty-three samples were analyzed with NMR spectroscopy.
4.5. Sample Preparation for NMR Analysis
Urine samples were thawed at room temperature and homogenized with vortexing. A total of 400 µL of urine was mixed with 200 µL of phosphate buffer prepared in deuterium oxide containing 0.05 wt. % 3-(trimethylsilyl) propionic-2,2,3,3-d4 acid, sodium salt (TSP). Samples were vortexed for 15 s and allowed to stand for 15 min at room temperature. Samples were vortexed for 15 s and centrifuged at 8000 g at room temperature for 5 min. The pH of the supernatant was adjusted to 7.40 ± 0.05 with the addition of concentrated chlorhydric acid or sodium hydroxide. Five hundred microliters were introduced into a 5 mm Pyrex NMR sample tube. NMR analysis was performed immediately after the preparation [65]. Solvents were purchased from Sigma Aldrich® (Darmstadt, Germany), and NMR tubes were purchased from CortecNet® (Les Ulis, France), Proton NMR Spectroscopy. All NMR experiments and data analyses were performed randomly over one unique period.
4.6. Instrument Description
Spectra were obtained with a 500 MHz SB Bruker Avance Neo spectrometer at 11.75 Tesla (BioSpin®, Wissenbourg, France). The magnet was equipped with a 5 mm BBO cryoprobe prodigy (Bruker BioSpin®, Wissebourg, France). Tuning and matching were automated. Automated gradient shimming for Z coils was used and manual optimization was performed if needed. The spectrometer was controlled with TopSpin 4.0 software (Bruker BioSpin®, Wissenbourg, France).
4.7. Spectrum Acquisition Parameters
Samples were thermostated at 293 K without spinning. One-dimensional (1-D) 1H NMR spectra were obtained at 500.09 MHz using a 1-D experiment impulsion acquisition sequence with a noesygppr1d pulse sequence with a presaturation delay during the relaxation delay (d1 = 5 s) and mixing time (d8 = 10 ms). The homospoil/gradient pulse p16 was 1 ms and the delay for homospoil/gradient recovery was 200 µs. Spectra were obtained in 12 min and 15 s by accumulating 64 free induction decay (FID) and 4 dummy scans. The acquisition time was 5.57 s with a spectral width of 6 kHz collected at 64 K data points. The 90° pulse delay was 12 µs with a power level of −12.14 dB. In addition, the residual water resonance was presaturated with a 40.26 dB field strength irradiation. The receiver gain was set at 32 for each sample.
4.8. Spectrum Processing Parameters
All spectra were processed with TopSpin 4.0 software (Bruker BioSpin®, Wissenbourg, France). Typical processing parameters were the application of a Fourier transform without line broadening or zero filling. Chemical shifts (δ in ppm) were reported relative to the signal of TSP at 0 ppm. Phase correction and baseline correction were performed manually. The relative values obtained for each metabolite were obtained by integrating the signal relative to the TSP signal.
Identification of the metabolites was performed using the Human Metabolome Database [66], the Magnetic Resonance Metabolomics Database [67], our database performed at pH = 7.4, and literature on urinary NMR analysis [68,69]. According to the Metabolite Identification Task Group from the Metabolomics Standards Initiative, the level of identification was 2 [70]. Raw data were registered in the MetaboLights database [71] (MTBLS2903).
4.9. Statistical Analysis
For frailty severity, the population was classified as non-frail (none of the five criteria present, i.e., robust; 5 persons), pre-frail (1–2 criteria; 18 persons), or frail (3 or more criteria; 10 persons) [72]. For other outcomes (age, SPPB, and FIM), we used their medians to create the groups.
4.9.1. Multivariate Analysis
We performed automatic bucketing with a bucket width of 0.05 ppm, normalized to the total integral (from 0.6 to 10 ppm with the exclusion of water signal and urea from 4.5 to 6.5 ppm). We used the Amix viewer from Bruker® to generate matrices. We used Pareto scaling before generating the score and loading plots from PCA and PLS-DA using Simca® 17 software from Sartorius AG (Goettingen, Germany). We also generated contribution plots to help find the most discriminative variables.
4.9.2. Univariate Analysis
Statistical analyses were performed using the statistical software Prism 8 (GraphPad software© (San Diego, CA 92108, US). The Gaussian distribution was tested for each variable using the Shapiro–Wilk test. A paired t-test or nonparametric Wilcoxon test was used to assess differences between metabolite concentrations in urines according to the parameters of interest. The results of the tests were considered significant at p ≤ 0.05. The results were expressed as means with the standard deviations (SD) or with boxplots.
4.9.3. Pathway Analysis
We performed a pathway analysis using MetaboAnalyst 5.0 on 20 July 2021 (https://www.metaboanalyst.ca), an easy-to-use web-based tool suited to comprehensive and integrative metabolomics data analysis [73]. The metabolite table was autoscaled. We used the KEGG (Kyoto Encyclopedia of Genes and Genomes) library for Homo sapiens and we have launched two forms of pathway analysis, enrichment (global test) and topology (relative-betweenness centrality), to assess the p-values and the pathway impact values, respectively.
5. Conclusions
Our preliminary findings with the NMR-based metabonomic approach reveal that among patients after hip fracture surgery, frail patients, and those patients with impaired functional independence or poor physical performance, showed increased levels of urine metabolites associated with metabolic, inflammatory, and renal disorders related to aging, such as a low-grade inflammation, oxidative stress, and other age-related problems (e.g., malnutrition, low physical activity). More metabolomic studies with other biological fluids (plasma) and larger populations are warranted to identify metabolic factors predisposing older patients to frailty and impaired performance. The NMR-based metabonomic approach could be a tool of importance in comparing the metabolic profiles of older adults, e.g., after major surgery when planning rehabilitation.
Supplementary Materials
The following are available online at https://www.mdpi.com/article/10.3390/metabo12080744/s1, Figure S1. Overall PCA for all urine samples (n = 33). (a) Score plot; (b) loading plot and (c) contribution plot (one outlier vs other’s spectra); Figure S2. Dot plots of targeted metabolites that were significantly different between patients younger than 80 years old (Group 1, n = 17) or older than 80 years old (Group 2, n = 16); Figure S3. Dot plots of targeted metabolites that were significantly different between women (n = 26) and men (n = 7); Table S1. Drugs used at the time of the urine collection in the rehabilitation hospital, according to ATC (Anatomical Therapeutic Chemical Classification) codes. Analgesics are bolded (N02A opioids; N02B other analgesics and antipyretics. e.g., paracetamol). Each line corresponds to one subject; Table S2. Chronic diseases among all participants and according to frailty status. Data are expressed as number of patients and frequency (%). Table S3: VIP (Variable Importance in Projection) scores.
Author Contributions
Conceptualization: S.S., P.S., M.H., K.K.-H. and B.D.; methodology, W.D., D.B., N.B. and A.N.; validation: all authors; formal analysis: W.D., D.B. and B.D.; investigation: all authors; writing—original draft preparation: W.D., D.B., B.D., P.S. and S.S.; writing—review and editing: all authors. All authors provided critical feedback and contributed to the manuscript with their inputs. All authors have read and agreed to the published version of the manuscript.
Funding
The authors acknowledge South Karelia Social and Health Care District (Eksote), Finland (grant number 1236/00.01.05.01/2013); The Social Insurance Institution of Finland (Kela) (grant numbers 94/331/2013 and 17/26/2019), the State Research Funding for Academic Health Research (Ministry of Social Affairs and Health, through Helsinki University Hospital (HUS)), Finland (grant numbers HUS 2016 (no grant number assigned), HUS/2931/2017, HUS/2571/2017, HUS/2631/2019, 864/2020), the “Institut National de la Santé et de la Recherche Médicale” (INSERM), the European Union (ERDF) and “Région Nouvelle Aquitaine” for financial supports.
Institutional Review Board Statement
The study received ethical approval from the coordinating ethics committee of Helsinki University Hospital (Finland) in November 2014 and was registered to ClinicalTrials.gov (NCT02305433) in December 2014.
Informed Consent Statement
Written informed consent was obtained from all subjects involved in the study.
Data Availability Statement
Data supporting reported results are stored at the Faculty of Medicine, University of Poitiers.
Acknowledgments
The authors thank Kaija Paananen, RN, for managing the sample collection with her excellent nursing skills. We appreciate the continuous help and support of Esa Leppänen.
Conflicts of Interest
The authors declare no conflict of interest.
Abbreviations
| BMI | Body Mass Index (weight/height2) |
| COX | Cyclooxygenase |
| FIM | Functional Independence Measure |
| HMDB | Human Metabolome Database |
| INOS | Inducible Nitric oxide synthase |
| KEGG | Kyoto Encyclopedia of Genes and Genomes |
| NLRP3 | NLR Family Pyrin Domain Containing 3 |
| NMR | Nuclear Magnetic Resonance |
| PC | Principal Component |
| PCA | Principal Component Analysis |
| PLS-DA | Partial Least Square—Discriminant Analysis |
| SPPB | Short Physical Performance Battery |
| TMAO | Trimethylamine N-oxide |
| TSP | 3-(trimethylsilyl)propionic-2,2,3,3-d4 acid, sodium salt |
| δ | Chemical shift |
References
- Fried, L.P.; Tangen, C.M.; Walston, J.; Newman, A.B.; Hirsch, C.; Gottdiener, J.; Seeman, T.; Tracy, R.; Kop, W.J.; Burke, G.; et al. Frailty in Older Adults: Evidence for a Phenotype. J. Gerontol. Ser. A Biol. Sci. Med. Sci. 2001, 56, M146–M157. [Google Scholar] [CrossRef] [PubMed]
- Gobbens, R.J.J.; Luijkx, K.G.; Wijnen-Sponselee, M.T.; Schols, J.M.G.A. In Search of an Integral Conceptual Definition of Frailty: Opinions of Experts. J. Am. Med. Dir. Assoc. 2010, 11, 338–343. [Google Scholar] [CrossRef] [PubMed]
- Shin, J.; Kim, M.; Choi, J. Development and Validation of a Multidimensional Frailty Scale for Clinical Geriatric Assessment. J. Nutr. Health Aging 2021, 25, 938–943. [Google Scholar] [CrossRef]
- Bloch, F.; Jegou, D.; Dhainaut, J.-F.; Rigaud, A.-S.; Coste, J.; Lundy, J.-E.; Claessens, Y.-E. Can Metabolic Abnormalities after a Fall Predict Short Term Mortality in Elderly Patients? Eur. J. Epidemiol. 2009, 24, 357–362. [Google Scholar] [CrossRef] [PubMed]
- Pérez-Tasigchana, R.F.; León-Muñoz, L.M.; Lopez-Garcia, E.; Gutierrez-Fisac, J.L.; Laclaustra, M.; Rodríguez-Artalejo, F.; Guallar-Castillón, P. Metabolic Syndrome and Insulin Resistance Are Associated with Frailty in Older Adults: A Prospective Cohort Study. Age Ageing 2017, 46, 807–812. [Google Scholar] [CrossRef]
- Veronese, N.; Maggi, S. Epidemiology and Social Costs of Hip Fracture. Injury 2018, 49, 1458–1460. [Google Scholar] [CrossRef]
- Pisani, P.; Renna, M.D.; Conversano, F.; Casciaro, E.; Di Paola, M.; Quarta, E.; Muratore, M.; Casciaro, S. Major Osteoporotic Fragility Fractures: Risk Factor Updates and Societal Impact. World J. Orthop. 2016, 7, 171. [Google Scholar] [CrossRef]
- Han, Y.; Zhang, W.; Liu, J.; Song, Y.; Liu, T.; Li, Z.; Wang, X.; Yang, N.; Li, Y.; Han, D.; et al. Metabolomic and Lipidomic Profiling of Preoperative CSF in Elderly Hip Fracture Patients With Postoperative Delirium. Front. Aging Neurosci. 2020, 12, 570210. [Google Scholar] [CrossRef]
- Guo, Y.; Zhang, Y.; Jia, P.; Wang, W.; Zhou, Q.; Sun, L.; Zhao, A.; Zhang, X.; Wang, X.; Li, Y.; et al. Preoperative Serum Metabolites Are Associated With Postoperative Delirium in Elderly Hip-Fracture Patients. J. Gerontol. Ser. A 2017, 72, 1689–1696. [Google Scholar] [CrossRef]
- Schultz, R.J.; Whitfield, G.F.; LaMURA, J.J.; Raciti, A.; Krishnamurthy, S. The Role of Physiologic Monitoring in Patients with Fractures of the Hip. J. Trauma 1985, 25, 309–316. [Google Scholar] [CrossRef]
- Bürkle, A.; Moreno-Villanueva, M.; Bernhard, J.; Blasco, M.; Zondag, G.; Hoeijmakers, J.H.J.; Toussaint, O.; Grubeck-Loebenstein, B.; Mocchegiani, E.; Collino, S.; et al. MARK-AGE Biomarkers of Ageing. Mech. Ageing Dev. 2015, 151, 2–12. [Google Scholar] [CrossRef] [PubMed]
- Kameda, M.; Teruya, T.; Yanagida, M.; Kondoh, H. Frailty Markers Comprise Blood Metabolites Involved in Antioxidation, Cognition, and Mobility. Proc. Natl. Acad. Sci. USA 2020, 117, 9483–9489. [Google Scholar] [CrossRef] [PubMed]
- Teruya, T.; Goga, H.; Yanagida, M. Aging Markers in Human Urine: A Comprehensive, Non-targeted LC-MS Study. FASEB BioAdv. 2020, 2, 720–733. [Google Scholar] [CrossRef] [PubMed]
- Picca, A.; Coelho-Junior, H.J.; Cesari, M.; Marini, F.; Miccheli, A.; Gervasoni, J.; Bossola, M.; Landi, F.; Bernabei, R.; Marzetti, E.; et al. The Metabolomics Side of Frailty: Toward Personalized Medicine for the Aged. Exp. Gerontol. 2019, 126, 110692. [Google Scholar] [CrossRef]
- Nik Mohd Fakhruddin, N.N.I.; Shahar, S.; Ismail, I.S.; Ahmad Azam, A.; Rajab, N.F. Urine Untargeted Metabolomic Profiling Is Associated with the Dietary Pattern of Successful Aging among Malaysian Elderly. Nutrients 2020, 12, 2900. [Google Scholar] [CrossRef]
- Bollard, M.E.; Stanley, E.G.; Lindon, J.C.; Nicholson, J.K.; Holmes, E. NMR-Based Metabonomic Approaches for Evaluating Physiological Influences on Biofluid Composition: Metabonomic characterization of physiological variation. NMR Biomed. 2005, 18, 143–162. [Google Scholar] [CrossRef]
- Soukkio, P.; Suikkanen, S.; Kääriä, S.; Kautiainen, H.; Sipilä, S.; Kukkonen-Harjula, K.; Hupli, M. Effects of 12-Month Home-Based Physiotherapy on Duration of Living at Home and Functional Capacity among Older Persons with Signs of Frailty or with a Recent Hip Fracture - Protocol of a Randomized Controlled Trial (HIPFRA Study). BMC Geriatr. 2018, 18, 232. [Google Scholar] [CrossRef]
- Wynne, H.A.; Cope, L.H.; Herd, B.; Rawlins, M.D.; James, O.F.W.; Woodhouse, K.W. The Association of Age and Frailty with Paracetamol Conjugation in Man. Age Ageing 1990, 19, 419–424. [Google Scholar] [CrossRef]
- Koponen, M.P.H.; Bell, J.S.; Karttunen, N.M.; Nykänen, I.A.; Desplenter, F.A.M.; Hartikainen, S.A. Analgesic Use and Frailty among Community-Dwelling Older People: A Population-Based Study. Drugs Aging 2013, 30, 129–136. [Google Scholar] [CrossRef]
- Chin, R.P.-H.; Ho, C.-H.; Cheung, L.P.-C. Scheduled Analgesic Regimen Improves Rehabilitation After Hip Fracture Surgery. Clin. Orthop. Relat. Res. 2013, 471, 2349–2360. [Google Scholar] [CrossRef]
- Dixon, J.; Ashton, F.; Baker, P.; Charlton, K.; Bates, C.; Eardley, W. Assessment and Early Management of Pain in Hip Fractures: The Impact of Paracetamol. Geriatr. Orthop. Surg. Rehabil. 2018, 9, 215145931880644. [Google Scholar] [CrossRef] [PubMed]
- Marttinen, M.K.; Kautiainen, H.; Haanpää, M.; Pohjankoski, H.; Hintikka, J.; Kauppi, M.J. Analgesic Purchases among Older Adults—A Population-Based Study. BMC Public Health 2021, 21, 256. [Google Scholar] [CrossRef] [PubMed]
- Sinatra, R.S.; Jahr, J.S.; Reynolds, L.W.; Viscusi, E.R.; Groudine, S.B.; Payen-Champenois, C. Efficacy and Safety of Single and Repeated Administration of 1 Gram Intravenous Acetaminophen Injection (Paracetamol) for Pain Management after Major Orthopedic Surgery. Anesthesiology 2005, 102, 822–831. [Google Scholar] [CrossRef]
- Lachiewicz, P.F. The Role of Intravenous Acetaminophen in Multimodal Pain Protocols for Perioperative Orthopedic Patients. Orthopedics 2013, 36, 15–19. [Google Scholar] [CrossRef] [PubMed]
- Kristensen, M.T. Hip Fracture−Related Pain Strongly Influences Functional Performance of Patients With an Intertrochanteric Fracture Upon Discharge From the Hospital. PM&R 2013, 5, 135–141. [Google Scholar] [CrossRef]
- Lees, H.J.; Swann, J.R.; Wilson, I.D.; Nicholson, J.K.; Holmes, E. Hippurate: The Natural History of a Mammalian–Microbial Cometabolite. J. Proteome Res. 2013, 12, 1527–1546. [Google Scholar] [CrossRef]
- De Simone, G.; Balducci, C.; Forloni, G.; Pastorelli, R.; Brunelli, L. Hippuric Acid: Could Became a Barometer for Frailty and Geriatric Syndromes? Ageing Res. Rev. 2021, 72, 101466. [Google Scholar] [CrossRef]
- Lawton, K.A.; Berger, A.; Mitchell, M.; Milgram, K.E.; Evans, A.M.; Guo, L.; Hanson, R.W.; Kalhan, S.C.; Ryals, J.A.; Milburn, M.V. Analysis of the Adult Human Plasma Metabolome. Pharmacogenomics 2008, 9, 383–397. [Google Scholar] [CrossRef]
- Chen, L.; Zhang, J.; Teh, J.P.Y.; Cheon, B.K.; Yang, Y.; Schlundt, J.; Wang, Y.; Conway, P.L. Comparative Blood and Urine Metabolomics Analysis of Healthy Elderly and Young Male Singaporeans. J. Proteome Res. 2020, 19, 3264–3275. [Google Scholar] [CrossRef]
- Calvani, R.; Rodriguez-Mañas, L.; Picca, A.; Marini, F.; Biancolillo, A.; Laosa, O.; Pedraza, L.; Gervasoni, J.; Primiano, A.; Miccheli, A.; et al. The “Metabolic Biomarkers of Frailty in Older People with Type 2 Diabetes Mellitus” (MetaboFrail) Study: Rationale, Design and Methods. Exp. Gerontol. 2020, 129, 110782. [Google Scholar] [CrossRef]
- Laffel, L. Ketone Bodies: A Review of Physiology, Pathophysiology and Application of Monitoring to Diabetes. Diabetes Metab. Res. Rev. 1999, 15, 412–426. [Google Scholar] [CrossRef]
- Jain, S.K.; McVie, R.; Jackson, R.; Levine, S.N.; Lim, G. Effect of Hyperketonemia on Plasma Lipid Peroxidation Levels in Diabetic Patients. Diabetes Care 1999, 22, 1171–1175. [Google Scholar] [CrossRef] [PubMed]
- Jain, S.K.; Kannan, K.; Lim, G. Ketosis (Acetoacetate) Can Generate Oxygen Radicals and Cause Increased Lipid Peroxidation and Growth Inhibition in Human Endothelial Cells. Free Radic. Biol. Med. 1998, 25, 1083–1088. [Google Scholar] [CrossRef]
- Gimeno-Mallench, L.; Sanchez-Morate, E.; Parejo-Pedrajas, S.; Mas-Bargues, C.; Inglés, M.; Sanz-Ros, J.; Román-Domínguez, A.; Olaso, G.; Stromsnes, K.; Gambini, J. The Relationship between Diet and Frailty in Aging. Endocr. Metab. Immune Disord. Drug Targets 2020, 20, 1373–1382. [Google Scholar] [CrossRef] [PubMed]
- Bales, C.W.; Ritchie, C.S. Sarcopenia, weight loss, and nutritional frailty in the elderly. Annu. Rev. Nutr. 2002, 22, 309–323. [Google Scholar] [CrossRef] [PubMed]
- Enea, C.; Seguin, F.; Petitpas-Mulliez, J.; Boildieu, N.; Boisseau, N.; Delpech, N.; Diaz, V.; Eugène, M.; Dugué, B. 1H NMR-Based Metabolomics Approach for Exploring Urinary Metabolome Modifications after Acute and Chronic Physical Exercise. Anal. Bioanal. Chem. 2010, 396, 1167–1176. [Google Scholar] [CrossRef] [PubMed]
- Lessiani, G.; Santilli, F.; Boccatonda, A.; Iodice, P.; Liani, R.; Tripaldi, R.; Saggini, R.; Davì, G. Arterial Stiffness and Sedentary Lifestyle: Role of Oxidative Stress. Vasc. Pharmacol. 2016, 79, 1–5. [Google Scholar] [CrossRef]
- Tsikas, D. Urinary Dimethylamine (DMA) and Its Precursor Asymmetric Dimethylarginine (ADMA) in Clinical Medicine, in the Context of Nitric Oxide (NO) and Beyond. J. Clin. Med. 2020, 9, 1843. [Google Scholar] [CrossRef] [PubMed]
- Gejyo, F.; Baba, S.; Watanabe, Y.; Kishore, B.K.; Suzuki, Y.; Arakawa, M. Possibility of a Common Metabolic Pathway for the Production of Methylguanidine and Dimethylamine in Chronic Renal Failure. In Guanidines; Mori, A., Cohen, B.D., Lowenthal, A., Eds.; Springer US: Boston, MA, USA, 1985; pp. 295–308. ISBN 978-1-4757-0754-0. [Google Scholar]
- Zwaag, J.; ter Horst, R.; Blaženović, I.; Stoessel, D.; Ratter, J.; Worseck, J.M.; Schauer, N.; Stienstra, R.; Netea, M.G.; Jahn, D.; et al. Involvement of Lactate and Pyruvate in the Anti-Inflammatory Effects Exerted by Voluntary Activation of the Sympathetic Nervous System. Metabolites 2020, 10, 148. [Google Scholar] [CrossRef] [PubMed]
- Herz, H.; Blake, D.R.; Grootveld, M. Multicomponent Investigations of the Hydrogen Peroxide- and Hydroxyl Radical-Scavenging Antioxidant Capacities of Biofluids: The Roles of Endogenous Pyruvate and Lactate. Relevance to Inflammatory Joint Diseases. Free Radic. Res. 1997, 26, 19–35. [Google Scholar] [CrossRef]
- Lee, J.H.; Park, E.; Jin, H.J.; Lee, Y.; Choi, S.J.; Lee, G.W.; Chang, P.-S.; Paik, H.-D. Anti-Inflammatory and Anti-Genotoxic Activity of Branched Chain Amino Acids (BCAA) in Lipopolysaccharide (LPS) Stimulated RAW 264.7 Macrophages. Food Sci. Biotechnol. 2017, 26, 1371–1377. [Google Scholar] [CrossRef]
- Grosser, N.; Oberle, S.; Berndt, G.; Erdmann, K.; Hemmerle, A.; Schröder, H. Antioxidant Action of L-Alanine: Heme Oxygenase-1 and Ferritin as Possible Mediators. Biochem. Biophys. Res. Commun. 2004, 314, 351–355. [Google Scholar] [CrossRef]
- Sanada, F.; Taniyama, Y.; Muratsu, J.; Otsu, R.; Shimizu, H.; Rakugi, H.; Morishita, R. Source of Chronic Inflammation in Aging. Front. Cardiovasc. Med. 2018, 5, 12. [Google Scholar] [CrossRef]
- Singh, T.; Newman, A.B. Inflammatory Markers in Population Studies of Aging. Ageing Res. Rev. 2011, 10, 319–329. [Google Scholar] [CrossRef]
- Franceschi, C.; Campisi, J. Chronic Inflammation (Inflammaging) and Its Potential Contribution to Age-Associated Diseases. J. Gerontol.-Biol. Sci. Med. Sci. 2014, 69, S4–S9. [Google Scholar] [CrossRef]
- Chung, H.Y.; Cesari, M.; Anton, S.; Marzetti, E.; Giovannini, S.; Seo, A.Y.; Carter, C.; Yu, B.P.; Leeuwenburgh, C. Molecular Inflammation: Underpinnings of Aging and Age-Related Diseases. Ageing Res. Rev. 2009, 8, 18–30. [Google Scholar] [CrossRef]
- Cervellati, C.; Trentini, A.; Bosi, C.; Valacchi, G.; Morieri, M.L.; Zurlo, A.; Brombo, G.; Passaro, A.; Zuliani, G. Low-Grade Systemic Inflammation Is Associated with Functional Disability in Elderly People Affected by Dementia. GeroScience 2018, 40, 61–69. [Google Scholar] [CrossRef] [PubMed]
- Custodero, C.; Anton, S.D.; Beavers, D.P.; Mankowski, R.T.; Lee, S.A.; McDermott, M.M.; Fielding, R.A.; Newman, A.B.; Tracy, R.P.; Kritchevsky, S.B.; et al. The Relationship between Interleukin-6 Levels and Physical Performance in Mobility-Limited Older Adults with Chronic Low-Grade Inflammation: The enrgise Pilot Study. Arch. Gerontol. Geriatr. 2020, 90, 104131. [Google Scholar] [CrossRef]
- del Favero, S.; Roschel, H.; Solis, M.Y.; Hayashi, A.P.; Artioli, G.G.; Otaduy, M.C.; Benatti, F.B.; Harris, R.C.; Wise, J.A.; Leite, C.C.; et al. Beta-Alanine (CarnosynTM) Supplementation in Elderly Subjects (60–80 Years): Effects on Muscle Carnosine Content and Physical Capacity. Amino Acids 2012, 43, 49–56. [Google Scholar] [CrossRef]
- Stout, J.R.; Graves, B.S.; Smith, A.E.; Hartman, M.J.; Cramer, J.T.; Beck, T.W.; Harris, R.C. The Effect of Beta-Alanine Supplementation on Neuromuscular Fatigue in Elderly (55–92 Years): A Double-Blind Randomized Study. J. Int. Soc. Sports Nutr. 2008, 5, 21. [Google Scholar] [CrossRef]
- Ikeda, T.; Aizawa, J.; Nagasawa, H.; Gomi, I.; Kugota, H.; Nanjo, K.; Jinno, T.; Masuda, T.; Morita, S. Effects and Feasibility of Exercise Therapy Combined with Branched-Chain Amino Acid Supplementation on Muscle Strengthening in Frail and Pre-Frail Elderly People Requiring Long-Term Care: A Crossover Trial. Appl. Physiol. Nutr. Metab. 2016, 41, 438–445. [Google Scholar] [CrossRef]
- Bai, G.-H.; Tsai, M.-C.; Tsai, H.-W.; Chang, C.-C.; Hou, W.-H. Effects of Branched-Chain Amino Acid-Rich Supplementation on EWGSOP2 Criteria for Sarcopenia in Older Adults: A Systematic Review and Meta-Analysis. Eur. J. Nutr. 2021, 61, 637–651. [Google Scholar] [CrossRef]
- Trøseid, M.; Ueland, T.; Hov, J.R.; Svardal, A.; Gregersen, I.; Dahl, C.P.; Aakhus, S.; Gude, E.; Bjørndal, B.; Halvorsen, B.; et al. Microbiota-Dependent Metabolite Trimethylamine-N-Oxide Is Associated with Disease Severity and Survival of Patients with Chronic Heart Failure. J. Intern. Med. 2015, 277, 717–726. [Google Scholar] [CrossRef]
- Macpherson, M.E.; Hov, J.R.; Ueland, T.; Dahl, T.B.; Kummen, M.; Otterdal, K.; Holm, K.; Berge, R.K.; Mollnes, T.E.; Trøseid, M.; et al. Gut Microbiota-Dependent Trimethylamine N-Oxide Associates With Inflammation in Common Variable Immunodeficiency. Front. Immunol. 2020, 11, 574500. [Google Scholar] [CrossRef]
- Sun, X.; Jiao, X.; Ma, Y.; Liu, Y.; Zhang, L.; He, Y.; Chen, Y. Trimethylamine N-Oxide Induces Inflammation and Endothelial Dysfunction in Human Umbilical Vein Endothelial Cells via Activating ROS-TXNIP-NLRP3 Inflammasome. Biochem. Biophys. Res. Commun. 2016, 481, 63–70. [Google Scholar] [CrossRef]
- Chen, M.; Zhu, X.; Ran, L.; Lang, H.; Yi, L.; Mi, M. Trimethylamine-N-Oxide Induces Vascular Inflammation by Activating the NLRP3 Inflammasome Through the SIRT3-SOD2-mtROS Signaling Pathway. J. Am. Heart Assoc. 2017, 6, e006347. [Google Scholar] [CrossRef] [PubMed]
- Störk, S.; Feelders, R.A.; van den Beld, A.W.; Steyerberg, E.W.; Savelkoul, H.F.J.; Lamberts, S.W.J.; Grobbee, D.E.; Bots, M.L. Prediction of Mortality Risk in the Elderly. Am. J. Med. 2006, 119, 519–525. [Google Scholar] [CrossRef] [PubMed]
- Gao, X.; Gào, X.; Zhang, Y.; Holleczek, B.; Schöttker, B.; Brenner, H. Oxidative Stress and Epigenetic Mortality Risk Score: Associations with All-Cause Mortality among Elderly People. Eur. J. Epidemiol. 2019, 34, 451–462. [Google Scholar] [CrossRef]
- Hallan, S.I.; Matsushita, K.; Sang, Y.; Mahmoodi, B.K.; Black, C.; Ishani, A.; Kleefstra, N.; Naimark, D.; Roderick, P.; Tonelli, M.; et al. Age and Association of Kidney Measures With Mortality and End-Stage Renal Disease. JAMA 2012, 308, 2349. [Google Scholar] [CrossRef]
- Kamijo, Y.; Kanda, E.; Ishibashi, Y.; Yoshida, M. Sarcopenia and Frailty in PD: Impact on Mortality, Malnutrition, and Inflammation. Perit. Dial. Int. 2018, 38, 447–454. [Google Scholar] [CrossRef]
- Soukkio, P.K.; Suikkanen, S.A.; Aartolahti, E.M.; Kautiainen, H.; Kääriä, S.M.; Hupli, M.T.; Pitkälä, K.H.; Sipilä, S.; Kukkonen-Harjula, K.T. Effects of Home-Based Physical Exercise on Days at Home, Health Care Utilization, and Functional Independence Among Patients With Hip Fractures: A Randomized Controlled Trial. Arch. Phys. Med. Rehabil. 2021, 102, 1692–1699. [Google Scholar] [CrossRef]
- Soukkio, P.K.; Suikkanen, S.A.; Kukkonen-Harjula, K.T.; Kautiainen, H.; Hupli, M.T.; Aartolahti, E.M.; Kääriä, S.M.; Pitkälä, K.H.; Sipilä, S. Effects of a 12-month Home-based Exercise Program on Functioning after Hip Fracture—Secondary Analyses of an RCT. J. Am. Geriatr. Soc. 2022. [Google Scholar] [CrossRef]
- Granger, C.V.; Hamilton, B.B.; Keith, R.A.; Zielezny, M.; Sherwin, F.S. Advances in Functional Assessment for Medical Rehabilitation. Top. Geriatr. Rehabil. 1986, 1, 59–74. [Google Scholar] [CrossRef]
- Beckonert, O.; Keun, H.C.; Ebbels, T.M.D.; Bundy, J.; Holmes, E.; Lindon, J.C.; Nicholson, J.K. Metabolic Profiling, Metabolomic and Metabonomic Procedures for NMR Spectroscopy of Urine, Plasma, Serum and Tissue Extracts. Nat. Protoc. 2007, 2, 2692–2703. [Google Scholar] [CrossRef]
- Wishart, D.S.; Feunang, Y.D.; Marcu, A.; Guo, A.C.; Liang, K.; Vázquez-Fresno, R.; Sajed, T.; Johnson, D.; Li, C.; Karu, N.; et al. HMDB 4.0: The Human Metabolome Database for 2018. Nucleic Acids Res. 2018, 46, D608–D617. [Google Scholar] [CrossRef] [PubMed]
- Lundberg, P.; Vogel, T.; Malusek, A.; Lundquist, P.; Cohen, L.; Dahlqvist, O. MDL—The Magnetic Resonance Metabolomics Database (Mdl.Imv.Liu.Se). In Proceedings of the ESMRMB 2005 Congress, Basel, Switzerland, 15–18 September 2005. [Google Scholar]
- Fan, T.W.-M. Metabolite Profiling by One- and Two-Dimensional NMR Analysis of Complex Mixtures. Prog. Nucl. Magn. Reson. Spectrosc. 1996, 28, 161–219. [Google Scholar] [CrossRef]
- Bouatra, S.; Aziat, F.; Mandal, R.; Guo, A.C.; Wilson, M.R.; Knox, C.; Bjorndahl, T.C.; Krishnamurthy, R.; Saleem, F.; Liu, P.; et al. The Human Urine Metabolome. PLoS ONE 2013, 8, e73076. [Google Scholar] [CrossRef] [PubMed]
- Salek, R.M.; Steinbeck, C.; Viant, M.R.; Goodacre, R.; Dunn, W.B. The Role of Reporting Standards for Metabolite Annotation and Identification in Metabolomic Studies. Gigascience 2013, 2, 13. [Google Scholar] [CrossRef]
- Haug, K.; Cochrane, K.; Nainala, V.C.; Williams, M.; Chang, J.; Jayaseelan, K.V.; O’Donovan, C. MetaboLights: A Resource Evolving in Response to the Needs of Its Scientific Community. Nucleic Acids Res. 2019, gkz1019. [Google Scholar] [CrossRef]
- Schoenborn, N.L.; Van Pilsum Rasmussen, S.E.; Xue, Q.-L.; Walston, J.D.; McAdams-Demarco, M.A.; Segev, D.L.; Boyd, C.M. Older Adults’ Perceptions and Informational Needs Regarding Frailty. BMC Geriatr. 2018, 18, 46. [Google Scholar] [CrossRef] [PubMed]
- Chong, J.; Wishart, D.S.; Xia, J. Using MetaboAnalyst 4.0 for Comprehensive and Integrative Metabolomics Data Analysis. Curr. Protoc. Bioinform. 2019, 68, e86. [Google Scholar] [CrossRef] [PubMed]
Publisher’s Note: MDPI stays neutral with regard to jurisdictional claims in published maps and institutional affiliations. |
© 2022 by the authors. Licensee MDPI, Basel, Switzerland. This article is an open access article distributed under the terms and conditions of the Creative Commons Attribution (CC BY) license (https://creativecommons.org/licenses/by/4.0/).