
Relationships between Milk and Blood Biochemical Parameters and Metabolic Status in Dairy Cows during Lactation


Abstract
1. Introduction
2. Materials and Methods
2.1. Animals and Study Design
2.2. Blood Analysis
2.3. Milk Analysis
2.4. Statistical Analysis
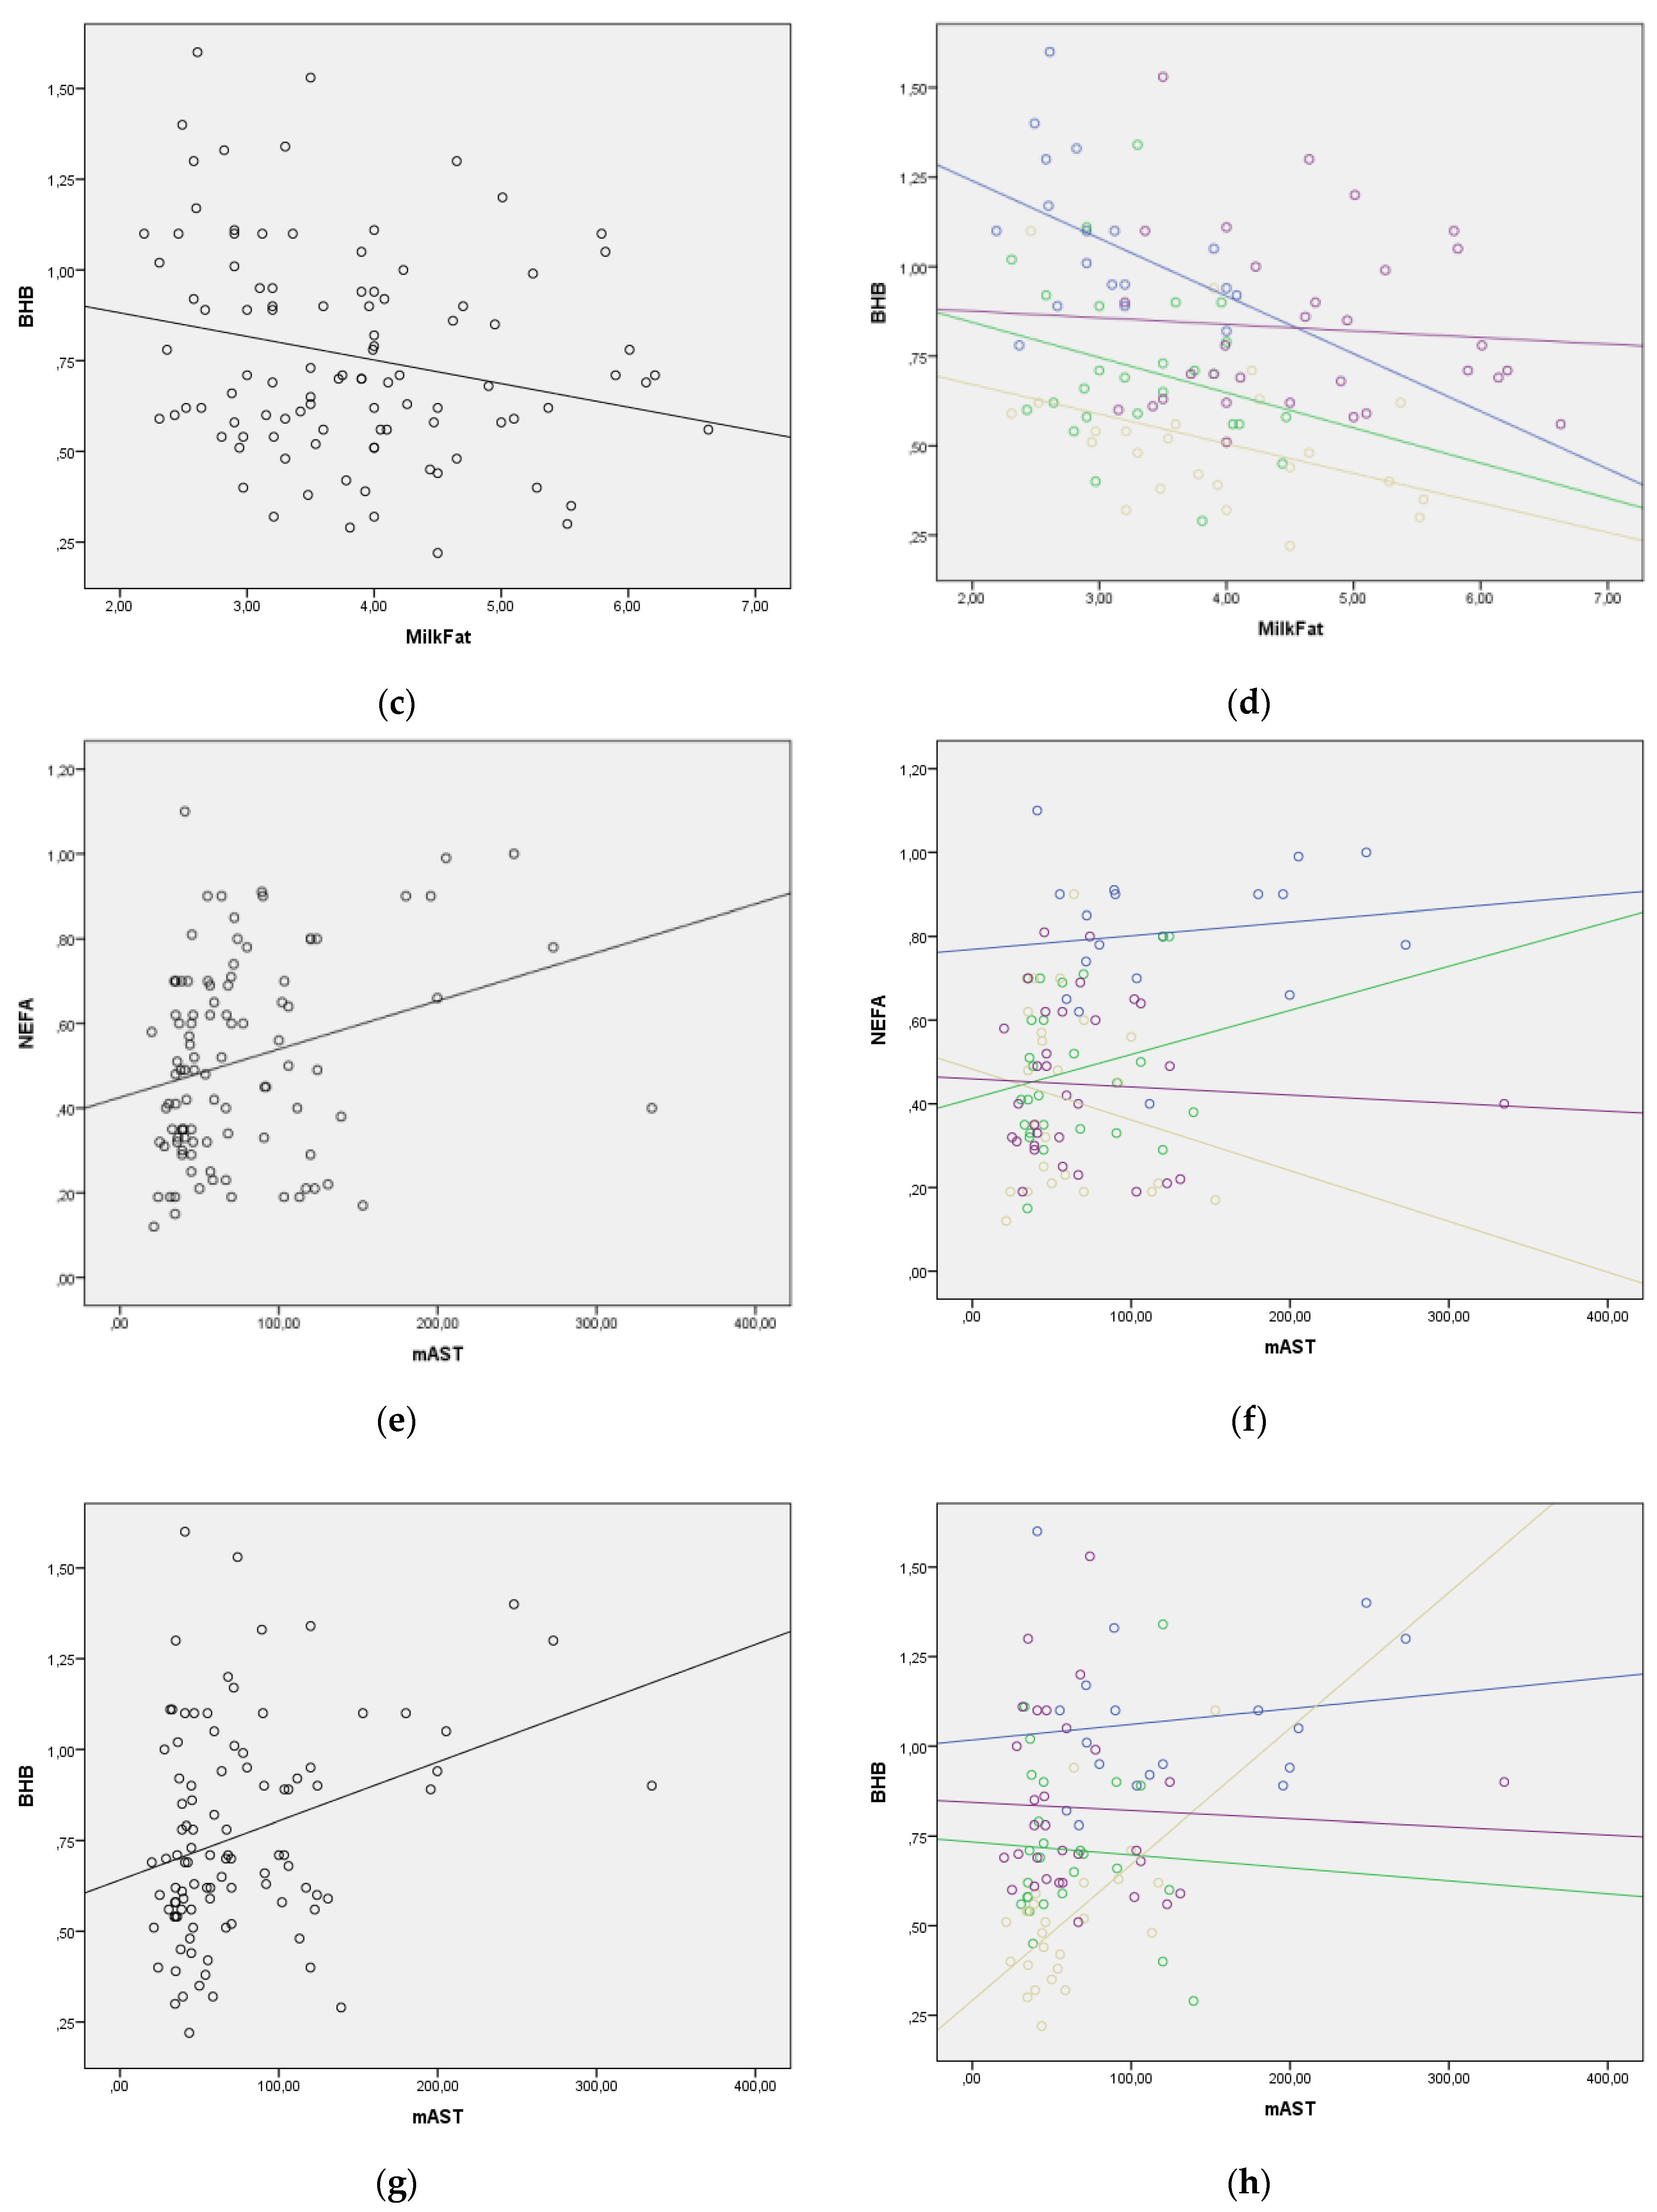
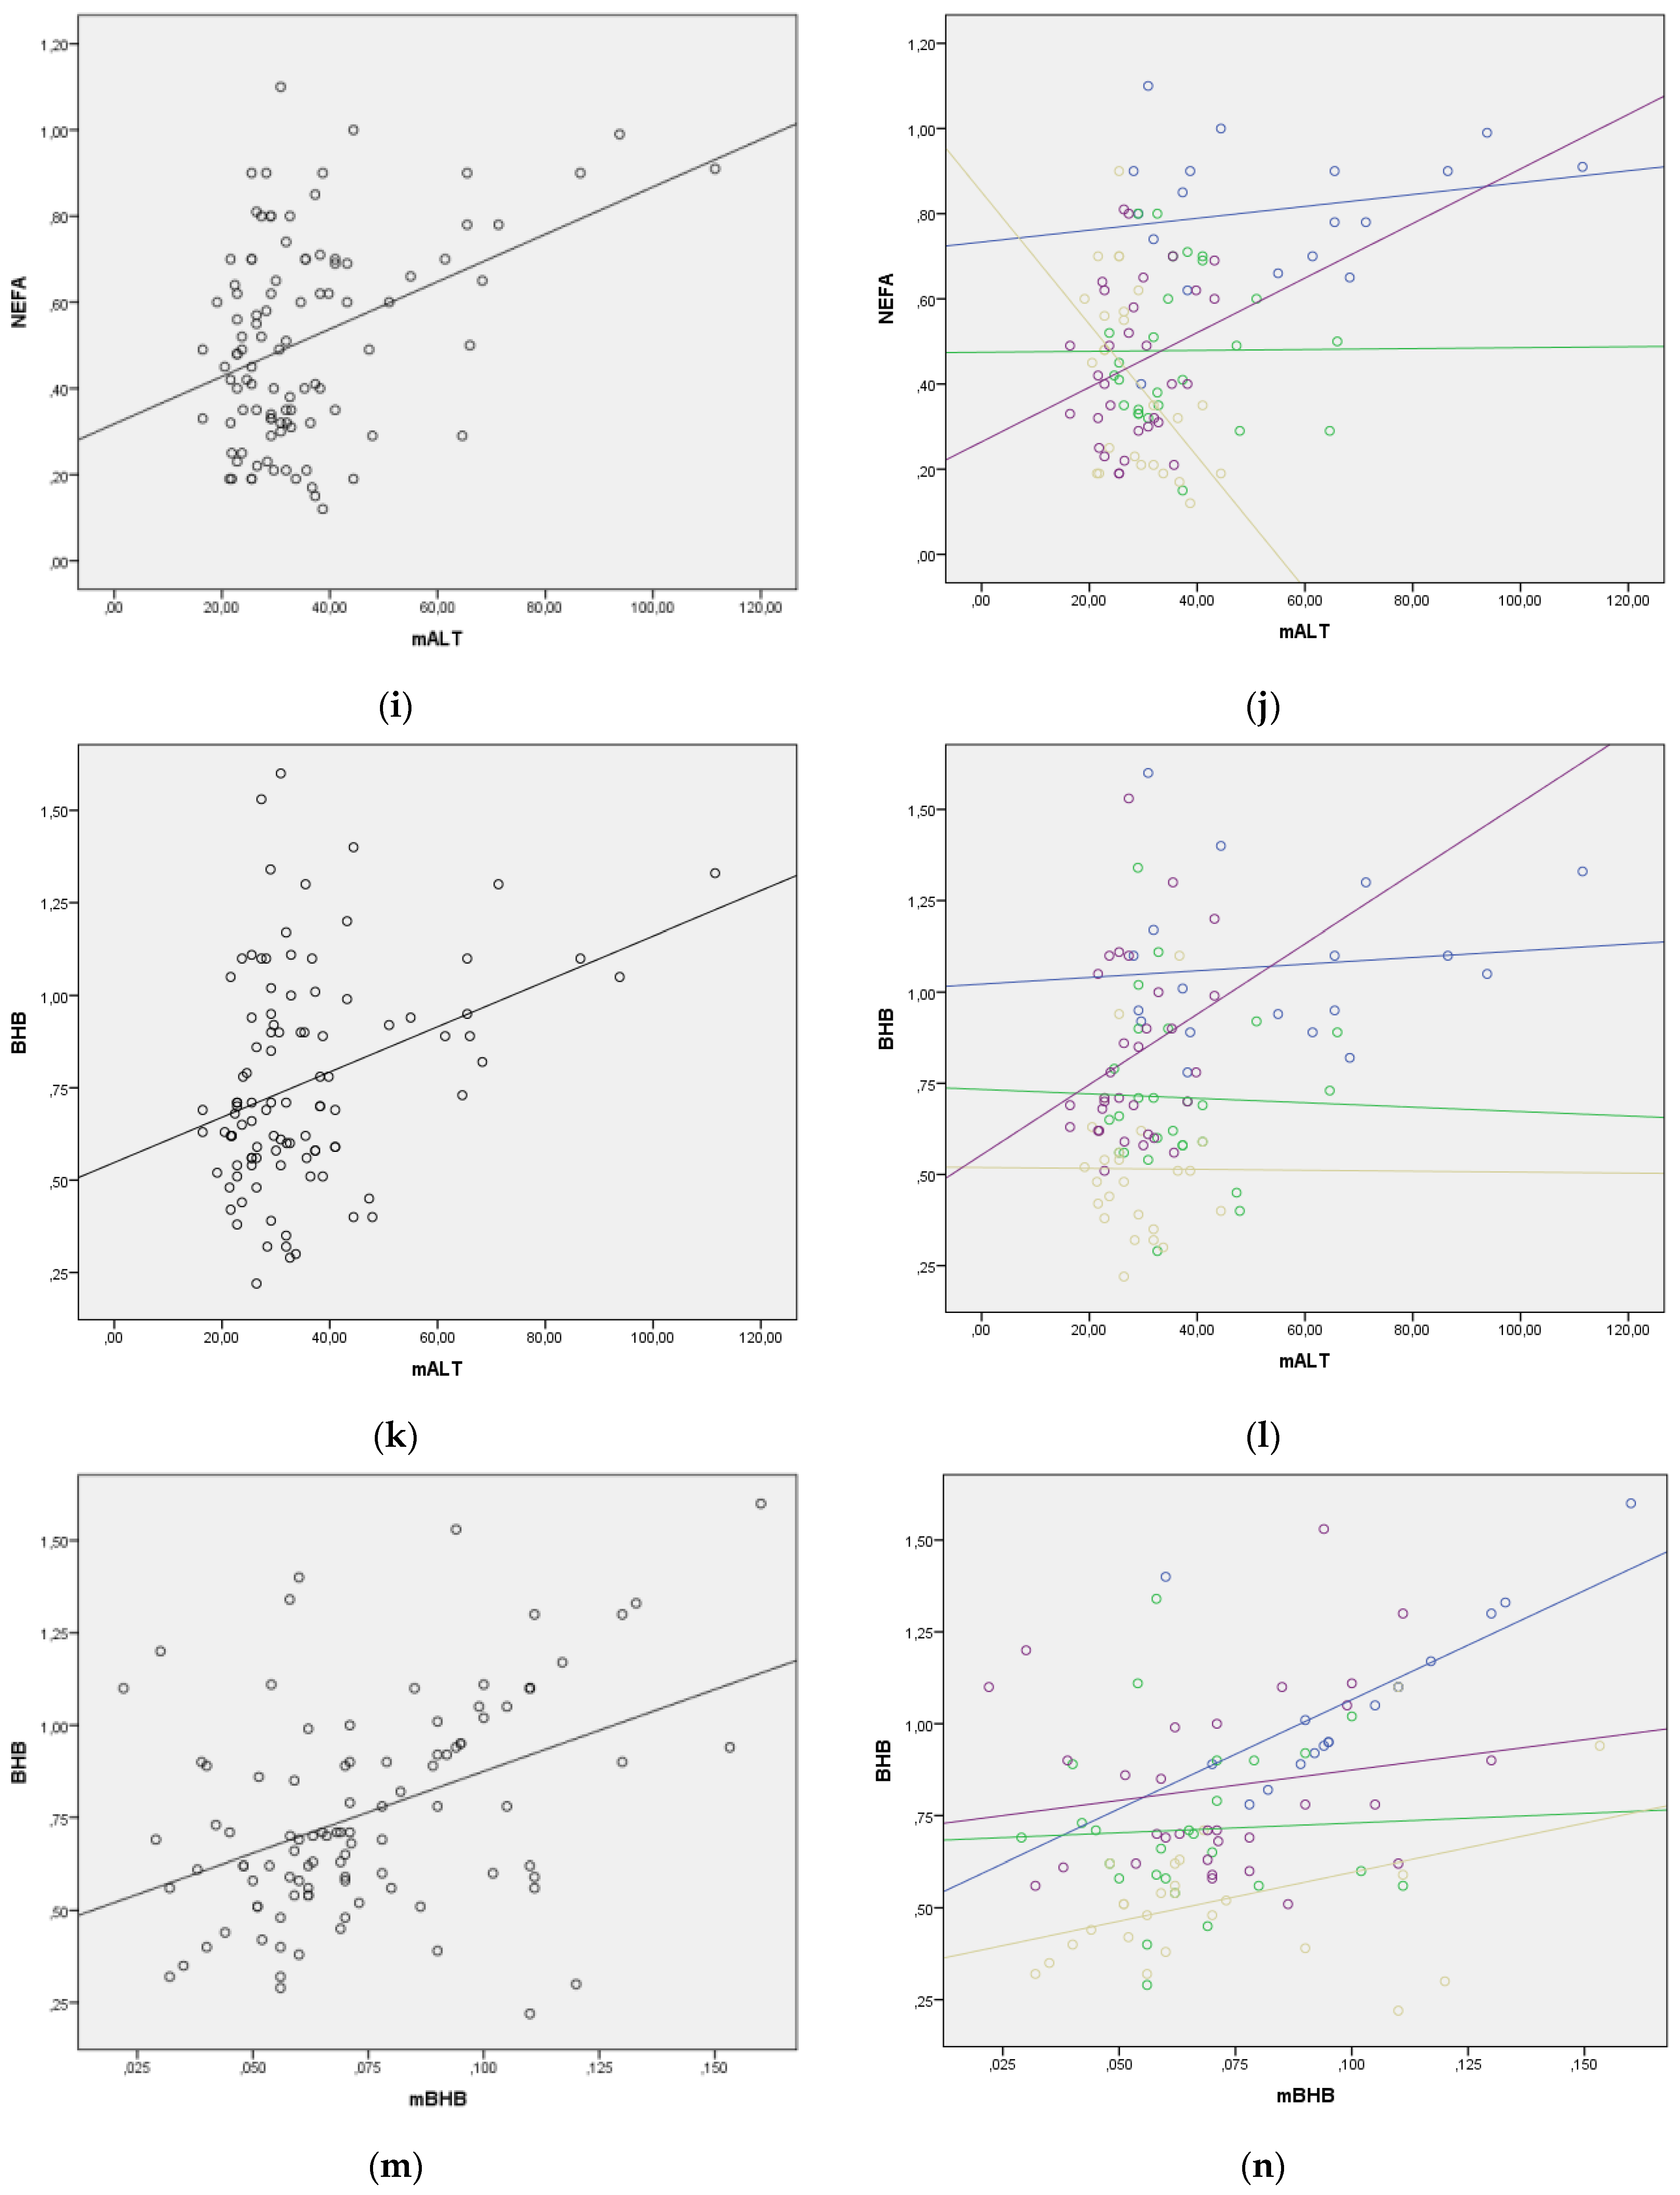
3. Results
4. Discussion
5. Conclusions
Author Contributions
Funding
Institutional Review Board Statement
Informed Consent Statement
Data Availability Statement
Conflicts of Interest
References
- Ospina, P.A.; Nydam, D.V.; Stokol, T.; Overton, T.R. Associations of elevated nonesterified fatty acids and β-hydroxybutyrate concentrations with early lactation reproductive performance and milk production in transition dairy cattle in the northeastern United States. J. Dairy Sci. 2010, 93, 1596–1603. [Google Scholar] [CrossRef] [PubMed]
- Brunner, N.; Groeger, S.; Raposo, J.C.; Bruckmaier, R.M.; Gross, J.J. Prevalence of subclinical ketosis and production diseases in dairy cows in Central and South America, Africa, Asia, Australia, New Zealand, and Eastern Europe. Trans. Anim. Sci. 2019, 3, 19–27. [Google Scholar] [CrossRef] [PubMed]
- Staufenbiel, R.; Gelfert, C.C. Metabolic profile test as a management tool in dairy herds. In Proceedings of the 5th Middle-European Buiatrics Congress, Hajduszoboszlo, Hungary, 2–5 June 2004; p. 721. [Google Scholar]
- Whitaker, D.A.; Macrae, A.I.; Burrough, E. Nutrition, fertility and dairy herd productivity. Cattle Pract. 2005, 13, 27–32. [Google Scholar]
- Cook, N.; Oetzelg, G.; Nordlund, K. Modern techniques for monitoring high-producing dairy cows 1. Practical applications. Practice 2006, 28, 598–603. [Google Scholar] [CrossRef]
- Le Blanc, S.J. Monitoring metabolic health of dairy cattle in transition period. J. Reprod. Dev. 2010, 56, 29–35. [Google Scholar] [CrossRef] [PubMed]
- Overton, T.R.; Waldron, M.R. Nutritional management of transition dairy cows: Strategies to optimize metabolic health. J. Dairy Sci. 2004, 87, E105–E119. [Google Scholar] [CrossRef]
- Bobe, G.; Young, J.W.; Beitz, D.C. Pathology, etiology, prevention, treatment of fatty liver in dairy cows. J. Dairy Sci. 2004, 87, 3105–3124. [Google Scholar] [CrossRef]
- Dann, H.M.; Morin, D.E.; Murphy, M.R.; Bollerog, A.; Drackely, J.K. Prepartum intake, postpartum induction of ketosis, and periparturient disorders affect the metabolic status of dairy cows. J. Dairy Sci. 2005, 88, 3249–3264. [Google Scholar] [CrossRef]
- Djokovic, R.; Cincovic, M.; Belic, B.; Toholj, B.; Davidov, I.; Hristovska, T. Relationship between blood metabolic hormones, metabolites and energy balance in Simmental dairy cows during peripartum period and lactation. Pak. Vet. J. 2015, 35, 163–167. [Google Scholar]
- Oetzel, G.R. Monitoring and testing dairy herds for metabolic disease. Vet. Clin. N. Am. Food Anim. Pract. 2004, 20, 651–674. [Google Scholar] [CrossRef]
- Gonzalez, F.D.; Murino, R.; Pereira, V.; Campos, R.; Benedito, J.L. Relationship among blood indicators of lipomobilization and hepatic function during early lactation in high yielding dairy cows. J. Vet. Sci. 2011, 12, 251–255. [Google Scholar] [CrossRef] [PubMed]
- Belić, B.; Cincović, M.; Lakić, I.; Đoković, R.; Petrović, M.; Ježek, J.; Starič, J. Metabolic status of dairy cows grouped by anabolic and catabolic indicators of metabolic stress in early lactation. Acta Sci. Vet. 2018, 46, 9. [Google Scholar] [CrossRef]
- Petrović, M.Ž.; Cincović, M.; Starič, J.; Djoković, R.; Belić, B.; Radinović, M.; Majkić, M.; Ilić, Z.Ž. The Correlation between Extracellular Heat Shock Protein 70 and Lipid Metabolism in a Ruminant Model. Metabolites 2022, 12, 19. [Google Scholar] [CrossRef] [PubMed]
- Giannuzzi, D.; Tessari, R.; Pegolo, S.; Fiore, E.; Gianesella, M.; Trevisi, E.; Ajmone MArsan, P.; Premi, M.; Piccioli-Cappelli, F.; Tagliapietra, F.; et al. Associations between ultrasound measurements and hematochemical parameters for the assessment of liver metabolic status in Holstein–Friesian cows. Sci. Rep. 2021, 11, 16314. [Google Scholar] [CrossRef] [PubMed]
- Schären, M.; Riefke, B.; Slopianka, M.; Keck, M.; Gruendemann, S.; Wichard, J.; Brunner, N.; Klein, S.; Snedec, T.; Theinert, K.B.; et al. Aspects of transition cow metabolomics—Part III: Alterations in the metabolome of liver and blood throughout the transition period in cows with different liver metabotypes. J. Dairy Sci. 2021, 104, 9245–9262. [Google Scholar] [CrossRef]
- Lubojacka, V.; Pechova, A.; Dvorak, R.; Drastich, P.; Kummer, V.; Poul, J. Liver steatosis following supplementation with fat in dairy cows diets. Acta Vet. Brno 2005, 74, 217–224. [Google Scholar] [CrossRef][Green Version]
- Stojevi, Z.; Piršljin, J.; Milinković-Tur, S.; Zdelar-Tuk, M.; Ljubić, B.B. Activities of AST, ALT and GGT in clinically healthy dairy cows during lactation and in the dry period. Vet. Arhiv 2005, 75, 67–73. [Google Scholar]
- Babaei, H.; Mansuori-Najand, L.; Molaei, M.M.; Kheradmand, A.; Sharifan, M. Assessment of lactate dehydrogenase, alkaline phosphatase and aspartate aminotransferase activities in cow’s milk as an indicator of subclinical mastitis. Vet. Res. Commun. 2007, 31, 419–425. [Google Scholar] [CrossRef]
- Katsoulos, P.D.; Christodoulopoulos, G.; Minas, A.; Karatzia, M.A.; Pourliotis, K.; Kritas, S.K. The role of lactate dehydrogenase, alkaline phosphatase and aspartate aminotransferase in the diagnosis of subclinical intramammary infections in dairy sheep and goats. J. Dairy Res. 2010, 77, 107–111. [Google Scholar] [CrossRef]
- Liu, P.; He, B.X.; Yang, X.L.; Hou, X.L.; Han, J.B.; Han, Y.H.; Nie, P.; Deng, H.F.; Du, X.H. Bioactivity evaluation of certain hepatic enzymes in blood plasma and milk of Holstein cows. Pak. Vet. J. 2012, 32, 601–604. [Google Scholar]
- Liu, P.; Hou, L.X.; Nie, P.; Aahan, H.Y.; Hoang, F.Y.; Zoun, X.Z.; Deng, F.H.; Song, P.; Li, M.; Xiang, H.B. Dynamic Monitoring of ALT and correlation analysis in blood plasma and milk of Holstein cows. Agric. J. 2013, 8, 51–55. [Google Scholar] [CrossRef]
- Ghadaa, E.M. Investigation of some enzymes level in blood and milk serum in two stages of milk yield dairy cows at Assiut city. Assiut Vet. Med. J. 2014, 60, 110–120. [Google Scholar] [CrossRef]
- Jozwik, A.; Strzalkowska, N.; Bagnicka, E.; Grzybek, W.; Krzyzewski, J.; Polowska, E.; Kolataj, A.; Horbanczuk, J.O. Relationship between milk yield, stage of lactation, and some blood serum metabolic parameters of dairy cows. Czech. J. Anim. Sci. 2012, 57, 353–360. [Google Scholar] [CrossRef]
- Djoković, R.; Cincović, M.; Ilić, Z.; Kurćubić, V.; Andjelić, B.; Petrović, M.; Lalić, N.; Jašović, B. Relationships between contents of biochemical metabolites in blood and milk in dairy cows during transition and mid lactation. Int. J. Appl. Res. Vet. Med. 2019, 17, 1–9. [Google Scholar]
- Pires, J.A.A.; Larsen, T.; Leroux, C. Milk metabolites and fatty acids as noninvasive biomarkers of metabolic status and energy balance in early-lactation cows. J. Dairy Sci. 2022, 105, 201–220. [Google Scholar] [CrossRef]
- Bondan, C.; Folchini, J.A.; Guimarães, L.; Noro, M.; Zanella, R.; Alves, L.P.; Fontaneli, R.S.; Gonzalez, F. Milk yield and composition in dairy cows with post-partum disorders. Arq. Bras. Med. Vet. Zootec. 2021, 73, 639–646. [Google Scholar] [CrossRef]
- Benedet, A.; Manuelian, C.L.; Zidi, A.; Penasa, M.; De Marchi, M. Invited review: β-hydroxybutyrate concentration in blood and milk and its associations with cow performance. Animal 2019, 13, 1676–1689. [Google Scholar] [CrossRef]
- Churakov, M.; Karlsson, J.; Edvarsson-Rasmussen, A.; Holtenius, K. Milk fatty acids as indicators of negative energy balance of dairy cows in early lactation. Animal 2012, 15, 100253. [Google Scholar] [CrossRef] [PubMed]
- Brinez, W.J.; Valbuena, E.; Castro, G.; Tovar, A.; Ruiz, R.J.; Roman, R. Effects of breed, season, lactation stage and parity number on composition of raw milk of crossbreed cows. Rev. Cietifica 2003, 13, 490–498. [Google Scholar]
- NRC (National Research Council). Nutrient Requirements of Dairy Cattle, 7th ed.; National Academy Press: Washington, DC, USA, 2001. [Google Scholar]
- Radostits, O.M.; Blood, D.C.; Gay, C.C.; Hinchcliff, K.W. Veterinary Medicine, A Textbook of the Diseases of Cattle, Sheep, Pigs, Goats and Horses, 9th ed.; W.B. Saunders Company Ltd.: London, UK; New York, NY, USA; Philadelphia, PA, USA; San Francisco, CA, USA; St. Louis, MO, USA; Sydney, Australia, 2007. [Google Scholar]
- Reist, M.; Erdin, D.; Von Euw, D.; Tschuemperlin, K.; Leunberger, H.; Chiliard, Y.; Hammon, H.M.; Morel, C.; Philipona, C.; Zbinden, Y.; et al. Estimation of energy balance at the individual and herd level using blood and milk traits in high-yielding dairy cows. J. Dairy Sci. 2002, 85, 3314–3327. [Google Scholar] [CrossRef]
- Cincović, M.R.; Belić, B.; Radojičić, B.; Hristov, S.; Đoković, R. Influence of lipolysis and ketogenesis to metabolic and hematological parameters in dairy cows during periparturient period. Acta Vet. 2012, 62, 429–444. [Google Scholar] [CrossRef]
- Lakić, I.; Cincović, M.R.; Belić, B.; Đoković, R.; Majkić, M.; Petrović, M.Ž.; Nikolić, S. Lipolysis and ketogenesis in cows in early lactation. Acta Agric. Serb. 2018, 23, 265–276. [Google Scholar] [CrossRef]
- Duffield, T. Subclinical ketosis in lactating dairy cattle. Vet. Clin. N. Am. Food Anim. Pract. 2000, 16, 231–253. [Google Scholar] [CrossRef]
- Ježek, J.; Cincović, M.R.; Nemec, M.; Belić, B.; Djoković, R.; Klinkon, M.; Starič, J. Beta-hydroxybutyrate in milk as screening test for subclinical ketosis in dairy cows. Pol. J. Vet. Sci. 2017, 20, 507–512. [Google Scholar] [CrossRef]
- McFadden, J.W. Lipid biology in the periparturient dairy cow: Contemporary perspectives. Animal 2020, 14, s165–s175. [Google Scholar] [CrossRef] [PubMed]
- Mezzetti, M.; Bionaz, M.; Trevisi, E. Interaction between inflammation and metabolism in periparturient dairy cows. J. Anim. Sci. 2020, 98, S155–S174. [Google Scholar] [CrossRef]
- Civelek, T.; Aydin, I.; Cingi, C.C.; Yilmaz, O.; Kabu, M. Serum non-esterified fatty acids and beta-hydroxybutyrate in dairy cows with retained placenta. Pak. Vet. J. 2011, 31, 341–344. [Google Scholar]
- Drackley, J.K.; Dann, H.M.; Douglas, G.N.; Janovick-Gurtzky, N.A.; Lutherland, N.B.; Underwood, J.P.; Loor, J. Physiological and pathological adaptations in dairy cows that may increase susceptibility to periparturient diseases and disorders. Ital. J. Anim. Sci. 2005, 4, 323–344. [Google Scholar] [CrossRef]
- Gross, J.; Van Dorland, H.A.; Bruckmaiker, R.M.; Schwar, F.J. Performance and metabolic profile of dairy cows during a lactation and deliberately induced negative energy balance with subsequent realimentation. J. Dairy Sci. 2011, 94, 1820–1830. [Google Scholar] [CrossRef]
- Stang, B.D.; Bertics, S.J.; Grummer, R.R.; Armentanol, E. Effect of long chain fatty acids on triglycerides accumulation, gluconeogenesis and ureogenesis in bovine hepatocytes. J. Dairy Sci. 1998, 81, 728–739. [Google Scholar] [CrossRef]
- Sevinc, M.; Basoglu, A.; Guzulbekta, H. Lipid and lipoprotein levels in dairy cows with fatty liver. Turk. J. Vet. Anim. Sci. 2003, 27, 295–299. [Google Scholar]
- Djoković, R.; Ilić, Z.; Kurćubić, V.; Petrović, M.; Dosković, D. Functional and morphological state of the liver in Simmental dairy cows during transitional period. Rev. Méd. Vét. 2011, 162, 574–579. [Google Scholar]
- Pechova, A.; Llek, J.; Halouzka, R. Diagnosis and control of the development of hepatic lipidosis in dairy cows in the peri-parturient period. Acta Vet. Brno 1997, 66, 235–243. [Google Scholar] [CrossRef]
- Djoković, R.; Cincović, M.; Ilić, Z.; Kurćubić, V.; Fratrić, N.; Petrović, M.; Andjelić, B. The correlations between serum enzyme activities in blood and milk in the different stage of lactation in Holstein dairy cows. In Proceedings of the 30th World Buiatrics Congress, Sapporo, Japan, 28 August–1 September 2018; p. 305. [Google Scholar]
- Nozad, S.; Ramin, A.G.; Moghadam, G. Diurnal variations in milk, urea, protein and lactose concentrations in Holstein dairy cows. Acta Vet. 2011, 61, 3–12. [Google Scholar] [CrossRef]
- Nozad, S.; Ramin, A.G.; Moghadam, G.; Rezaei, S.A.; Babapour, A.; Ramin, S. Relationship between blood urea, protein, creatinine, triglycerides and macro-mineral concentrations with the quality and quantity of milk in dairy Holstein cows. Vet. Res. Forum 2007, 3, 55–59. [Google Scholar]
- Hamann, J.; Kromker, V. Potential of specific milk composition variables for cow health management. Livest. Prod. Sci. 1997, 48, 201–208. [Google Scholar] [CrossRef]
- Liu, Q.; Wang, C.; Guo, G.; Huo, W.J.; Zhang, S.L.; Pei, C.X.; Zhang, Y.L.; Wang, H. Effects of branched-chain volatile fatty acids on lactation performance and mRNA expression of genes related to fatty acid synthesis in mammary gland of dairy cows. Animal 2018, 12, 2071–2079. [Google Scholar] [CrossRef]
- Mordak, R.; Kupczyński, R.; Kuczaj, M.; Niżański, W. Analysis of correlations between selected blood markers of liver function and milk composition in cows during late lactation period. Ann. Anim. Sci. 2020, 20, 871–886. [Google Scholar] [CrossRef]
- Mäntysaari, P.; Mäntysaari, E.A.; Kokkonen, T.; Mehtiö, T.S.; Kajava, S.; Grelet, C.; Lidauer, P.; Lidauer, M.H. Body and milk traits as indicators of dairy cow energy status in early lactation. J. Dairy Sci. 2019, 102, 7904–7916. [Google Scholar] [CrossRef]
- Woolpert, M.E.; Dann, H.M.; Cotanch, K.W.; Melilli, C.; Chase, L.E.; Grant, R.J.; Barbano, D.M. Management, nutrition, and lactation performance are related to bulk tank milk de novo fatty acid concentration on northeastern US dairy farms. J. Dairy Sci. 2016, 99, 8486–8497. [Google Scholar] [CrossRef]
- Komisarek, J.; Stefańska, B.; Nowak, W. The effect of ruminal fluid pH on milk fatty acids composition in cattle. Ann. Anim. Sci. 2022, 22, 625–631. [Google Scholar] [CrossRef]
- Mäntysaari, P.; Juga, J.; Lidauer, M.H.; Häggman, J.; Mehtiö, T.; Christensen, J.M.; Mäntysaari, E.A. The relationships between early lactation energy status indicators and endocrine fertility traits in dairy cows. J. Dairy Sci. 2022, 105, 6833–6844. [Google Scholar] [CrossRef] [PubMed]
- Nishiura, A.; Sasaki, O.; Tanigawa, T.; Kubota, A.; Takeda, H.; Saito, Y. Prediction of energy balance from milk traits of Holsteins in Japan. Anim. Sci. J. 2022, 93, e13757. [Google Scholar] [CrossRef]
- Eicher, R. Evaluation of the metabolic and nutritional situation in dairy herds: Diagnostic use of milk components. In Proceedings of the World Buiatrics Congress, Quebec City, QC, Canada, 11–16 July 2004. [Google Scholar]
- Jenkins, T.N.; Gustavo Peña, G.; Carlos Risco, C. Utility of in line milk fat and protein ratio to diagnose subclinical ketosis and to assign propylene glycol treatment in lactating dairy cows. Can. Vet. J. 2015, 56, 850–854. [Google Scholar] [PubMed]
- Sammad, A.; Khan, M.Z.; Abbas, Z.; Hu, L.; Ullah, Q.; Wang, Y.; Zhu, H.; Wang, Y. Major Nutritional Metabolic Alterations Influencing the Reproductive System of Postpartum Dairy Cows. Metabolites 2022, 12, 60. [Google Scholar] [CrossRef] [PubMed]
- Tinkovicova-Lackova, P.; Maskalova, M.; Vajda, V. Evaluation of the milk urea content in relation to milk production and composition in dairy cows. Acta Vet. Brno 2019, 88, 277–285. [Google Scholar] [CrossRef]
- Jilek, F.; Rehak, D.; Volek, J.; Stipkova, M.; Nemcova, E.; Fiedlerova, M.; Rajmon, A.R.; Svetskova, D. Effect of herd, parity stage of lactation and milk yield on urea concentration in milk. Czech. J. Anim. Sci. 2006, 51, 510–517. [Google Scholar] [CrossRef]
- Chladek, G.; Machal, L. Blood plasma urea concentration and its relationship with milk production parameters in Czech pied cows. J. Cent. Euro. Agric. 2004, 5, 337–346. [Google Scholar]
- Henao-Velasquez, A.P.; Munera-Bedoya, O.D.; Herrera, A.C.; Aqudelo-Trujillo, J.H.; Cenon–Munoz, M.F. Lactose and milk urea nitrogen, fluctuations during lactation in Holstein cows. R. Bras. Zootec. 2014, 43, 479–484. [Google Scholar] [CrossRef]
- Giannuzzi, D.; Mota, L.F.M.; Pegolo, S.; Gallo, L.; Schiavon, S.; Tagliapietra, F.; Katz, G.; Fainboym, D.; Minuti, A.; Trevisi, E.; et al. In-line near-infrared analysis of milk coupled with machine learning methods for the daily prediction of blood metabolic profile in dairy cattle. Sci. Rep. 2022, 12, 8058. [Google Scholar] [CrossRef]


| Blood Parameters | Lactation Period | ANOVA | LSD | |||
|---|---|---|---|---|---|---|
| Early (1) | Mid (2) | Full (3) | Late (4) | |||
| Glucose (mmol/L) | 1.91 ± 0.73 | 2.34 ± 0.44 | 2.58 ± 0.73 | 2.74 ± 0.74 | p < 0.01 | 1:2,1:3,1:4, 2:4 |
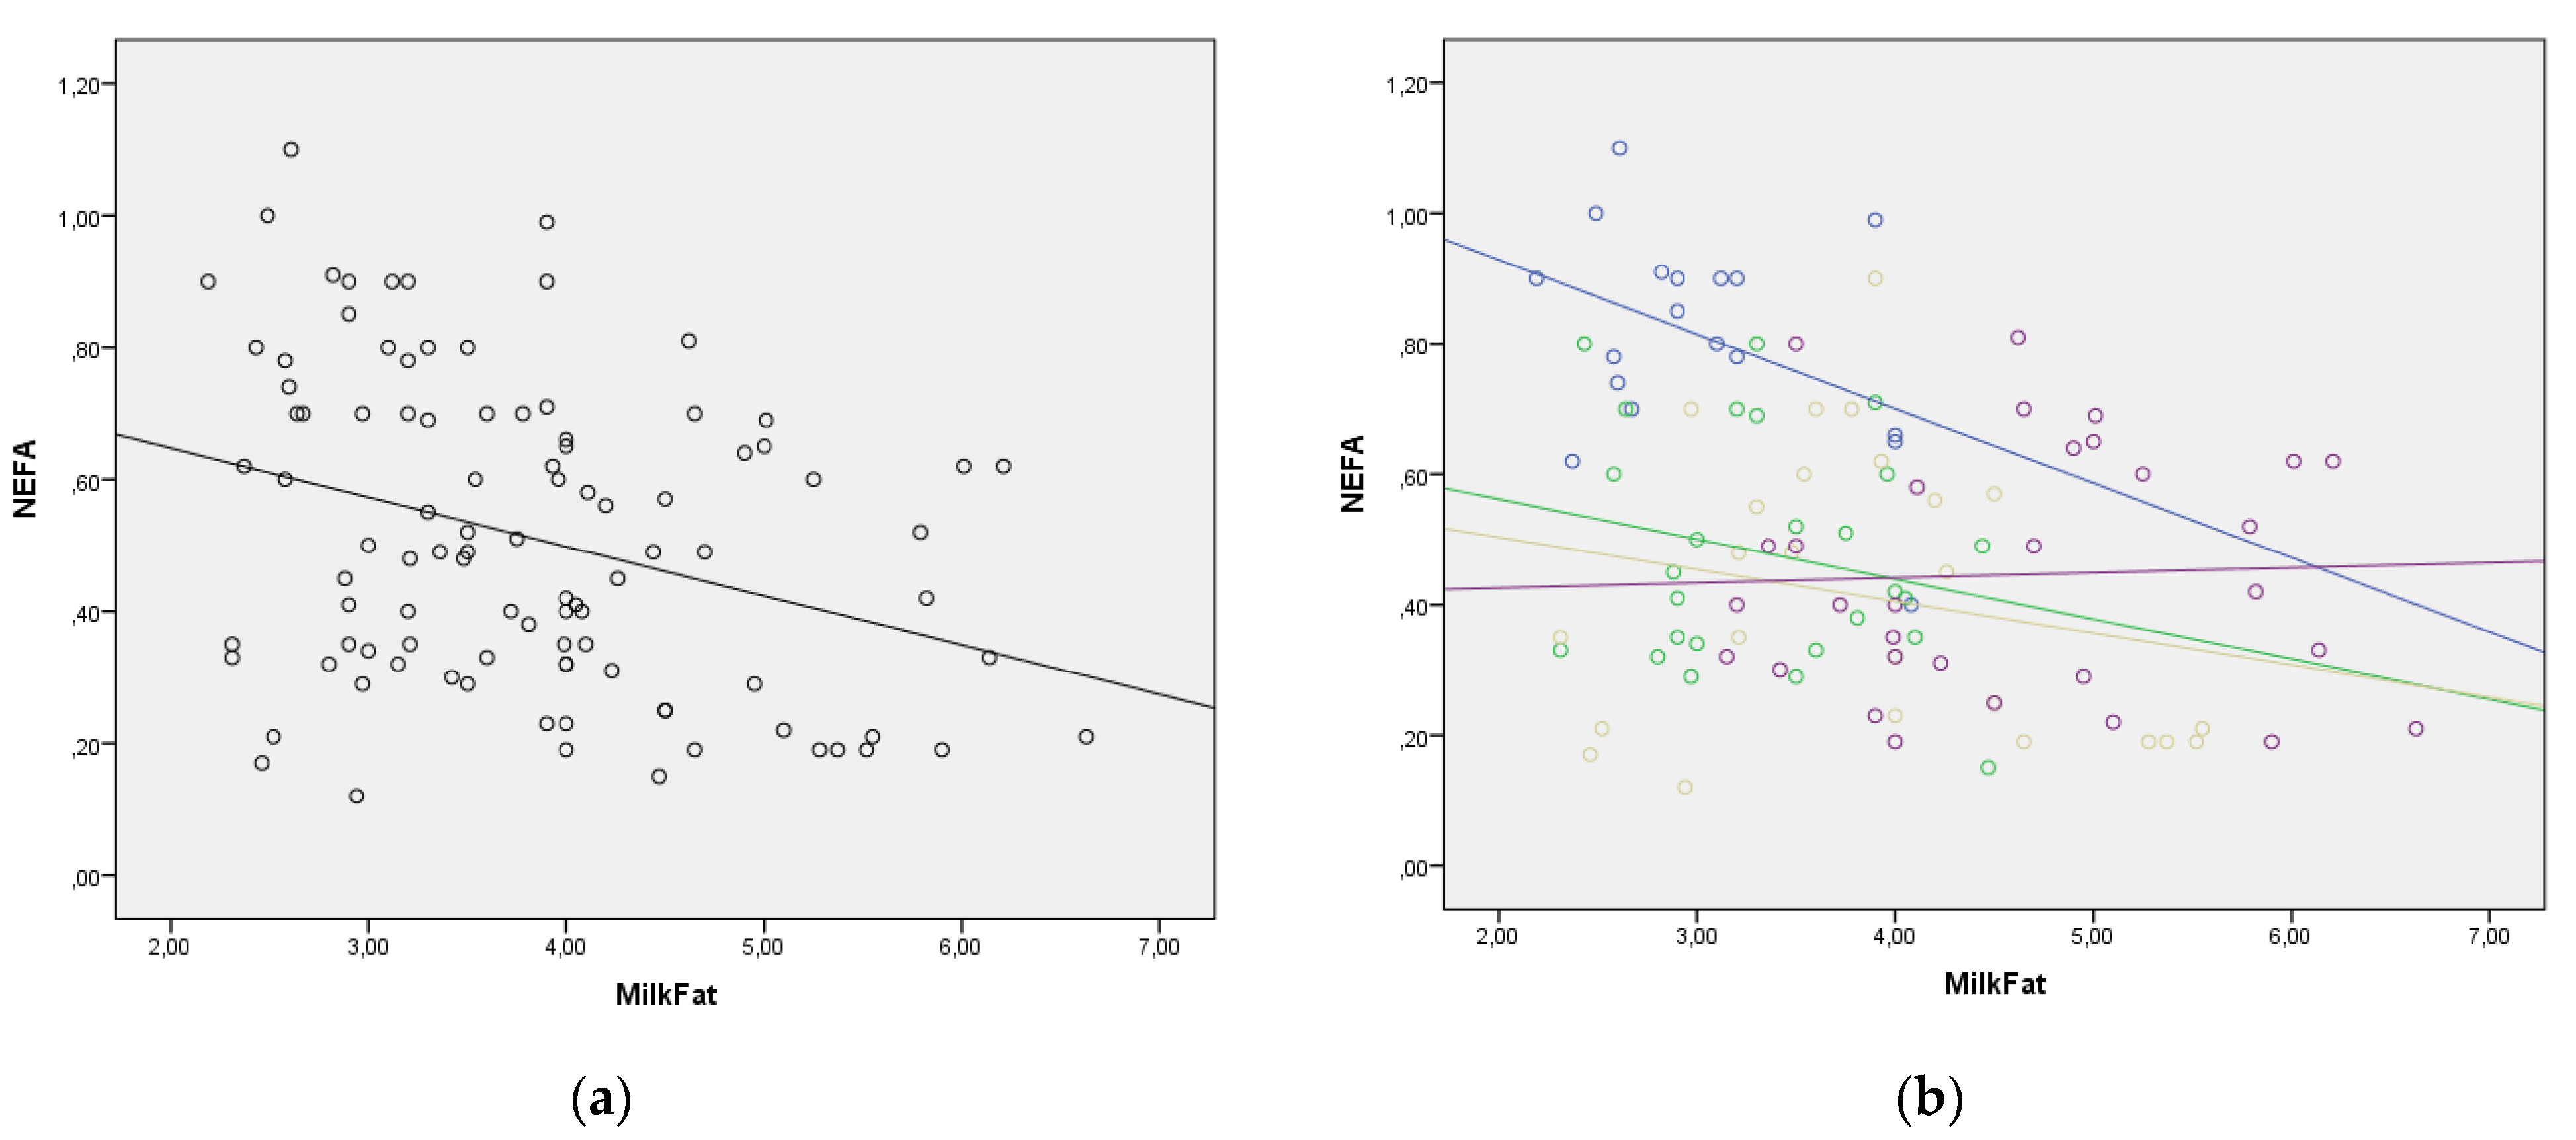
| NEFA (mmol/L) | 0.81 ± 0.16 | 0.48 ± 0.17 | 0.41 ± 0.22 | 0.44 ± 0.18 | p < 0.001 | 1:2,1:3,1:4 |
| TG (mmol/L) | 0.11 ± 0.06 | 0.17 ± 0.06 | 0.18 ± 0.06 | 0.19 ± 0.08 | p < 0.001 | 1:2,1:3,1:4 |
| TChol (mmol/L) | 3.03 ± 0.91 | 4.14 ± 1.12 | 4.02 ± 1.56 | 4.02 ± 1.56 | p < 0.01 | 1:2,1:3,1:4 |
| BHB (mmol/L) | 1.07 ± 0.22 | 0.71 ± 0.23 | 0.52 ± 0.19 | 0.82 ± 0.25 | p < 0.001 | 1:2,1:3,1:4, 2:3, 3:4 |
| TP (g/L) | 63.1 ± 6.8 | 68.2 ± 6.2 | 73.94 ± 6.53 | 68.9 ± 5.54 | p < 0.001 | 1:2,1:3,1:4, 2:3,3:4 |
| Albumin (g/L) | 28.8 ± 5.11 | 31.9 ± 5.1 | 31.8 ± 6.4 | 31.6 ± 4.34 | NS | / |
| Globulin (g/L) | 34.3 ± 7.6 | 36.3 ± 6.4 | 42.1 ± 8.7 | 37.4 ± 6.4 | p < 0.01 | 1:3,2:3,3:4 |
| Urea (mmol/L) | 3.23 ± 0.91 | 4.50 ± 1.39 | 4.56 ± 0.91 | 4.33 ± 1.45 | p < 0.01 | 1:2,1:3,1:4 |
| TBil (µmol/L) | 20.42 ± 11.24 | 6.41 ± 5.03 | 5.84 ± 4.39 | 7.06 ± 2.61 | p < 0.001 | 1:2,1:3,1:4 |
| AST (IU/L) | 134.8 ± 37.3 | 100.90 ± 30.1 | 99.00 ± 37 | 95.20 ± 31.7 | p < 0.001 | 1:2,1:3,1:4 |
| ALT (IU/L) | 59.16 ± 19.87 | 36.00 ± 9.46 | 28.60 ± 5.63 | 28.64 ± 6.85 | p < 0.001 | 1:2,1:3,1:4,2:3,2:4 |
| LDH (IU/L) | 1795 ± 942 | 1647 ± 329 | 1389 ± 224 | 1312 ± 285 | p < 0.001 | 1:3,1:4, 2:4 |
| ALP (IU/L) | 108.17 ± 27.9 | 85.88 ± 16.7 | 75.84 ± 15.8 | 71.00 ± 18.3 | p < 0.001 | 1:2,1:3,1:4 |
| GGT (IU/L) | 24.61 ± 6.1 | 21.19 ± 6.1 | 23.24 ± 10.8 | 27.19 ± 6.6 | p < 0.05 | 2:4 |
| Milk Parameters | Lactation Period | ANOVA | LSD | |||
|---|---|---|---|---|---|---|
| Early (1) | Mid (2) | Full (3) | Late (4) | |||
| Fat (%) | 3.04 ± 0.59 | 3.35 ± 0.61 | 3.87 ± 0.53 | 4.16 ± 0.59 | p < 0.001 | 1:3,1:4,2:3,2:4,3:4 |
| Protein (%) | 3.24 ± 0.50 | 2.94 ± 0.23 | 3.09 ± 0.22 | 3.40 ± 0.41 | p < 0.001 | 1:2,2:4,3:4 |
| Lactose (%) | 4.75 ± 0.09 | 4.92 ± 0.1 | 4.82 ± 0.1 | 4.69 ± 0.11 | p < 0.001 | 1:2,2:4,3:4 |
| Urea (mg/dL) | 10.84 ± 6.88 | 14.24 ± 5.96 | 12.72 ± 4.31 | 14.2 ± 6.86 | NS | / |
| AST (IJ/L) | 125.7 ± 71.7 | 62.3 ± 35.1 | 59.1 ± 32.4 | 69.6 ± 58.1 | p < 0.001 | 1:2,1:3,1:4 |
| ALT (IJ/L) | 54.8 ± 24.9 | 36.3 ± 11.2 | 28.3 ± 6.9 | 28.4 ± 7.03 | p < 0.001 | 1:2,1:3,1:4,2:3,2:4 |
| ALP (IJ/L) | 947.1 ± 543.3 | 629.5 ± 338.5 | 568.2 ± 325.8 | 670.8 ± 358.7 | p < 0.05 | 1:2,1:3,1:4,2:4,3:4 |
| GGT (IJ/L) | 561.9 ± 217.1 | 446.9 ± 161.7 | 571.3 ± 325.8 | 670.8 ± 135.9 | p < 0.01 | 2:3,2:4 |
| LDH (IJ/L) | 316.4 ± 156.4 | 205.6 ± 132.6 | 200.6 ± 123.2 | 213.6 ± 117.1 | p < 0.05 | 1:2,1:3,1:4 |
| BHB (mmol/L) | 0.10 ± 0.02 | 0.06 ± 0.02 | 0.09 ± 0.01 | 0.07 ± 0.02 | NS | / |
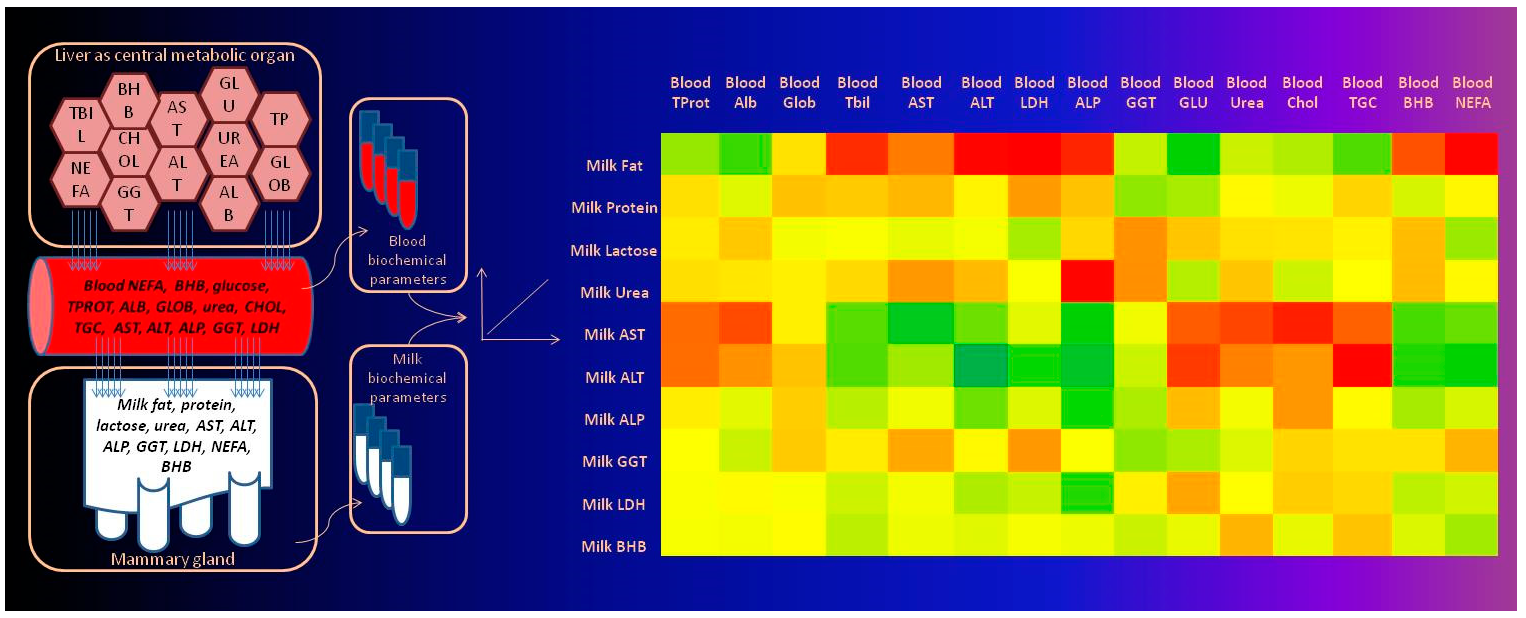
| Correlation | Milk Fat | Milk Protein | Milk Lactose | Milk AST | Milk ALT | Milk ALP | Milk GGT | Milk LDH | Milk BHB | Milk Urea |
|---|---|---|---|---|---|---|---|---|---|---|
| Blood TP | 0.201 * | −0.039 | −0.023 | −0.194 | −0.191 | −0.022 | 0.007 | 0.016 | 0.019 | −0.04 |
| BloodAlbumin | 0.322 ** | 0.064 | −0.071 | −0.236* | −0.144 | 0.063 | 0.109 | −0.003 | 0.027 | −0.029 |
| BloodGlobulin | −0.037 | −0.081 | 0.028 | −0.016 | −0.078 | −0.064 | −0.069 | 0.017 | −0.001 | −0.016 |
| Blood TBil | −0.273 ** | −0.068 | 0.014 | 0.291 ** | 0.299 ** | 0.141 | −0.023 | 0.105 | 0.136 | −0.048 |
| Blood AST | −0.173 | −0.094 | 0.052 | 0.450 ** | 0.185 | 0.035 | −0.115 | 0.029 | 0.043 | −0.135 |
| Blood ALT | −0.323 ** | −0.011 | 0.025 | 0.266 ** | 0.649 ** | 0.262** | −0.004 | 0.161 | 0.065 | −0.089 |
| Blood LDH | −0.338 ** | −0.133 | 0.171 | 0.06 | 0.347 ** | 0.073 | −0.135 | 0.116 | 0.022 | 0.011 |
| Blood ALP | −0.282 ** | −0.08 | −0.049 | 0.399 ** | 0.492 ** | 0.343** | 0.01 | 0.338 ** | 0.039 | −0.322 ** |
| Blood GGT | 0.12 | 0.212 * | −0.143 | 0.036 | 0.107 | 0.163 | 0.211 * | −0.017 | 0.112 | −0.147 |
| Blood Glucose | 0.393 ** | 0.173 | −0.076 | −0.214 * | −0.256 * | −0.087 | 0.163 | −0.118 | 0.047 | 0.145 |
| Blood Urea | 0.114 | −0.005 | −0.038 | −0.242 * | −0.166 | 0.03 | 0.07 | 0.002 | −0.099 | −0.076 |
| Blood TChol | 0.159 | 0.041 | −0.034 | −0.291 ** | −0.137 | −0.137 | −0.056 | −0.065 | 0.054 | 0.106 |
| Blood TG | 0.304 ** | −0.055 | −0.014 | −0.208 * | −0.325 ** | −0.004 | −0.036 | −0.05 | −0.078 | 0.004 |
| Blood BHB | −0.228 * | 0.088 | −0.085 | 0.308 ** | 0.342 ** | 0.177 | −0.036 | 0.133 | 0.425 ** | −0.087 |
| Blood NEFA | −0.324 ** | −0.007 | 0.194 | 0.269 ** | 0.381 ** | 0.084 | −0.098 | 0.097 | 0.181 | −0.005 |
Publisher’s Note: MDPI stays neutral with regard to jurisdictional claims in published maps and institutional affiliations. |
© 2022 by the authors. Licensee MDPI, Basel, Switzerland. This article is an open access article distributed under the terms and conditions of the Creative Commons Attribution (CC BY) license (https://creativecommons.org/licenses/by/4.0/).
Share and Cite
Andjelić, B.; Djoković, R.; Cincović, M.; Bogosavljević-Bošković, S.; Petrović, M.; Mladenović, J.; Čukić, A. Relationships between Milk and Blood Biochemical Parameters and Metabolic Status in Dairy Cows during Lactation. Metabolites 2022, 12, 733. https://doi.org/10.3390/metabo12080733
Andjelić B, Djoković R, Cincović M, Bogosavljević-Bošković S, Petrović M, Mladenović J, Čukić A. Relationships between Milk and Blood Biochemical Parameters and Metabolic Status in Dairy Cows during Lactation. Metabolites. 2022; 12(8):733. https://doi.org/10.3390/metabo12080733
Chicago/Turabian StyleAndjelić, Biljana, Radojica Djoković, Marko Cincović, Snežana Bogosavljević-Bošković, Milun Petrović, Jelena Mladenović, and Aleksandar Čukić. 2022. "Relationships between Milk and Blood Biochemical Parameters and Metabolic Status in Dairy Cows during Lactation" Metabolites 12, no. 8: 733. https://doi.org/10.3390/metabo12080733
APA StyleAndjelić, B., Djoković, R., Cincović, M., Bogosavljević-Bošković, S., Petrović, M., Mladenović, J., & Čukić, A. (2022). Relationships between Milk and Blood Biochemical Parameters and Metabolic Status in Dairy Cows during Lactation. Metabolites, 12(8), 733. https://doi.org/10.3390/metabo12080733