
Untargeted Metabolomic Assay of Prefrail Older Adults after Nutritional Intervention

 , , ,
, , ,  and
and
Abstract
:
1. Introduction
2. Results
3. Discussion
4. Materials and Methods
4.1. Anthropometric Measurements
4.2. Nutritional Intervention
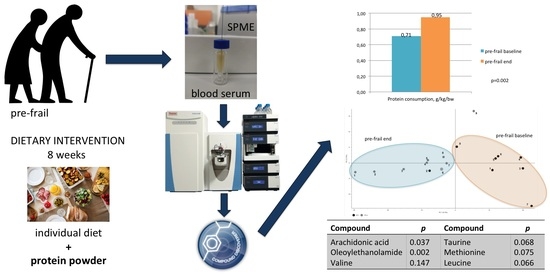
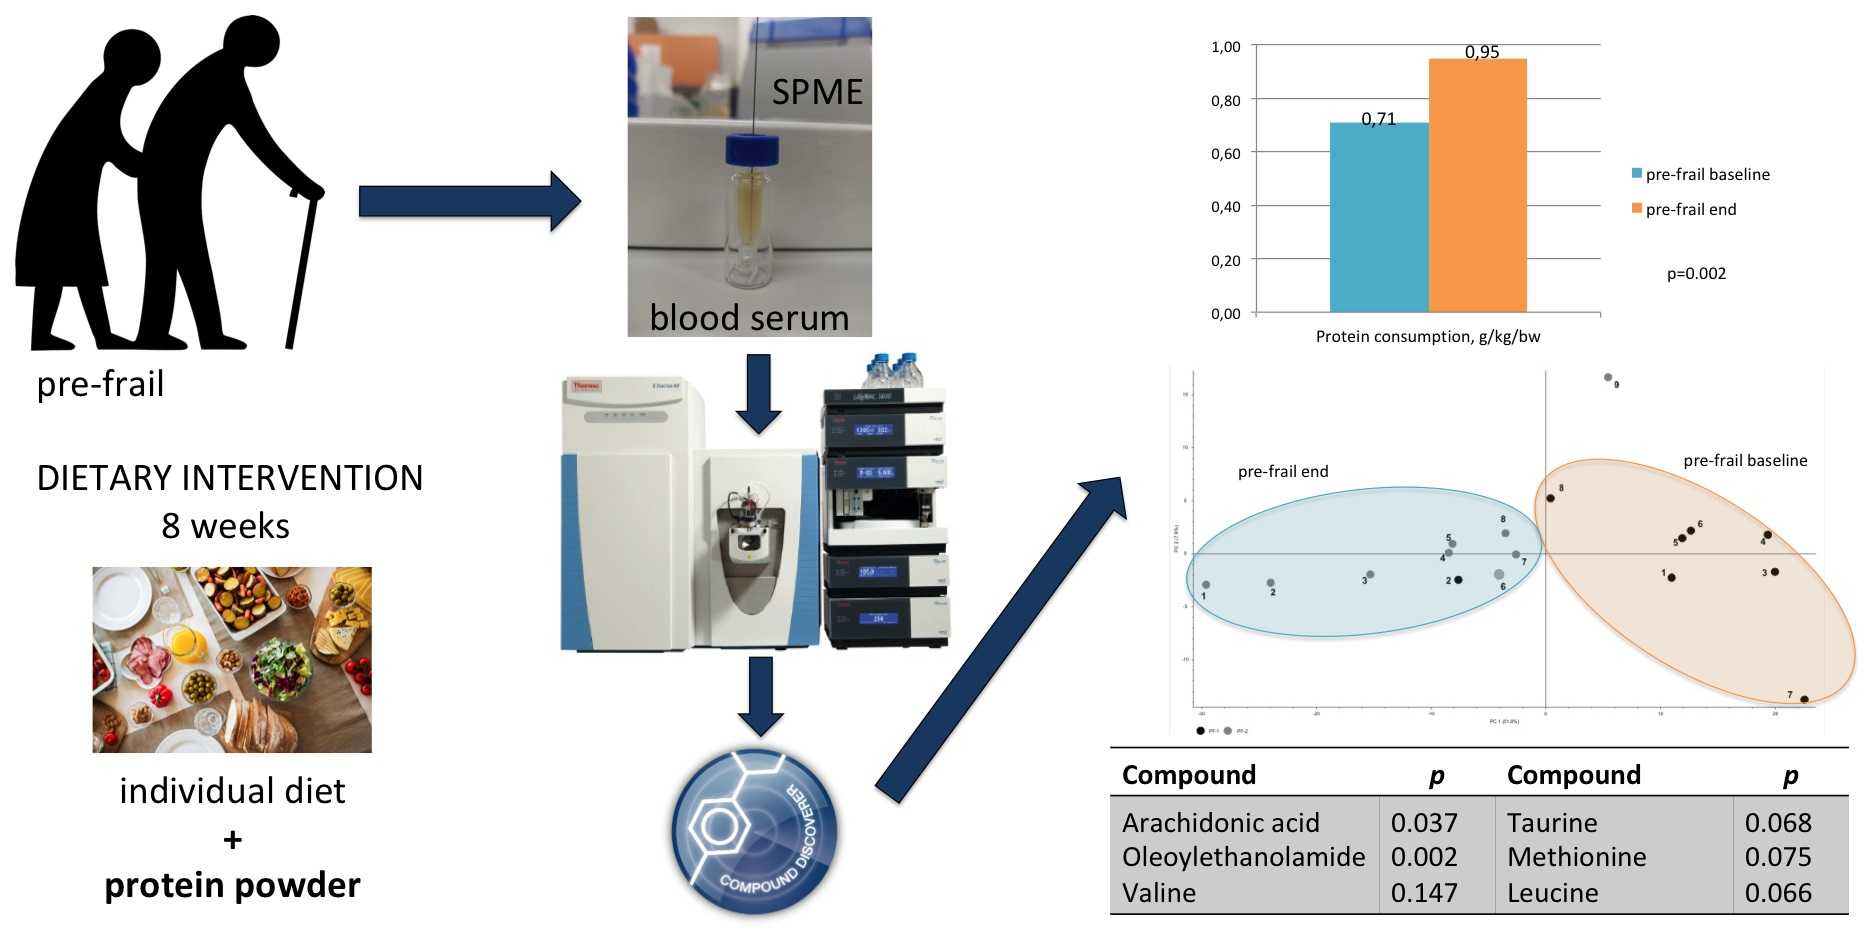
4.3. SPME Protocol
4.4. LC-MS Analysis
4.5. Metabolomics Data Processing
4.6. Statistical Analysis
5. Conclusions
Supplementary Materials
Author Contributions
Funding
Institutional Review Board Statement
Informed Consent Statement
Data Availability Statement
Acknowledgments
Conflicts of Interest
References
- Fried, L.P.; Tangen, C.M.; Walston, J.; Newman, A.B.; Hirsch, C.; Gottdiener, J.; Seeman, T.; Tracy, R.; Kop, W.J.; Burke, G.; et al. Frailty in Older adults: Evidence for a phenotype. J. Gerontol. Ser. A Biol. Sci. Med. Sci. 2001, 56, M146–M156. [Google Scholar] [CrossRef] [PubMed]
- Morley, J.E.; Vellas, B.; van Kan, G.A.; Anker, S.D.; Bauer, J.M.; Bernabei, R.; Cesari, M.; Chumlea, W.; Doehner, W.; Evans, J.; et al. Frailty Consensus: A Call to Action. J. Am. Med Dir. Assoc. 2013, 14, 392–397. [Google Scholar] [CrossRef] [Green Version]
- Fried, L.P.; Ferrucci, L.; Darer, J.; Williamson, J.D.; Anderson, G. Untangling the Concepts of Disability, Frailty, and Comorbidity: Implications for Improved Targeting and Care. J. Gerontol. Ser. A Biol. Sci. Med. Sci. 2004, 59, M255–M263. [Google Scholar] [CrossRef] [PubMed] [Green Version]
- Van Vliet, S.; A Burd, N.; van Loon, L.J. The Skeletal Muscle Anabolic Response to Plant- versus Animal-Based Protein Consumption. J. Nutr. 2015, 145, 1981–1991. [Google Scholar] [CrossRef] [Green Version]
- Schrimpe-Rutledge, A.C.; Codreanu, S.G.; Sherrod, S.D.; McLean, J.A. Untargeted Metabolomics Strategies—Challenges and Emerging Directions. J. Am. Soc. Mass Spectrom. 2016, 27, 1897–1905. [Google Scholar] [CrossRef] [PubMed] [Green Version]
- Li, B.; He, X.; Jia, W.; Li, H. Novel Applications of Metabolomics in Personalized Medicine: A Mini-Review. Molecules 2017, 22, 1173. [Google Scholar] [CrossRef]
- Pinu, F.R.; Goldansaz, S.A.; Jaine, J. Translational Metabolomics: Current Challenges and Future Opportunities. Metabolites 2019, 9, 108. [Google Scholar] [CrossRef] [PubMed] [Green Version]
- Pawliszyn, J. (Ed.) Handbook of Solid Phase Microextraction; Elsevier: Waltham, MA, USA, 2012. [Google Scholar]
- Bojko, B.; Pawliszyn, J. In vivo and ex vivo SPME: A low invasive sampling and sample preparation tool in clinical bioanalysis. Bioanalysis 2014, 6, 1227–1239. [Google Scholar] [CrossRef]
- Vuckovic, D.; Risticevic, S.; Pawliszyn, J. In vivo solid-phase microextraction in metabolomics: Opportunities for the direct investigation of biological systems. Angew. Chem. Int. Ed. 2011, 50, 5618–5628. [Google Scholar] [CrossRef]
- Bojko, B.; Reyes-Garcés, N.; Bessonneau, V.; Gorynski, K.; Mousavi, F.; Silva, E.A.S.; Pawliszyn, J. Solid-phase microextraction in metabolomics. TrAC Trends Anal. Chem. 2014, 61, 168–180. [Google Scholar] [CrossRef]
- Sánchez-García, S.; Arenas, R.S.; García-Peña, C.; Rosas-Carrasco, O.; Avila-Funes, J.A.; Ruiz-Arregui, L.; Juarez-Cedillo, T. Frailty among community-dwelling elderly Mexican people: Prevalence and association with sociodemographic characteristics, health state and the use of health services. Geriatr. Gerontol. Int. 2013, 14, 395–402. [Google Scholar] [CrossRef]
- Romero-Ortuno, R.; Walsh, C.D.; A Lawlor, B.; Kenny, R.A. A Frailty Instrument for primary care: Findings from the Survey of Health, Ageing and Retirement in Europe (SHARE). BMC Geriatr. 2010, 10, 57. [Google Scholar] [CrossRef] [Green Version]
- Buckinx, F.; Rolland, Y.; Reginster, J.-Y.; Ricour, C.; Petermans, J.; Bruyère, O. Burden of frailty in the elderly population: Perspectives for a public health challenge. Arch. Public Heal. 2015, 73, 1–7. [Google Scholar] [CrossRef] [PubMed] [Green Version]
- Santos-Eggimann, B.; Cuénoud, P.; Spagnoli, J.; Junod, J. Prevalence of Frailty in Middle-Aged and Older Community-Dwelling Europeans Living in 10 Countries. Journals Gerontol. Ser. A 2009, 64A, 675–681. [Google Scholar] [CrossRef] [PubMed] [Green Version]
- Lipschitz, D.A. Screening for nutritional status in the elderly. Prim. Care Clin. Off. Pract. 1994, 21, 55–67. [Google Scholar] [CrossRef]
- Miller, S.L.; Wolfe, R.R. The danger of weight loss in the elderly. J. Nutr. Health Aging 2008, 12, 487–491. [Google Scholar] [CrossRef] [PubMed]
- Donini, L.M.; Poggiogalle, E.; Piredda, M.; Pinto, A.; Barbagallo, M.; Cucinotta, D.; Sergi, G. Anorexia and Eating Patterns in the Elderly. PLoS ONE 2013, 8, e63539. [Google Scholar] [CrossRef] [Green Version]
- Bauer, J.; Biolo, G.; Cederholm, T.; Cesari, M.; Cruz-Jentoft, A.J.; Morley, J.E.; Phillips, S.; Sieber, C.; Stehle, P.; Teta, D.; et al. Evidence-Based Recommendations for Optimal Dietary Protein Intake in Older People: A Position Paper From the PROT-AGE Study Group. J. Am. Med Dir. Assoc. 2013, 14, 542–559. [Google Scholar] [CrossRef]
- Sakuma, K.; Yamaguchi, A. Sarcopenic Obesity and Endocrinal Adaptation with Age. Int. J. Endocrinol. 2013, 2013, 204164. [Google Scholar] [CrossRef] [Green Version]
- Tyrovolas, S.; Haro, J.-M.; Mariolis, A.; Piscopo, S.; Valacchi, G.; Bountziouka, V.; Anastasiou, F.; Zeimbekis, A.; Tyrovola, D.; Foscolou, A.; et al. Skeletal muscle mass and body fat in relation to successful ageing of older adults: The multi-national MEDIS study. Arch. Gerontol. Geriatr. 2016, 66, 95–101. [Google Scholar] [CrossRef]
- Cruz-Jentoft, A.J.; Baeyens, J.P.; Bauer, J.M.; Boirie, Y.; Cederholm, T.; Landi, F.; Martin, F.C.; Michel, J.-P.; Rolland, Y.; Schneider, S.M.; et al. Sarcopenia: European consensus on definition and diagnosis: Report of the European Working Group on Sarcopenia in Older People. Age Ageing 2010, 39, 412–423. [Google Scholar] [CrossRef] [PubMed] [Green Version]
- Espinoza, S.E.; Fried, L.P. Risk factors for frailty in the older adult. Clin. Geriatr. 2007, 15, 37–44. [Google Scholar]
- Jung, H.-W.; Kim, S.-W.; Lim, J.-Y.; Kim, K.-W.; Jang, H.C.; Kim, C.-H.; Kim, K.-I. Frailty Status Can Predict Further Lean Body Mass Decline in Older Adults. J. Am. Geriatr. Soc. 2014, 62, 2110–2117. [Google Scholar] [CrossRef] [PubMed]
- Apóstolo, J.; Cooke, R.; Bobrowicz-Campos, E.; Santana, S.; Marcucci, M.; Cano, A.; Vollenbroek-Hutten, M.; Germini, F.; D’Avanzo, B.; Gwyther, H.; et al. Effectiveness of interventions to prevent pre-frailty and frailty progression in older adults: A systematic review. JBI Database Syst. Rev. Implement. Rep. 2018, 16, 140–232. [Google Scholar] [CrossRef] [PubMed]
- Artaza-Artabe, I.; Lopez, S.; Sánchez-Hernández, N.; Fernández-Gutierrez, N.; Malafarina, V. The relationship between nutrition and frailty: Effects of protein intake, nutritional supplementation, vitamin D and exercise on muscle metabolism in the elderly. A systematic review. Maturitas 2016, 93, 89–99. [Google Scholar] [CrossRef] [PubMed]
- Tieland, M.; Dirks, M.L.; Van Der Zwaluw, N.; Verdijk, L.B.; Van De Rest, O.; de Groot, L.C.; van Loon, L.J. Protein Supplementation Increases Muscle Mass Gain During Prolonged Resistance-Type Exercise Training in Frail Elderly People: A Randomized, Double-Blind, Placebo-Controlled Trial. J. Am. Med. Dir. Assoc. 2012, 13, 713–719. [Google Scholar] [CrossRef]
- Tieland, M.; van de Rest, O.; Dirks, M.; van der Zwaluw, N.; Mensink, M.; van Loon, L.J.; de Groot, L. Protein Supplementation Improves Physical Performance in Frail Elderly People: A Randomized, Double-Blind, Placebo-Controlled Trial. J. Am. Med Dir. Assoc. 2012, 13, 720–726. [Google Scholar] [CrossRef]
- Deutz, N.E.; Bauer, J.M.; Barazzoni, R.; Biolo, G.; Boirie, Y.; Bosy-Westphal, A.; Cederholm, T.; Cruz-Jentoft, A.J.; Krznariç, Z.; Nair, K.S.; et al. Protein intake and exercise for optimal muscle function with aging: Recommendations from the ESPEN Expert Group. Clin. Nutr. 2014, 33, 929–936. [Google Scholar] [CrossRef] [Green Version]
- Tokuda, H.; Kontani, M.; Kawashima, H.; Akimoto, K.; Kusumoto, A.; Kiso, Y.; Koga, Y.; Shibata, H. Arachidonic Acid-enriched Triacylglycerol Improves Cognitive Function in Elderly with Low Serum Levels of Arachidonic Acid. J. Oleo Sci. 2014, 63, 219–227. [Google Scholar] [CrossRef] [Green Version]
- Markworth, J.F.; Maddipati, K.R.; Cameron-Smith, D. Emerging roles of pro-resolving lipid mediators in immunological and adaptive responses to exercise-induced muscle injury. Exerc. Immunol. Rev. 2016, 22, 110–134. [Google Scholar]
- Korotkova, M.; Lundberg, I.E. The skeletal muscle arachidonic acid cascade in health and inflammatory disease. Nat. Rev. Rheumatol. 2014, 10, 295–303. [Google Scholar] [CrossRef] [PubMed]
- Smith, G.I.; Atherton, P.; Reeds, D.N.; Mohammed, B.S.; Rankin, D.; Rennie, M.J.; Mittendorfer, B. Omega-3 polyunsaturated fatty acids augment the muscle protein anabolic response to hyperinsulinaemia–hyperaminoacidaemia in healthy young and middle-aged men and women. Clin. Sci. 2011, 121, 267–278. [Google Scholar] [CrossRef] [PubMed] [Green Version]
- De Souza, E.O.; Lowery, R.P.; Wilson, J.M.; Sharp, M.H.; Mobley, C.B.; Fox, C.; Lopez, H.L.; Shields, K.A.; Rauch, J.T.; Healy, J.C.; et al. Effects of Arachidonic Acid Supplementation on Acute Anabolic Signaling and Chronic Functional Performance and Body Composition Adaptations. PLoS ONE 2016, 11, e0155153. [Google Scholar] [CrossRef] [PubMed] [Green Version]
- Markworth, J.F.; Mitchell, C.J.; D’Souza, R.F.; Aasen, K.M.; Durainayagam, B.R.; Mitchell, S.M.; Chan, A.H.; Sinclair, A.J.; Garg, M.; Cameron-Smith, D. Arachidonic acid supplementation modulates blood and skeletal muscle lipid profile with no effect on basal inflammation in resistance exercise trained men. Prostaglandins Leukot. Essent. Fat. Acids 2018, 128, 74–86. [Google Scholar] [CrossRef] [PubMed]
- Taber, L.; Chiu, C.-H.; Whelan, J. Assessment of the arachidonic acid content in foods commonly consumed in the American diet. Lipids 1998, 33, 1151–1157. [Google Scholar] [CrossRef] [PubMed]
- Wolfe, R.R. Branched-chain amino acids and muscle protein synthesis in humans: Myth or reality? J. Int. Soc. Sports Nutr. 2017, 14, 30. [Google Scholar] [CrossRef] [PubMed] [Green Version]
- Santos, C.D.S.; Nascimento, F.E.L. Isolated branched-chain amino acid intake and muscle protein synthesis in humans: A biochemical review. Einstein 2019, 17, eRB4898. [Google Scholar] [CrossRef] [PubMed] [Green Version]
- Gillingham, L.G.; Gustafson, J.A.; Han, S.-Y.; Jassal, D.S.; Jones, P.J.H. High-oleic rapeseed (canola) and flaxseed oils modulate serum lipids and inflammatory biomarkers in hypercholesterolaemic subjects. Br. J. Nutr. 2010, 105, 417–427. [Google Scholar] [CrossRef] [Green Version]
- Sihag, J.; Jones, P.J.H. Oleoylethanolamide: The role of a bioactive lipid amide in modulating eating behaviour. Obes. Rev. 2017, 19, 178–197. [Google Scholar] [CrossRef]
- Joosten, M.M.; Balvers, M.G.; Verhoeckx, K.C.; Hendriks, H.F.; Witkamp, R.F. Plasma anandamide and other N-acylethanolamines are correlated with their corresponding free fatty acid levels under both fasting and non-fasting conditions in women. Nutr. Metab. 2010, 7, 49. [Google Scholar] [CrossRef] [Green Version]
- Bowen, K.J.; Kris-Etherton, P.M.; Shearer, G.C.; West, S.G.; Reddivari, L.; Jones, P.J. Oleic acid-derived oleoylethanolamide: A nutritional science perspective. Prog. Lipid Res. 2017, 67, 1–15. [Google Scholar] [CrossRef] [PubMed]
- Pujos-Guillot, E.; Pétéra, M.; Jacquemin, J.; Centeno, D.; Lyan, B.; Montoliu, I.; Madej, D.; Pietruszka, B.; Fabbri, C.; Santoro, A.; et al. Identification of Pre-frailty Sub-Phenotypes in Elderly Using Metabolomics. Front. Physiol. 2019, 9, 1903. [Google Scholar] [CrossRef] [PubMed] [Green Version]
- Adachi, Y.; Ono, N.; Imaizumi, A.; Muramatsu, T.; Andou, T.; Shimodaira, Y.; Nagao, K.; Kageyama, Y.; Mori, M.; Noguchi, Y.; et al. Plasma Amino Acid Profile in Severely Frail Elderly Patients in Japan. Int. J. Gerontol. 2018, 12, 290–293. [Google Scholar] [CrossRef]
- Ottestad, I.; Ulven, S.M.; Øyri, L.K.L.; Sandvei, K.S.; Gjevestad, G.O.; Bye, A.; Sheikh, N.A.; Biong, A.S.; Andersen, L.F.; Holven, K.B. Reduced plasma concentration of branched-chain amino acids in sarcopenic older subjects: A cross-sectional study. Br. J. Nutr. 2018, 120, 445–453. [Google Scholar] [CrossRef] [PubMed] [Green Version]
- Breslow, R.A.; Sorkin, J.D. Comparison of One-Day and Three-Day Calorie Counts in Hospitalized Patients: A Pilot Study. J. Am. Geriatr. Soc. 1993, 41, 923–927. [Google Scholar] [CrossRef]
- Lee, R.C.; Wang, Z.; Heo, M.; Ross, R.; Janssen, I.; Heymsfield, S.B. Total-body skeletal muscle mass: Development and cross-validation of anthropometric prediction models. Am. J. Clin. Nutr. 2000, 72, 796–803. [Google Scholar] [CrossRef]
- Rech, C.R.; Dellagrana, R.; Marucci, M.D.F.N.; Petroski, E.L. Validity of anthropometric equations for the estimation of muscle mass in the elderly. Braz. J. Kinanthropometry Hum. Perform. 2012, 14, 23–31. [Google Scholar] [CrossRef] [Green Version]
- Vuckovic, D.; Pawliszyn, J. Systematic Evaluation of Solid-Phase Microextraction Coatings for Untargeted Metabolomic Profiling of Biological Fluids by Liquid Chromatography−Mass Spectrometry. Anal. Chem. 2011, 83, 1944–1954. [Google Scholar] [CrossRef]

| Control n = 29 | Pre-Frail n = 16 | p | |
|---|---|---|---|
| Gender: women | 82.8% | 81.3% | 0.899 |
| Age, y | 69.3 ± 5.3 | 68.4 ± 5.5 | 0.618 |
| Age | 0.618 | ||
| 60–75 | 87.5% | 82.8% | |
| >75 | 12.5% | 17.2% | |
| Residence | 0.934 | ||
| village | 6.9% | 6.3% | |
| city | 93.1% | 93.7% | |
| Education | 0.642 | ||
| basic | 17.3% | 25.0% | |
| secondary | 51.7% | 37.5% | |
| higher | 31.0% | 37.5% | |
| Appetite loss: yes | 25.0% | 96.5% | 0.028 |
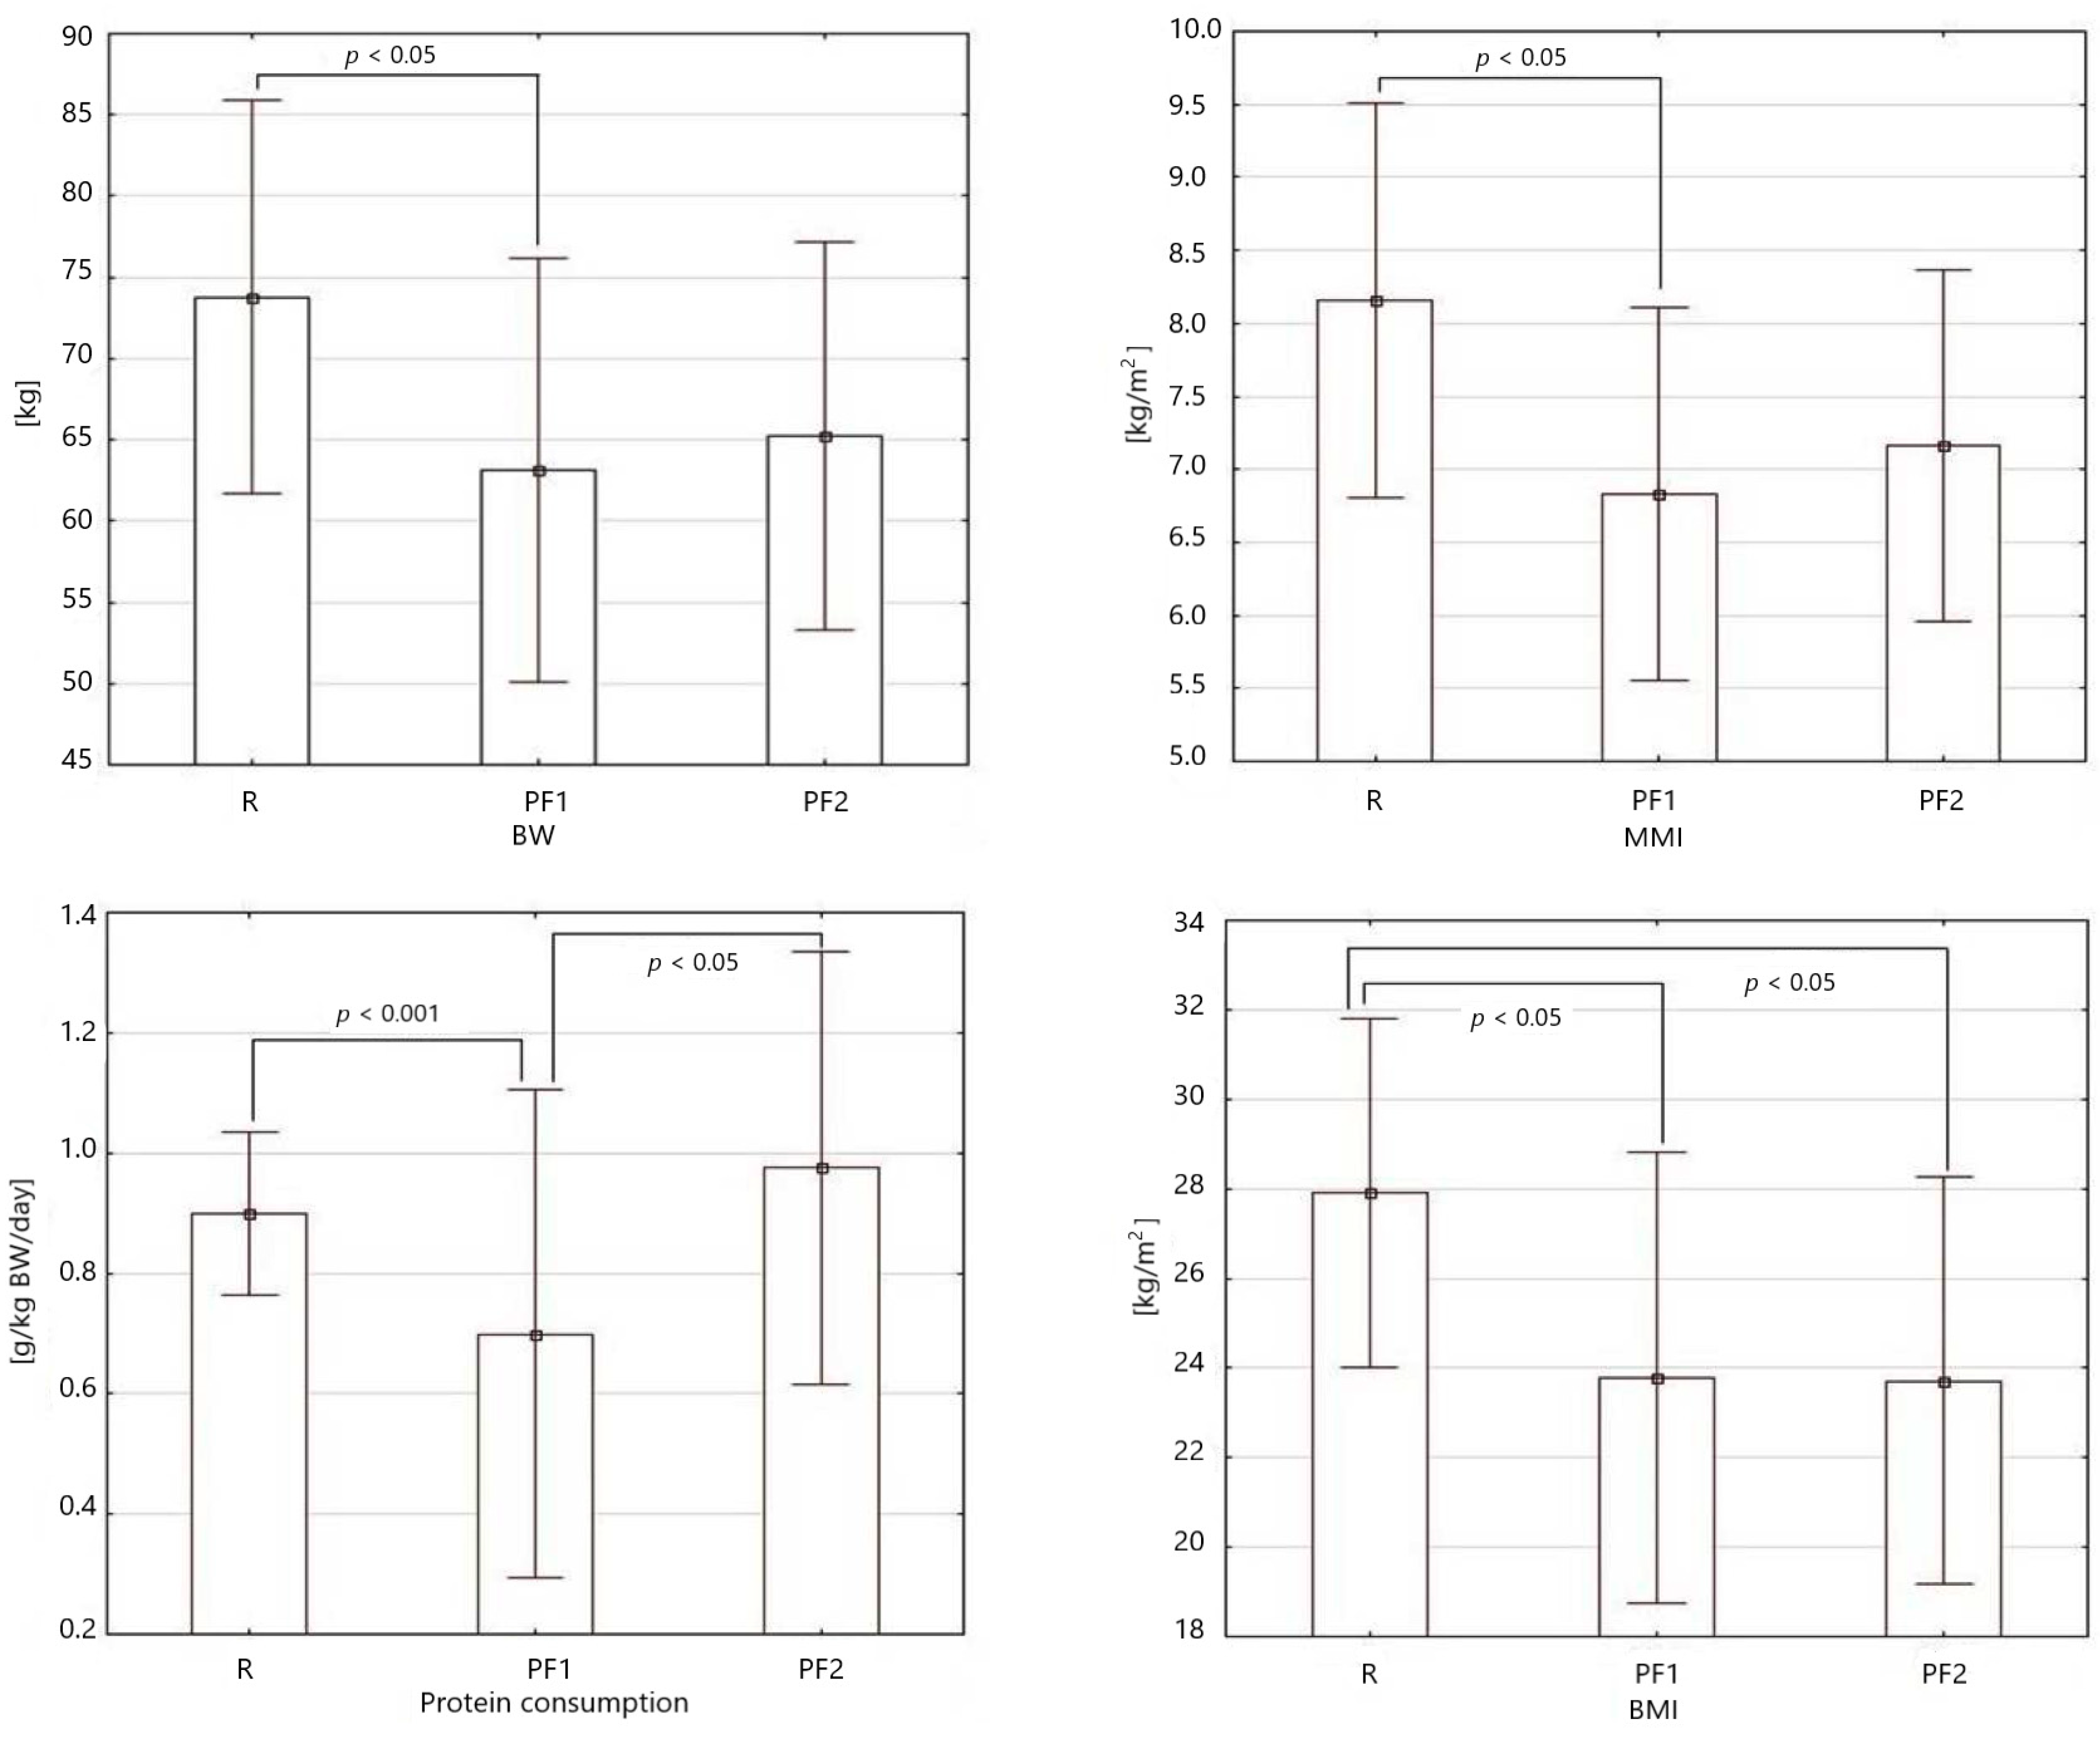
| Body weight, kg | 73.8 ± 12.1 | 65.0 ± 14.0 | 0.034 |
| Weight loss, % | - | 2.3 ± 5.0 | 0.007 |
| BMI, kg/m2 | 27.91 ± 3.88 | 23.65 ± 4.95 | 0.009 |
| Handgrip, kg (w) | 23.0 ± 5.3 | 22.1 ± 4.9 | 0.593 |
| CC, cm | 36.3 ± 3.0 | 34.6 ± 3.0 | 0.086 |
| MAMC, mm (w) | 23.0 ± 2.8 | 22.3 ± 3.4 | 0.048 |
| MMI, kg/m2 (w) | 7.7 ± 1.4 | 6.8 ± 1.5 | 0.048 |
| Albumin, g/dL | 4.64 ± 0.22 | 4.50 ± 0.46 | 0.571 |
| MNA | 27.0 ± 1.2 | 23.6 ± 3.4 | <0.0001 |
| Protein consumption, g/kg/bw | 0.9 ± 0.14 | 0.71 ± 0.37 | <0.001 |
| Difference | p | |
|---|---|---|
| Body weight, kg | +1.2 ± 1.6 | 0.023 |
| BMI, kg/m2 | +0.4 ± 0.6 | 0.027 |
| Handgrip, kg | +0.6 ± 1.9 | 0.272 |
| CC, cm | +0.2 ± 0.6 | 0.269 |
| MAMC, mm | +0.5 ± 0.7 | 0.028 |
| MMI, kg/m2 | +0.1 ± 0.2 | 0.042 |
| Albumin, g/dL | −0.1 ± 0.3 | 0.169 |
| Protein consumption, g/kg/bw | +0.24 ± 0.17 | 0.002 |
| Compound | Robust (×106) | Pre-Frail Baseline (×106) | Pre-Frail End (×106) | p |
|---|---|---|---|---|
| Arachidonic acid | 3.5 ± 1.3 | 2.8 ± 0.7 | 4.1 ± 1.3 | 0.037 |
| Oleoylethanolamide | 25.2 ± 6.3 | 27.6 ± 7.3 | 15.5 ± 9.9 | 0.002 |
| Valine | 0.41 ± 0.42 | 0.35 ± 0.26 | 0.62 ± 0.38 | 0.147 |
| Taurine | 4.2 ± 2.7 | 3.5 ± 2.0 | 5.0 ± 2.3 | 0.068 |
| Methionine | 11.1 ± 3.0 | 9.0 ± 3.1 | 11.5 ± 2.2 | 0.075 |
| Leucine | 190.7 ± 27.0 | 168.8 ± 24.0 | 187.9 ± 22.0 | 0.066 |
Publisher’s Note: MDPI stays neutral with regard to jurisdictional claims in published maps and institutional affiliations. |
© 2022 by the authors. Licensee MDPI, Basel, Switzerland. This article is an open access article distributed under the terms and conditions of the Creative Commons Attribution (CC BY) license (https://creativecommons.org/licenses/by/4.0/).
Share and Cite
Jaroch, A.; Kozakiewicz, M.; Jaroch, K.; Główczewska-Siedlecka, E.; Bojko, B.; Kędziora-Kornatowska, K. Untargeted Metabolomic Assay of Prefrail Older Adults after Nutritional Intervention. Metabolites 2022, 12, 378. https://doi.org/10.3390/metabo12050378
Jaroch A, Kozakiewicz M, Jaroch K, Główczewska-Siedlecka E, Bojko B, Kędziora-Kornatowska K. Untargeted Metabolomic Assay of Prefrail Older Adults after Nutritional Intervention. Metabolites. 2022; 12(5):378. https://doi.org/10.3390/metabo12050378
Chicago/Turabian StyleJaroch, Alina, Mariusz Kozakiewicz, Karol Jaroch, Emilia Główczewska-Siedlecka, Barbara Bojko, and Kornelia Kędziora-Kornatowska. 2022. "Untargeted Metabolomic Assay of Prefrail Older Adults after Nutritional Intervention" Metabolites 12, no. 5: 378. https://doi.org/10.3390/metabo12050378
APA StyleJaroch, A., Kozakiewicz, M., Jaroch, K., Główczewska-Siedlecka, E., Bojko, B., & Kędziora-Kornatowska, K. (2022). Untargeted Metabolomic Assay of Prefrail Older Adults after Nutritional Intervention. Metabolites, 12(5), 378. https://doi.org/10.3390/metabo12050378