Abstract
We aimed to investigate the interaction mechanism of transport protein Human serum albumin (HSA) with a synthesized compound, QP-11, with tested antimalarial properties to monitor the changes in the protein because of QP-11 binding. The interaction between the antimalarial compound QP-11 and HSA was thoroughly investigated through a multidimensional approach, utilizing UV-VIS spectroscopy, fluorescence, time-resolved fluorescence, and CD (Circular dichroism), alongside molecular docking techniques. Our findings unveiled a robust 1:1 binding pattern, signifying a strong affinity between QP-11 and HSA. Employing static quenching, evidenced by time-resolved fluorescence spectroscopy, QP-11 was observed to induce fluorescence quenching of HSA, particularly binding to subdomain IIA. Thermodynamic parameters indicated that van der Waals forces and hydrogen bonding predominantly facilitated the binding, with increased temperature compromising complex stability. The 3D fluorescence and CD results demonstrated QP-11-induced conformational changes in HSA. Both experimental and in silico analyses suggested a spontaneous, exothermic binding reaction. The profound impact of the QP-11–HSA interaction underscores the potential for QP-11 in antimalarial drug development, encouraging further exploration for dose design and enhanced pharmacodynamic and pharmacokinetic properties.
1. Introduction
In recent endeavors to combat Plasmodium falciparum, researchers have adopted a molecular conjugate strategy to design targeted inhibitors [1,2]. This innovative approach involves fusing existing pharmacophores, particularly focusing on the significant quinoline scaffold known for its antimalarial properties [3]. This method holds great potential for uncovering novel inhibitors in the ongoing fight against P. falciparum. In a progressive extension of these endeavors, our group has undertaken the design and synthesis of innovative molecular frameworks. These frameworks feature a piperazine linkage and showcase a distinctive 7-chloroquinoline-triazole motif, strategically aimed at restraining the cysteine protease, Falcipain-2 (FP-2), as a potential therapeutic target for antimalarial activity. The culmination of these efforts has yielded the development of a novel compound, QP-11 [4] (Figure 1). The previous study highlights QP-11 as a potent antiplasmodial compound, demonstrating efficacy against both sensitive (NF54) and the resistant (K1) strains of P. falciparum, with IC50 values of 0.8 μM and 1.7 μM, respectively. QP-11 treatment led to a notable defect in parasite growth while remaining non-toxic to CHO cell lines. The compound exhibited favorable metabolic stability by inhibiting FP-2. In in vivo experiments with P. berghei-infected mice, QP-11 displayed significant parasitemia reduction, resulting in complete cure at doses of 50 and 100 mg/kg, with no signs of toxicity over a 30-day period. Further enhancement in efficacy within the nanomolar range was explored through a detailed structure–activity relationship (SAR) analysis against P. falciparum3D7 strains. Overall, QP-11 emerges as a potential compound to treat malaria, selectively targeting FP-2. Its promising attributes position it as a valuable scaffold for therapeutic development, offering a potential solution to antimalarial resistance.
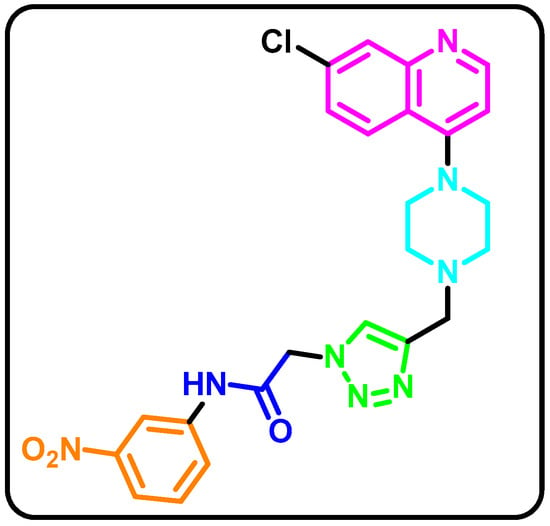
Figure 1.
Structure of QP-11 (piperazine linked 7-chloroquinoline-triazole conjugate). (Chemical Formula: C24H23ClN8O3, Molecular Weight: 506.94 g/mol, Solubility: Soluble in DMSO (Dimethyl Sulfoxide).)
Human serum albumin (HSA) is a protein that is synthesized in the liver and is found in plasma. It weighs approximately 66.5 kDa and is composed of a single polypeptide chain of 585 amino acids. The structure of human serum albumin has been extensively studied using X-ray crystallography and other biophysical techniques. It is composed of three domains (I, II, and III) and has a heart-shaped structure. Each domain consists of two subdomains (A and B) that are connected by a flexible hinge region. The subdomains have a similar fold and are composed of a series of alpha-helices and beta-sheets. The N-terminus of the protein is located in domain I, while the C-terminus is in domain III. The protein also contains 17 disulfide bonds that help to stabilize its structure. The protein has several important binding sites, including a fatty acid binding site in domain I, a cation binding site in domain II, and a site for binding drugs and other ligands in domain III. Overall, the structure of human serum albumin allows it to perform its important functions in transporting and binding a wide range of substances in the blood [5,6,7]. Because of the single amino acid tryptophan’s location in HSA (subdomain IIA) and distinctive fluorescence properties, this lone tryptophan provides a valuable tool for biochemists. It made many spectroscopic and fluorescence studies possible, including molar concentration determination and fluorescence quenching studies [8,9]. Proteins can be the target of drugs, where the drug binds to the protein and modulates its activity, or the drug can bind to proteins non-specifically, leading to adverse effects or unintended consequences.
The study of drug–protein interactions is an important field in drug development and pharmacology [10]. Understanding how a drug interacts with a target protein provides insights into the drug’s mechanism of action, its efficacy, and its potential side effects. There are several ways in which drugs can interact with proteins. One common mechanism is through binding to a protein’s active site [11]. This can either enhance or inhibit the activity of the protein, depending on the nature of the interaction. Another mechanism is through binding to allosteric sites on the protein, which can modulate its activity by changing its conformation or its interaction with other proteins or molecules [12]. Drugs can also interact with proteins by binding to specific domains or motifs within the protein, which can modulate its function or affect its stability [13]. In addition, drugs can interact with proteins non-specifically through electrostatic or hydrophobic interactions, which can lead to unintended consequences such as off-target effects or toxicity [14]. Overall, understanding the nature and mechanisms of drug–protein interactions is critical for the development of safe and effective drugs, as well as for the optimization of drug dosing and treatment regimens [15,16]. HSA drug binding produces advantages because it functions as the primary plasma carrier protein that transports both endogenous and exogenous compounds. The binding of drugs to HSA increases their apparent solubility and extends their circulation half-life while providing a controlled release system, which decreases dosing frequency and enhances therapeutic effects. The drug interaction with HSA protects the compound from fast metabolic processes and clearance, which leads to better bioavailability. Multiple research investigations have proven these advantages. Research shows that HSA binding of anticancer agents and antimalarials leads to improved plasma stability and pharmacokinetics and targeted tissue delivery [17,18].
In the current study, the interaction of antimalarial QP-11 with human serum albumin was investigated using various spectroscopic methods, molecular docking, and MD simulation. The conformational changes in HSA in the presence of QP-11 were monitored using UV-VIS, synchronous fluorescence, and CD spectroscopy. Steady-state fluorescence and time-resolved studies were conducted to explore the mechanism of interaction between QP-11 and HSA. Molecular docking and MD simulation were also carried out. The study is expected to present a better understanding of the efficiency and efficacy of the antimalarial compound based on its interaction with serum protein, a significant factor in the field of drug development.
2. Materials and Methods
HSA solution (5 µM) was prepared by directly dissolving it in phosphate buffer (10 mM, pH 7.4). All reagents and solvents for chemical synthesis were purchased with ≥95% purity from Sigma-Aldrich, Fisher scientific, Avra, Merck, and used without further purification. Analytical thin-layer chromatography (TLC) was performed using Merck Silica gel 60 F254 pre-coated aluminum sheets (EMD Millipore Corporation, Darmstadt, Germany), used under UV light. Iodine (I2) vapor staining was used for visualization of spots. Column chromatography was performed using a 60–120 mesh silica gel (GLR innovations, India) [4]. Different concentrations of QP-11 (0–16.6 µM) were then used for HSA–QP-11 interaction study. DMSO and Millipore water were used to prepare all solutions. All solutions were stored in the refrigerator until use.
Instrumentation
2.1. UV–Visible Spectroscopy
The Analytic Jena Specord-210 spectrophotometer (Germany) with a Peltier temperature control unit performed UV-visible absorption measurements to maintain thermal consistency during analysis. The experiment used a constant slit width of 1 nm. The spectrophotometer recorded absorbance spectra of HSA (5 µM) with different QP-11 concentrations across the 200–500 nm wavelength range using a quartz cuvette with 1 cm path length.
2.2. Fluorescence Spectroscopy
The Cary Eclipse Spectrofluorometer (Varian, USA), with its 150 W xenon lamp and Peltier temperature control system, performed fluorescence measurements. The experiments were conducted at 298 K using a 1.0 cm quartz cuvette with 5 nm slit widths for both excitation and emission. The protein excitation wavelength was set at 280 nm. The same instrumental conditions were used to record synchronous fluorescence spectra, with Δλ set at 15 nm and 60 nm for analyzing tyrosine and tryptophan residues over the 250–310 nm range. The 3-dimensional fluorescence spectra of pure HSA (5 µM) and the QP-11 (16.6 µM)–HSA (5 µM) complex were produced using the same spectrofluorometer. The emission spectra spanned from 200 to 500 nm, while the excitation wavelengths were scanned from 200 to 350 nm in 5 nm increments.
2.3. Time-Resolved Fluorescence
The time-resolved fluorescence (TRF) measurements were performed using a single-photon counting spectrometer at 280 nm and 298 K (Horiba Jobin Yvon, IBH Ltd., Glasgow, UK). The response function of the instrument was recorded sequentially, using a scattering solution and a time calibration of 114 ps/channel. Data were analyzed using a sum of exponentials, employing a nonlinear least square reconvolution analysis and using the following equation:
The pre-exponential factors (αi) were normalized to 1, and the errors were taken as three standard deviations. The Chi-squared (χ2) value and weighted residuals were analyzed to judge the goodness of fit. TRF decays were analyzed using HORIBA Scientific Eztime Version 3.2.9.11.
Finally, the average fluorescence lifetimes (τav) for tri-exponential fittings were obtained by using the following equation:
where αi is the relative contribution, and τi is the lifetime of different components to the total decay.
2.4. Circular Dichroism
CD measurements were conducted using a ChirascanTM spectropolarimeter (USA) maintained at 298 K, with a thermostatically controlled cell holder connected to a water bath, ensuring ±0.1 K accuracy. Spectra were scanned across the far-UV range (200–250 nm) using a quartz optical cell with a 0.1 cm path length. The HSA concentration was fixed at 5 μM, with buffer signals subtracted to isolate the protein’s CD spectrum accurately. Raw CD data were transformed into mean residual ellipticity [θ] (deg cm2 dmol−1), a concentration-independent parameter, using the formula:
where Mo represents the mean residue weight of HSA, θλ is the observed ellipticity in milli degrees at wavelength λ, C denotes the HSA concentration in mg mL−1, and l signifies the path length of the cell in cm. The α-helical percent in HSA was determined from the ellipticity values at 208 nm using the formula:
2.5. Molecular Docking
To identify potential binding sites of ORP on proteins, molecular docking was conducted. The software used was AutoDock 1.5.6, which utilizes the Lamarckian Genetic Algorithm (LGA) to generate various conformers of ligands [19]. The three-dimensional crystal structures of the protein, HSA (PDB ID: 6HSC), were obtained from the Protein Data Bank (https://www.rcsb.org). Blind docking was then employed to predict plausible binding sites on HSA, as well as the likely conformations of the HSA–QP-11 systems. The grid parameters for HSA–QP-11 were set at a size of 102, 110, 62; a center of 28.423, 8.392, 23.263; and a spacing of 0.703 Å. Default parameters were utilized during the docking process, as outlined in AutoDock. Subsequently, the docking results were visualized using PyMOL version 3.1.0 and BIOVIA Discovery Studio software version 2025 SP1.
2.6. MD Simulation
The Desmond module of Schrödinger Release 2022-4 performed molecular dynamics (MD) simulations on a Linux system to evaluate the binding stability between ligands and HSA [20]. The Protein Data Bank provided the HSA crystal structure (PDB ID: 6HSC), which Schrödinger’s Protein Preparation Wizard prepared for analysis [21]. The OPLS4 force field simulated the system at physiological pH (7.4) for 100 ns. The protein–ligand complex received explicit water molecules in an orthorhombic box, while counterions (Na+ and Cl−) were added to neutralize the system and achieve a 0.15 M salt concentration. The simulation operated under NPT conditions, which kept the pressure at 1.01325 bar and the temperature at 300 K while collecting data every 5 ps. The structural stability of the system was evaluated through RMSD (root mean square deviation), RMSF (root mean square fluctuation), and SSE (secondary structure elements) calculations. The simulation tracked protein–ligand interactions throughout each trajectory frame, while Rg (radius of gyration) measurements evaluated protein conformational changes and compactness throughout the simulation.
3. Results and Discussion
Chemistry
Recently, our research group has reported the synthesis of QP-11, as shown in Scheme 1. QP-11 was synthesized through a series of chemical reactions, where one of the aromatic hydrogen atoms in 4,7-dichloroquinoline was replaced with piperazine under refluxing conditions, followed by adding propargyl bromide in the presence of potassium carbonate in anhydrous DMF, resulting in a 7-chloro-4-piperazin-1-yl-quinoline intermediate. Simultaneously, an azide intermediate was synthesized by reacting meta-nitro-substituted aniline with chloroacetyl chloride. This reaction led to the formation of chloroacetamide, which was then subjected to direct azide replacement using sodium azide in anhydrous DMF at a temperature of 85 °C, resulting in the azide intermediate. Finally, the alkyne and the azide intermediate were combined in the presence of copper sulfate and sodium ascorbate in a mixture of THF (a solvent) and water (1:2). This reaction occurred at room temperature and yielded QP-11. The compound was purified by flash chromatography, using 5% methanol/DCM as the eluent in moderate-to-good yield and characterized well using the multi-spectroscopic techniques FT-IR, 1H, 13C NMR, and mass spectrometry. The purity was confirmed ≥95% before conducting the binding studies with HSA.
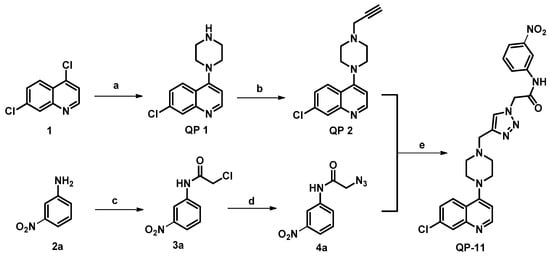
Scheme 1.
Reagents and conditions: (a) piperazine, EtOH, reflux, 12 h; (b) propargyl bromide, 60% NaH, THF, 0 °C-rt, 23 h; (c) chloroacetyl chloride, Et3N, DCM, rt, 4 h; (d) NaN3, DMF, 85 °C, 3 h; (e) CuSO4·5H2O, sodium ascorbate, THF/H2O (1:2), rt, 20–24 h.
Binding studies
3.1. UV–VIS Spectroscopy
UV–Vis spectroscopy is widely used to analyze the conformational changes induced in a protein due to binding of small molecules or any alteration in the microenvironment [22]. Figure 2 represents absorption spectra of HSA with rising concentrations of QP-11 (1.8–16.6 µM). As shown in Figure 2A, the increase in absorbance at 280 nm indicates that the interaction between HSA and QP-11 leads to changes in the absorption properties of the protein–drug complex. This change could be attributed to the formation of a complex between HSA and QP-11, which exhibits absorbance at 280 nm due to electronic transitions, or alterations in the microenvironment of aromatic amino acid residues in HSA. In Figure 2B, the concentration-dependent increase in absorbance indicates that QP-11 absorbs light at 351 nm, and the extent of absorption is directly proportional to its concentration in solution. This confirms that the change in absorbance peaks of the protein at 280 nm is due to the complex formation of QP-11 with HSA. To address the inner filter effect issue, the sample was diluted, which reduced the concentration of absorbing species, thereby minimizing light attenuation and mitigating the inner filter effect. Also, the cuvette with a short path length (1 nm) was used.
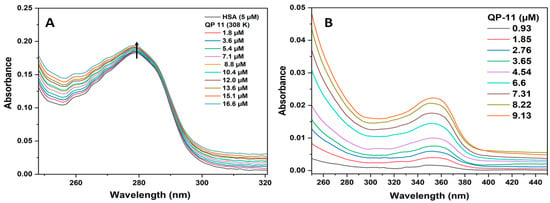
Figure 2.
UV-VIS spectra of (A) HSA with QP-11 and (B) QP-11 alone.
3.2. Fluorescence Spectroscopy
Fluorescence spectroscopy is a highly sensitive technique useful in analyzing the change in polarity of the microenvironment of the fluorophore residues upon interaction with a ligand. The polarity of the HSA solution plays a pivotal role in modulating the binding affinity of ligands to HSA, a critical protein involved in drug transport and metabolism. Variations in solution polarity can influence the accessibility of binding sites on the protein, altering the strength and nature of protein–ligand interactions. Hydrophobic interactions, electrostatic interactions, hydrogen bonding, and conformational changes within the protein are all affected by changes in solution polarity. These factors collectively impact the stability and specificity of ligand–protein interactions, ultimately determining the efficacy and pharmacokinetic properties of drugs. Thus, understanding the relationship between solution polarity and ligand binding affinity is crucial for optimizing drug design and therapeutic strategies aimed at harnessing the functionality of HSA in drug delivery and targeting. The fluorescence spectrum of HSA was recorded by keeping the concentration of HSA constant at 5 µM and increasing the concentration of QP-11 from 0 µM to 16.6 µM. It was observed that increasing concentration of QP-11 led to a decrease in the fluorescence intensity of HSA at 332 nm without any obvious shifting (Figure 3A). On the other hand, QP-11 in the absence of protein showed a peak at 311 nm (Figure 3B). The observation indicates that increasing concentrations of QP-11 lead to a decrease in the fluorescence intensity of HSA at 332 nm, suggesting a quenching effect on HSA fluorescence. Importantly, there is no significant shift in the peak wavelength, indicating that the quenching mechanism may involve static quenching, not dynamic quenching, where energy transfer occurs between the excited state of the fluorophore and the quencher. Additionally, the fluorescence spectrum of QP-11 in the absence of protein exhibits a peak at 311 nm, highlighting its intrinsic fluorescence properties. The lack of a peak shift in the fluorescence spectrum of HSA suggests that the decrease in HSA’s peak values is indeed due to the formation of a complex between QP-11 and HSA rather than intrinsic changes in HSA’s fluorescence properties.
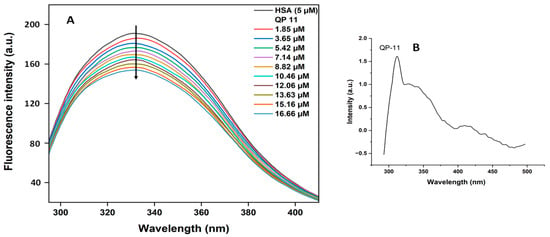
Figure 3.
(A) Fluorescence spectra of HSA as a function of QP-11 concentration; (B) Fluorescence spectra of QP-11 alone.
3.3. Fluorescence Quenching Mechanism
Fluorescence quenching can be of different types, depending on a variety of molecular interactions, and the result can be dynamic quenching or static quenching. These two kinds of quenching mechanisms can be distinguished by analyzing the Stern–Volmer quenching constant (Ksv) at different temperatures. Prior research has demonstrated that Ksv exhibits a decrease with increasing temperature in the case of static quenching. This phenomenon occurs because the rise in temperature reduces the stability of the quencher–fluorophore complex. Conversely, in dynamic quenching, Ksv decreases with higher temperatures due to an increase in collision frequency [22]. The type of quenching mechanism is determined by using the following Stern–Volmer equation:
where F0 and F represent the fluorescence intensities of HSA when QP-11 is absent and present, respectively. [Q] denotes the concentration of QP-11, the quencher. The parameter Ksv stands for the Stern–Volmer quenching constant and kq for the quenching rate constant for the biomolecular reaction. Additionally, τ0 signifies the average fluorescence lifetime of the native protein, and its reported value is 10–8 s. Figure 4 shows the Stern–Volmer plot of the QP-11–HSA system at different temperatures. Ksv values (obtained from the slope of the plot) and kq are provided in Table 1. Ksv values were found to be decreasing with the increase in temperature, which indicated the involvement of the static quenching for the QP-11–HSA interaction system. Moreover, kq values for the QP-11–HSA system were greater than the maximum collision quenching rate constant of the biomolecule (2.0 × 10¹⁰ L/mol/s), confirming that static quenching was comprised [23,24].
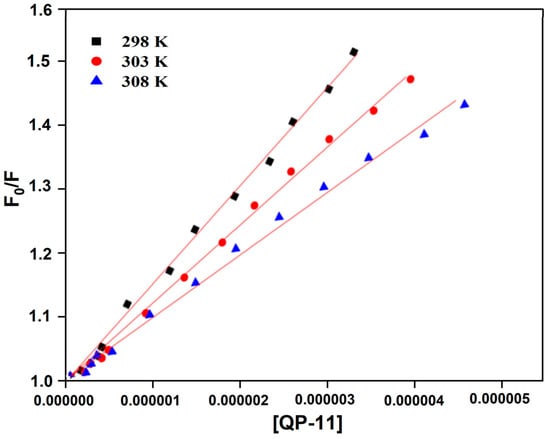
Figure 4.
Stern–Volmer Plot of HSA quenched by QP-11 at different temperatures.

Table 1.
Ksv and kq of HSA–QP-11 system at distinct temperatures.
3.4. Binding Parameters
We plotted the double log plot between log(F0 − F/F) and log[QP-11] (Figure 5) at three different temperatures, 298 K, 303 K, and 308 K to obtain the binding constant (Kb) and number of binding sites (n) for the interaction of QP-11 with HSA using Equation (6) [22]. As a result, a straight-line curve was obtained at all temperatures. The values of Kb and n are represented in Table 2.
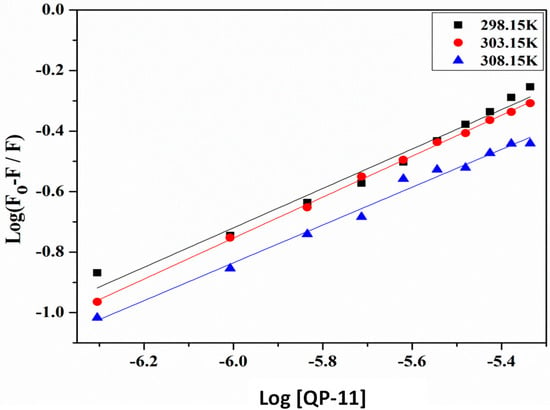
Figure 5.
Log(F0 − F)/F versus log[QP-11] for quenching of HSA by QP-11.

Table 2.
The binding constant (Kb) and binding site (n) of HSA and QP-11 interaction at three different temperatures.
As is evident from Table 2, values of Kb decreased, indicating the stability of the complex decreases with an increase in temperature. Further, the Kb values were of the order of 103, suggesting QP-11 binds moderately with HSA. The value of n was approximately equal to one, suggesting QP-11 has 1:1 binding with HSA [25].
3.5. Binding Nature and Thermodynamic Parameters
The thermodynamic parameters, viz. ΔH and ΔS, were calculated from the slope and intercept of the Van’t Hoff plot (Figure 6) to determine the binding modes and binding forces involved in the QP-11–HSA interaction through the Van’t Hoff equation:
where Kb is the binding constant, R is the gas constant, and T is the temperature set while experimenting. ΔH and ΔS denote the enthalpy and entropy change, respectively, of the binding process. The Gibbs free energy (ΔG) for the binding was estimated by using the following equation:
lnKb = −ΔH/RT + ΔS/R
ΔG = ΔH − TΔS
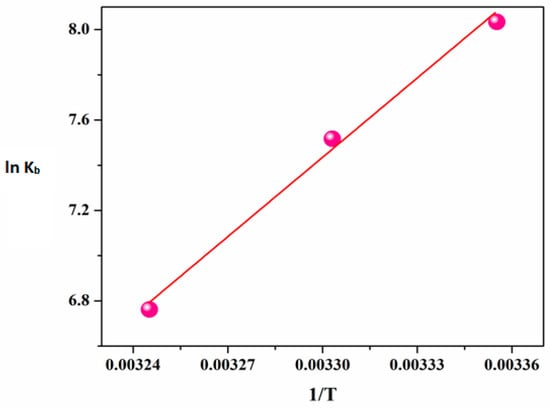
Figure 6.
Van’t Hoff plot for the binding of QP-11 to HSA.
All calculated values are listed in Table 3. The negative values of ΔG signify the spontaneity of the binding process. Further, the negative value of ΔS suggests that the process is not entropy driven but indicates the involvement of van der Waals force and hydrogen bonding between HSA and QP-11 in the interaction, contributing to the stability of the complex.

Table 3.
Binding constant and thermodynamic parameters of HSA–QP-11 interaction.
3.6. Synchronous Fluorescence
Synchronous fluorescence spectra simultaneously scan excitation and emission wavelengths with a fixed difference in wavelengths (Δλ). At Δλ = 15 nm and Δλ = 60 nm scans, it provides information about the involvement of Tyr and Trp residues, respectively. Figure 7 shows the resultant spectra of HSA at different concentrations of QP-11. The fluorescence intensity in both cases decreased continuously, with no remarkable shift in the wavelength [22]. This suggested that binding of QP-11 to HSA did not cause any significant change in the polarity of the microenvironment of Tyr and Trp residues; however, it induced a change in the internal packing of HSA [26].
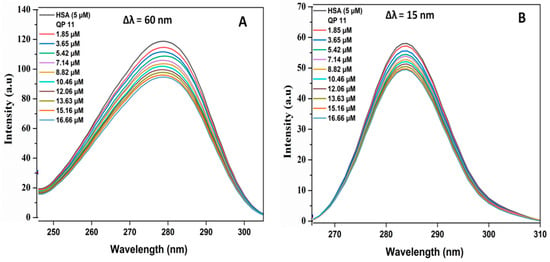
Figure 7.
Synchronous fluorescence spectra of HSA at different concentrations of QP-11 at (A) Δλ = 60 nm and (B) Δλ = 15 nm.
3.7. Three-Dimensional Fluorescence Spectroscopy
The 3D spectra of HSA and HSA with QP-11 are shown in Figure 8. In the figure, peak ‘a’ and peak ‘b’ arise due to first-order Rayleigh scattering (λex = λem) and the second-order Rayleigh scattering peak (λex = 2em), respectively. There is no observable elevation in peaks a and b in HSA upon QP-11 interaction. The peaks show no intensity changes, which indicates that QP-11 binding does not cause significant changes in the microenvironments of the aromatic residues that produce these signals or large-scale conformational changes in the protein. The π → π* transition of aromatic amino acids produces Peak I, which demonstrates the typical fluorescence patterns of tryptophan and tyrosine residues. The n → π* transition of the protein polypeptide backbone generates Peak II [25]. Changes in the fluorescence intensity of this peak are associated with the change in the conformation of the polypeptide backbone or the environment of the polypeptide [22]. The fluorescence intensity of both peaks I and II decreased significantly upon the binding of QP-11 to HSA, which suggested that disturbance of the polypeptide backbone structure of HSA and QP-11 induced the change in polarity and hydrophobicity around the Trp residue of HSA.
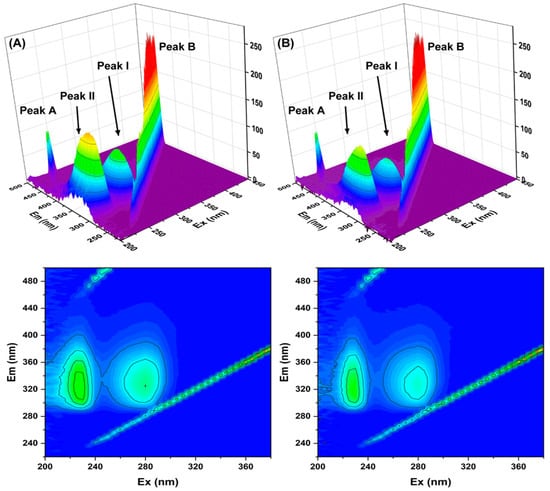
Figure 8.
Three-dimensional fluorescence spectra of (A) HSA and (B) HSA with QP-11.
3.8. Time-Resolved Fluorescence
The sensitivity of Time-Resolved Fluorescence (TRF) makes it a valuable tool for distinguishing between quenching mechanisms and accurately determining them, contributing to its widespread application in research [27]. Figure 9 shows the lifetime decay graph of HSA upon the interaction with QP-11. The fluorescence decay profile of free HSA in PBS at room temperature was best described by a triexponential model, suggesting the presence of three distinct fluorescence lifetimes (τ1, τ2, τ3) with different contributions (α1, α2, α3). All values are represented in Table 4. The average fluorescence lifetime (τavg) was calculated using Equation (6) and used for quenching analysis.
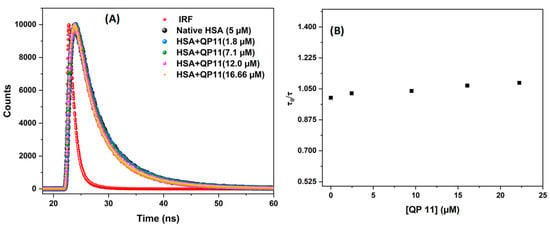
Figure 9.
(A) Decay profile of HSA after binding with QP-11; (B) Plot of τo/τ and QP-11.

Table 4.
Fluorescence decay data * of HSA (5 µM) with different concentrations of QP-11.
It was observed that the addition of the fluorescence lifetime (τav) of the fluorophore remained nearly unchanged upon incremental additions of QP-11, indicating that QP-11 does not significantly alter τav. This stability in lifetime supports the involvement of a static quenching mechanism in the QP-11–HSA interaction, consistent with observations from steady-state fluorescence measurements. Additionally, a linear plot of τ0/τ versus QP-11 concentration further reinforces the predominance of static quenching over dynamic quenching.
3.9. Circular Dichroism
The circular dichroism (CD) technique offers insights into a protein’s secondary structure. Particularly, far-UV CD spectra unveil information about the secondary structure of proteins. The CD spectrum of HSA presents two negative bands at 208 nm and 222 nm, indicative of its alpha-helix structure. Illustrated in Figure 10 are the CD spectra of HSA (5 µM) in PBS, accompanied by varying concentrations of QP-11 at 298 K. The graph highlights a slight elevation in the θ value upon introducing QP-11. By analyzing the θ values obtained from these spectra using Equation (7), the ellipticity for HSA both in the absence and presence of QP-11 at 208 nm was computed (as shown in Table 5). The α-helix in the HSA structure was calculated using equation (8) and found to be decreased by the addition of QP-11, from 73.8% in free HSA to 69.15%. The result indicated that QP-11 unfolded HSA by 4.65%. This observation suggests that QP-11 less significantly changed the protein’s secondary structure, leaving HSA as predominantly α-helical structure [28].
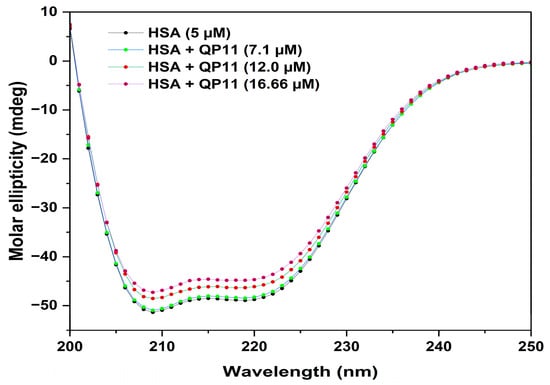
Figure 10.
CD spectra of the HSA–QP-11 system at 298 K.

Table 5.
α-helical content in HSA after interaction with QP-11 at different concentrations.
3.10. Molecular Docking
Molecular Docking is an important computational technique to understand the binding mode, binding site, and ligand–protein interaction [29]. The possible conformations of the QP-11–HSA complex were obtained using the Auto Dock program. We obtained nine modes, out of which the one with the highest number of interactions and the lowest binding energy was selected for further analysis. The binding affinity was found to be 8.9 Kcal/mol. The negative energy of binding indicates the spontaneity of the complex formation. There is a large hydrophobic cavity in subdomain IIA that many drugs bind [30]. As shown in Figure 11, QP-11 binds within subdomain IIA of HSA. QP-11 forms a hydrogen bond with four amino acid residues—Lys195, Arg222, Arg257, and Lys436—while it interacts with the remaining amino acid residues through van der Waals interactions (Figure 12a). The binding site of QP-11 is found to be deep within the hydrophobic cleft, interacting with 11 amino acids: Lys195, Lys199, Trp214, Arg218, Arg222, Leu238, Arg257, Ala291, Tyr452, Val455, and Lys436 (Figure 12b).
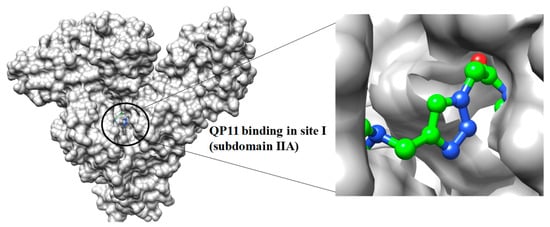
Figure 11.
Surface representation of HSA with bound QP-11.
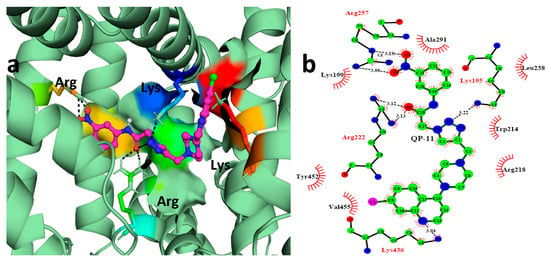
Figure 12.
(a) Graphical representation of interacting residues of HSA forming hydrogen bond with QP 11; (b) 2-D plot of HSA residues interacting with QP-11.
3.11. Molecular Dynamics Simulation Study
The root mean square fluctuation (RMSF) is employed to characterize local changes along the protein chain. On the plot (Figure 13A), peaks represent areas of the protein that fluctuate the most throughout the simulation. Alpha-helices and beta-strands show less fluctuation than loop regions because these structural elements maintain greater rigidity than the unstructured protein parts. The vertical green bars in the figure represent QP-11 interacting protein residues. The plot demonstrates numerous interactions of QP-11 with various residues of the HSA protein. Figure 13B shows the ligand RMSF, which shows the QP-11 fluctuations broken down by atom, with respect to the protein. The protein–ligand complex is first aligned on the protein backbone, and then the ligand RMSF is measured on the ligand heavy atoms. Here, the plot shows the relative stability of QP-11 fragments up to 20 atoms, after which there is a sharp fluctuation in the QP-11 structure upon interaction with the protein. Nevertheless, it remained bound in the binding pocket of the HSA protein. The RMSD (root mean square deviation) measures the average displacement change in selected atoms between a specific frame and its reference frame. The RMSD curve (Figure 13C) shows that both the free HSA and HSA–QP-11 systems had nearly identical RMSD values. Both systems show a stable level after 40 ns, indicating that the protein underwent negligible conformational change, and QP-11 remained stably fit into site I without diffusing away from its initial binding site throughout the simulation time period. Further, protein interactions with the ligand can be monitored through the simulation. Each interaction type contains more specific subtypes, which can be explored through the simulation interaction diagram. Figure 13D shows the interaction diagram between HSA and QP-11, categorized by type. For example, the Glu153 residue of the protein could maintain hydrogen bonding with QP-11 for almost 25% of the simulation time.
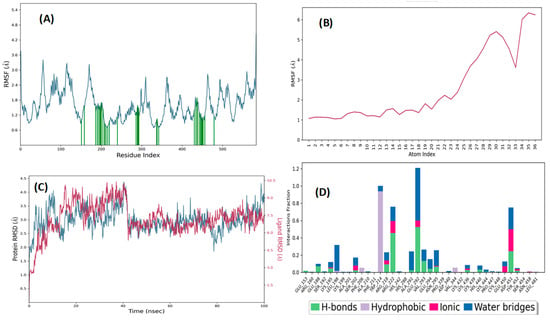
Figure 13.
(A) RMSF of HSA-QP-11; (B) ligand-RMSF; (C) Protein RMSD curve; (D) Interaction types and their fraction formed between HSA and QP-11.
4. Conclusions
The investigation into the interaction between QP-11 and HSA employed a diverse array of spectroscopic techniques, comprising fluorescence, time-resolved fluorescence, UV-VIS, and circular dichroism spectroscopy. Additionally, molecular docking methods and simulation approaches were integrated into the study. This comprehensive methodology facilitated a detailed and multifaceted analysis of the binding kinetics, structural changes, and molecular interactions governing the QP-11–HSA interaction. The observations collectively suggest that QP-11 binds moderately to HSA, leading to the formation of a stable complex through van der Waals forces and hydrogen bonding. The binding interaction induces conformational changes in HSA and is characterized by a 1:1 binding pattern. QP-11 quenched the fluorescence of HSA through a static quenching mechanism and binds to subdomain IIA of HSA. The interaction is sensitive to temperature changes and is accompanied by a decrease in the stability of the complex. Overall, the binding of QP-11 to HSA appears to be a spontaneous and thermodynamically favorable process with important implications for drug–protein interactions and pharmacological applications.
The results show a moderate reversible interaction between QP-11 and has, but we recognize that the effect of serum concentration on drug activity needs experimental confirmation. Previous studies on antimalarial compounds with comparable binding affinities have reported a minimal impact of serum proteins on efficacy [31,32]. Future research will concentrate on conducting systematic in vitro tests under different serum conditions and developing methods to measure free drug concentrations to validate the biological significance of QP-11–HSA binding.
Author Contributions
Conceptualization, M.A. and R.P.; methodology, B.A.; validation, M.A., A.A. and S.S.; formal analysis, H.T.A.A.; investigation, K.A., B.A. and A.U.; writing—original draft preparation, K.A., B.A. and A.U.; writing—review and editing, A.A.; project administration, M.A. All authors have read and agreed to the published version of the manuscript.
Funding
M.A. and S.S. received financial support from SERB, Govt. of India (CRG/2018/003967). K.A. received financial support from the UGC, Govt. of India, through a non-NET Fellowship. A.A. acknowledges the Department of Health (DHR) (File no: R.12014/61/2011-HR) for the Young Scientist award.
Institutional Review Board Statement
Not applicable.
Informed Consent Statement
Not applicable.
Data Availability Statement
Data will be available on request.
Conflicts of Interest
The authors declare no conflicts of interest.
Abbreviations
The following abbreviations are used in this manuscript:
| HSA | Human Serum Albumin |
| CD | Circular Dichroism |
| SAR | Structure–Activity Relationship |
| MD | Molecular Simulation |
| DMSO | Dimethyl Sulfoxide |
| DCM | Dichloromethane |
| NMR | Nuclear Magnetic Resonance |
| TRF | Time-Resolved Fluorescence |
| MRE | Mean Residue Ellipticity |
| LMA | Lamarckian Genetic Algorithm |
| RMSF | Root Mean Square Fluctuation |
| RMSD | Root Mean Square Deviation |
References
- Guantai, E.M.; Ncokazi, K.; Egan, T.J.; Gut, J.; Rosenthal, P.J.; Smith, P.J.; Chibale, K. Design, Synthesis and in Vitro Antimalarial Evaluation of Triazole-Linked Chalcone and Dienone Hybrid Compounds. Bioorg. Med. Chem. 2010, 18, 8243–8256. [Google Scholar] [CrossRef]
- Vandekerckhove, S.; D’hooghe, M. Quinoline-Based Antimalarial Hybrid Compounds. Bioorg. Med. Chem. 2015, 23, 5098–5119. [Google Scholar] [CrossRef]
- Aneja, B.; Kumar, B.; Jairajpuri, M.A.; Abid, M. A Structure Guided Drug-Discovery Approach towards Identification of Plasmodium Inhibitors. RSC Adv. 2016, 6, 18364–18406. [Google Scholar] [CrossRef]
- Uddin, A.; Gupta, S.; Shoaib, R.; Aneja, B.; Irfan, I.; Gupta, K.; Rawat, N.; Combrinck, J.; Kumar, B.; Aleem, M.; et al. Blood-Stage Antimalarial Activity, Favourable Metabolic Stability and in Vivo Toxicity of Novel Piperazine Linked 7-Chloroquinoline-Triazole Conjugates. Eur. J. Med. Chem. 2024, 264, 115969. [Google Scholar] [CrossRef]
- Aubry, A.-F.; Markoglou, N.; Adams, M.H.; Longstreth, J.; Wainer, I.W. The Effect of Co-Administered Drugs on Oxaprozin Binding to Human Serum Albumin. J. Pharm. Pharmacol. 1995, 47, 937–944. [Google Scholar] [CrossRef] [PubMed]
- Pragna Lakshmi, T.; Mondal, M.; Ramadas, K.; Natarajan, S. Molecular Interaction of 2,4-Diacetylphloroglucinol (DAPG) with Human Serum Albumin (HSA): The Spectroscopic, Calorimetric and Computational Investigation. Spectrochim. Acta Part A Mol. Biomol. Spectrosc. 2017, 183, 90–102. [Google Scholar] [CrossRef]
- Carter, D.C.; Ho, J.X. Structure of Serum Albumin. In Advances in Protein Chemistry; Elsevier: Amsterdam, The Netherlands, 1994; pp. 153–203. [Google Scholar]
- Yang, F.; Bian, C.; Zhu, L.; Zhao, G.; Huang, Z.; Huang, M. Effect of Human Serum Albumin on Drug Metabolism: Structural Evidence of Esterase Activity of Human Serum Albumin. J. Struct. Biol. 2007, 157, 348–355. [Google Scholar] [CrossRef]
- Ràfols, C.; Zarza, S.; Bosch, E. Molecular Interactions between Some Non-Steroidal Anti-Inflammatory Drugs (NSAID׳s) and Bovine (BSA) or Human (HSA) Serum Albumin Estimated by Means of Isothermal Titration Calorimetry (ITC) and Frontal Analysis Capillary Electrophoresis (FA/CE). Talanta 2014, 130, 241–250. [Google Scholar] [CrossRef] [PubMed]
- Azeem, K.; Irfan, I.; Rashid, Q.; Singh, S.; Patel, R.; Abid, M. Recent Updates on Interaction Studies and Drug Delivery of Antimalarials with Serum Albumin Proteins. Curr. Med. Chem. 2024, 31, 3925–3953. [Google Scholar] [CrossRef] [PubMed]
- Alterio, V.; Di Fiore, A.; D’Ambrosio, K.; Supuran, C.T.; De Simone, G. Multiple Binding Modes of Inhibitors to Carbonic Anhydrases: How to Design Specific Drugs Targeting 15 Different Isoforms? Chem. Rev. 2012, 112, 4421–4468. [Google Scholar] [CrossRef]
- Guarnera, E.; Berezovsky, I.N. Structure-Based Statistical Mechanical Model Accounts for the Causality and Energetics of Allosteric Communication. PLoS Comput. Biol. 2016, 12, e1004678. [Google Scholar] [CrossRef]
- Scott, D.E.; Bayly, A.R.; Abell, C.; Skidmore, J. Small Molecules, Big Targets: Drug Discovery Faces the Protein–Protein Interaction Challenge. Nat. Rev. Drug Discov. 2016, 15, 533–550. [Google Scholar] [CrossRef]
- Azeem, K.; Ahmed, M.; Mohammad, T.; Uddin, A.; Shamsi, A.; Hassan, M.I.; Singh, S.; Patel, R.; Abid, M. A Multi-Spectroscopic and Computational Simulations Study to Delineate the Interaction between Antimalarial Drug Hydroxychloroquine and Human Serum Albumin. J. Biomol. Struct. Dyn. 2023, 41, 6377–6393. [Google Scholar] [CrossRef]
- Guo, J.-L.; Liu, G.-Y.; Wang, R.-Y.; Sun, S.-X. Synthesis and Structure Elucidation of Two Essential Metal Complexes: In-Vitro Studies of Their BSA/HSA-Binding Properties, Docking Simulations, and Anticancer Activities. Molecules 2022, 27, 1886. [Google Scholar] [CrossRef] [PubMed]
- Kruger, S.; Ilmer, M.; Kobold, S.; Cadilha, B.L.; Endres, S.; Ormanns, S.; Schuebbe, G.; Renz, B.W.; D’Haese, J.G.; Schloesser, H.; et al. Advances in Cancer Immunotherapy 2019–Latest Trends. J. Exp. Clin. Cancer Res. 2019, 38, 268. [Google Scholar] [CrossRef] [PubMed]
- Niu, T.; Zhu, X.; Zhao, D.; Li, H.; Yan, P.; Zhao, L.; Zhang, W.; Zhao, P.; Mao, B. Unveiling Interaction Mechanisms between Myricitrin and Human Serum Albumin: Insights from Multi-Spectroscopic, Molecular Docking and Molecular Dynamic Simulation Analyses. Spectrochim. Acta Part A Mol. Biomol. Spectrosc. 2023, 285, 121871. [Google Scholar] [CrossRef]
- Patel, R.; Singh, B.; Sharma, A.; Wani, F.A.; Siddiquee, M.A.; Anand, A.; Malik, M.A.; Al-Thabaiti, S.A.; Khan, I. A Biophysical Approach to Study the Impact of Muscle Relaxant Drug Tizanidine on Stability and Activity of Serum Albumins. J. Mol. Recognit. 2023, 36, e3010. [Google Scholar] [CrossRef] [PubMed]
- Patel, R.; Maurya, N.; ud din Parray, M.; Farooq, N.; Siddique, A.; Verma, K.L.; Dohare, N. Esterase Activity and Conformational Changes of Bovine Serum Albumin toward Interaction with Mephedrone: Spectroscopic and Computational Studies. J. Mol. Recognit. 2018, 31, e2734. [Google Scholar] [CrossRef]
- Azeem, K.; Abdulhameed, H.T.; Hussain, A.; Amir, S.; Parveen, M.; Patel, R.; Abid, M. A Comprehensive Multispectroscopic and Computational Analysis of the Interaction between Plant-Based Antiplasmodial Compounds and Bovine Serum Albumin. ACS Omega 2024, 9, 5576–5591. [Google Scholar] [CrossRef]
- Azeem, K.; Ahmed, M.; Uddin, A.; Singh, S.; Patel, R.; Abid, M. Comparative Investigation on Interaction between Potent Antimalarials and Human Serum Albumin Using Multispectroscopic and Computational Approaches. Luminescence 2023, 38, 2018–2033. [Google Scholar] [CrossRef]
- Aneja, B.; Kumari, M.; Azam, A.; Kumar, A.; Abid, M.; Patel, R. Effect of Triazole-tryptophan Hybrid on the Conformation Stability of Bovine Serum Albumin. Luminescence 2018, 33, 464–474. [Google Scholar] [CrossRef]
- Geethanjali, H.S.; Nagaraja, D.; Melavanki, R.M.; Kusanur, R.A. Fluorescence Quenching of Boronic Acid Derivatives by Aniline in Alcohols–A Negative Deviation from Stern–Volmer Equation. J. Lumin. 2015, 167, 216–221. [Google Scholar] [CrossRef]
- Maurya, J.K.; Mir, M.U.H.; Maurya, N.; Dohare, N.; Ali, A.; Patel, R. A Spectroscopic and Molecular Dynamic Approach on the Interaction Between Ionic Liquid Type Gemini Surfactant and Human Serum Albumin. J. Biomol. Struct. Dyn. 2016, 34, 2130–2145. [Google Scholar] [CrossRef]
- Kumari, M.; Maurya, J.K.; Tasleem, M.; Singh, P.; Patel, R. Probing HSA-Ionic Liquid Interactions by Spectroscopic and Molecular Docking Methods. J. Photochem. Photobiol. B Biol. 2014, 138, 27–35. [Google Scholar] [CrossRef] [PubMed]
- Zhang, G.; Wang, Y.; Zhang, H.; Tang, S.; Tao, W. Human Serum Albumin Interaction with Paraquat Studied Using Spectroscopic Methods. Pestic. Biochem. Physiol. 2007, 87, 23–29. [Google Scholar] [CrossRef]
- Kumari, M.; Singh, U.K.; Singh, P.; Patel, R. Effect of N-Butyl-N-Methyl-Morpholinium Bromide Ionic Liquid on the Conformation Stability of Human Serum Albumin. ChemistrySelect 2017, 2, 1241–1249. [Google Scholar] [CrossRef]
- Pasricha, S.; Sharma, D.; Ojha, H.; Gahlot, P.; Pathak, M.; Basu, M.; Chawla, R.; Singhal, S.; Singh, A.; Goel, R.; et al. Luminescence, Circular Dichroism and in Silico Studies of Binding Interaction of Synthesized Naphthylchalcone Derivatives with Bovine Serum Albumin. Luminescence 2017, 32, 1252–1262. [Google Scholar] [CrossRef]
- Kheirdoosh, F.; Kashanian, S.; Khodaei, M.M.; Sariaslani, M.; Falsafi, M.; Moghadam, N.H.; Salehzadeh, S.; Pazhavand, M.; Kashanian, M. Spectroscopic Studies on the Interaction of Aspartame with Human Serum Albumin. Nucleosides Nucleotides Nucleic Acids 2021, 40, 300–316. [Google Scholar] [CrossRef]
- Kragh-Hansen, U.; Chuang, V.T.G.; Otagiri, M. Practical Aspects of the Ligand-Binding and Enzymatic Properties of Human Serum Albumin. Biol. Pharm. Bull. 2002, 25, 695–704. [Google Scholar] [CrossRef]
- Shi, J.; Pan, D.; Wang, X.; Liu, T.-T.; Jiang, M.; Wang, Q. Characterizing the Binding Interaction between Antimalarial Artemether (AMT) and Bovine Serum Albumin (BSA): Spectroscopic and Molecular Docking Methods. J. Photochem. Photobiol. B Biol. 2016, 162, 14–23. [Google Scholar] [CrossRef]
- Chen, R.; Jiang, H.; Pu, H. Interaction of Artemisinin and Its Derivatives with Human Serum Albumin Studied Using Spectroscopies and Molecular Modeling Methods. Mol. Biol. Rep. 2013, 40, 4791–4804. [Google Scholar] [CrossRef] [PubMed]
Disclaimer/Publisher’s Note: The statements, opinions and data contained in all publications are solely those of the individual author(s) and contributor(s) and not of MDPI and/or the editor(s). MDPI and/or the editor(s) disclaim responsibility for any injury to people or property resulting from any ideas, methods, instructions or products referred to in the content. |
© 2025 by the authors. Published by MDPI on behalf of the Österreichische Pharmazeutische Gesellschaft. Licensee MDPI, Basel, Switzerland. This article is an open access article distributed under the terms and conditions of the Creative Commons Attribution (CC BY) license (https://creativecommons.org/licenses/by/4.0/).