Abstract
Background/Objective: Diabetic nephropathy (DN), a key microvascular complication of type 2 diabetes (T2DM), drives significant morbidity, mortality, and healthcare costs. Vitamin D deficiency has been linked to renal dysfunction, but its role in DN remains unclear. This study assessed the association between vitamin D status and DN versus T2DM without nephropathy. Methods: This cross-sectional hospital-based study included 399 participants (299 DN, 100 T2DM without nephropathy) at a tertiary endocrine clinic. Demographic, clinical, and biochemical data, including serum 25(OH)D, were collected. Chi-square and Mann–Whitney compared categorical and continuous variables, respectively, and multinomial logistic regression assessed the association between vitamin D status and DN (p < 0.05). Results: Patients with DN were older (58.2 ± 7.95 vs. 51.4 ± 9.94 years, p < 0.001), had more advanced CKD (stages 2–3b: 84.6% vs. 20.0%, p < 0.001), and higher albuminuria (moderate: 80.3% vs. 19.0%; severe: 18.4% vs. 0%, p < 0.001). They also showed poorer glycemic control, elevated urea and creatinine, lower serum albumin, dyslipidemia, elevated liver enzymes, and higher uric acid (all p < 0.05). Vitamin D deficiency was more prevalent in DN (37.7% vs. 8.0%, p < 0.001). Unadjusted multinomial regression indicated that T2DM patients without nephropathy had a 91% lower risk of vitamin D deficiency (RRR 0.09; 95% CI 0.04–0.19, p < 0.001) and an 87% lower risk of insufficiency (RRR 0.13; 95% CI 0.05–0.26, p < 0.001) compared with DN patients. After adjusting for age, HbA1c, creatinine, duration of diabetes and eGFR, the reduced risk of deficiency remained significant (RRR 0.04; 95% CI 0.01–0.16, p < 0.001), while the association with insufficiency was no longer significant (p = 0.310). Conclusions: This study shows a significant association between vitamin D deficiency and diabetic nephropathy, though its cross-sectional design precludes causal inference. Reverse causality and residual confounding cannot be excluded. Patients with DN had poorer glycemic control, dyslipidemia, and renal function, along with more frequent vitamin D deficiency. Routine vitamin D monitoring may support early detection and risk stratification in T2DM.
1. Introduction
Diabetic nephropathy (DN) is one of the most common microvascular complications of type 2 diabetes mellitus (T2DM) and the leading cause of end-stage renal disease (ESRD) worldwide [1,2]. Approximately 30–40% of individuals with T2DM develop DN during their lifetime, contributing substantially to morbidity, mortality, and healthcare costs [1]. The pathological hallmarks of DN include glomerular basement membrane thickening, mesangial expansion, podocyte injury, and a progressive decline in glomerular filtration rate (GFR), ultimately culminating in kidney failure [2]. Given the multifactorial nature of DN, exploration of additional modifiable factors beyond traditional risks is critical.
Beyond traditional risk factors such as poor glycemic control, hypertension, and dyslipidemia, vitamin D deficiency has emerged as a plausible modifiable risk factor for the onset and progression of DN [3,4]. Vitamin D, classically known for its role in calcium and phosphate metabolism, also exerts pleiotropic effects including modulation of the renin–angiotensin–aldosterone system (RAAS), anti-inflammatory and antifibrotic actions, and protective effects on podocytes [5,6,7]. Hypovitaminosis D is common among individuals with diabetes and has been associated with insulin resistance, albuminuria, and reduced kidney function [8]. Experimental studies demonstrate that activation of the vitamin D receptor (VDR) in podocytes can attenuate glomerular injury and proteinuria, providing a mechanistic basis for its potential protective role in DN [9].
Vitamin D deficiency may contribute to DN through multiple mechanistic pathways. Reduced renal 1α-hydroxylase activity in chronic kidney disease impairs conversion of 25(OH)D to its active form, while urinary loss of vitamin D-binding protein in proteinuria and secondary hyperparathyroidism can further exacerbate deficiency. Activation of the vitamin D receptor (VDR) in podocytes has been shown to attenuate glomerular injury and proteinuria, providing a mechanistic basis for its potential protective role in DN [10]. These mechanisms suggest that low vitamin D status could both reflect and contribute to renal dysfunction in diabetes.
Observational and mechanistic studies have linked low vitamin D levels with adverse renal outcomes in T2DM. Severe 25-hydroxyvitamin D [25(OH)D] deficiency has been associated with higher urine albumin-to-creatinine ratio (UACR) and worse renal prognosis [11], while cohort studies suggest low vitamin D predicts both eGFR decline and progression of albuminuria [12,13]. Yet, despite supportive evidence, the role of vitamin D deficiency in diabetic nephropathy remains uncertain, particularly in real-world settings. To address this gap, we conducted a hospital-based cross-sectional study evaluating the association between vitamin D deficiency and DN in patients with T2DM, with the primary objective of describing how vitamin D status differs between patients with and without nephropathy in routine care.
2. Materials and Methods
2.1. Study Design and Setting
This was a cross-sectional, hospital-based observational study conducted at the Endocrinology outpatient clinic of a tertiary care public teaching hospital. Eligible patients attending the outpatient clinics were recruited consecutively between April 2022 and March 2025. All participants provided written informed consent prior to enrollment. The study was approved by the Institutional Ethics Committee and conducted in accordance with the Declaration of Helsinki [14].
2.2. Study Population
A total of 399 participants were included, comprising 299 patients with diabetic nephropathy (DN) and 100 patients with type 2 diabetes mellitus (T2DM) without nephropathy (control group). DN was defined according to Kidney Disease: Improving Global Outcomes (KDIGO) guidelines as the presence of persistent albuminuria, with UACR ≥ 30 mg/g confirmed in at least two of three consecutive samples, with or without reduced estimated glomerular filtration rate (eGFR < 60 mL/min/1.73 m2) [15].
2.3. Inclusion and Exclusion Criteria
Eligible participants were adults aged ≥ 18 years with a confirmed diagnosis of T2DM based on American Diabetes Association (ADA) criteria [16]. Exclusion criteria included type 1 diabetes, gestational diabetes, or secondary causes of nephropathy such as glomerulonephritis, obstructive uropathy, or polycystic kidney disease. Patients with acute kidney injury, chronic liver disease, or systemic infections were also excluded. To minimize confounding, individuals who had received vitamin D supplementation or active vitamin D analogs within the preceding three months were not enrolled.
2.4. Clinical and Demographic Assessment
Clinical and demographic information was collected using a structured case record form and verified against medical records. Variables recorded included gender, age (in years), residence status (rural or urban), and body mass index (BMI). Lifestyle factors such as exercise frequency (daily, rare, or never) and smoking status (current, past, or never) were documented. Socioeconomic details included income source (regular vs. no regular income). Family history of diabetes was also noted. Clinical details comprised diagnosis type (DN and T2DM without nephropathy), duration of diabetes (years since diagnosis), and the presence of comorbidities such as hypertension, anemia, hypothyroidism, dyslipidemia, etc.
2.5. Laboratory Measurements
Laboratory results were obtained directly from patient medical records during face-to-face interviews. Glycemic status was assessed through fasting blood glucose (FBS) and glycated hemoglobin (HbA1c). Blood pressure was documented as systolic (SBP) and diastolic (DBP) values. Renal function was evaluated by serum urea, serum creatinine, estimated glomerular filtration rate (eGFR, calculated using the CKD-EPI equation [16]), and CKD staging. Spot urine albumin and creatinine were measured to calculate the albumin-to-creatinine ratio (ACR). Additional biochemical variables included alkaline phosphatase (ALP), total protein, serum glutamic oxaloacetic transaminase (SGOT), serum glutamic pyruvic transaminase (SGPT), serum albumin, bilirubin, calcium, phosphorus, sodium (Na), potassium (K), and uric acid. Hematological evaluation included hemoglobin (Hb). Lipid profile assessment comprised total cholesterol, high-density lipoprotein (HDL), low-density lipoprotein (LDL), and triglycerides (TG). Serum 25-hydroxyvitamin D (25(OH)D) had been measured using a chemiluminescence immunoassay. Vitamin D status was categorized according to Endocrine Society guidelines as deficient (<20 ng/mL), insufficient (20–29.9 ng/mL), or sufficient (≥30 ng/mL) [17]. UACR was calculated from spot urine albumin and creatinine measurements, with values classified according to KDIGO guidelines as normal (<30 mg/g), moderately increased (30–300 mg/g), or severely increased (>300 mg/g) [15].
2.6. Statistical Analysis
Continuous variables were expressed as mean ± standard deviation (SD), and categorical variables as frequencies and percentages. Between-group differences were evaluated using Mann–Whitney (non-parametric test) for continuous data and Chi-square test for categorical data. The independent association between vitamin D status and DN was assessed using multinomial logistic regression models, with a priori adjustment for key clinical confounders (age, HbA1c, serum creatinine, eGFR, and duration of diabetes), given their established roles in diabetic nephropathy and potential relationships with vitamin D status. Results were expressed as relative risk ratios (RRRs) with 95% confidence intervals (CIs). Missing data were assessed for extent and patterns. Variables with <15% missingness were imputed using multiple imputation, assuming data were missing at random. Variables with excessive missingness were not imputed to avoid bias. All statistical analyses were performed in STATA 18, and a p-value < 0.05 was considered statistically significant.
3. Results
It should provide a concise and precise description of the experimental results, their interpretation, as well as the experimental conclusions that can be drawn.
3.1. Demographic and Clinical Characteristics
A total of 399 participants were included in the analysis, comprising 299 with diabetic nephropathy and 100 with type 2 diabetes mellitus without nephropathy. The demographic and clinical characteristics of the study population are summarized in Table 1.

Table 1.
Demographic and Clinical Characteristics by DN and T2DM without DN.
Patients with DN were significantly older than those without nephropathy (123 (41.1%) vs. 18 (18%); p < 0.001). Gender distribution was comparable between groups, with females accounting for roughly two-thirds of participants in both cohorts (p = 0.82). Body mass index differed significantly, as low or normal BMI was more frequent in the T2DM group compared with DN (70.0% vs. 58.9%; p = 0.047). Residence status, smoking behavior, and income source were similar across the two groups (all p > 0.05).
Lifestyle characteristics also showed modest differences. Daily exercise was reported by 55.0% of participants with T2DM and 43.5% of those with DN, although this difference did not reach statistical significance (p = 0.082). Other exercise frequencies, as well as smoking status, showed no meaningful variation between groups.
Marked contrasts were observed in kidney disease staging. The majority of participants with T2DM were in CKD stage 1 (80.0%), while DN patients were more frequently distributed across stages 2 (47.8%), 3a (23.4%), and 3b (13.4%) (p < 0.001).
A similar pattern was seen for albumin-to-creatinine ratio categories. Most DN patients were in moderate microalbuminuria (80.3%) or severe macroalbuminuria (18.4%), whereas nearly half of T2DM participants were in the normal ACR range (49.0%), with a substantial proportion lacking ACR data (32.0%) (p < 0.001).
Family history of T2DM was more common among participants with DN than those without nephropathy (53.7% vs. 40.0%, p = 0.018). Disease duration was strongly associated with nephropathy status. Among individuals with shorter diabetes duration (≤5 years), 65.0% were in the T2DM without nephropathy group compared with only 19.7% of DN patients. Conversely, long-standing diabetes (>5 years) was observed in 80.3% of DN patients compared with 35.0% of those without nephropathy (p < 0.001).
3.2. Biochemical Characteristics
The biochemical characteristics of the study population are presented in Table 2. Continuous biochemical variables were not normally distributed in at least one group; therefore, data are presented as median [interquartile range], and between-group comparisons were performed using the Mann–Whitney U test.
Table 2.
Biochemical Characteristics by DN and T2DM without DN.
Patients with DN were significantly older than those without nephropathy (median age 58 (51–63)vs. 51 (46–57) years; p < 0.001). Glycemic parameters, including HbA1c and fasting blood sugar, were also higher in the DN group (HbA1c 8.2 (7.5–9.0%) vs. 7.3 (6.8–7.7%), p < 0.001; FBS 149 (135–162) mg/dL vs. 142 (130–155) mg/dL, p = 0.0005).
Renal function markers were worse in the DN group, with higher urea (31 (24–38) mg/dL vs. 22 (18–27) mg/dL; p < 0.001) and creatinine levels (1.35 (1.0–1.7) mg/dL vs. 0.82 (0.7–0.9) mg/dL; p < 0.001). Serum albumin was lower in DN patients (4.0 (3.7–4.3) g/dL vs. 4.48 (4.3–4.6) g/dL; p < 0.001), whereas hemoglobin levels were comparable between groups (p = 0.466).
Lipid profile analysis showed that HDL was lower (42 (37–47) mg/dL vs. 48 (44–52) mg/dL; p < 0.001), while LDL levels did not differ significantly (90 (74–110) mg/dL vs. 86 (77–98) mg/dL; p = 0.431). Triglycerides and TG/HDL ratio were higher in DN patients (176 (120–220) mg/dL vs. 134 (100–170) mg/dL, p < 0.001; TG/HDL 4.4 (2.9–6.0) vs. 2.9 (2.0–3.5), p < 0.001).
Liver function tests, including SGPT and SGOT, were elevated in DN (SGPT 30 (22–36) vs. 18 (15–22) U/L, p < 0.001; SGOT 25 (19–31) vs. 21 (16–25) U/L, p = 0.013). ALP levels, sodium, and potassium showed no clinically meaningful differences. Uric acid was higher in DN patients (5.7 (4.8–6.6) mg/dL vs. 4.4 (3.8–5.0) mg/dL; p = 0.0061).
3.3. Prevalence of Vitamin D Deficiency in DN and T2DM Without DN
The prevalence of vitamin D deficiency and insufficiency differed significantly between groups (p < 0.001). Among patients with diabetic nephropathy, 37.4% (n = 112) were vitamin D deficient and 29.1% (n = 87) were insufficient, compared with 8.0% (n = 8) and 9.0% (n = 9), respectively, in patients with T2DM without DN. Conversely, vitamin D sufficiency was more common in the T2DM without DN group 83.0% (n = 83) compared with the DN group 33.4% (n = 100) [Figure 1].
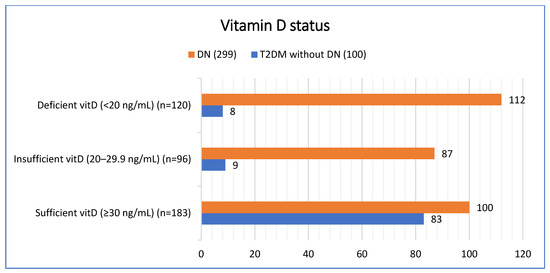
Figure 1.
Vitamin D status based on patient groups.
In the subgroup analysis, Vitamin D status did not differ significantly between males and females (χ2(2) = 0.68, p = 0.71). Among females (n = 271), 78 (28.78%) were deficient, 66 (24.35%) were insufficient, and 127 (46.86%) were sufficient. Among males (n = 128), 42 (32.81%) were deficient, 30 (23.44%) were insufficient, and 56 (43.75%) were sufficient. Vitamin D status was significantly associated with age (χ2(2) = 9.52, p = 0.009). Among adults <60 years (n = 258), 76 (29.46%) were deficient, 51 (19.77%) were insufficient, and 131 (50.78%) were sufficient. Among elderly ≥60 years (n = 141), 44 (31.21%) were deficient, 45 (31.91%) were insufficient, and 52 (36.88%) were sufficient. No significant differences were observed across BMI groups (χ2(2) = 3.04, p = 0.218). In the normal/low BMI group (n = 246), 76 (30.89%) were deficient, 65 (26.42%) insufficient, and 105 (42.68%) sufficient. In the obese/overweight group (n = 153), 44 (28.76%) were deficient, 31 (20.26%) insufficient, and 74 (50.98%) sufficient. Vitamin D status was significantly associated with disease duration (χ2(2) = 8.66, p = 0.013). Among patients with shorter duration (≤5 years, n = 124), 35 (28.23%) were deficient, 20 (16.13%) were insufficient, and 68 (55.65%) were sufficient. Among patients with longer duration (>5 years, n = 275), 85 (30.91%) were deficient, 76 (27.64%) were insufficient, and 114 (41.45%) were sufficient [Table 3].
Table 3.
Vitamin D Status across different subgroups.
3.4. Association Between Vitamin D Deficiency with DN and T2DM Without DN
We investigated the association between patient group (diabetic nephropathy vs. type 2 diabetes mellitus without nephropathy) and vitamin D status using multinomial logistic regression. Vitamin D sufficiency (30–100 ng/mL) was used as the reference outcome, and DN served as the reference group for patient group comparisons.
In unadjusted analyses, compared with DN patients, the relative risk of vitamin D deficiency was substantially lower among T2DM patients without nephropathy (RRR = 0.09, 95% CI: 0.04–0.19, p < 0.001), corresponding to a 91% lower risk. Similarly, the relative risk of vitamin D insufficiency was markedly reduced in this group (RRR = 0.13, 95% CI: 0.06–0.26, p < 0.001), reflecting an 87% lower risk. These findings indicate that vitamin D deficiency and insufficiency are significantly more prevalent among individuals with DN compared with those with T2DM without nephropathy [Table 4].
Table 4.
Association of Vitamin D status with DN and T2DM without DN.
After adjusting for age, HbA1c, creatinine, eGFR, and duration of diabetes, variables selected a priori because longer diabetes duration and worse metabolic control are central determinants of both DN and vitamin D status, the association with deficiency remained strong and statistically significant (RRR = 0.041; 95% CI: 0.01–0.16; p < 0.001), whereas the lower relative risk of insufficiency (RRR = 0.56; 95% CI: 0.18–1.71) did not reach significance (p = 0.310). The adjusted model was significant (LR χ2(10) = 90.90, p < 0.001), showing patient group as a key determinant of vitamin D status. The modest variance explained (pseudo-R2 = 0.11) indicates these findings are exploratory rather than predictive. Given that data on hypertension was insufficiently documented, hypertension was excluded from the primary adjusted model. Therefore, the possibility of residual confounding by hypertension and other unmeasured variables must be acknowledged when interpreting the observed association between vitamin D status and DN.
4. Discussion
This study demonstrated a markedly higher prevalence of vitamin D deficiency and insufficiency among patients with diabetic nephropathy (DN) compared with those with T2DM without nephropathy. Nearly two-thirds (67%) of individuals with DN had suboptimal vitamin D status, whereas vitamin D sufficiency predominated in the non-DN group. These findings are consistent with prior evidence reporting lower serum 25-hydroxyvitamin D [25(OH)D] concentrations among patients with diabetic microvascular complications [18], with individuals with nephropathy exhibiting higher rates of deficiency than those without nephropathy [19]. Collectively, these observations reinforce the growing body of literature suggesting a potential link between vitamin D status and the development or progression of DN.
In subgroup analyses, vitamin D status did not differ significantly by sex or BMI, suggesting that renal involvement may be a more important determinant of vitamin D levels than anthropometric characteristics. This aligns with findings from Hong et al. (2021), who reported that vitamin D deficiency in Korean patients with T2DM was more strongly associated with the presence of nephropathy than with sex or body size [20]. In contrast, increasing age and longer diabetes duration were associated with lower vitamin D sufficiency in our cohort. These observations are consistent with prior evidence of age-related declines in cutaneous vitamin D synthesis, including a ~13% reduction in vitamin D3 production per decade following standardized ultraviolet exposure (Chalcraft et al., 2020) and a >50% reduction in skin 7-dehydrocholesterol between ages 20 and 80, as noted in the international consensus by Giustina et al. (2022) [21,22]. Additionally, longstanding diabetes and cumulative metabolic burden may contribute to hypovitaminosis D through mechanisms involving insulin resistance and β-cell dysfunction (Chiu et al., 2004) [23]. These findings suggest that age-related physiological changes and chronic diabetes exposure, rather than sex or BMI, are key determinants of vitamin D status in patients with T2DM, highlighting the need for closer monitoring of older adults and those with longer disease duration who may be at greater risk of deficiency and DN progression.
Multinomial regression demonstrated a significant association between vitamin D deficiency and DN, which remained robust after adjustment for age, HbA1c, creatinine, diabetes duration, and eGFR. However, the cross-sectional design limits causal interpretation, and reverse causality or residual confounding cannot be excluded. These results are further supported by a recent meta-analysis indicating that low vitamin D status is associated with both increased risk and greater severity of DN [24]. Although the association is strong, the relationship may be bidirectional: DN can reduce renal 1α-hydroxylase activity, impair conversion of 25(OH)D to its active form, and increase urinary loss of vitamin D-binding protein, with secondary hyperparathyroidism further exacerbating deficiency in chronic kidney disease [25]. Conversely, vitamin D may influence DN pathogenesis through activation of the vitamin D receptor (VDR), which suppresses renin–angiotensin–aldosterone system activity, reduces podocyte injury, and limits glomerular inflammation and fibrosis [5]. Additionally, potential seasonal variation in sunlight exposure was not fully accounted for, as the timing of blood draws differed between DN and non-DN groups, which may have influenced vitamin D levels and introduced bias. Given this interplay, the direction of causality cannot be determined from these observational data, and findings should be interpreted as evidence of association rather than causation.
Interestingly, the association between vitamin D insufficiency and DN was attenuated after adjustment for confounders, whereas the relationship with frank deficiency persisted. This suggests that severe deficiency may be more directly linked to renal injury, while moderate insufficiency may overlap with other risk factors such as glycemic control and reduced kidney function, consistent with prior studies showing stronger associations for deficiency than insufficiency [26,27,28].
The strengths of this study include a relatively large hospital-based sample, standardized biochemical and vitamin D assessments, subgroup analyses, and multivariable adjustment for key clinical covariates. However, several limitations warrant consideration. The cross-sectional, observational design precludes causal inference, and the lack of longitudinal follow-up prevents assessment of whether vitamin D deficiency predicts progression of DN. Vitamin D was measured only once, and potential confounders such as diet, supplementation, sunlight exposure, and other biomarkers (e.g., parathyroid hormone, FGF-23) were not assessed. Furthermore, the single-center design and group imbalance (299 DN vs. 100 controls) may introduce selection bias and limit generalizability.
The findings also invite future prospective studies to investigate whether vitamin D deficiency predicts longitudinal changes in renal outcomes among patients with T2DM. Randomized controlled trials stratified by baseline vitamin D status are warranted to determine whether targeted supplementation can prevent or slow the DN progression. Such trials should incorporate relevant biomarkers, including parathyroid hormone, FGF-23, UACR, eGFR, and lipid parameters, to better characterize risk profiles and identify patients most likely to benefit from intervention. Integrating vitamin D measurements into multi-biomarker risk models may enhance personalized risk stratification and clinical decision-making.
5. Conclusions
This study demonstrates that vitamin D deficiency is significantly associated with diabetic nephropathy, independent of other metabolic abnormalities. However, given the cross-sectional design, causality cannot be inferred, and the possibility of reverse causality and residual confounding remains. DN patients exhibited worse glycemic control, dyslipidemia, and renal dysfunction alongside higher rates of vitamin D deficiency. These findings support the potential value of routinely assessing vitamin D status in patients with T2DM, particularly those with longer disease duration or declining renal function. Identifying and addressing vitamin D deficiency may aid early risk stratification and guide individualized monitoring for DN progression.
Author Contributions
Conceptualization, S.B., G.M.I. and M.A.G.; methodology, S.B., G.M.I., M.A.G.; project administration, S.B., G.M.I. and M.A.G.; software, S.A., M.A., A.H., I.A. and K.U.K.; investigation/data collection, S.B. and I.M.; data curation, S.B. and I.M.; resources, G.M.I., M.A.G. and I.W.; formal analysis, S.B., S.A., M.A., A.H., I.A. and K.U.K.; writing—original draft, S.B., G.M.I., I.M. and I.A.; writing review and editing, S.B., G.M.I., I.W., S.A., M.A., M.A.G., A.H. and K.U.K.; supervision, G.M.I., I.W. and M.A.G.; validation, G.M.I.; Visualization, S.A., G.M.I. and S.B. All authors have read and agreed to the published version of the manuscript.
Funding
This research has been funded by Scientific Research Deanship at University of Ha’il—Saudi Arabia through project number RG-23 044.
Institutional Review Board Statement
All procedures involving human participants were conducted in accordance with the ethical standards of the Human Ethics and Research Committee of SKIMS (131/IEC-SKIMS/2022-454, approved in 29 October 2022).
Informed Consent Statement
Informed consent was obtained from all individual participants included in the study.
Data Availability Statement
The datasets generated and/or analyzed during the current study are not publicly available due to institutional and ethical restrictions.
Conflicts of Interest
The authors declare no conflict of interest.
Abbreviations
The following abbreviations are used in this manuscript:
| Abbreviation | Full Form |
| 25(OH)D | 25-Hydroxyvitamin D |
| ADA | American Diabetes Association |
| ACR | Albumin-to-Creatinine Ratio |
| ALP | Alkaline Phosphatase |
| ALT/SGPT | Serum Glutamic Pyruvic Transaminase |
| AST/SGOT | Serum Glutamic Oxaloacetic Transaminase |
| BMI | Body Mass Index |
| BP | Blood Pressure |
| CKD | Chronic Kidney Disease |
| CKD-EPI | Chronic Kidney Disease Epidemiology Collaboration |
| DN | Diabetic Nephropathy |
| DM | Diabetes Mellitus |
| eGFR | Estimated Glomerular Filtration Rate |
| ESRD | End-Stage Renal Disease |
| FBS | Fasting Blood Sugar |
| HbA1c | Glycated Hemoglobin |
| HDL | High-Density Lipoprotein |
| KDIGO | Kidney Disease: Improving Global Outcomes |
| LDL | Low-Density Lipoprotein |
| Na | Sodium |
| K | Potassium |
| PTH | Parathyroid Hormone |
| RAAS | Renin–Angiotensin–Aldosterone System |
| RRR | Relative Risk Ratio |
| SD | Standard Deviation |
| STATA 18 | Statistical Analysis Software |
| T2DM | Type 2 Diabetes Mellitus |
| TG | Triglycerides |
| UACR | Urine Albumin-to-Creatinine Ratio |
| VDR | Vitamin D Receptor |
References
- Jha, R.; Lopez-Trevino, S.; Kankanamalage, H.R.; Jha, J.C. Diabetes and Renal Complications: An Overview on Pathophysiology, Biomarkers and Therapeutic Interventions. Biomedicines 2024, 12, 1098. [Google Scholar] [CrossRef] [PubMed]
- Ratan, Y.; Rajput, A.; Pareek, A.; Pareek, A.; Singh, G. Comprehending the Role of Metabolic and Hemodynamic Factors Alongside Different Signaling Pathways in the Pathogenesis of Diabetic Nephropathy. Int. J. Mol. Sci. 2025, 26, 3330. [Google Scholar] [CrossRef]
- Wang, Y.; Yang, S.; Zhou, Q.; Zhang, H.; Yi, B. Effects of Vitamin D Supplementation on Renal Function, Inflammation and Glycemic Control in Patients with Diabetic Nephropathy: A Systematic Review and Meta-Analysis. Kidney Blood Press. Res. 2019, 44, 72–87. [Google Scholar] [CrossRef] [PubMed]
- Joergensen, C.; Tarnow, L.; Goetze, J.P.; Rossing, P. Vitamin D analogue therapy, cardiovascular risk and kidney function in people with Type 1 diabetes mellitus and diabetic nephropathy: A randomized trial. Diabet. Med. 2015, 32, 374–381. [Google Scholar] [CrossRef] [PubMed]
- Zhang, Y.; Kong, J.; Deb, D.K.; Chang, A.; Li, Y.C. Vitamin D receptor attenuates renal fibrosis by suppressing the renin-angiotensin system. J. Am. Soc. Nephrol. 2010, 21, 966–973. [Google Scholar] [CrossRef]
- Secondulfo, C.; Visco, V.; Virtuoso, N.; Fortunato, M.; Migliarino, S.; Rispoli, A.; La Mura, L.; Stellato, A.; Caliendo, G.; Settembre, E.; et al. Vitamin D: A Bridge between Kidney and Heart. Life 2024, 14, 617. [Google Scholar] [CrossRef]
- Lai, Y.-H.; Fang, T.-C. The Pleiotropic Effect of Vitamin D. Int. Sch. Res. Not. 2013, 2013, 898125. [Google Scholar] [CrossRef]
- Zomorodian, S.A.; Shafiee, M.; Karimi, Z.; Masjedi, F.; Roshanshad, A. Assessment of the relationship between 25-hydroxyvitamin D and albuminuria in type 2 diabetes mellitus. BMC Endocr. Disord. 2022, 22, 171. [Google Scholar] [CrossRef]
- Trohatou, O.; Tsilibary, E.F.; Charonis, A.; Iatrou, C.; Drossopoulou, G. Vitamin D3 ameliorates podocyte injury through the nephrin signalling pathway. J. Cell. Mol. Med. 2017, 21, 2599–2609. [Google Scholar] [CrossRef]
- Wang, H.; Yuan, T.; Wu, W.; Ou, S. Vitamin D and chronic kidney disease: Mechanisms, clinical implications, and future perspectives. Front. Med. 2025, 12, 1643415. [Google Scholar] [CrossRef]
- Duan, S.; Lu, F.; Wu, B.; Zhang, C.; Nie, G.; Sun, L.; Huang, Z.; Guo, H.; Zhang, B.; Xing, C.; et al. Association of Serum 25 (OH) Vitamin D With Chronic Kidney Disease Progression in Type 2 Diabetes. Front. Endocrinol. 2022, 13, 929598. [Google Scholar] [CrossRef] [PubMed]
- Kim, S.G.; Kim, G.S.; Lee, J.H.; Moon, A.E.; Yoon, H. The relationship between vitamin D and estimated glomerular filtration rate and urine microalbumin/creatinine ratio in Korean adults. J. Clin. Biochem. Nutr. 2018, 62, 94–99. [Google Scholar] [CrossRef] [PubMed]
- de Boer, I.H.; Sachs, M.C.; Chonchol, M.; Himmelfarb, J.; Hoofnagle, A.N.; Ix, J.H.; Kremsdorf, R.A.; Lin, Y.S.; Mehrotra, R.; Robinson-Cohen, C.; et al. Estimated GFR and circulating 24,25-dihydroxyvitamin D3 concentration: A participant-level analysis of 5 cohort studies and clinical trials. Am. J. Kidney Dis. 2014, 64, 187–197. [Google Scholar] [CrossRef] [PubMed]
- World Medical Association. World Medical Association Declaration of Helsinki: Ethical principles for medical research involving human subjects. JAMA 2013, 310, 2191–2194. [Google Scholar] [CrossRef]
- Kidney Disease: Improving Global Outcomes (KDIGO) CKD Work Group. KDIGO 2024 Clinical Practice Guideline for the Evaluation and Management of Chronic Kidney Disease. Kidney Int. 2024, 105, S117–S314. [Google Scholar] [CrossRef]
- American Diabetes Association Professional Practice Committee. 2. Diagnosis and Classification of Diabetes: Standards of Care in Diabetes-2024. Diabetes Care 2024, 47 (Suppl. S1), S20–S42. [Google Scholar] [CrossRef]
- Delgado, C.; Baweja, M.; Crews, D.C.; Eneanya, N.D.; Gadegbeku, C.A.; Inker, L.A.; Mendu, M.L.; Miller, W.G.; Moxey, M.M.; Roberts, G.V.; et al. A Unifying Approach for GFR Estimation: Recommendations of the NKF-ASN Task Force on Reassessing the Inclusion of Race in Diagnosing Kidney Disease. Am. J. Kidney Dis. 2022, 79, 268–288.e1. [Google Scholar] [CrossRef]
- Zoppini, G.; Galletti, A.; Targher, G.; Brangani, C.; Pichiri, I.; Trombetta, M.; Negri, C.; De Santi, F.; Stoico, V.; Cacciatori, V.; et al. Lower levels of 25-hydroxyvitamin D3 are associated with a higher prevalence of microvascular complications in patients with type 2 diabetes. BMJ Open Diabetes Res. Care 2015, 3, e000058. [Google Scholar] [CrossRef]
- Diaz, V.A.; Mainous, A.G., 3rd; Carek, P.J.; Wessell, A.M.; Everett, C.J. The association of vitamin D deficiency and insufficiency with diabetic nephropathy: Implications for health disparities. J. Am. Board Fam. Med. 2009, 22, 521–527. [Google Scholar] [CrossRef][Green Version]
- Hong, S.H.; Kim, Y.B.; Choi, H.S.; Jeong, T.D.; Kim, J.T.; Sung, Y.A. Association of Vitamin D Deficiency with Diabetic Nephropathy. Endocrinol. Metab. 2021, 36, 106–113. [Google Scholar] [CrossRef]
- Chalcraft, J.R.; Cardinal, L.M.; Wechsler, P.J.; Hollis, B.W.; Gerow, K.G.; Alexander, B.M.; Keith, J.F.; Larson, D.E. Vitamin D Synthesis Following a Single Bout of Sun Exposure in Older and Younger Men and Women. Nutrients 2020, 12, 2237. [Google Scholar] [CrossRef]
- Giustina, A.; Bouillon, R.; Dawson-Hughes, B.; Ebeling, P.R.; Lazaretti-Castro, M.; Lips, P.; Marcocci, C.; Bilezikian, J.P. Vitamin D in the older population: A consensus statement. Endocrine 2023, 79, 31–44. [Google Scholar] [CrossRef]
- Chiu, K.C.; Chu, A.; Go, V.L.; Saad, M.F. Hypovitaminosis D is associated with insulin resistance and beta cell dysfunction. Am. J. Clin. Nutr. 2004, 79, 820–825. [Google Scholar] [CrossRef] [PubMed]
- Dean, Y.E.; Elawady, S.S.; Shi, W.; Salem, A.A.; Chotwatanapong, A.; Ashraf, H.; Reddi, T.; Dundi, P.O.R.; Habash, W.Y.; Habash, M.Y.; et al. Progression of diabetic nephropathy and vitamin D serum levels: A pooled analysis of 7722 patients. Endocrinol. Diabetes Metab. 2023, 6, e453. [Google Scholar] [CrossRef]
- Huish, S.A.; Jenkinson, C.; Dunn, J.A.; Meredith, D.J.; Bland, R.; Hewison, M. Low serum 1,25(OH)2D3 in end-stage renal disease: Is reduced 1α-hydroxylase the only problem? Endocr. Connect. 2021, 10, 1291–1298. [Google Scholar] [CrossRef]
- Ucak, S.; Sevim, E.; Ersoy, D.; Sivritepe, R.; Basat, O.; Atay, S. Evaluation of the relationship between microalbuminuria and 25-(OH) vitamin D levels in patients with type 2 diabetes mellitus. Aging Male 2019, 22, 116–120. [Google Scholar] [CrossRef]
- Zhao, W.J.; Xia, X.Y.; Yin, J. Relationship of serum vitamin D levels with diabetic microvascular complications in patients with type 2 diabetes mellitus. Chin. Med. J. 2021, 134, 814–820. [Google Scholar] [CrossRef]
- Zhou, T.; Shen, L.; Li, Z.; Jia, J.; Xing, H.; Wang, N.; Jiao, Q.; Fan, Y. Severe 25-Hydroxyvitamin D Deficiency May Predict Poor Renal Outcomes in Patients with Biopsy-Proven Diabetic Nephropathy. Front. Endocrinol. 2022, 13, 871571. [Google Scholar] [CrossRef] [PubMed]

Disclaimer/Publisher’s Note: The statements, opinions and data contained in all publications are solely those of the individual author(s) and contributor(s) and not of MDPI and/or the editor(s). MDPI and/or the editor(s) disclaim responsibility for any injury to people or property resulting from any ideas, methods, instructions or products referred to in the content. |
© 2025 by the authors. Licensee MDPI, Basel, Switzerland. This article is an open access article distributed under the terms and conditions of the Creative Commons Attribution (CC BY) license (https://creativecommons.org/licenses/by/4.0/).