Abstract
Active phased array antennas (APAAs) can suffer from the effects of harsh thermal environments, which are caused by the large quantity of power generated by densely packed T/R modules and external thermal impacts. The situation may be worse in the case of limited room and severe thermal loads, due to heat radiation and a low temperature sink. The temperature field of the antenna can be changed. Since large numbers of temperature-sensitive electronic components exist in T/R modules, excitation current output can be significantly affected and the electromagnetic performance of APAAs can be seriously degraded. However, due to a lack of quantitative analysis, it is difficult to directly estimate the effect of temperature on the electromagnetic performance of APAAs. Therefore, this study investigated the electromagnetic performance of APAAs as affected by two key factors—the uniformly distributed temperature field and the temperature gradient field—based on different antenna shapes and sizes, to provide theoretical guidance for their thermal design.
1. Introduction
Active phased array antennas (APAAs) are widely applied in radar systems for airplane-based warning, satellite-based imaging, ship-based fire control, and ground-based air defense [1,2,3]. The development of technology has led to many antenna innovations. Zang et al. proposed an interesting concept of nonreciprocal phased-array antennas [4], Taravati et al. presented a unique full-duplex nonreciprocal-beam-steering transmissive phase-gradient metasurface [5], and Karimian et al. proposed an effective nonreciprocal-beam phased-array antenna constituting phase-gradient path radiators [6] that exhibit different radiation patterns in transmission and reception. Due to the increasing demand for radars, the requirements for APAAs have become more stringent. However, APAAs suffer from the effects of harsh thermal environments caused by the large amount of power generated by densely packed T/R (Transmitter/Receiver) modules and external thermal impacts, including solar radiation and low temperature sinks. Temperature variation can cause thermal deformation and temperature drift in the large number of electronic components in T/R modules [7,8]; the latter is more serious because array antennas usually have good stiffness. Excitation current errors can be generated, possibly resulting in serious degradation of the electromagnetic performance of the antenna. Research has focused on thermal design of array antennas based only on temperature field analysis [9,10,11]. Cooling and temperature control systems based on cold water equipment and a mini-channel cold plate were established and actualized to control the local temperature and temperature gradient in active components of the antenna [12]. However, it is difficult to guarantee the electromagnetic performance of array antennas according to these thermal design parameters. Because APAAs need to fulfill the requirements of both thermal and electromagnetic performance, any unreasonable allocation of thermal design indicators may lead to redesign, reproduction, and retesting of the antenna components, sub-systems, and even the entire system, thus prolonging the development cycle and increasing the development cost. In addition, new materials and devices have been gradually applied, such as high-temperature superconducting (HTS) filters [13,14,15], for realizing high sensitivity and reducing the noise temperature. Application of these devices can solve some thermal problems but their scope of application is limited. Furthermore, the delay line SAW (Surface Acoustic Wave) temperature sensor, which is a kind of wireless passive temperature sensor, has been proposed to sense the temperature [16]. Meanwhile, a boosted-beam control panel with active component calibration for temperature variation has also been applied [17]. Both of the above studies were focused on temperature indicators. In addition, transistor- and varactor-based components have been studied for use in array antennas [18,19]. Wali, R. added varactor-based Schiffman phase shifters to the power divider of a four-element phased array, but the temperature effect was not examined in the paper. Furthermore, analysis has been undertaken of the impact of temperature on the circuits in T/R modules [20]. Temir et al. noted that different degrees of heat dissipation and non-uniform cooling mechanisms result in temperature differences for the channels, which may alter the performance of the feeding networks and thus cause uncharacterized phase/amplitude errors [21]; however, this study only provides the curve of the phase and amplitude error with the variation of temperature. Medina et al. conducted stability tests consisting of measures of the S21 performance of a calibrated array at different temperatures [22], but no further study of the electromagnetic performance of the array antennas was conducted. Due to the development of phased array antennas toward high precision, high integration, and high frequency, the relationship between the temperature field and the electromagnetic performance of array antennas has become closer, and the unclear impact of temperature on the electromagnetic performance has become the bottleneck of developing high performance of APAAs.
Therefore, the relationship between temperature and the electromagnetic performance of APAAs was analyzed in the current study. Because the main thermal loads include the high power from T/R modules and external thermal conditions for ground-, ship-, airplane-, and satellite-based antennas, the effects of two typical key factors—the uniformly distributed temperature field and temperature gradient field—based on different shapes and sizes of array antennas are discussed, to provide theoretical guidance for the thermal design of APAAs.
2. Temperature and Electromagnetic Performance Coupling Model for APAA
As shown in Figure 1, we can assume that elements are arranged in a rectangular grid with the intervals of and , respectively. The direction of the far-field target P relative to the coordinate system xOy is expressed as the direction cosine , which is [23,24].
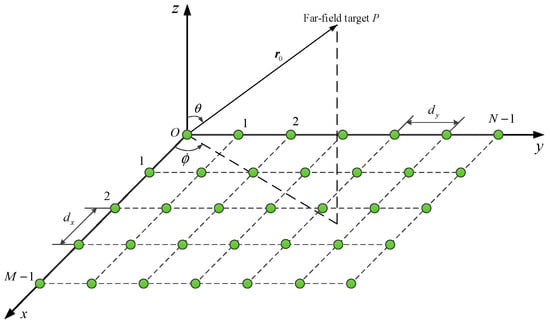
Figure 1.
Arrangement of active phased antenna array.
As shown in Figure 2, T/R modules, as the core components, control the excitation current of the elements for APAAs. The circuits of T/R modules include many temperature-sensitive electronic components, such as resistors, capacitors, inductors and transistors, whose performance can be changed by both high and low temperature. This can lead to performance changes of key devices in the transmitting and receiving branches, such as the high-power amplifier, filter, low-noise amplifier, and attenuator, thereby resulting in errors in the amplitude and phase of the excitation current.
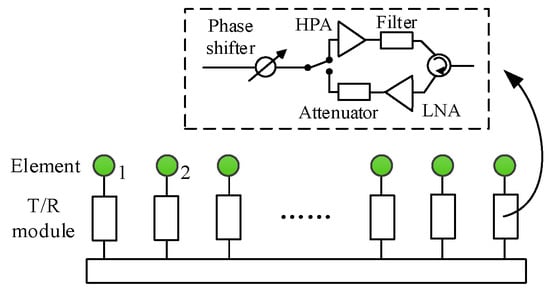
Figure 2.
Diagram of antenna array structure.
Because the excitation amplitude of element is usually controlled by the attenuator in units of dB, the theoretical amplitude is characterized by a ratio. Therefore, suppose the excitation amplitude change ratio and phase error of element are and , respectively. With the effect of temperature variation, the excitation amplitude and phase are changed as:
where and are the initial excitation amplitude and phase, respectively.
Introducing the changed excitation current in the initial antenna performance [23], the temperature and electromagnetic performance coupling model for APAA can be obtained as below, which is noted as the total radiated electric field of the array antenna:
where is the pattern of element , is the propagation constant, and is the wavelength.
Experimental tests of the excitation current errors of T/R modules are commonly used in engineering [25]. Based on the experimental test results and analysis of a typical type of T/R module, the excitation current error output of the T/R module with the effect of temperature can be obtained. The lowest and highest temperature are extended to °C and °C, respectively. The normalized amplitude error is:
Meanwhile, the relationship of the excitation phase error (unit: degree) with temperature in a certain temperature range is expressed as below:
3. Verification of the Coupling Model
The coupling model in Equation (2) was verified on an X-band APAA with 24 × 32 elements arranged in equal interval of 0.65, as shown in Figure 3. The model consisted of the back frame, actuators, array panel, and horn elements. The initial excitation currents of the elements were Taylor’s weighted distribution in the excitation amplitude and equal distribution in the excitation phase.
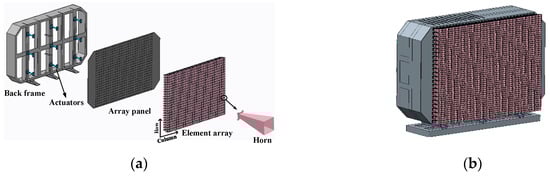
Figure 3.
(a) Composition diagram of X-band active phased array antennas (APAA); (b) active phased array antenna model.
The temperature of all of the T/R modules mounted on the back frame was controlled by a liquid cooling device, as shown in Figure 4a. The electromagnetic performance of the array antenna was measured under different uniform temperature field distributions, as shown in Figure 4b. Furthermore, the excitation current errors in Equations (3) and (4) were taken from the T/R modules in this antenna model.
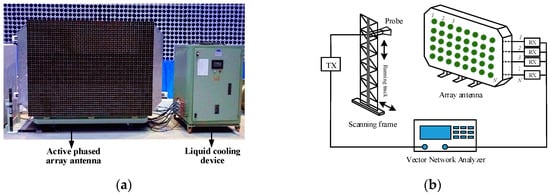
Figure 4.
(a) APAA and liquid cooling device; (b) electromagnetic performance measurement system.
The temperature field distribution at 35 °C is taken for illustration; the measured and model-based calculated antenna patterns are shown in Figure 5.
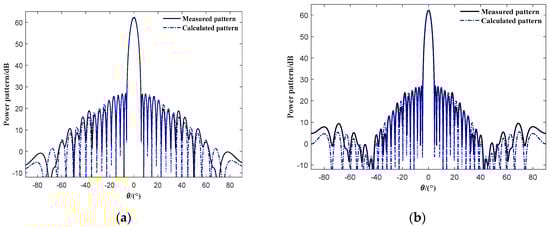
Figure 5.
(a) Measured and calculated E-plane pattern; (b) measured and calculated H-plane pattern.
It can be seen from Figure 5 that the measured and model-based calculated antenna patterns show good consistency in both the main and the first side lobe with a maximum error of 0.19 dB. Meanwhile, the patterns conform in the trends of the side lobes in the whole observation area. Thus, the presented temperature and electromagnetic coupling model is effective for analyzing the effect of temperature on the electromagnetic performance of APAAs.
4. Analysis and Discussion of Effect of Temperature on Electromagnetic Performance of APAA
The appropriate ranges of working temperature and temperature gradient are the two core indicators for the thermal design of array antennas. The effect of thermal immersion at different temperatures and various scales of temperature gradient are discussed as below. Because mutual coupling is not considered, analysis of the effect of temperature on the electromagnetic performance of APAAs considers the array factor without discussion of the element pattern in the following sections.
4.1. Analysis of the Effect of Varying the Uniformly Distributed Temperature Field
Because a harsh space environment can result in both high and low temperatures for the antennas, temperatures ranging from −80 °C to 100 °C are taken to analyze the effect of a uniformly distributed temperature field. Take an APAA with 128 × 768 elements with spacing in both x and y directions of 0.5 and a working frequency of 5.4 GHz for illustration. The excitation current is in equal amplitude and phase. The electromagnetic performance at 25 °C (room temperature) is taken as the reference, where the gain is 99.85 dB; the first sidelobe levels of E and H planes are −15.82 dB and −15.90 dB, respectively; the beamwidths are 0.8° and 0.1°, respectively; and the main beam direction is (0°, 0°). When the temperature changes from −80 °C to 100 °C, the electromagnetic performance of the antenna can be calculated by the proposed method at different temperatures, and the results are shown in Figure 6.
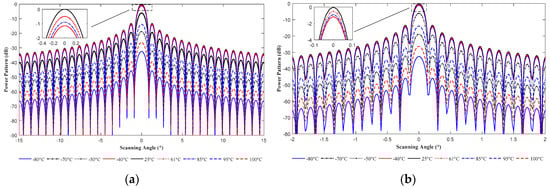
Figure 6.
Array antenna with different temperature: (a) E-plane pattern; (b) H-plane pattern.
Figure 6 shows that the electromagnetic performance is degraded mainly on the gain. Therefore, the relationship of gain-loss and temperature is analyzed as below.
(1) The gain is reduced with an increasing working temperature.
(2) In the range of −80~−40 °C, the maximum gain-loss is 2.31 dB when the temperature increases 1 °C, and the gain-loss increases 31.33 dB when the normalized amplitude error changes from 0.876 to 0.023; in the range of −40~25 °C, the gain-loss varies by 0.02 dB for every 1 °C increase, and the gain-loss increases 1.15 dB as the normalized amplitude error changes from 0.990 to 0.876; within the range of 25~85 °C, when the normalized amplitude error changes from 0.901 to 0.990, the gain-loss increases 0.9 dB and varies by −0.015 dB for every 1 °C increase; and within the range of 85~100 °C, the gain-loss increases 25.41 dB when the normalized amplitude error is in the range of 0.048 to 0.901, and the maximum gain-loss is −3.55 dB for an increase of 1 °C.
In the range of −80~25 °C, the gain-loss increases with decreasing temperature, and in the range of 25~100 °C, it increases with increasing temperature. When the temperature is below −40 °C and above 85 °C, the gain-loss changes dramatically. The gain-loss is −32.48 dB at −80 °C and −26.30 dB at 100 °C, and the electromagnetic performance of the antenna is more degraded by the low temperature. In addition, the gain-loss increases with increasing amplitude error. The detailed parameters are listed in Table 1.

Table 1.
Gain-loss under the effect of uniform temperature field.
(3) At −7 °C and 61 °C, the gain-loss is 0.5 dB, which is the requirement of gain-loss in engineering. The corresponding normalized amplitude errors are both 0.945. Thus, −7 °C and 61 °C represent the temperature critical values, and 0.945 represents the normalized magnitude error critical value to satisfy the electromagnetic performance.
(4) The relationship of the gain-loss and the temperature is analyzed as shown in Figure 7.
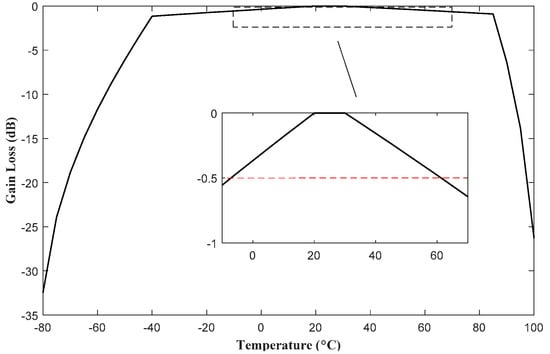
Figure 7.
Gain-loss variation with temperature.
It can be seen in Figure 7 that the variation trend of the gain-loss resembles a quadratic function curve. Therefore, a quadratic function is used to express the relationship of the gain-loss with temperature as shown below, and can be used to directly and rapidly calculate the gain-loss at the corresponding working temperature for APAAs:
4.2. Analysis of the Effect of Different Temperature Gradient Fields
Because both symmetric and asymmetric temperature fields with different gradients can be produced due to high power and complex external thermal loads, two kinds of typical temperature gradient fields, namely the symmetric and asymmetric temperature fields, are taken to analyze the effect of temperature gradient distributions on electromagnetic performance of APAAs, as shown in Figure 8.
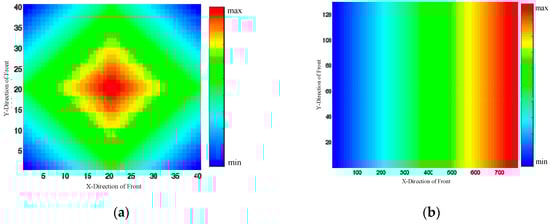
Figure 8.
(a) Symmetric temperature distribution; (b) asymmetric temperature distribution.
First, the impact of the symmetric temperature field with the highest temperature in the middle and the lowest at the perimeter of a square-shaped antenna is analyzed. An APAA with elements with spacing in x and y directions of and a frequency of 9.375 GHz is taken. Assume that the excitation current is in equal amplitude and phase. The electromagnetic performance is analyzed under different temperature gradients and array sizes, as shown in Figure 9.
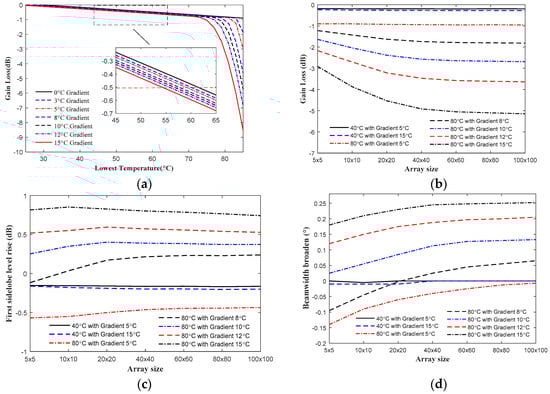
Figure 9.
(a) Gain-loss versus the temperature gradient; (b) gain-loss versus the antenna size; (c) first sidelobe level rise; (d) broadening of 3 dB beamwidth.
Figure 9 shows that:
(1) The larger the temperature gradient, the more the gain reduces for all of the array antenna sizes. For the specific array antenna, when the temperature gradients are 5 °C, 10 °C, and 15 °C, the corresponding temperature critical values are 64 °C, 67 °C, and 70 °C, respectively. The corresponding ranges of the normalized amplitude errors are 0.930~0.939, 0.916~0.934 and 0.901~0.928, and the corresponding phase errors ranges are 2.72°~2.87°, 2.81°~2.9°, and 2.9°, respectively. The detailed parameters are listed in Table 2.
Table 2.
Gain-loss under the effect of symmetric temperature distribution.
In addition, in order to clearly shown the distributions of the amplitude and phase variations, the temperature gradient of 15 °C with the highest temperature of 70 °C is selected, and the corresponding normalized amplitude error and phase error are shown in Figure 10. It can be seen that both the amplitude and phase distributions are also in the form of center symmetry.
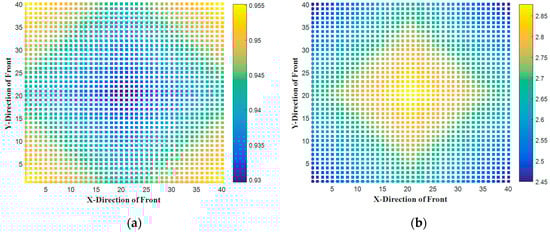
Figure 10.
(a) Magnitude error; (b) phase error under effect of symmetric temperature distribution.
(2) The quantitative relation of the gain-loss with the temperature gradient and the lowest temperature is determined as below from Figure 9a, which can be used to quickly evaluate the electromagnetic performance of APAAs under the effect of temperature gradient distribution.
(3) The gain-loss, rise of the first sidelobe level, and broadening of the 3 dB beamwidth increase with the increasing array size under the same gradient and specific lowest temperature.
(4) For the array antenna with elements and lowest temperature of 40 °C, when the temperature gradients are 5 °C, 10 °C, and 15 °C, the corresponding ranges of the normalized amplitude errors are 0.973~0.982, 0.964~0.982, and 0.955~0.982, respectively, and the corresponding phase errors are all 2.3°, which leads to increases of the first SLL (Sidelobe Level) of −0.19 dB, −0.22 dB, and −0.27 dB, respectively. In addition, when the lowest temperature is 80 °C, the corresponding ranges of the normalized amplitude errors are 0.901~0.910, 0.479~0.910, and 0.204~0.910, respectively, and the corresponding phase errors are all 2.9°, which leads to beamwidth broadening of −0.06°, 0.12°, and −0.25°, respectively.
Then, the effect of an asymmetric temperature field with the lowest and highest temperature located separately on each side of the array along a row for a rectangular-shaped APAA with elements is analyzed under different temperature gradients and array sizes, with the results shown in Figure 11.
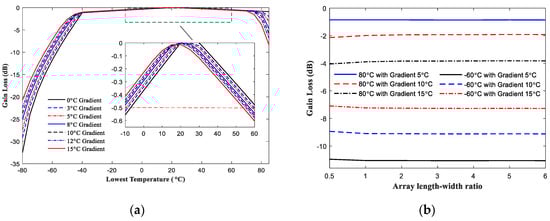
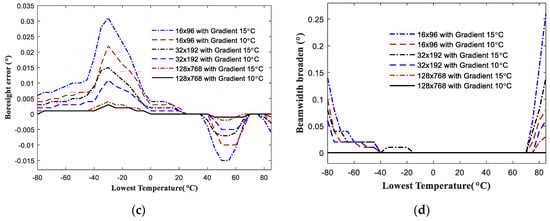
Figure 11.
(a) Gain-loss versus the temperature gradient; (b) gain-loss versus the array size; (c) boresight error with temperature; (d) broadening of 3 dB beamwidth with temperature.
Figure 11 shows that:
(1) When the lowest temperature is in the range of −80~25 °C, the gain-loss increases with decreasing gradient, and in the range of 25~100 °C, the gain-loss rises with increasing gradient.
(2) When the temperature gradients are 5 °C, 10 °C, and 15 °C, the corresponding temperature critical values are −9.5 °C and 64 °C, −12 °C and 66.5 °C, and −15 °C and 70 °C, respectively. In terms of the gradient of 5 °C, the corresponding normalized amplitude errors are 0.939~0.949 and 0.930~0.939, respectively, and the phase errors are 2.629°~2.809° and 2.72~2.87, respectively. When the gradient is 10 °C, the corresponding normalized amplitude errors are 0.934~0.954 and 0.917~0.934, respectively, and the phase errors are 2.553°~2.915°and 2.795°~3.095°, respectively. For the gradient of 15 °C, the corresponding normalized amplitude errors are 0.928~0.999 and 0.901~0.928, respectively, and the phase errors are 2.5°~3.055° and 2.9°, respectively. The detailed parameters are listed in Table 3.
Table 3.
Gain-loss under the effect of asymmetric temperature distribution.
In addition, the temperature gradient of 10 °C with the lowest temperature of 66.5 °C is selected, and the corresponding normalized amplitude error and phase error distributions are shown in Figure 12. It can be seen that both the amplitude and phase distributions are in the form with the lowest and highest values located separately on each side of the array along the row.
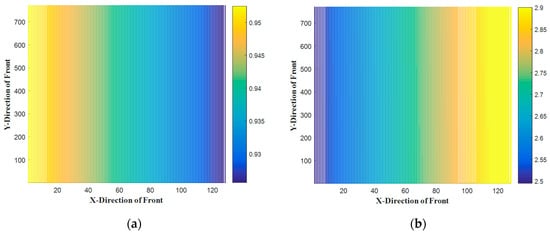
Figure 12.
(a) Amplitude error; (b) phase error under effect of asymmetric temperature distribution.
(3) The relationship between the gain-loss and the temperature gradient is shown below, and can be used to directly evaluate the electromagnetic performance of the antenna under the effect of different temperature gradient fields:
(4) The gain-loss changes in a small range for different length–width ratios of the array antenna under the same temperature gradient and lowest temperature. The boresight error and broadening of 3 dB beamwidth are larger for the array antenna with fewer elements and larger gradients under the same length–width ratio.
(5) For the array antenna with elements and the temperature gradient of 15 °C, when the lowest temperatures are −25 °C, and 45 °C, the corresponding ranges of the normalized amplitude errors are 0.906~0.937, and 0.946~0.973, respectively, and the phase errors are 2.83°~3.625° and 2.3°, respectively, which lead to boresight errors of −0.06°, 0.12°, and −0.25°, respectively, and the corresponding beamwidth broadening of −0.06°, 0.12°, and −0.25°, respectively.
In summary, it can be shown that: (1) When the lowest temperature is above 70 °C or below −40 °C, the electromagnetic performance of APAAs can be more seriously degraded by both the uniform temperature distribution field and temperature gradient distribution field. (2) For different array shapes and sizes, the larger the temperature gradient when the lowest temperature is above 25 °C or the smaller the gradient when the lowest temperature is below 25 °C, the greater the gain losses. (3) The gain-loss increases with increasing amplitude error for the uniformly distributed temperature field. In terms of the temperature gradient field, the distribution of the amplitude and phase error are closely related to the distributions of the temperature fields. (4) The excitation current error corresponds to the type of T/R module used and the above analysis can provide thermal design guidance for this kind of module in regard to the electromagnetic performance of APAAs.
5. Conclusions
A coupled model of the temperature and electromagnetic performance of APAAs is proposed and verified on an X-band antenna experimental model. A large number of quantitative effects of the typical uniformly distributed temperature field and the temperature gradient field on the electromagnetic performance of APAAs is realized, with different array shapes and sizes. The results can be used to provide theoretical guidance for thermal design aimed directly at the electromagnetic performance of APAAs.
Author Contributions
Conceptualization, Y.W. and C.W.; Data curation, Y.S., Z.W. and K.Y.; Formal analysis, J.L. and W.G.; Funding acquisition, Y.W. and C.W.; Methodology, C.W.; Project administration, C.W.; Software, Y.W. and P.L.; Supervision, B.D. and S.X. (Song Xiao); Validation, S.X. (Song Xue); Writing–original draft, Y.W. and P.L.; Writing–review & editing, C.W., S.X. (Song Xue) and X.P. All authors have read and agreed to the published version of the manuscript.
Funding
This work was supported by National Natural Science Foundation of China under No. 51975447 and U1737211, Natural Science Foundation of Shaanxi Province under No. 2018JZ5001, Youth Science and Technology Star Project of Shaanxi Province under No. 2018KJXX-047, Youth Innovation Team of Shaanxi Universities under No. 201926.
Conflicts of Interest
The authors declare no conflict of interest.
References
- Catalani, A.; Toso, G.; Angeletti, P.; Albertini, M.; Russo, P. Development of enabling technologies for Ku-band airborne SATCOM phased-arrays. Electronics 2020, 9, 488. [Google Scholar] [CrossRef]
- Kim, S.Y.; Sung, J.B.; Torre, A. In-Orbit Antenna Pattern Extraction Method for Active Phased-Array SAR Antennas. IEEE Antennas Wirel. Propag. Lett. 2016, 15, 317–320. [Google Scholar] [CrossRef]
- Haupt, R.L.; Rahmat-Samii, Y. Antenna array developments: A perspective on the past, present and future. IEEE Antennas Propag. Mag. 2015, 64, 86–96. [Google Scholar] [CrossRef]
- Zang, J.W.; Alvarez-Melcon, A.; Gomez-Diaz, J.S. Nonreciprocal phased array antennas. Phys. Rev. Appl. 2019, 12, 054008. [Google Scholar] [CrossRef]
- Taravati, S.; Eleftheriades, G.V. Full-Duplex Nonreciprocal-Beam-Steering Metasurfaces Comprising Time-Modulated Twin Meta-Atoms. arXiv 2019, arXiv:1911.04033. [Google Scholar]
- Karimian, R.; Ahmadi, S.; Zaghloul, M.; Taravati, S. Nonreciprocal-Beam Phased-Array Antennas. arXiv 2020, arXiv:2006.04211. [Google Scholar]
- Brookner, E.; Howell, J.M. Right way to calculate reflector and active-phased-array antenna system noise temperature taking into account antenna mismatch. In Proceedings of the IEEE International Symposium on Phased Array Systems and Technology, Boston, MA, USA, 14–17 October 2003; pp. 130–135. [Google Scholar]
- Brookner, E. Active electronically scanned array (AESA) system noise temperature. In Proceedings of the 2013 IEEE International Symposium on Phased Array Systems and Technology, Waltham, MA, USA, 15–18 October 2013; pp. 760–767. [Google Scholar]
- Rummel, K.A.; Schaefer, G.; Chen, K.W.; Allen, B.H.; Weissman, D.J. Remote Cooling of a Phased Array Antenna. U.S. Patent Application No. 11,865,475, 4 February 2009. [Google Scholar]
- Sobhan, C.B.; Garimella, S.V. A comparative analysis of studies on heat transfer and fluid flow in microchannels. Microscale Thermophys. Eng. 2001, 24, 293–311. [Google Scholar] [CrossRef]
- Nakagawa, M.; Morikawa, E.; Koyama, Y.; Suzuki, R.; Yasuda, Y. Development of thermal control for phased array antenna. In Proceedings of the 21st International Communications Satellite Systems Conference and Exhibit, Yokohama, Japan, 17–19 April 2003. AIAA-2003-2226. [Google Scholar] [CrossRef]
- Zhang, J.; Li, R.; Xu, X.; Wu, C. Design of a cooling system for high density integrated phased array antenna test. In Proceedings of the 2017 Sixth Asia-Pacific Conference on Antennas and Propagation (APCAP), Xian, China, 16–19 October 2017; pp. 1–3. [Google Scholar]
- Kumamoto, T.; Kayano, H.; Shiokawa, N.; Nakayama, K.; Kawaguchi, T.; Shinonaga, M. High-sensitivity receiving sub-array module with HTS filters for an active phased array antenna. In Proceedings of the 2013 IEEE International Symposium on Phased Array Systems and Technology, Waltham, MA, USA, 15–18 October 2013; pp. 341–345. [Google Scholar]
- Kayano, H.; Kumamoto, T.; Shiokawa, N.; Kawaguchi, T.; Nakayama, K.; Shinonaga, M. 8 Elements phased array antenna using superconducting receiving module. In Proceedings of the 8th European Conference on Antennas and Propagation (EuCAP 2014), The Hague, The Netherlands, 6–11 April 2014; pp. 1852–1853. [Google Scholar]
- Iijima, K.; Kumamoto, T.; Kayano, H.; Shiokawa, N.; Kawaguchi, T.; Shinonaga, M. Superconducting sub-array module as T/R module for X-band active phased array antenna. In Proceedings of the 2015 IEEE Radar Conference (RadarCon), Arlington, VA, USA, 10–15 May 2015; pp. 214–219. [Google Scholar]
- Huang, D.; Li, T. Design of RF temperature measurement system of delay linear SAW temperature sensor based on FPGA. In Proceedings of the 2020 International Conference on Computer Engineering and Application (ICCEA), Guangzhou, China, 18–20 March 2020; pp. 520–524. [Google Scholar]
- Moon, S.; Yun, S.; Yom, I.; Lee, H.L. Phased Array Shaped-Beam Satellite Antenna With Boosted-Beam Control. IEEE Trans. Antennas Propag. 2019, 67, 7633–7636. [Google Scholar] [CrossRef]
- Zagrajek, P.; Ganichev, S.; Danilov, S.; Marczewski, J.; Zaborowski, M.; Kolacinski, C.; Obrebski, D.; Kopyt, P.; But, D.; Knap, W. Time Resolution and Power Dependence of Transistor Based Terahertz Detectors. In Proceedings of the 2019 44th International Conference on Infrared, Millimeter, and Terahertz Waves (IRMMW-THz), Paris, France, 1–6 September 2019; pp. 1–2. [Google Scholar]
- Wali, R.; Osman, L.; Razban, T.; Mahé, Y. Tunable Power Divider with Varactors Based Schiffman Phase Shifters for Antenna Arrays Beam Steering. In Proceedings of the 2017 Mediterranean Microwave Symposium (MMS), Marseille, France, 28–30 November 2017; pp. 1–4. [Google Scholar]
- Zhong, L.; Fu, G.; Lu, J. A research for influence of temperature on T/R module in radar. In Proceedings of the IEEE Prognostics and System Health Management Conference, Beijing, China, 25–29 May 2015; pp. 1–9. [Google Scholar] [CrossRef]
- Temir, K.; Akyüz, M.S.; Alp, Y.K. Consideration of environmental and functional factors in calibration of antenna integrated active phased array transmitters. In Proceedings of the 2016 IEEE International Symposium on Phased Array Systems and Technology (PAST), Waltham, MA, USA, 18–21 October 2016; pp. 1–5. [Google Scholar]
- Medina, R.H.; Salazar, J.L.; Knapp, E.J.; McLaughlin, D.J. Calibration and validation of the CASA phased array antenna. In Proceedings of the 2012 9th European Radar Conference, Amsterdam, The Netherlands, 31 October–2 November 2012; pp. 614–617. [Google Scholar]
- Wang, C.S.; Duan, B.Y.; Zhang, F.S.; Zhu, M.B. Coupled structural-electromagnetic-thermal modelling and analysis of active phased array antennas. IET Microw. Antennas Propag. 2010, 4, 247–257. [Google Scholar] [CrossRef]
- Wang, V.; Wang, C.; Gao, W.; Xu, Q.; Yuan, S.; Li, H.; Ying, K. Compensation Method for Distorted Active Phased Array Antennas in Condition of Quantization Errors Based on Structural-Electromagnetic Coupling. In Proceedings of the 12th European Conference on Antennas and Propagation, London, UK, 7–13 April 2018. [Google Scholar] [CrossRef]
- Xueming, J.; Manqing, W.; Jianmei, T. Experimental study on a digital T/R module for phased array radar. In Proceedings of the 2001 CIE International Conference on Radar Proceedings, Beijing, China, 15–18 October 2001; pp. 898–902. [Google Scholar] [CrossRef]
© 2020 by the authors. Licensee MDPI, Basel, Switzerland. This article is an open access article distributed under the terms and conditions of the Creative Commons Attribution (CC BY) license (http://creativecommons.org/licenses/by/4.0/).