Abstract
This article proposes a new analytical model of a switching structure using a Clos network topology. The assumption is that, in the structure under consideration, it is possible to switch off temporarily a certain number of spine switches (those in the middle stage of the switching fabric) depending on the current intensity of the offered traffic to reduce power consumption. The solution presented in the article can be used in present-day multiservice switching fabrics and in networks connecting servers in data centers. The developed analytical model allows the value of blocking probabilities for different stream classes of multiservice traffic to be evaluated in switching structures (switching fabrics) with a variable number of switches in the middle stage. The results obtained on the basis of the analytical model are compared with the results obtained as a result of relevant simulation experiments for a selected structure of the switching fabric. The study confirms high accuracy of the proposed model. This model can be used in further works to evaluate the effectiveness of energy-saving switching fabrics and the networks of data centers, as well as to construct energy-saving control algorithms that would control these switching structures, that is, algorithms that would change the topology of the switching fabric depending on changes in the offered traffic.
1. Introduction
The ample amount of work done on the optimization of energy consumption in communication systems that is currently carried out in several company research centers and academic institutions is conducted at a number of levels, from the lowest one, involving the construction of devices and the improvement of algorithms that control the operation of individual modules/devices, up to the highest level related to the dimensioning and designing of networks and systems.
It is evident that the power consumption of network devices largely depends on the volume of offered traffic [1,2,3]. While choosing appropriate devices (resources), network operators primarily target more effective economic efficiency and service quality and rely on and are guided by the maximum traffic value in those periods that are deemed to provide the heaviest load for systems. It should be noticed, however, that, for many services, correlative to the activity of subscribers, high load periods can last from a couple of hours to even half a day. This situation occurs, for example, in content delivery networks (CDNs), in which large fluctuations in network loads occur within 24 h [4,5]. In addition, the effects of variability of load distribution on network performance are clearly observable not only within the 24-h scale but also within days (weekdays vs. weekends) [2].
Keeping ongoing activity of all network devices, regardless of the network load, leads to a significant overscaling (or overdimensioning) of the network (which is expressed in a larger number of resources than the resources needed for traffic with required quality parameters to be handled) in certain time periods. At the same time, the overdimensioning eventually leads to ineffective use of electrical energy. In such circumstances, a temporary switch-off of certain individual network elements (e.g., routers, switches) or their modules (e.g., single switching elements in a switching fabric) seems to be a good solution to the problem [1,3].
Temporary deactivation of network devices or their modules is feasible in the networks of devices that are to be found, for example, in switching fabrics (connecting individual switches) or in data centers (connecting individual servers). A typical topology in these networks is the Clos topology, proposed in [6] for switching fabrics. Nowadays, a Clos topology is used more and more often for connecting servers in data centers [7,8]. The characteristic Clos multipath architecture between a given input and output of a switching fabric results in a situation where switching off a certain number of elements in this structure does not lead to the total inability to set up a call but only increases loads in the remaining modules. Within this particular context, the application of appropriate and well-matched traffic engineering techniques that would determine the number of necessary network elements required for traffic with required quality parameters to be serviced can lead to a decrease in the demand for energy in data centers and switching fabrics [1,3].
The present article is devoted to an analysis of multiservice structures/networks denoted in the article by the acronym MSF (multiservice switching fabrics). Because of the historical primacy of the application of these structures to analyze switching fabrics in telephone networks, further in the article, we will refer mainly to the terminology typical for switching fabrics while indicating the analogies to the structures used in data centers.
Construction of energy-aware switching fabrics is based on contradictory criteria: minimization of electrical energy consumption and, at the same time, minimization of the blocking probability of the switching fabric. A decrease in energy intake can be executed through appropriate mechanisms used to turn off switches of a multiservice switching fabric at the time of decreased demand for resources throughout the day and night. This means that a certain number of switches in the switching fabric will be temporarily deactivated, that is, “removed” from the network structure. At the same time, however, this method for achieving the first criterion limits the possibility of achieving the other optimization criterion since switching off a certain number of switches will consequently lead to an increase in the blocking probability [9,10]. This problem will be solved in the present article through an introduction of the appropriate limitations related to the assumed values of QoS parameters (in particular with the blocking probability) that, regardless of the load, are not to exceed the adopted boundary values. This means that in each and every condition the network structure can be changed in such a way that the blocking probability will not exceed the assumed values (thresholds).
This article is structured as follows: Section 2 includes an overview of the methods for modeling single-service and multiservice switching fabrics that can find their application in both modeling of modern switching fabrics and networks found in data centers. Section 3 describes MSF with variable Clos structure operating with the point-to-group selection. Section 4 presents a description of the basic group models used in modeling MSF. Section 5 proposes an analytical model of MSF, that is, the point-to-group blocking for multichannel traffic and compression (PGBMTC) model that includes a possibility to introduce changes in the number of active switches of the middle stage. In Section 6, the results of the analytical calculations are compared with the results of the simulation experiments for a number of selected structures of switching fabrics. Section 7 presents an example of an application of the PGBMTC model to construct a method aimed at saving energy in MSF depending on the current load of the network and required quality parameters. Section 8 sums up the article.
2. Related Work
The abundant literature addressing the analysis and modeling of energy consumption in network systems typically distinguishes four types of resources: communication, storage, memory, and computation [11]. Within the group of resources related to communication, the authors of [11] distinguish, for example, the influence of the number of network devices, type of network devices, and traffic load. These are key factors for any analysis of the network of connections in data centers and switching fabrics. In either case, the topology of connections proposed by Clos for single-service switching fabrics (SN) in 1953 [6] is used. This topology is shown in Figure 1.
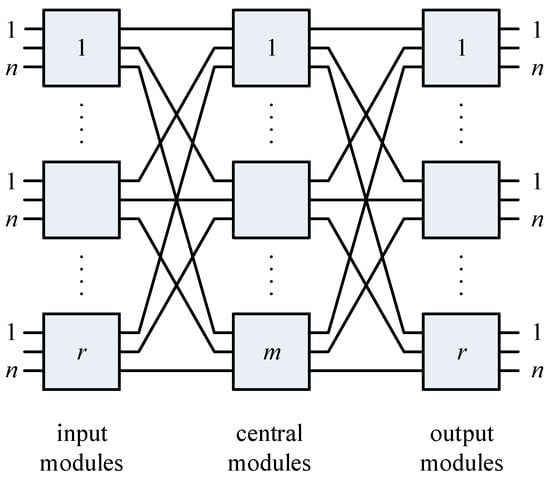
Figure 1.
A three-stage Clos switching fabric.
Note that the switches of the external/edge stages (input/output modules) can be regarded as the “leaf”-type switches of the edge part, whereas the switches of the middle stage (central modules) can be regarded as the “spine”-type switches of the backbone part (Figure 2) in networks used in data centers.
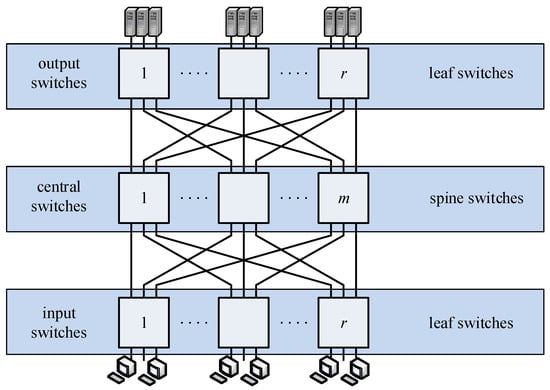
Figure 2.
A three-stage Clos topology of a data center.
Multiservice Clos topology (three-stage, five-stage, or seven-stage) provides a possibility to construct a switching fabric with several dozen/hundred inputs/outputs using single switches with several inputs/outputs. At the same time, by controlling the number of switches of the middle stage of a Clos network, it is easy to have influence on the internal blocking probability [6].
In the network of connections between servers in data centers using Clos topology [7], servers are added to “leaf” switches in external stages (edge) that are, in turn, connected to “spine” switches (core). Because of the missing direct connections between the switches of the type “leaf” or “spine,” each server is within the distance of three “hops” away from other servers that form the three-stage Clos structure presented in Figure 3 [7].
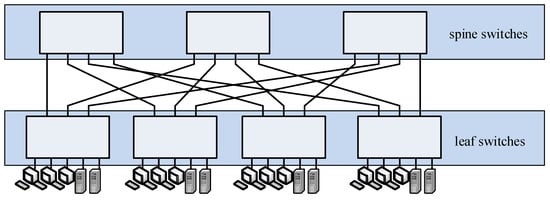
Figure 3.
A three-stage Clos topology of a data center.
The middle stage that is composed of “spine” switches can be replaced by a three-stage structure by creating five-stage structures (Figure 4). As in the case of switching fabrics, the Clos topology provides high scalability of the structure (easy addition of subsequent servers as a result of an increase in the number of “leaf” switches and easy increase in the capacity of the switching structure as a result of an increase in the number of “spine” switches) and high resistance of the structure to damages of individual switches or links [7,8]. In all, the Clos structure provides a large number of connection paths between a required input and output of a switching fabric or required servers in the connection network, which, consequently, can be directly taken advantage of in developing energy-saving minimization techniques in network systems that are based on a change in the load of individual network elements and their activation/deactivation [9,12,13,14]. The Clos topology is used in both traditional data centers based on electronic switching and data centers based on hybrid optical switching (HOS) [15].
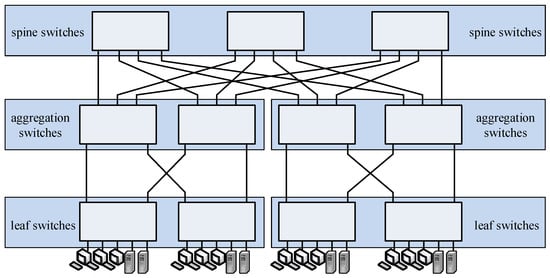
Figure 4.
A five-stage Clos topology of a data center.
The idea of standby (“dormant”) network devices (and the sleeping/standby mode) to limit energy consumption in the Internet was proposed as early as 2003 [16]. Over the years, the idea was developed in [17], which introduced the concept of a device called network connectivity proxy that intercepted and controlled communication in devices that were in the dormant/standby mode. These solutions, proposed mainly for a local computer network, were then expanded to include wide area networks [3,18]. Optimization of energy consumption in such networks was executed on the basis of appropriate traffic control algorithms in relation to its intensity. As a consequence, the authors of the above works developed a number of algorithms to generate sets of routes that made it possible to handle the intensity of the offered traffic with the required quality parameters.
The general model of network systems that takes into account electrical energy consumption in the individual resources of the network and the algorithms to control the activation and deactivation of such resources depending on the network load is presented in [14]. A particular attention in the latter work is given to the necessity of the application of hysteresis in the switching-in/switching-off stage for individual elements of the network or a change in the paths used to transmit traffic streams. Too frequent changes, in particular those related to a change in the routes of packets, eventually lead to oscillation (too frequent switching of paths), packet losses, or even an increase in power consumption [1].
One of the first works devoted to the optimization of power consumption in switching structures depending on their loads is proposed in [19]. The authors consider a fat-tree architecture in which the number of possible connection paths is limited in relation to the Clos structure. The solution proposed in the article is based on switching on/off individual links in a given switch depending on the current load of active links. The proposed solution, however, does not take into consideration the value of traffic offered to the entire switching structure and the multiclass nature of the traffic streams of the offered traffic. The energy effectiveness of multiplane banyan switching fabrics is analyzed in [20]. Its author develops a time-effective control algorithm for a switching fabric that makes the number of active dimensions of the network dependable on the intensity of offered traffic. Similar to [19], the considerations presented in [20] are limited to an analysis of single-class traffic.
Models of switching structures with a Clos topology are mainly based on the concept of the so-called effective availability. The first models of this kind were proposed for single-service switching fabrics in [21,22,23,24]. An appropriately modified concept of effective availability was also used in modeling MSFs. The work [25] presents MSF models with the point-to-group selection. In turn, in [26], an MSF model with the point-to-group selection and a number of attempts to set up a connection is developed.
One can find more complex MSF models in the literature of the subject, including those that are based on the concept of effective availability. In these models, a possibility to service a large number of Erlang, Engset, and Pascal traffic streams is taken into consideration [27]. The authors of [28] derive a method to model switching fabrics that are capable of handling multicast traffic. The article [29] proposes MSF models with introduced threshold mechanisms for traffic generated by the so-called multiservice sources. In Reference [30,31], MSF models where the so-called overflow links have been introduced to their structure are considered.
This article proposes a new model of MSF with the point-to-group selection and variable structure that make it possible to activate/deactivate switches of the middle stage depending on the intensity (load) of the offered traffic. The model proposed in the article has the advantage of determining the blocking probability in successive structures of the network in which the number of switches is successively decreased. A decrease in the number of switches in the internal (spine) stages of a switching fabric is followed by the creation of new structures of MSF, that is, switching fabrics with compression, which in consequence leads to a necessity to consider blocking the switches of the first stage in the model. Until then, this type of blocking was considered exclusively for the case of single-service networks [22,23] and will be analyzed in MSFs, according to the best belief of the authors, for the first time (the simplified model of a multiservice network with a variable number of switches of the middle stage, proposed by the authors in [10], did not take the blocking probability for the switches of the first stage into consideration). The results obtained on the basis of the proposed model can be used to design energy-aware, variable structures of switching fabrics and networks of data centers that can operate in any traffic condition, retaining the assumed QoS parameters.
3. Multiservice Switching Fabric
Consider the schematic diagram of the three-stage switching fabric shown in Figure 1. To simplify the applied notation, our further assumption is that the number of switches in each of the stages is the same and equals k, whereas the size of each of the switches is equal to links (Figure 5) [6,32]. Let the input, output, and interstage links have identical capacity equal to f AUs (allocation units). A single AU is expressed in kbps (Mbps, Gbps) and is defined as the greatest common divisor (GCD) of the bitrates of all traffic classes offered to MSF [33,34]. The output links of the MSF can be grouped into directions, that is, groups of links coming out from the switching fabric. Figure 5 shows an example of the execution of the output directions, according to which the i-th output links of each of the switches of the last stage create an i-th direction. Therefore, the MSF presented in Figure 5 has k directions altogether, with k output links each (generally, an output direction can be composed of one link up to links). The adopted assumptions concerning the dimensions of the switches, their equal number in individual stages, the equal capacity of the interstage links, and the way output direction is executed do not affect the generality of further considerations.
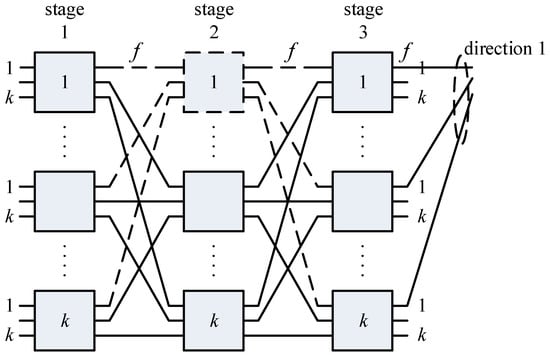
Figure 5.
Three-stage Clos switching fabric.
If one switch of the second stage, for example, the first switch, is removed from the MSF structure, then the links of this switch that lead to the switches of the external (edge) switches (marked in Figure 5 by a dashed line) will also be removed from the structure of the MSF. Following the removal of one switch of the second stage, k switches of the first stage will change their dimensions that are now equal to links. The remaining of the switches of the second stage has the dimensions links, whereas k switches of the third stage will change their dimensions to links. Therefore, if we remove u switches of the middle stage from the network structure, we will obtain a network composed of k switches of the type in the first stage, switches of the type in the second stage, and k switches of the type in the third stage.
In the article, we analyze traffic at the flow (session) level and not at the packet level [35,36]. In the case of switching fabrics and data centers, offered traffic is most frequently aggregated traffic and comes from a large number of sources. Each of the flows is assigned certain resources demanded by it that are assigned for the traffic class to which this flow belongs. The values of these demands result from the parameters of this flow at the packet level. Typically, the assumption in these systems, in their analysis at the session level (flow, calls), is that time distribution between successive sessions (flows) can be modeled by a Poisson distribution, whereas service time can be modeled by exponential distribution [37,38,39]. Following the above assumptions, offered traffic is multiservice Erlang traffic [40,41]. Our assumption is that the MSF is offered a mixture M Erlang traffic stream that can be characterized by the following parameters:
- —the average traffic intensity of class i offered to the switching fabric. Further in the article, instead of the notion “average intensity of traffic of class i,” the notion “traffic of class i” will be used.
- —the number of AUs demanded for a call of class i to be set up in MSF
Consider an algorithm to control setting up connections (further in the text called the algorithm) in an MSF with a symmetrical Clos structure (Figure 5), from which no switches of the second stage have been removed yet. The assumption is that MSF operates in the point-to-group selection mode. In the case of the point-to-group strategy, a possibility of connecting a given destination point (such as a server, for example) to multiple switches of the external stages is taken into account. In its first step, the algorithm identifies and marks the switch of the first stage at the output of which a new call that demands a connection to any link of a selected direction has arrived. In its next step, the algorithm marks (indicates) the switches of the third stage that have free output links in the direction demanded by the new call. The occupancy of all links in this direction means that the phenomenon of external blocking has occurred and the call is lost. Otherwise, if only one output link in the required direction is unoccupied, the algorithm attempts to set up a connection between the switch of the first stage marked earlier and the switch of the third stage that has a free output in the demanded direction. If the execution of this connection is not possible again, then the algorithm checks sequentially a possibility to set up a connection with other switches of the last stage that have free links in the demanded direction. If, after checking all possibilities, setting up a connection is still not possible, then the call will be lost because of the occurrence of the internal blocking.
Contrary to the point-to-group selection, in the point-to-point strategy, the assumption is that a given destination point (such as a server, for example) is only connected to one switch of the external stages. In our article, we consider the point-to-group strategy, which, from the analytical calculations perspective, is a more general strategy than the point-to-point strategy. The point-to-point blocking probability in a z-stage network is equal, in accordance with [24], to the point-to-group blocking probability in a network with the number of stages , that is, in a group of links that lead to a designated switch of the last stage (the direction is a link group that leads to a switch of the last stage). In the calculations, to take into consideration the phenomenon of adding/connecting a given end device to one switch only, the calculations should be made for a stage structure.
If u switches of the middle stage have been removed from the structure of MSF, then the algorithm in its first step—as in the case of the symmetrical structure—identifies a switch of the first stage at the input of which a new call has arrived. Then, the algorithm checks whether there is at least one free output link at this switch that can handle a given call. In the case where all output links are occupied in a given switch of the first stage, the call will be rejected because of the occurrence of blocking of the switch of the first stage. The next steps of the algorithm are the same as in the MSF with a symmetrical Clos structure.
Note that the phenomenon of blocking in the switches of the first stage occurs in the network with a decreased number of switches in the middle stage. This results from the asymmetry of the switches of the first stage that have more input than output links (Figure 5). MSF then becomes a network with compression in the first stage. In the literature concerning modeling switching fabrics, systems with compression, and in consequence the phenomenon of blocking of switches of the first stage, have been analyzed exclusively for the case of single-service switching fabrics [22,23,42,43,44]. In MSF, blocking switches of the first stage have not been addressed yet.
The term of a free link for a call of class i has been used in the above considerations. In the case of an analysis of multiservice links, this term means that a given link has at least free AUs necessary for a given connection to be executed. If a link has or fewer free AUs, then, for a call of class i, this link is considered to be occupied.
4. Models of MSF Components
To model MSF with a symmetrical Clos structure, the point-to-group blocking for multichannel traffic (PGBMT) method was proposed in [25]. The idea behind this method is based on finding such a fictitious, single-service non-full-availability system with the capacity that is equal to the capacity of the MSF direction in which the blocking probability is equal to the blocking probability in MSF for particular classes of offered traffic. Another assumption here is that traffic offered to the fictitious system is equal to traffic offered to the network direction under consideration. The fictitious non-full-availability system, besides the capacity and offered traffic, is additionally characterized by the availability parameter. This parameter defines the number of output links that are available from one input link of the system. In the PGBMT method, the availability value, called effective availability, for individual classes of offered traffic is determined on the basis of the MSF structure.
The PGBMT method is a starting point for the development of a new method for modeling MSFs with a variable number of switches in the middle stage (and, consequently, MSFs with compression in the first stage). In the proposed PGBMTC method, we will take into consideration the phenomenon of blocking of switches in the first stage. The problem of concurrency of the events of internal and external blocking and blocking in switches of the first stage will be solved in the PGBMTC method on the basis of a separation of offered traffic, matched with particular types of blocking in MSF. Consequently, in calculations of the internal blocking (according to the proposed PGBMTC method), we take into account only this traffic that has not been blocked as a result of the external blocking and the blocking of the switches of the first stage, whereas, in calculations of the external blocking, we take into account traffic that has not been blocked as a result of the internal blocking and the blocking of the switches of the first stage. The same procedure is repeated for calculations of the blocking of the switches of the first stage (excluding traffic that is lost because of the internal and external blocking). It is in this way that we “separate,” in a given step of calculations, traffic that is taken into consideration in the calculations of the internal and external blocking and the blocking of the switches of the first stage. Because of the interdependence of the blocking phenomena and the value of offered traffic, calculations are to be carried out iteratively.
The proposed method was constructed on the basis of the following traffic engineering models: model of interstage links, model of output links of switches of the first stage, model of output links in a given direction, and the method for determination of effective availability for any traffic class. These four elements allow us to derive formulas that describe the blocking probability for individual traffic classes offered to MSF. The derived formulas will then be used in the next section in an iterative algorithm for modeling the blocking probability in MSFs with a variable number of switches in the middle stage.
4.1. Model of Interstage Links
In the PGBMTC method, the model of an interstage link is a multiservice model of full-availability group (FAG) [45,46,47]. FAG has the capacity of f AUs, whereas all free AUs are always available to a new call. The occupancy distribution and the blocking probability for calls of class i in a link with the capacity of f AUs can be described by the following equations:
where
- n is the number of busy AUs in the FAG with the capacity of f AUs,
- is the occupancy probability of n AUs in a link with the capacity of f AUs,
- is the intensity of traffic of class i offered to the FAG, and
- for and .
Equation (1) is the Kaufman–Roberts formula that allows the occupancy probability of n AUs (occupancy distribution) in the system with the capacity f AUs that services M classes of traffic streams to be determined. To determine the occupancy distribution, the only requirement is to identify the number of demanded resources by calls of class i and the value of the intensity of offered traffic. For the case of Erlang traffic considered in the article, the intensity value for traffic of class i can be determined by the following equation:
where is the intensity of call stream (the average number of arriving demands within time unit) of class i, and is the intensity of service stream (the average number of serviced calls within time unit) of class i. The occupancy distribution determined using Equation (1) allows us to determine the blocking probability for individual traffic classes. Based on Equation (2), the blocking probability of class i is equal to the sum of the probabilities of these states in which the system has less than free AUs, required for a demand of class i to be serviced.
Symbolically, the FAG model will be written as follows: , where is a set of traffic streams offered to FAG, and is a set of individual classes of offered traffic. Therefore, we can write:
where is a set of blocking probabilities in FAG for individual traffic classes.
If the FAG model is used to model one interstage link in an MSF, then, with the assumption of symmetrical traffic distribution (Symmetric traffic distribution results from the adopted choice algorithm for the switches of the middle stage. According to this algorithm, the switches of the middle stage are chosen in a pseudo-random way for their loads to be equally distributed.) in the MSF as shown in Figure 5, traffic offered to one interstage link can be determined by the following equation:
where u defines the number of switches removed from the middle stage of MSF. By taking the value of traffic offered to interstage links into consideration, the model of interstage link can be then described by the following symbol: , where is a set of traffic streams offered to a single interstage link. The blocking probability for traffic of class i in an interstage link can be written in the adopted notation as follows:
where is a set of blocking probabilities for individual traffic classes in an interstage link of the switching fabric with a variable number of active switches in the middle stage.
4.2. Modeling of a Direction
The direction in MSF, presented in Figure 5, comprises k single output links of the switches of the third stage (the number of links that create an output direction can be composed of any number from to ). To analyze the direction, the PGBMT method and the proposed PGBMTC method use a limited-availability group (LAG) model [48]. LAG is a link group composed of k separated component links. Each component link has the capacity equal to f AUs. The notion of separation of component links results from the adopted call control algorithm in LAG. According to this algorithm, a new call of class i can be admitted for service only when the LAG has at least one free (unoccupied) component link that can handle the call of class i. This means that the algorithm excludes the possibility to “divide” the call between different AUs that belong to a number of links. A new call can be serviced only by AUs that belong to just one component link. This particular way of handling calls is in line with the adopted method for setting up connections in MSF—a new call that demands that a given direction can be serviced by one component link in this direction.
The distribution of occupied AUs in a LAG with the capacity AUs can be approximated by the following recurrence dependence [48]:
where is traffic of class i that is offered to the LAG, and is the conditional transition probability between states n and for calls of class i. This parameter determines the probability of such a distribution of free AUs in the LAG that makes service of a call of class i in state n possible:
The combinatorial function determines the number of arrangements of x elements (free AUs) in k sets (LAG links), each with the capacity f elements (AUs) (the capacity of a component link expressed in AUs). The further assumption is that, in each set, h elements have been earlier deployed (accommodated):
The occupancy distribution (7) allows us to derive the distribution of the unoccupied links for a call of class i. This distribution determines the probability that s links can handle a call of class i [48]:
where is the conditional distribution of free links for a call of class i, which can be determined with the assumption that x AUs in the LAG are unoccupied:
where for and for .
It should be noted that the probability refers to a blocking event in LAG for calls of class i since it determines an event of a lack of free links in LAG for calls of this particular class.
Symbolically, the model can be written in the following way: , where is a set of traffic streams offered to the LAG. If the LAG model is used to model an output direction, then, with the assumption of a symmetrical traffic distribution in the MSF as shown in Figure 5, traffic offered to one direction can be determined by the following equation:
while the corresponding model will be written down with the symbol , where is a set of traffic streams offered to a given direction.
4.3. Modeling of Output Links in a Switch of the First Stage
The switch from which u output links have been removed has the dimension links. Therefore, traffic directed to k input links of this switch will be determined by Equation (5), which can be written down relative to the switch as
where is the traffic of class i offered to one switch of the first stage (SS1 – Switch of Stage 1). The number of the output links in this switch can be treated as a LAG with component links. Hence, the output links of a switch of the first stage can be approximated by the model , where is a set of traffic streams offered to a single switch of the first stage.
4.4. Modeling of Effective Availability
In the methods of effective availability, the MSF model can be approximated by a model of a fictitious single-stage system, that is, a non-full-availability group model (NFAG). Therefore, to evaluate the internal blocking probability in MSF, it is necessary to determine the value of effective availability of each class of offered traffic. Effective availability is defined as the availability for a given traffic class to the switches of the last stage of the equivalent network.
The equivalent network (EN) is not a real network, and it is created only for the purpose of calculation. It is a single-service network and has an identical topological structure as MSF, whereas the capacity of input, output, and interstage links is equal to one AU. For a given real network, as many ENs are created as the number of traffic classes offered to the real network (this means that only one class of calls can be serviced in the equivalent network). Then, to each of the links of the EN determined for a class i (), we assign its load equal to the blocking probability for calls of class i in the links of the real MSF. In this way, we create a number of equivalent networks in which rescaling of multiservice traffic to single-service traffic has been performed. Determining the effective availability for a given traffic class is based on a channel graph of the equivalent network which shows all possible connection paths between a required pair of switches of the first and the last stage.
Effective availability for traffic of class i in a three-stage MSF with Clos structure (Figure 5) can be determined on the basis of the following equation [25]:
where
- —the probability of unavailability of one switch of the third stage in MSF in which u switches of the middle stage have been removed; this parameter can be determined on the basis of the channel graph for an equivalent network for class i of offered traffic;
- —fictitious load of EN link for calls of class i determined on the basis of the FAG model ( in the case of single-service networks is the fictitious load (the occupancy probability) of a given link but at the same time the blocking probability. Assuming the capacity of a link is equal to one AU in the equivalent network, the difference in Equation (14) shows the number of available links for a call of a given class.):where is determined on the basis of Equation (6);
- —fictitious load of one output link of the equivalent network for calls of class i. This parameter is determined by Equation (15), that is, on the basis of the FAG model, taking into account the fact that the number of links in a given direction is fixed (constant) and does not depend on the removed switches of the middle stage. Hence, in (5), the assumption should be that :
The value of the parameter in Equation (14) is determined on the basis of a channel graph of the equivalent switching fabric constructed for class i calls. The graph shows all possible connecting paths between the switches of the first stage and the third stage. Figure 6 shows the channel graph for the structure of a switching fabric considered in the article and shown in Figure 5.
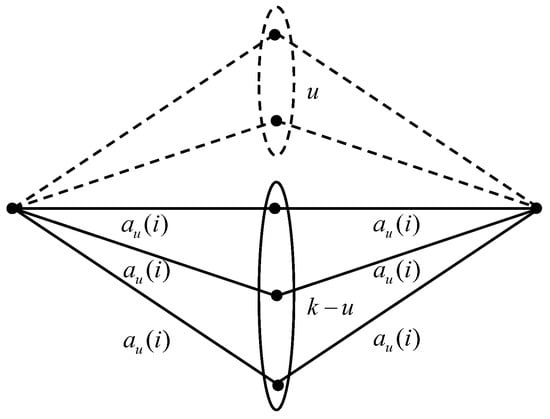
Figure 6.
Channel graph of the three-stage switching fabric from Figure 5.
Each of the edges of the graph is attributed a fictitious load . The probability of unavailability for a switch of the third stage in the network corresponds to the blocking of all connecting paths between the selected switches of the first stage and the third stage, and can be determined, for example, using the Lee method [49]. For the graph from Figure 6 that corresponds to the MSF in which u switches of the middle stage have been removed, we then have
In Equation (17), the expression describes an event in which the graph edge is free for calls of class i; therefore, describes an event in which one connection path is free. In turn, corresponds to an event in which at least one edge of the graph is occupied, and, consequently, a given connection path is blocked. By raising this expression to the power , we can determine the blocking events for all connecting paths between switches of the first stage and the third stage.
In Equation (17), the assumption is that the interstage links between the first stage and the second stage, and between the second stage and the third stage, have the same load and are independent of each other. Another assumption is that the switches in the middle stage are randomly selected to equalize their loads. In the case where other resource allocation algorithms (e.g., algorithms for the selection of the switches of the middle stage) were known for individual traffic classes, or uneven loads in interstage links, individually determining the value for particular interstage links would be necessary to identify the parameter .
The problem of the independence of interstage links has a much broader context. It is equivalent to the independence of occupancy distributions for particular stages of the switching fabric and, consequently, the independence of appropriate components in the blocking probability. This particular assumption forms the basis for a construction of all approximate methods for modeling switching fabrics. In some cases, such a dependence can (but not necessarily have to) have a certain influence on the results of modeling. Hence, in the developed model, a division of traffic responsible for individual types of blocking situations was applied, which is in line with the approach used in the fixed-point method. This iterative method is a simple engineering method that considers the correlative dependencies between simultaneously working subsystems of a network system. To sum up, in the case of asymmetry of traffic distribution in the network, we determine appropriate values , as shown above, while all possible correlative influences will be nullified by the application of an iterative method that would consider traffic distribution for the individual component elements of the blocking probability (Section 5.4).
The model of effective availability can be symbolically written as
where i is determined by Equation (14).
5. Model of MSF with Variable Number of Switches
This model assumes that the total blocking probability for calls of class i in a three-stage MSF from which u switches of the second stage have been removed is the sum of the blocking probability of the switch of the first stage , the external blocking probability , and the internal blocking probability :
In Equation (19), the total blocking probability is defined as the sum of all blocking probabilities for individual types that is the blocking of switches of the first stage (access switches) and external and internal blocking. This adopted approach results from the independence of the events of individual types affected by the changes in the traffic intensity that is taken into consideration in the calculations for individual types of blocking. The independence of these events also results from the operation of the path-finding algorithm for finding connection paths in the switching structure. In the following sections, we will discuss the ways the individual component elements of the blocking probability in MSF can be modeled.
5.1. Blocking Probability of a Switch of the First Stage
A blocking event of a switch of the first stage occurs in the case of a compression of the first stage of MSF that is the full occupancy of the switches in the first stage of MSF in which the number of input links exceeds the number of output links. In these switches, not all calls that arrive at the input links will be handled by a decreased number of output links, and, consequently, a certain part of the call stream will be blocked. In the considered MSF model, the occurrence of compression in the first stage results from the removal of a certain number of switches of the second stage from the MSF structure. In Section 4.3, to model the output links of a switch with the dimensions links, a LAG model with component links, each with the capacity f AUs, is used. Therefore, the blocking probability in MSF is approximated by the blocking probability in LAG:
where is the distribution of free links in the LAG with the capacity component links (Equation (10)). Formally, we can then write
where individual elements of the set are determined by Equation (13) and .
5.2. External Blocking Probability
An external blocking event for calls of class i occurs in the case of the occupancy of all links that belong to a given direction. The output direction can be approximated by the LAG model (Section 4.3) with k component links, each with the capacity f AUs. Note that the number of the switches removed from the second stage has no influence on the number of links that belong to a given direction (Section 3). Therefore, to determine the external blocking probability for a call of class i, the probability of a lack of free component links in LAG that could service a call of class i is used:
where is the distribution of free links in the LAG with the capacity of k component links (Equation (10)). Using the adopted symbolic notation, we can write
where and the individual elements of the set are determined by Equation (12).
5.3. Internal Blocking Probability
The internal blocking phenomenon occurs when between a selected switch of the first stage (at the input of which a call arrived) and a selected switch of the third stage (that has a free output link), a connection cannot be set up. In the effective availability methods, the MSF model can be approximated by a non-full-availability model (NFAG). The basic property of NFAG [50] lies in the fact that separate traffic sources have no access to all k output links of the group, but only to a certain part of it, d, which is called availability. A group of traffic sources that have access to the same d output links creates the so-called load group. In modeling the phenomenon of internal blocking in MSF, the assumption is that the internal blocking phenomenon in MSF corresponds to the blocking probability in NFAG. In this case, each switch of the first stage can be treated as a load group. It has been proved in traffic theory [51,52,53] that the blocking probability in any NFAG with the capacity of k links and availability of d links can be written as follows:
where is the occupancy probability of any z links in NFAG and is the conditional blocking probability in NFAG for the occupancy state z links. This probability describes an event in which all d available links to a given input are occupied in NFAG. Equation (24) can be rewritten depending on the number of free links s in the following form:
where for . Distribution determines the probability of an event that s links in NFAG are free.
To model the internal blocking phenomenon in MSF, the approach proposed in the PGBMT method [25] was used. The approach is based on Equation (25) and an additional assumption that at least one link in NFAG is free. Therefore, Equation (25) for a multiservice NFAG model for traffic of class i can be rewritten as follows:
In Equation (26), the conditional blocking probability for calls of class i can be determined on the basis of the so-called Erlang coefficients that are used, for example, in single-service NFAG models: Erlang model [51] and Molina model [52]:
whereas the distribution can be approximated by a truncated distribution of free links in the output direction, that is, by the distribution of free links in LAG with the capacity of k component links (Section 4.2):
where the distribution is determined on the basis of (10)
The application of the truncated distribution results from the additional assumption of one free link in NFAG that is adopted in Equation (26). It is a consequence of the operation of the algorithm to control setting up connections in MSF (Section 3), according to which an event of the internal blocking can only occur when there is at least one free link in a given direction. Therefore, an identical assumption was adopted for the NFAG model (that approximates the phenomenon of the internal blocking in MSF), and the state in which all links were occupied was excluded from the sum (26). Eventually, on the basis of Equations (26)–(28), we can write
The probabilities in the PGBMTC method are used to approximate the internal blocking probability in MSF:
The NFAG model, which is used to determine the internal blocking probability in MSF, will be symbolically denoted as , where the set is a set of parameters of effective availability for traffic classes offered to MSF from which u switches of the second stage have been removed. The method for modeling effective availability for calls of class i is discussed in Section 4.4. The internal blocking probability in MSF in the adopted notation can be written as follows:
where is a set of the internal blocking probabilities in MSF.
5.4. The Problem of Simultaneity of Blocking Events
The models of the studied blocking phenomena presented above do not take into consideration, at the analytical level, the simultaneity of the occurrence of blocking events of different types. The control algorithm for setting up connections in MSF (Section 3) operates in a sequential way, checking the possibility of blocking of the switches of the first stage and the external and internal blocking events. Therefore, in the case of registering, for example, a blocking event of the switches of the first stage for a given call, an event of internal blocking will never be registered for this call, even if the occupancy state of the interstage links corresponds to this blocking.
In the PGBMT method [25], only two types of blocking are determined: external and internal blocking. A possibility of a concurrent and simultaneous occurrence of external and internal blocking events can be reduced by subtracting their product from the sum of the internal and external probabilities. This approach, however, does not take into consideration in enough detail the mutual influence of the phenomena of internal and external blocking recorded in the course of the simulation experiments.
In the Iterative Point-to-Point Direct (IPPD) method [54], the problem of simultaneity of internal and external blocking events is solved on the basis of the following reasoning: While determining the internal blocking probability, we consider only for this part of traffic that has not been rejected because of the external blocking. In the same way, while determining the external blocking probability, we consider only this part of traffic that has not been rejected because of the internal blocking. In the PGBMTC method proposed in the article, the above approach is expanded to include three types of blocking that can occur in an MSF with compression in the first stage. As a consequence, in line with the approach adopted in [54], the assumption is that the outputs of the switch of the first stage can be offered only this part of the total traffic that has not been rejected because of either the external or internal blocking:
While analyzing the phenomenon of the external blocking, our assumption is that a given direction can be offered only this part of the total traffic that has not been rejected at interstage links as a result of the internal blocking or blocking of switches in the first stage:
If, in turn, we consider the phenomenon of the internal blocking, then our assumption must be that a given direction can be offered only this part of the total traffic that is not lost because of the external blocking or blocking in the switches of the first stage:
The interstage link model can be used to determine the internal blocking probability. Hence, according to the adopted approach, the interstage links can only be offered this part of the total traffic that has not been rejected as a result of the external blocking or blocking in the switches of the first stage:
In the proposed solution, the exclusion of simultaneity (concurrence) of blocking events is made possible following the introduction of a separation of traffic expressed by Equations (32)–(35). As a consequence of this approach, the total blocking probability can be written directly in the form of the sum of blocking probabilities: those of the switches of the first stage, external and internal (Equation (19)).
5.5. The PGBMTC Method as an Iterative Computational Process
Since determination of the blocking probability of a given type requires prior knowledge of traffic entangled in the blocking probabilities of the remaining two types, to determine the blocking probability in MSF with compression in the first stage, it is necessary to construct an appropriate iterative process. This process is presented below in the form of the PGBMTC method. The algorithm assumes that the notation determines the value of the parameter X in the n-th step of the iterative process.
The PGBMTC Method
- Step 1:
- Initiation of iteration step
- Step 2:
- Determination of the initial approximations for blocking probabilities:
- Step 3:
- Increase in the iteration step:
- Step 4:
- Step 5:
- Determination of effective availability:
- Step 6:
- Determination of the internal blocking probability in MSF:
- Step 7:
- Determination of external blocking probability in MSF:
- Step 8:
- Determination of blocking probability for switches of the first stage:
- Step 9:
- Determination of the total blocking probability in MSF:
- Step 10:
- Checking the accuracy of calculations for each call class i:
- ifthen
- go to Step 3
- else
- calculate the final blocking probabilities:
- end if
The parameter is the requested relative error that determines the accuracy of the method. In the proposed method, in a given step of the iteration, the blocking probability for the switches of the first stage and the external blocking and internal blocking for individual call classes are calculated. These probabilities are determined on the basis of relevant values of traffic offered, respectively, to the output links in a switch of the first stage, interstage links, and links in a given direction. All traffic is calculated, in turn, on the basis of the blocking probabilities determined in the previous iterative step. The proposed algorithm is then based on performing a certain repeatable number of calculations of normalized type, which consequently makes the method uncomplicated and easily programmable.
The PGBMTC method is an iterative method and is rapidly convergent. For the required relative error , the number of necessary iterations for all our calculations performed in the study did not exceed 10. In most of the cases, the number of necessary iterations oscillated within the range from 3 to 5. Given that the system is analyzed at the so-called macrostate level (i.e., occupancy states) and not at the microstate level (i.e., the number of flows of individual traffic classes that are currently being serviced), the presented calculation algorithm is characterized by low computational complexity.
6. Results of Modeling MSF with Variable Number of Switches
The proposed PGBMTC method to model multiservice switching fabrics with compression in the first stage (and in consequence with a variable number of switches in the middle stage) is an approximate method. To verify all theoretical assumptions adopted in the method and to evaluate its usefulness for analyses of energy-aware networks, the results of the analytical modeling were compared with the result of a simulation performed for a selected three-stage Clos switching fabric (Figure 5). The simulator was developed for the sole purpose of the article and was based on the process interaction approach. The simulator was implemented in the C++ language. Thus, the developed simulator makes it possible to determine the values of the blocking probability and the loss probability for calls of individual traffic classes in structures with a variable number of switches of the middle stage. The input data for the simulator are the capacity and the structure of the switching fabric. The number of demanded allocation units and service time are given for each traffic class. The average value of traffic offered to a single allocation unit in the system is also given. To determine the blocking probability, the condition for the termination of a simulation experiment is the amount of elapsed time (duration time) for individual series necessary to generate a predefined number of calls of the class that is least active (most frequently, it is the class with the biggest number of demanded allocation units). The average result is calculated on the basis of 10 series. In practice, to obtain the confidence intervals that are not greater than 5% of the average value of the results obtained on the basis of simulation experiments, it is necessary to generate about 1,000,000 calls of the least active class.
The MSF chosen for the study had the following structural parameters:
- First-stage switch: links
- Second-stage switch: links
- Third-stage switch: links
- Number of outer-stage switches: 8
- Capacity of input, output, and interstage links AUs
The assumption in the study was that traffic offered to MSF had the following parameters:
- Number of classes of offered traffic:
- Number of demanded AUs for individual traffic classes: AU, AUs, AUs
- Proportions of offered mixture of traffic:
Figure 7, Figure 8 and Figure 9 show the results of the analytical calculations and the results of the simulation experiments to determine the blocking probability in MSF. The results are presented for each call class for a different number of switches in the middle stage equal to eight (), six (), and four (). The results of the simulation experiments are shown in the form of appropriate symbols with a 95% confidence level, determined on the basis of the t-student distribution for 10 series, each comprising 10,000,000 calls of the class whose calls arrived with the least intensity. The results of the analytical calculations are shown in the form of solid lines. All results are presented in relation to the traffic offered to one AU in an output link of MSF:
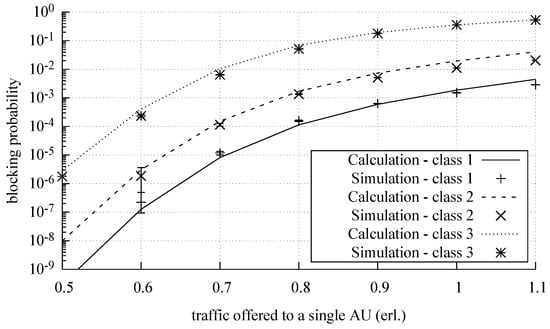
Figure 7.
Blocking probability in the switching fabrics with deactivated switches.
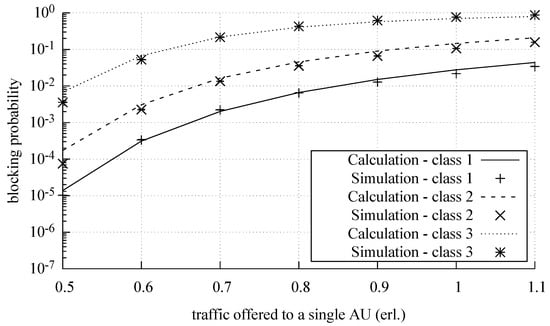
Figure 8.
Blocking probability in the switching fabrics with deactivated switches.
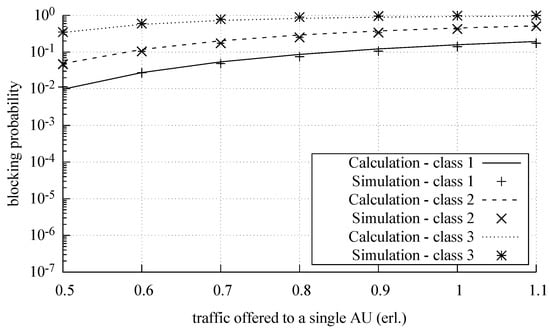
Figure 9.
Blocking probability in the switching fabrics with deactivated switches.
The study confirms high accuracy of the PGBMTC method in modeling MSFs with a variable number of switches in the middle stage, considerably higher than the accuracy of the method proposed in [10]. For the example considered in the article, the relative error of the method (in relation to the results of the simulation and averaged for the entire considered range of offered traffic) was approximately 5%, whereas, in the case of the method proposed in [10], it amounted to 30%. The increase in the accuracy of calculations results from the fact that the blocking in the switches in the access stages and the iterative determination of the internal and external blocking and the switches of the first stage are taken into account.
7. Case Study
One of the possibilities in constructing energy-aware MSF is the application of an algorithm that would change the structure of a network with an introduction of the temporary activation/deactivation of a certain number of switches depending on the changes in traffic offered to the network. Such an algorithm should also be conditioned by a number of predefined boundary values of the blocking probability that must not be exceeded, regardless of the current load of the network. As a consequence, the network structure can be altered in a way that would always guarantee the boundary values of blocking probabilities for individual traffic classes. The proposed PGBMTC method models the changes in the structure of MSF (following activation or deactivation of the switches of the second stage) into the corresponding changes in the effective availability parameter, which then allows the boundary blocking probabilities for MSFs with a different number of switches in the second stage to be determined.
Figure 10, Figure 11 and Figure 12 show the changes in the blocking probability for individual traffic classes depending on the value of offered traffic for a different number of active switches in the middle stage. By analyzing Figure 10, Figure 11 and Figure 12, it is possible to determine the number of switches, in particular load range, necessary for traffic streams to be serviced.
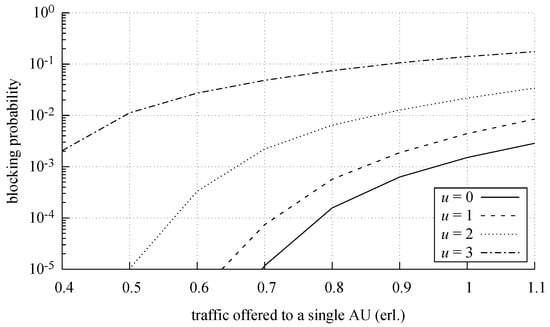
Figure 10.
Blocking probability for class 1 calls in relation to the number of deactivated switches (u parameter).

Figure 11.
Blocking probability for class 2 calls in relation to the number of deactivated switches (u parameter).
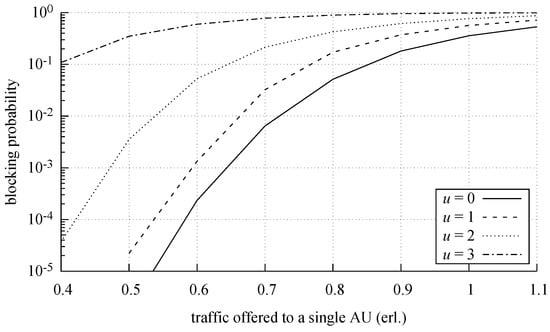
Figure 12.
Blocking probability for class 3 calls in relation to the number of deactivated switches (u parameter).
For example, let us assume that an operator is interested in maintaining the assumed (predefined) values for the blocking probability of calls of the second class (demanding 2 AUs). Our further assumption is that traffic offered to a single input allocation unit in MSF can change within 24 h within the range of 0.4 erl./AU to 1.0 erl./AU. By examining Figure 11, one can note that, within the time intervals in which the traffic intensity changes within the range of 0.4 erl./AU to 0.67 erl./AU, it is enough to have five active switches in the middle stage to guarantee the blocking probability at the level . Then, from 0.68 erl./AU to 0.87 erl./AU, six switches of the middle stage are necessary to obtain the blocking probability that would be below the required (and predefined) threshold (). Further increase in the traffic intensity (to the value 0.98 erl./AU) imposes a necessity to activate the seventh switch in the middle stage, whereas, when the value 1 erl./AU is exceeded, all eight switches in the middle stage are required to be activated to guarantee blocking for traffic streams of the second class below . In the considered example, the switches in the middle (spine) stage can be Cisco Nexus 9332C and 9364C Fixed Spine Switches with the maximum power of 700 W (typical power 296 W) for a 32-port device and 1245 W (typical power 429 W) for a 64-port device. In line with the conducted traffic analysis, it is shown that, to retain the same blocking probability, it is possible to switch off three of the eight switches of the middle stage. This information can be then used for a rough evaluation of a possible reduction of power consumption (that results directly from the number of switched-off devices and their power). For example, if we roughly assume that power consumption is proportional to the number of ports used, then the minimum power gain can be the following: usage of the number of the ports in a 9332C switch . Thus, the obtained switching structure, one that is closest to optimum from the traffic perspective, can be further investigated and thoroughly analyzed with regard to energetic dependencies.
The developed PGBMTC method then makes it possible to evaluate the level of energy saving resulting from switching off a predefined number of switches in the middle stage, depending on the network load and the required internal blocking probability (Figure 10, Figure 11 and Figure 12).
The PGBMTC method can be directly used to model structures in which the Clos topology is applied to support connections between certain designated inputs and outputs [55,56]. In practical outcomes, this can be demonstrated in such solutions as those known as ToR (Top of Rack), EoR (End of Row), or MoR (Middle of Row) [57]. In the case of ToR solutions, a certain portion of traffic is confined between the ports of the same access switch. This means that this portion of traffic is not offered to the consecutive aggregation and spine switches. In the model proposed in the article, the omission of this phenomenon leads to a certain overestimation of the value of the internal blocking. The confinement of traffic in the access switch leads, consequently, to a significant decrease in the internal blocking probability (traffic is supported/serviced only in one stage) with an insignificant change in the external blocking probability. This means that the solution presented in the article determines the quality parameters for the worst case. To take the phenomenon under discussion into consideration, the proposed model should be modified by introducing a coefficient that would scale the value of offered traffic to successive stages in the switching fabric (one that would be dependable on the value of traffic serviced by ToR switches).
8. Conclusions
This article proposes a new analytical PGBMTC method to model multiservice Clos switching fabrics with a variable number of switches in the middle stage. The developed method makes it possible to evaluate the number of required active spine switches depending on the network load and the assumed blocking probability for individual traffic classes serviced in the network. Consequently, the proposed PGBMTC method can be used in practice to construct energy-saving algorithms (based on switching off a given number of switches in the spine stage) that would sustainably maintain appropriate QoS parameters. The proposed model can be easily extended to include different structures of switching fabrics and connection networks in data centers. The approach based on the connection graph adopted in the method provides a possibility to take into consideration any number of switches in the individual stages, their dimensions and link capacities, or the way output directions are executed.
The variability in the number of switches in the middle stage required a new model of a multiservice switching fabric with compression in the first stage to be developed. The proposed PGBMTC method is, to the best belief of its authors, the first method that considers the phenomenon of blocking in switches in the first stage (compression). The problem of simultaneity of events of different types of blocking in the network (internal blocking, external blocking, blocking of first-stage switches) is solved with the introduction of a separation of traffic responsible for the occurrence of blocking events of different types. It leads to the significant increase in the accuracy of the proposed analytical method in relation to the method developed in [10].
Within a broader context, the method will make it possible to model any multiservice switching fabric with compression in the first stage, that is, those networks in which the aggregate bitrate of the input links is higher than the aggregate bitrate of the output links.
Author Contributions
Conceptualization, M.G. and M.S. (Maciej Stasiak); methodology, M.G., M.S. (Maciej Sobieraj), M.S. (Maciej Stasiak), and M.D.S.; software, M.D.S.; validation, M.S. (Maciej Sobieraj) and M.D.S.; formal analysis, M.G., M.S. (Maciej Sobieraj), M.S. (Maciej Stasiak), and M.D.S.; investigation, M.S. (Maciej Sobieraj) and M.D.S.; resources, M.S. (Maciej Sobieraj) and M.D.S.; data curation, M.S. (Maciej Sobieraj) and M.D.S.; writing—original draft preparation, M.G. and M.S. (Maciej Stasiak); writing—review and editing, M.G. and M.S. (Maciej Sobieraj); visualization, M.S. (Maciej Sobieraj) and M.D.S.; supervision, M.G.; project administration, M.S. (Maciej Sobieraj); funding acquisition, M.S. (Maciej Stasiak) All authors have read and agreed to the published version of the manuscript.
Funding
This research was funded by the Polish National Science Centre (supervised by the Ministry of Science and Higher Education), grant 2016/23/B/ST7/03925.
Conflicts of Interest
The authors declare no conflict of interest. The funders had no role in the design of the study; in the collection, analyses, or interpretation of data; in the writing of the manuscript, or in the decision to publish the results.
References
- Bolla, R.; Bruschi, R.; Davoli, F.; Cucchietti, F. Energy Efficiency in the Future Internet: A Survey of Existing Approaches and Trends in Energy-Aware Fixed Network Infrastructures. IEEE Commun. Surv. Tutor. 2011, 13, 223–244. [Google Scholar] [CrossRef]
- Morley, J.; Widdicks, K.; Hazas, M. Digitalisation, energy and data demand: The impact of Internet traffic on overall and peak electricity consumption. Energy Res. Soc. Sci. 2018, 38, 128–137. [Google Scholar] [CrossRef]
- Chabarek, J.; Sommers, J.; Barford, P.; Estan, C.; Tsiang, D.; Wright, S. Power Awareness in Network Design and Routing. In Proceedings of the IEEE INFOCOM 2008—The 27th Conference on Computer Communications, Phoenix, AZ, USA, 13–18 April 2008. [Google Scholar] [CrossRef]
- Mandal, U.; Chowdhury, P.; Lange, C.; Gladisch, A.; Mukherjee, B. Energy-efficient networking for content distribution over telecom network infrastructure. Opt. Switch. Netw. 2013, 10, 393–405. [Google Scholar] [CrossRef]
- Abedi, M.; Emadi, M.J. Cooperative Power Management in Energy Harvesting Communication Systems in Presence of a Helper. IEEE Trans. Green Commun. Netw. 2019, 3, 147–158. [Google Scholar] [CrossRef]
- Clos, C. A study of non-blocking switching networks. Bell Syst. Tech. J. 1953, 32, 406–424. [Google Scholar] [CrossRef]
- Singh, D. Demystifying DCN Topologies: Clos/Fat Trees—Part2; Technical Report; Packet Pushers, 2018; Available online: https://packetpushers.net/demystifying-dcn-topologies-clos-fat-trees-part2/ (accessed on 29 June 2020).
- Lapukhov, P.; Premji, A.; Mitchell, J. Use of BGP for Routing in Large-Scale Data Centers; RFC 7938; IETF: Fremont, CA, USA, 2016. [Google Scholar]
- Panarello, C.; Lombardo, A.; Schembra, G.; Chiaraviglio, L.; Mellia, M. Energy Saving and Network Performance: A Trade-off Approach. In Proceedings of the 1st International Conference on Energy-Efficient Computing and Networking, Passau, Germany, 13–15 April 2010; ACM: New York, NY, USA, 2010; pp. 41–50. [Google Scholar]
- Głąbowski, M.; Stasiak, M.; Stasiak, M.D. QoS Criteria for Energy-Aware Switching Networks. In Quality, Reliability, Security and Robustness in Heterogeneous Systems; Duong, T.Q., Vo, N.S., Phan, V.C., Eds.; Springer International Publishing: Cham, Switzerland, 2019; pp. 137–147. [Google Scholar]
- Li, Z.; Tesfatsion, S.; Bastani, S.; Ali-Eldin, A.; Elmroth, E.; Kihl, M.; Ranjan, R. A Survey on Modeling Energy Consumption of Cloud Applications: Deconstruction, State of the Art, and Trade-Off Debates. IEEE Trans. Sustain. Comput. 2017, 2, 255–274. [Google Scholar] [CrossRef]
- Bui, D.M.; Huh, E.N.; Lee, S. Optimizing power consumption in cloud computing based on optimization and predictive analysis. In Proceedings of the IMCOM ’8, Langkawi, Malaysia, 5–7 January 2018. [Google Scholar] [CrossRef]
- Cordeschi, N.; Shojafar, M.; Baccarelli, E. Energy-saving self-configuring networked data centers. Comput. Netw. 2013, 57, 3479–3491. [Google Scholar] [CrossRef]
- Kühn, P.J. Systematic Classification of Self-adapting Algorithms for Power-saving Operation Modes of ICT Systems. In Proceedings of the 2nd International Conference on Energy-Efficient Computing and Networking, New York, NY, USA, 31 May–1 June 2011; ACM: New York, NY, USA, 2011; pp. 51–54. [Google Scholar]
- Dizaji, L.G.; Rahbar, A.G. PAHON: Power-Aware Hybrid Optical Network. J. Parallel Distrib. Comput. 2018, 117, 1–16. [Google Scholar] [CrossRef]
- Gupta, M.; Singh, S. Greening of the Internet. In Proceedings of the 2003 Conference on Applications, Technologies, Architectures, and Protocols for Computer Communications, Karlsruhe, Germany, 25–29 August 2003; ACM: New York, NY, USA, 2003; pp. 19–26. [Google Scholar]
- Jimeno, M.; Christensen, K.; Nordman, B. A Network Connection Proxy to Enable Hosts to Sleep and Save Energy. In Proceedings of the 2008 IEEE International Performance, Computing and Communications Conference, Austin, TX, USA, 7–9 December 2008; pp. 101–110. [Google Scholar] [CrossRef]
- Applegate, D.; Cohen, E. Making Intra-domain Routing Robust to Changing and Uncertain Traffic Demands: Understanding Fundamental Tradeoffs. In Proceedings of the 2003 Conference on Applications, Technologies, Architectures, and Protocols for Computer Communications, Karlsruhe, Germany, 25–29 August 2003; ACM: New York, NY, USA, 2003; pp. 313–324. [Google Scholar]
- Alonso, M.; Coll, S.; Martínez, J.; Santonja, V.; López, P. Power consumption management in fat-tree interconnection networks. Parallel Comput. 2015, 48, 59–80. [Google Scholar] [CrossRef]
- Żal, M. Energy-efficient optical switching nodes based on banyan-type switching fabrics. Opt. Switch. Netw. 2019, 33, 95–102. [Google Scholar] [CrossRef]
- Binida, N.; Wend, W. Die Effektive Erreichbarkeit für Abnehmerbundel hinter Zwischenleitungsanungen. Nachrichtentechnische Ztg. (NTZ) 1959, 11, 579–585. [Google Scholar]
- Lotze, A.; Roder, A.; Thierer, G. PCM-Charts; Technical Report; Institute of Switching and Data Technics, University of Stuttgard: Stuttgart, Germany, 1979. [Google Scholar]
- Ershova, E.; Ershov, V. Digital Systems for Information Distribution; Radio and Communications: Moscow, Russian, 1983. (In Russian) [Google Scholar]
- Lotze, A.; Roder, A.; Thierer, G. PPL—A reliable method for the calculation of point-to-point loss in link systems. In Proceedings of the 8th International Teletraffic Congress, Melbourne, Australia, 10–17 November 1976; Organizing Committee: Melbourne, Australia, 1976; Volume 547, pp. 1–44. [Google Scholar]
- Stasiak, M. Combinatorial considerations for switching systems carrying multi-channel traffic streams. Ann. Des Télécommun. 1996, 51, 611–625. [Google Scholar]
- Stasiak, M.; Głąbowski, M. Multi-service Switching Networks with Point-to-Group Selection and Several Attempts of Setting up a Connection. In Performance Modelling and Analysis for Heterogeneous Networks; Kouvatsos, D., Ed.; River Publishers: Gistrup, Denmark, 2009; pp. 3–26. [Google Scholar]
- Głąbowski, M. Modelling of State-dependent Multi-rate Systems Carrying BPP Traffic. Ann. Telecommun. 2008, 63, 393–407. [Google Scholar] [CrossRef]
- Stasiak, M.; Zwierzykowski, P. Point-to-group blocking in the switching networks with unicast and multicast switching. Perform. Eval. 2002, 48, 249–267. [Google Scholar] [CrossRef]
- Głąbowski, M.; Sobieraj, M. Analytical modelling of multiservice switching networks with multiservice sources and resource management mechanisms. Telecommun. Syst. 2017, 66, 559–578. [Google Scholar] [CrossRef]
- Głąbowski, M.; Stasiak, M.D. Modelling of Multiservice Switching Networks with Overflow Links for Any Traffic Class. IET Circuits Devices Syst. 2014, 8, 358–366. [Google Scholar] [CrossRef]
- Hanczewski, S.; Sobieraj, M.; Stasiak, M.D. The Direct Method of Effective Availability for Switching Networks with Multi-Service Traffic. IEICE Trans. Commun. 2016, E99-B, 1291–1301. [Google Scholar] [CrossRef]
- Żal, M.; Wojtysiak, P. An energy-efficient control algorithms for switching fabrics. In Proceedings of the 2014 16th International Telecommunications Network Strategy and Planning Symposium (Networks), Funchal, Portugal, 17–19 September 2014; pp. 1–5. [Google Scholar] [CrossRef]
- Roberts, J. (Ed.) Performance Evaluation and Design of Multiservice Networks, Final Report COST 224; Commission of the European Communities: Brussels, Belgium, 1992; pp. 36–44. [Google Scholar]
- Pras, A.; Nieuwenhuis, L.; van de Meent, R.; Mandjes, M. Dimensioning network links: A new look at equivalent bandwidth. IEEE Netw. 2009, 23, 5–10. [Google Scholar] [CrossRef][Green Version]
- Kucharzak, M.; Walkowiak, K.; Siwek, A. Comparison of Evolutionary Algorithm and Heuristics for Flow Optimization in P2P Systems. Int. J. Electron. Telecommun. 2010, 56. [Google Scholar] [CrossRef]
- Domańska, J.; Klamka, J.; Domański, A.; Czachórski, T. Fluid flow approximation of time-limited TCP/UDP/XCP streams. Bull. Pol. Acad. Sci. Tech. Sci. 2014, 62, 217–225. [Google Scholar] [CrossRef]
- Roberts, J. An Erlang formula for the Internet. In Proceedings of the The First, European Teletraffic Seminar, Poznan, Poland, 14–16 February 2011. [Google Scholar]
- Filipowicz, B.; Kwiecień, J. Queueing systems and networks. Models and applications. Bull. Pol. Acad. Sci. Tech. Sci. 2008, 56, 379–390. [Google Scholar]
- Sac, M.; Kaczmarek, S.; Kosek, M. Traffic Model of IMS/NGN Architecture with Transport Stratum Based on MPLS Technology. Int. J. Electron. Telecommun. 2013, 59. [Google Scholar] [CrossRef]
- Moscholios, I.; Logothetis, M. Efficient Multirate Teletraffic Loss Models Beyond Erlang; Wiley-IEEE, Wiley: Hoboken, NJ, USA, 2019. [Google Scholar]
- Tikhonenko, O.; Ziółkowski, M.; Kurkowski, M. M/G/n/(0, V) Erlang queueing system with non-homogeneous customers, non-identical servers and limited memory space. Bull. Pol. Acad. Sci. Tech. Sci. 2019, 67, 489–500. [Google Scholar] [CrossRef]
- Jacobaeus, C. A study on congestion in link-systems. Ericsson Tech. 1950, 48, 1–68. [Google Scholar]
- Jensen, A. Calculations of loss in crossbar automatic exchanges. Teleteknik 1952, 4, 176–200. [Google Scholar]
- Elldin, A. Approach to the Theoretical Description of Repeated Call Attemps. Ericsson Tech. 1967, 23, 345–407. [Google Scholar]
- Kaufman, J. Blocking in a shared resource environment. IEEE Trans. Commun. 1981, 29, 1474–1481. [Google Scholar] [CrossRef]
- Roberts, J. A service system with heterogeneous user requirements—Application to multi-service telecommunications systems. In Proceedings of the Performance of Data Communications Systems and their Applications, Paris, France, 14–16 September 1981. [Google Scholar]
- Dalamagkas, C.; Sarigiannidis, P.G.; Kapetanakis, S.; Moscholios, I.D. Dynamic scheduling in TWDM-PONs using game theory. Opt. Switch. Netw. 2019, 33, 103–113. [Google Scholar] [CrossRef]
- Stasiak, M. Blocking probability in a limited-availability group carrying mixture of different multichannel traffic streams. Ann. Des Télécommun. 1993, 48, 71–76. [Google Scholar]
- Lee, C. Analysis of switching networks. Bell Syst. Tech. J. 1955, 34, 1287–1315. [Google Scholar] [CrossRef]
- Lotze, A. History and development of grading theory. In Proceedings of the 5th International Teletraffic Congress, New York, NY, USA, 14–20 June 1967; pp. 148–161. [Google Scholar]
- Erlang, A.K. The application of the theory of probabilities in telephone administration. In Proceedings of the Scandinavian H.C. Örsted Congress, Copenhagen, Denmark; 1920. [Google Scholar]
- Molina, E.C. Application of the Theory of Probability To Telephone Trunking Problems. Bell Labs Tech. J. 1927, 6, 461–494. [Google Scholar] [CrossRef]
- Longley, H. The efficiency of gradings. Post Off. Electr. Eng. J. 1948, 41, 45–48; 67–72. [Google Scholar]
- Głąbowski, M.; Stasiak, M.D. A Study on the Effectiveness of Threshold and Traffic Overflow Mechanisms in Multi-service Switching Networks with Real-time and Non-real-time Traffic. In Information Systems Architecture and Technology, Proceedings of 36th International Conference on Information Systems Architecture and Technology – ISAT 2015 – Part II; Grzech, A., Borzemski, L., Świątek, J., Wilimowska, Z., Eds.; Springer: Cham, Switzerland, 2016; pp. 143–153. [Google Scholar]
- Al-shawi, M. Clos (Spine & Leaf) Architecture—Overview. Technical Report, Network Design Arena. 2019. Available online: http://www.netdesignarena.com/index.php/2018/11/05/clos-spine-leaf-architecture-overview/ (accessed on 29 June 2020).
- Hedlund, B. Top of Rack Vs. End of Row Data Center Designs. Technical Report. 2009. Available online: http://bradhedlund.com/2009/04/05/top-of-rack-vs-end-of-row-data-center-designs/ (accessed on 29 June 2020).
- Rouse, M. Top-of-Rack Switching. Technical Report, TechTarget. 2017. Available online: https://searchnetworking.techtarget.com/definition/top-of-rack-switching (accessed on 29 June 2020).
© 2020 by the authors. Licensee MDPI, Basel, Switzerland. This article is an open access article distributed under the terms and conditions of the Creative Commons Attribution (CC BY) license (http://creativecommons.org/licenses/by/4.0/).