Abstract
This paper proposes an intelligent system that can hold an interview, using a NAO robot as interviewer playing the role of vocational tutor. For that, twenty behaviors within five personality profiles are classified and categorized into NAO. Five basic emotions are considered: anger, boredom, interest, surprise, and joy. Selected behaviors are grouped according to these five different emotions. Common behaviors (e.g., movements or body postures) used by the robot during vocational guidance sessions are based on a theory of personality traits called the “Five-Factor Model”. In this context, a predefined set of questions is asked by the robot—according to a theoretical model called the “Orientation Model”—about the person’s vocational preferences. Therefore, NAO could react as conveniently as possible during the interview, according to the score of the answer given by the person to the question posed and its personality type. Additionally, based on the answers to these questions, a vocational profile is established, and the robot could provide a recommendation about the person’s vocation. The results show how the intelligent selection of behaviors can be successfully achieved through the proposed approach, making the Human–Robot Interaction friendlier.
1. Introduction
Robots are fascinating machines that are imagined to coexist with humans soon. This type of technology is becoming increasingly prevalent in places such as shopping malls, train stations, schools, streets, and museums [1,2], and in fields such as personal assistance [3], health [4], and rescue operations [5], among other domains. Consequently, to achieve effective human–robot collaboration, robots must be able to understand and interpret the communication mechanisms involved in human–human interaction. Hence, human–robot interaction (HRI) plays an important role in our lives.
This research aims at developing an intelligent system on the NAO platform [6] that allows the intelligent selection of different behaviors [7]. Our proposal seeks to implement an intelligent selection system of behaviors with effective interaction between a human and a robot. Behaviors of the robot, such as gestural patterns, hand positions, and other actions involving a block of memory for execution must be defined. This means that each gesture has to be classified in a library or directory, using the Choregraphe application [8], for later use. The degree of elaboration and refinement of behaviors is directly related to the natural interaction of the robot with its environment. The selection of behaviors to be executed by NAO will be based on a theory of personality traits called the “Five-Factor Model” (FFM) [9]. The selected behaviors will be managed in the particular scenario of a vocational guidance session. This type of tutoring is used to help the person choose an occupation or profession. Interviews are one of the activities carried out during this kind of process. The robot asks a predefined set of questions according to a theoretical model called “Orientation Model” [10,11]. Based on the answers to these questions, the vocational profile of the person and the score of the response are established.
2. Background
2.1. Personality Theory: Five-Factor Model
The Five-Factor Model (FFM) evaluates a personality according to its characteristics. The premise of the FFM is that human personality traits can be described using five factors [9,12]:
- Extroversion (E): Extroversion is characterized by the tendency to seek stimulation in the company of others, talkativeness, and assertiveness.
- Agreeableness (A): Agreeableness is a measure of one’s trusting and helpful nature, and of whether a person is generally well-tempered.
- Conscientiousness (C): Hard work, punctuality, and dependable behavior are characteristic of personality Factor C.
- Neuroticism (N): Neuroticism refers to the tendency to experience unpleasant emotions easily, such as anger, anxiety, depression, and vulnerability.
- Openness to experience (O): Openness reflects the degree of intellectual curiosity, creativity, and preference for novelty and variety a person has.
The most important elements of personality variations can be represented, in any human language, by a large number of similar but distinct words (generally adjectives). When a large and diverse bank of these adjectives has been collected, a statistical approach is applied to identify groups or dimensions [13]. The most commonly used procedure for identifying these dimensions is factorial analysis [12].
Lewis R. Goldberg has carried out the most systematic and thorough research on the Big Five factors, employing a list of useful words (adjectives) to describe any person’s personality [12,13,14].
In [14], an analysis of an inventory of adjectives related to personality is performed. The structure of the English personality lexicon is investigated and used to describe the personalities of a large group of people (N = 899). The resulting list presented in this research provides the factor loadings of 435 personality adjectives for each of the five factors. Table 1 shows the correlation scores for a selection of adjectives.

Table 1.
Factor loadings of the adjectives selected in each of the five factors. Taken from [12,13].
2.2. Vocational Guidance: Orientation Model
Vocational Guidance is the process of assisting a person to choose, prepare for, and enter an occupation for which he or she shows aptitude. John L. Holland’s theory of vocational personalities and work environments transformed vocational assistance worldwide [10]. Holland’s most significant contribution, and his most renowned works, consists of his theory of vocational personalities and work environments [15]. The theory’s core idea is that most people resemble a combination of six personality types: Realistic (R), Investigative (I), Artistic (A), Social (S), Enterprising (E), and Conventional (C) (commonly abbreviated with the acronym RIASEC). Each type is characterized by a constellation of interests, preferred activities, beliefs, abilities, values, and characteristics [16]. The RIASEC personality types are defined by both preferences and aversions that influence the choice of the work environment, and the environments are defined by typical work activities and other demands placed on individuals. Each type is described according to a theoretical model called the orientation model [10,11]. Each personality type exhibits specific behavioral characteristics according to the evidence obtained in the research literature [11,17,18]. These are: (a) vocational preferences, (b) goals and values, (c) favorite activities, (d) aversions, (e) self-evaluation and (f) personal traits. For instance, Table 2 shows the main characteristics of the Realistic vocational group.
Table 2.
Characteristics defining the Realistic vocational group.
3. Related Work
3.1. Human Emotions with Behaviors
The system in [19] aims to equip the humanoid robot NAO with the capacity of performing expressive communicative gestures while telling a story. The body of the robot is, therefore, the main medium through which emotions are conveyed. Reference [20] proposes an emotional telepresence framework to transfer an emotional voice to robot gestures. This system can convey four of the basic emotions: happiness, sadness, anger, and fear. Reference [21] moreover investigates emotional postures for NAO, i.e., dynamic body postures to convey emotions are created. The results show that a robot like NAO can effectively express emotions with its body.
The study in [22] has developed a system that allows NAO to convey emotions (such as anger, disgust, sadness, fear, happiness, and surprise) through pre-programmed behaviors. By using a game called Mimic-Me, NAO mimics the human player’s facial expression through a combination of body gestures and audio cues. The results obtained show that NAO’s ability to understand some of the player’s feelings makes the HRI experience more engaging, and, as a result, the participant’s willingness to spend more time playing with NAO increases.
The work described in [23] explores the benefits of developing an application to teach simple emotional gestures to autistic children. In this research, they used the NAO robot to physically show nine emotional poses and conduct a simple guessing game with children. The results show that the robot can help children understand the emotions of others by demonstrating them using its posture and voice intonation.
3.2. Behavior Selection Systems
The systems developed to select the appropriate behavior to be executed by the robot are designed by coordinating among several sub-systems that allow an efficient interaction and promote high user satisfaction with regards to the task performed by the robot. The following are examples of several studies that have developed systems for the selection of behaviors during the performance of a specific task:
Reference [24] presents the use of the JAMES robot as a bartender. This project is focused on communication abilities with clients in a bar, experimenting in a real scenario and examining better ways of attending customers. The system can engage in, maintain, and close interactions with customers, take a user’s order using a spoken conversation, and serve their drinks.
In [25], a system for the management of multiple conversations is developed through a scenario consisting of social interaction, where a robot introduces multiple persons to each other. The developed system includes components for perception (e.g., accessing audio from the robot’s microphones), components for generating actions or behaviors (e.g., a greeting with hands and/or through speech), and a dialog and memory system for connecting these diverse components.
In [26], a system is developed to allow the synchronization of non-verbal gestures, while NAO gives a speech. These gestures enhance its communicative behavior, not just with verbal feedback but also with non-verbal gestures (e.g., hand and head movements).
3.3. Personality-Based Robot Behaviors
Endowing the robot with a personality allows it to interact efficiently with people. In particular, the need for efficient interaction has inspired a trend towards developing robotic systems capable of embodied communication, using verbal and non-verbal cues that convey intentions, emotions, and personality. Therefore, personality is essential to creating socially interactive robots. The following are examples of this type of research:
In [27], this work assists in the rehabilitation of patients after a cardiovascular accident. A robot monitors, assists, encourages, and socially interacts with post-stroke users engaged in rehabilitation exercises. This paper examines the effects of the robot’s personality on patients’ motivation. The study shows that users preferred working and interacting with a robot with a similar personality as theirs during the therapy: extroverted users preferred the robot that challenged them during the exercises. By contrast, introverted users preferred the robot that praised them.
The study in [28] uses an AIBO robot to interact with different people and looks at whether it can manifest a personality through behaviors. Verbal and non-verbal cues are used to model two (2) personality types for the AIBO: an introverted personality and an extroverted personality. The results show that participants could accurately recognize a robot’s personality based on its verbal language and non-verbal behaviors. The results also suggest that participants enjoyed interacting with a robot more when the robot’s personality was complementary to their personalities.
The study in [29] has developed a system that makes it possible to match a robot’s personality—expressed via its gaze behavior—to that of its users. The developed system is implemented on the MEKA robot platform. In this study, they focused on the extroversion dimension of the Big Five personality model to generate two models of robot’s gaze behavior: one to express an extroverted personality and the other to express an introverted personality. The results confirm that the robot’s gaze behavior can successfully express either an extroverted or an introverted personality. Additionally, the results demonstrate the positive effect of personality matching on a user’s motivation to engage in a repetitive task.
Taking into account the related studies presented above, this paper proposes the development of a system capable of intelligent management of the robot’s behaviors with effective interaction with a human. Here, the proposed scenario for the implementation of the intelligent system allows making a contribution in the field of vocational orientation processes, since no research was found about systems to determine the vocation of a person through the use of a humanoid robot specifically during an interview.
4. Implementation
The following sections describe the modules connected to the system for Intelligent Behaviors Selection (IBS), the technical interventions carried out to implement the proposed approach, and the components that are created to provide a bridge between the selection system and the robotic control software of the NAO platform. Figure 1 provides a schematic overview of the different modules and the communication paths between them. The gray boxes show modules running on the robot, and the white boxes show the components running on a connected computer. The chosen scenario (vocational guidance session) serves as suitable basic proof of the proposed approach. This scenario and its realization allow the intelligent selection of the behaviors.
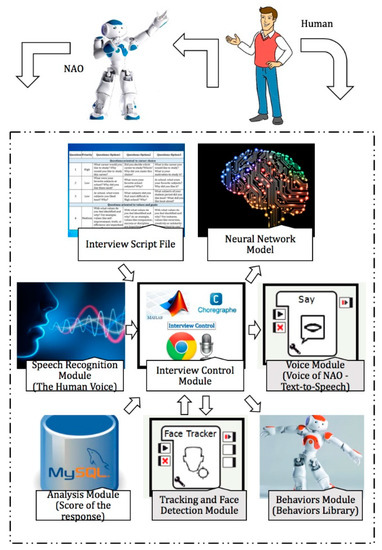
Figure 1.
Functional diagram: modules developed for this research.
4.1. Speech Recognition Module
This module is responsible for doing a voice-to-text translation. For this purpose, the Google API voice recognition (Google Dictation) is used. The latter is an Application Programming Interface (API) that allows developers to access Google’s voice recognition service for development and personal use. Taking advantage of these functions, an interface to connect the NAOqi system with the recognized voice messages is created.
4.2. Analysis Module
This module has two main functions:
(a) Calculate the Score of Answer, which is a numeric value that indicates whether the question is well answered. The score of the response will range from 0% to 100%.
(b) To provide a recommendation about a person’s vocational profile.
A matches search is performed between the words that make up the text string block from the speech recognition module and a set of words stored in a MySQL database. This database is made up of eight different tables: one for each question posed by NAO during the interview. Each table contains a set of words related to the question to which it belongs (Descriptor). For example, Table No. 1 in the database (corresponding to Question 1) consists of a list of occupations and careers related to each of the vocational profiles. Therefore, a Descriptor is defined as all those words that are contained in the response given by the user, which makes direct reference to what the robot is asking and allows the system to evaluate the vocational profile of the person. In addition, all tables store a common set of words that are used to evaluate the Interest and Cohesion of the answer given to the question.
Cohesion establishes the number of connectors that appear in the text. Connectors are words or expressions used to establish different types of relationships between words or sentences. By establishing the number of connectors in the text, we obtain an idea of the number of ideas that the person wants to convey in the answer provided. Interest is evaluated according to the number of matches found with words that indicate that the person has an inclination or predisposition towards a particular situation (e.g., liked, interest, interesting, or predilection). The analysis module performs the matches search for these three aspects. Therefore, the Score of the response is directly related to the number of Descriptors, Interest, and Cohesion in the text block.
Score of Answer: According to the number of matches in the Descriptor, Interest, and Cohesion, the score of the answer is calculated as shown in Table 3 and in Equations (1)–(3).
Table 3.
Score of the answer.
Vocational Profile Evaluation: It is highly unlikely that a person has only one vocational interest; in general, we all have a vocational profile or a combination of interests [14]. If the person says “My favorite subject in school was Math” in response to Question 2, they can be classified within an investigative vocation, but also within a conventional vocation, because in both cases, this subject is really interesting for both vocational groups.
The six vocational groups are organized according to the degree of interest they have shown in a specific behavioral characteristic. A behavioral characteristic refers to the information requested when the robot asks a question during the vocational guidance session. Continuing with the mentioned example, the interest in mathematics for every vocational group can be organized as follows: Investigative (6), Conventional (5), Enterprising (4), Artistic (3), Social (2), and Realistic (1). The number in parentheses indicates the order in which a characteristic appears within all vocational groups, with 1 being the least value (i.e., the vocation with the inferior characteristic) and 6 being the maximum (i.e., the vocation with the dominant characteristic).
The order in which a characteristic appears within all vocational groups is determined according to the work developed by [10,11]. When a table in the MySQL database is created on this basis, a percentage of the total rating of the question is assigned to each vocational group. These percentages have been assigned taking into account the order in which a characteristic appears within all vocational groups (see Table 4).
Table 4.
Percentage of the total rating of the question for each vocational group.
The answer to a question may include several Descriptors. Therefore, the rating associated with each vocational group can be determined from Equation (4), where n is the number of Descriptors in the answer, W(vc)i is a percentage of the total rating of the question for each vocational group (vc is the vocational group), Qquestion is the rating of the question in the general interview, and i represents each of the Descriptors. The summation of the results of each vocation corresponds to the rating of the question in the general interview.
4.3. Interview Script File
The vocational guidance session is divided into three parts (greeting protocols, the interview session, and ending protocols), and each of them has an associated script. Each script includes the texts to be reproduced by NAO. These scripts are stored in a MySQL database. The system will load these files and can access this information as needed.
4.3.1. Greeting Protocols
In this part, NAO greets and welcomes the person attending the vocational guidance session. The script for this session consists of three options that serve as a text for the voice of the robot (executed by the voice module). The system randomly chooses any of these three greetings, which allows the robot to not always to greet the same way when starting a session. Table 5 shows these greetings.
Table 5.
Script: greeting protocols.
4.3.2. Interview Session
Table 6 shows the interview script containing all the questions, categorized according to the framework of the vocational orientation session. The number of questions is limited to eight (8), considering the Orientation Model explained above.
Table 6.
The interview script.
Each of the eight questions is assigned a score within the general interview. The total rating is 100 points. The high-priority questions play a more important role in the final rating than the low-priority questions. The final rating of the interview makes it possible to determine the person’s vocational profile.
4.3.3. Ending Protocols
In this part, NAO emits a recommendation about a user’s vocation. For each of the vocational groups, the key letters (R, I, A, S, E, C) will be used. The ratings obtained for each vocational group make it possible to determine different sets that describe the person’s vocational profile. The vocation with the maximum rating is ranked first, and so on until the last position, which represents the vocation with the minimum rating. The sentences of text to be reproduced by the robot are organized according to the order of the key letters. Only the first three key letters are considered, so that the resulting text is not very extensive. The first sentence of the text represents the vocational group with the maximum rating, the second one symbolizes the vocational group with the second-highest rating, and the third one denotes the vocation with the lowest rating. Finally, a fourth phrase is used as a farewell text. Therefore, the text to be reproduced by the robot is composed of four different sentences. Table 7 shows the sentences associated with each vocation.
Table 7.
Script: ending protocols.
4.4. Face Detection Module and Voice Module
The robot can identify and track the faces of the people who are being interviewed using recognition tools and the Choregraphe face detection box. The robot could speak and pose the questions using the voice playback tool of Choregraphe.
4.5. Behavior Module
The different behaviors associated with the vocational guidance session are divided and prioritized as follows:
Level 1: Behaviors involving individual movements of the joints of the robot, head movements, changes in eye color, sounds, and the opening and closing of hands. Level 1 is divided into five categories, which group behaviors according to the body part of NAO used to execute the behavior. These are: (a) Facial Expressions, (b) Head Position, (c) Arms Position, (d) Hands Position, and (e) Sounds.
Level 2: The union of several behaviors in Level 1 generates personality traits in Level 2. NAO executes the different behaviors developed at Level 2 during the development of the vocational guidance session. These are divided into Question Behaviors (i.e., behaviors executed when the robot asks a question, greets someone, or says goodbye to the person) and Answer Behaviors (i.e., behaviors that are triggered depending on the answers to the questions posed).
4.5.1. Question Behaviors
Behaviors involving movements with the robot’s arms, randomly executed, are used to accompany the voice of the robot during a question, greeting, or farewell of the vocational guidance session and thus emphasize what it is saying.
4.5.2. Answer Behaviors
The set of 20 personality-descriptive adjectives (personality traits), selected in Table 1, are grouped according to five different emotions: anger, boredom, interest, surprise, and joy. Each emotion has four associated adjectives, shown in Table 8. The movement of each personality trait is pre-programmed, using Choregraphe in combination with the different Level 1 behaviors. Figure 2 shows some examples of the construction of this type of behavior in Choregraphe.
Table 8.
Behaviors at Level 2.
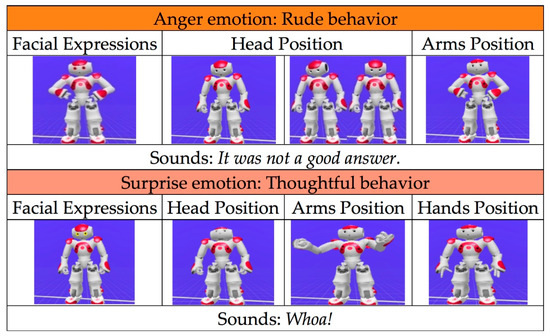
Figure 2.
Example of the construction of behaviors at Level 2.
Level 3: On Level 3, each of the behaviors associated with Level 2 has a variable that determines the frequency with which it appears during the interview. This variable is called Frequency Weight (FW). By grouping emotions in some percentage, Level 3 will be obtained, and therefore a personality is defined. Frequency weight values are determined, taking into account the Factor Loadings (FL) and correlation shown in Table 1. In addition, frequency weight values are established in a range of 0–100 for every Level 2 behavior. Figure 3 shows the proposed curve for determining the frequency weights.
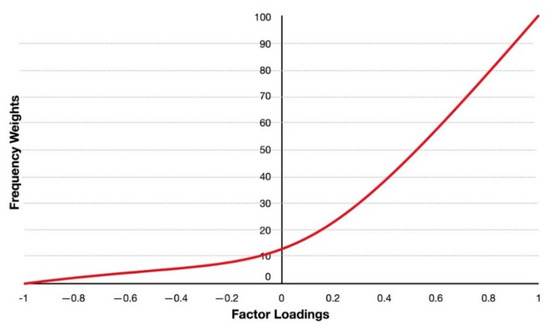
Figure 3.
Proposed curve for calculating the frequency weight (FW) in each behavior at Level 2.
A correlation of −1 (perfect negative correlation) is represented by frequency weight value 0. Non-correlation is determined at a value of 12.5, to reserve the interval of 0–12.5 to represent negative correlations. When the factor loadings value is close to zero, between −0.1 and +0.1, the relationship between the adjective and the factor is very weak. Therefore, there will be fewer negative than positive correlations in this interval, since negative correlations approach a correlation equal to zero, and positive correlations move away from this value. The frequency weight values will increase linearly for positive correlations. Finally, a frequency weight value of 100 represents a correlation of +1 (perfect positive correlation). Figure 4 shows the curve obtained for Factor I (Extroversion) according to the graph shown in Figure 3.
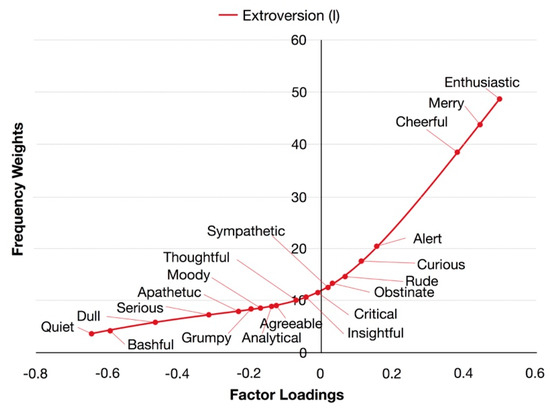
Figure 4.
Frequency Weights vs. Factor Loadings graphs for Factor I.
Figure 5, Figure 6, Figure 7, Figure 8 and Figure 9 present the different personalities obtained according to the calculations made.
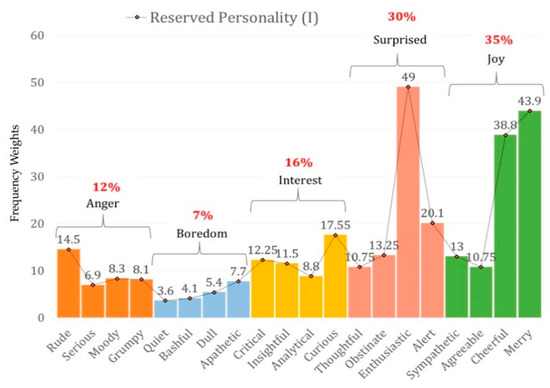
Figure 5.
Reserved Personality (Factor I): behaviors at Level 3.
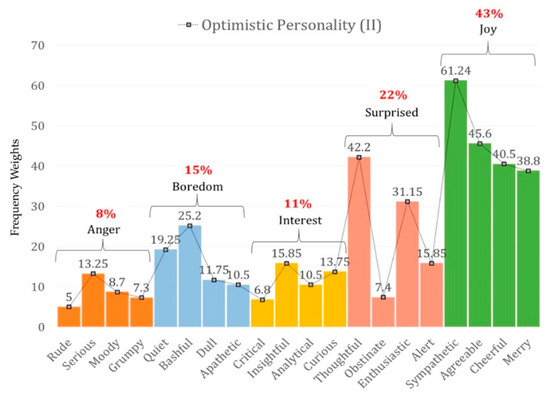
Figure 6.
Optimistic Personality (Factor II): behaviors at Level 3.
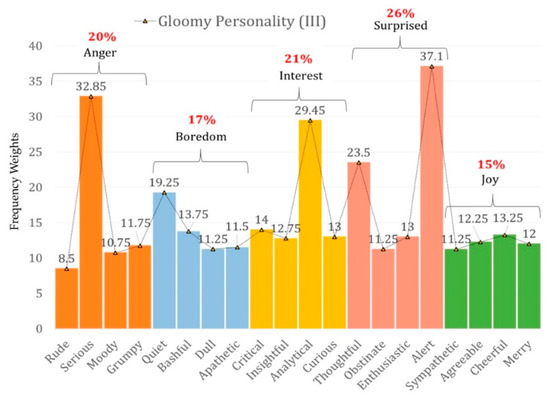
Figure 7.
Gloomy Personality (Factor III): behaviors at Level 3.
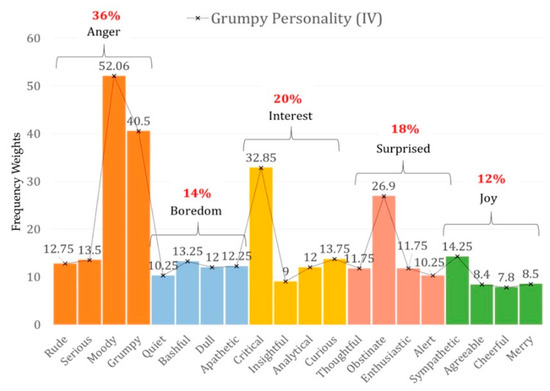
Figure 8.
Grumpy Personality (Factor IV): behaviors at Level 3.
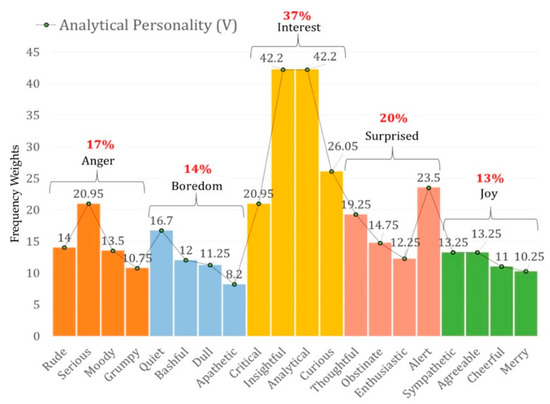
Figure 9.
Analytical Personality (Factor V): behaviors at Level 3.
The percentages in red represent the total frequencies by emotion. Each factor is assigned a name according to its characteristic traits. For example, the frequency weights obtained for Factor II make it possible to describe the following personality:
Optimistic Personality: “Someone who is sympathetic, agreeable, enthusiastic; never loses his composure; and seldom gets angry.”
4.6. Neural Network Model
The use of artificial neural networks (ANNs) for recognizing patterns makes it possible to classify the selected behaviors. In this way, the system is capable of choosing the most appropriate behavior to be executed by the robot during a vocational guidance session. In pattern recognition, a neural network is required to classify inputs into a set of target categories. The inputs of the neural network are listed as follows:
Answer rating (score): rating of the response issued by the answer to the question asked (input1: score).
Question rating: the rating of the question asked by the robot according to the interview script shown in Table 6 (input2: low priority question, medium priority question, or high priority question).
Emotion percentage: the percentage by emotion for each of the robot’s personalities (input3: %anger, input4: %boredom, input5: %interest, input6: %surprise, input7: %joy).
The outputs of the neural network are the set of behaviors of Level 2. Figure 10 represents the neural network model for recognizing the twenty (20) behaviors. The ANN selects the right behavior, according to the personality parameters set, when an answer is given by the interviewee. This answer has to be qualified with a score before it enters into the neural network.
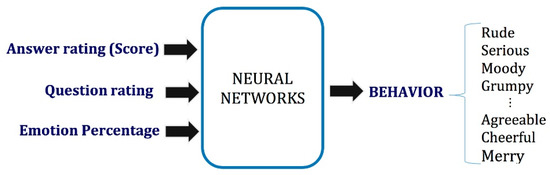
Figure 10.
Representation of the input and output data for the selection of twenty different behaviors.
Training Data: Table 9 shows how the five (5) emotions are organized according to the priority of the question and the score of the answer.
Table 9.
Emotions organized according to the priority of the question and the score of the answer.
To calculate the upper limits for each score by priority, as shown in Table 9, first, the proportion of each emotion within the complete set of emotions has to be determined, using Equation (5).
where pi is equal to the percentage by emotion for each personality; mi is the number of times the emotion is repeated, as shown in Table 9; and i represents each of the five emotions. Secondly, each priority has a number of emotions associated with it, so the total of existing Xi in that priority has to be calculated. For example, in the case of high priority, this value is determined as shown in Equation (6).
To find the ranges of each qualifier for the answer (score), continuing with the example for high priority, it can be calculated as shown in Equations (7) to (11).
where AR represents the Answer Rating for each answer qualifier, E is an excellent qualifier, G is a good qualifier, A is an acceptable qualifier, I is an insufficient qualifier, and D is a deficient qualifier for response. As an example, Table 10 shows the AR calculations for a reserved personality.
Table 10.
Answer Rating (AR) calculations: reserved personality (V).
The selection of the appropriate behavior that the robot must display is carried out based on the results obtained with Equations (5) to (11) for calculating the upper limits for each score by priority (AR). For example, for a low priority of the question and a Reserved Personality (Type I), the upper limits of the score are as shown in Figure 11.
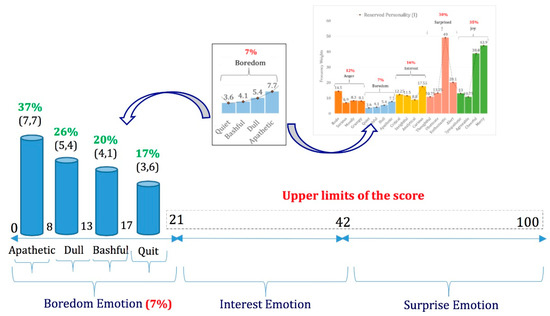
Figure 11.
Example of the calculation of each behavior’s limits within an emotion.
Any response score between 0 and 21 should trigger a behavior corresponding to the boredom emotion. Therefore, values closer to zero correspond to questions answered less satisfactorily than questions with a score further away from this value. The higher the score value, the lower the robot’s tendency to become bored, which is the case with values close to zero, for example. This behavior is presented in an inverse way for surprise and interest emotions. In this way, the five emotions can be divided into negative emotions (anger and boredom) and positive emotions (interest, surprise, and joy).
The frequency weight values of each behavior allow us to calculate the limits at which it can be selected, considering the score of the response. In the case of positive emotions, these weights are organized in ascending order, and for negative emotions, in descending order. The limits for the four behaviors that make up each emotion are calculated with Equations (12) to (15).
where %BEH is equal to the percentage of frequency weights for each behavior within an emotion and AREmotion is the sum of the upper limits for each score by priority within the same emotion.
Figure 11 shows the results for these calculations. The percentages in red represent the total frequencies by emotion, and the values in green represent the percentage of frequency weights for each behavior.
The training data contain, in matrix form, all the different values that can be given to the vectors Inputs and Targets, to represent various models of the elements to be recognized. To train the network, covering all possibilities, 303 different data are needed for each personality. Two vectors are generated in this case, with 1515 types of samples, each one with one behavior for seven inputs. Due to the number of data required, the dataset is generated to cover all the set of 20 personality-descriptive behaviors (personality traits) based on the range of possibilities that each input can take. In this sense, for the nine questions, the answer scores (input 1) are assigned using a uniformly distributed pseudo-random function in the range of 0% to 100%, taking into account all different question priorities (Input 2) and all emotion percentage sets for each personality (Inputs 3 to 7). A supervised learning strategy is run for training different neural networks with different numbers of neurons in the hidden layer, looking for the topology with the best performance. Here, a feed-forward back-propagation neural network with twenty neurons (20) in the hidden layer is selected. The metrics used are Cross-Entropy (to measure performance) and Percent Error (to evaluate the percentage of misclassification). The data for training stood at 70% (1061 samples); for validation, 15% (227 samples); and for testing, 15% (227 samples). The confusion matrix shows the percentages of correct and incorrect classifications. In this way, it can determine how well the classification of the data is performed. The percentage of overall classification is 91.2% (See Figure 12).
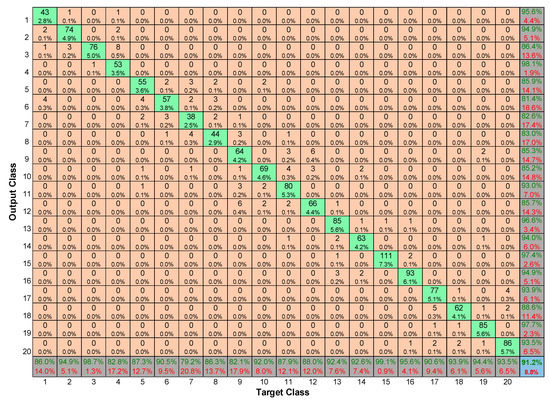
Figure 12.
Confusion matrix for the artificial neural network (ANN) model.
4.7. Interview Control Module
An interview control module is connected to the interview script file, containing all questions, greetings, and farewells, categorized within the framework of the vocational guidance session. This module executes the interview process, delivering the text of each question and determining the questions to be performed. In addition, it controls the behaviors module and sends the behavior to be executed by NAO, taking into account whether to activate the question or answer behaviors. For the calculation of the type of answer behavior to be executed by the robot, the module connection to the neural network is established, sending the necessary signals for the realization of this calculation. Figure 13 shows the different modules of the system that interact with the interview control module.
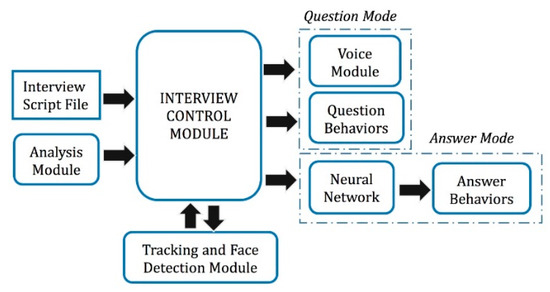
Figure 13.
Interview control module.
5. Analysis of the Experimental Results
A hypothesis about the matching of the robot’s personality, the answer given by the user, the question posed by NAO, and the answer behavior to be executed during the vocational guidance session is presented. Validation is performed through a series of experiments, where each of the questions asked by NAO during the interview corresponded to a one-system test.
(1) Case Study
The answers given by the person could be rated with the following qualifiers: Excellent (E), Good (G), Acceptable (A), Insufficient (I), and Deficient (D). These qualifiers vary, depending on the robot’s personality. With this in mind, three (3) case studies were created for analysis of the results:
- Case 1: The answers are rated as E, G, A, I, or D.
- Case 2: The answers are rated as A, I, or D.
- Case 3: The answers are rated as E or G.
(2) Response Variable
Every case is evaluated for different personality types. It is expected that the response of the intelligent system is the trend defined by the selected personality (i.e., the answer behavior).
(3) Number of Experiments
Calculating the number of interviews necessary to evaluate the performance of the system is based on Equation (16).
where n is the number of experiments, Za corresponds to the confidence level, p × q represents the population variance (p is the probability of success, and q is the probability of failure), and e is the desired accuracy (error accepted). It is run with a confidence level of 95%, which corresponds to a z = 1.96 sigma, or typical errors. The greater diversity of responses occurs when p = q = 0.50 (half the behaviors can be correctly recognized and the other half not), so in Equation (16), p × q is always equal to 0.25 (it is a constant). This value allows for maximizing the sample size.
Therefore, for each of the robot’s personalities, forty-eight (48) interviews of eight (8) questions each are conducted. The number of experiments (questions) is established as 384, with a confidence level of 95%, a proportion of the total population of 50%, and an accuracy of 5%. Table 11 shows the distribution of the interviews conducted, taking into account all the robot’s personalities. The answers given in the different interviews should be evaluated for all the robot’s personalities (e.g., Interview 3 should also be evaluated taking into account personality types II, III, IV, and V) to ensure that the score at the input of the neural network is the same, regardless of the personality type chosen. Therefore, the selection of the answer behavior by the neural network is performed through simulations.
Table 11.
Distribution of the interviews conducted, taking into account all the robot’s personalities.
(4) Metrics
The Minkowski distance is used to measure the similarity between the results, with zero being the best value for a comparison. The Minkowski distance of order p between two points X = (x1, x2… xn) and Y = (y1, y2… yn) ∈ Rn is given by Equation (17).
5.1. Results for Behavior Selection
To compare the results, it is necessary to calculate the percentage of each behavior by case study over the total number of experiments performed. The same is valid for the personality graphs. Taking into account the above, Figure 14, Figure 15, Figure 16, Figure 17 and Figure 18 show a comparative graph between the results obtained for the different case studies and for each personality curve.
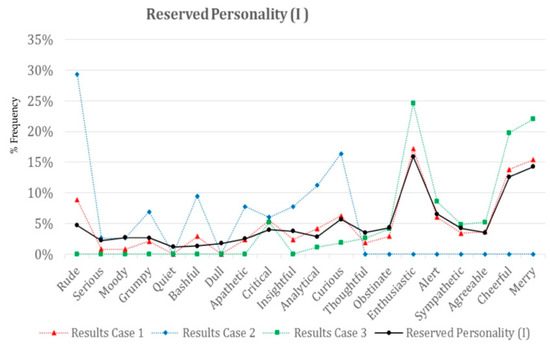
Figure 14.
Comparison of cases for a Reserved Personality.
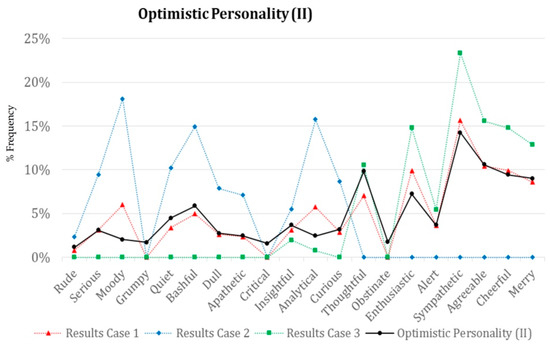
Figure 15.
Comparison of cases for an Optimistic Personality.
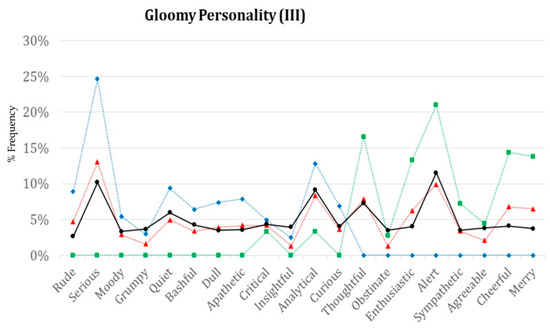
Figure 16.
Comparison of cases for a Gloomy Personality.
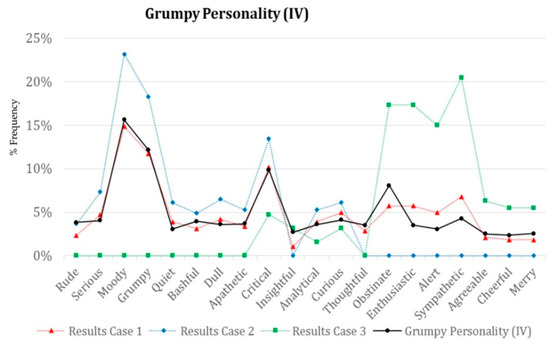
Figure 17.
Comparison of cases for a Grumpy Personality.
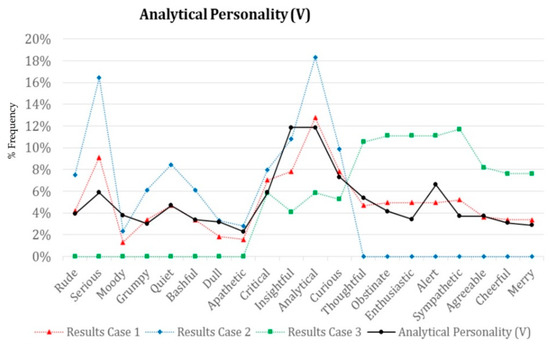
Figure 18.
Comparison of cases for an Analytical Personality.
Table 12 shows the Minkowski distance obtained for each personality type.
Table 12.
Minkowski distance.
Case 1: From the behaviors determined by the system, the curve obtained in this case is very similar to the personality established in each outcome. Consequently, the system allows the robot to choose the most appropriate way to behave and react, according to the established personality. The Minkowski distance is very close to zero; therefore, the robot’s personality and the results issued by the system are very similar.
Case 2: This case shows the system’s behavior when the answers given to questions were rated as acceptable, insufficient, or deficient. Accordingly, the answer behaviors are concentrated in a more significant proportion where they are produced by negative or acceptable responses and according to the established personality profile.
For instance, for personality type I (Reserved), a large proportion of the behaviors are concentrated in the interest emotion; that is, this emotion groups 41% of the answer behaviors. The opposite happens for personality type IV (Grumpy), where the majority of behaviors are grouped in the emotions anger and boredom. The behaviors concentrated in the interest emotion are only 25%. Therefore, personality type has an impact on the results and the way in which the system reacts to the same input.
The difference in amplitude between the curve for Case 2 and the personality curve occurs because of the reasons explained above, since the data are concentrated only in three (3) of the five (5) emotions. Hence, when calculating the percentages by behavior, this ends up being higher than the curve for Case 1, which does not have any concentration of the data. This is evident in the Minkowski distance for this case, as shown in Table 9, which is further away from zero than for Case 1.
Case 3: It shows behavior similar to the results obtained and the results explained for Case 2. The only difference is that the system behavior is evaluated when the answers given to questions were rated as good or excellent. Thus, the behaviors are grouped in positive emotions and not in negative emotions, as in Case 2. The interest emotion can occur in any rating assigned to the response, because the personality profile has an effect and is programmed to react to results in this way. Therefore, this emotion appears in both Case 2 and Case 3.
5.2. Results for Vocational Profile Evaluation
The calculations carried out to evaluate the person’s vocational profile are presented. For this, two (2) different vocational profiles are selected, which are obtained from information provided by the person in the interviews conducted by NAO. The key letters (R, I, A, S, E, and C) represent each of the vocational groups (see Table 13 and Figure 19).
Table 13.
Results for vocational profile evaluation.
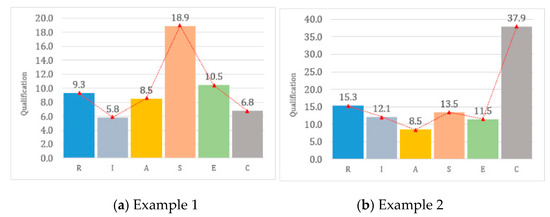
Figure 19.
Graphical representation of the results obtained for vocational profile evaluation: Examples 1 and 2.
Three (3) equal profiles (vocational profile: ASEIRC) are chosen, which, however, originated from three types of interviews whose ratings (success) are different. Figure 20 graphically displays the rating for each vocational group and the vocational profile obtained.
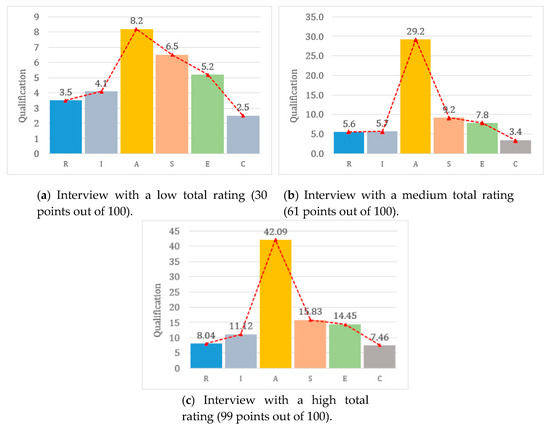
Figure 20.
Graphical representation of the results obtained for vocational profile evaluation: Vocational Profile: ASEIRC.
According to the interviews performed, it can be determined that regardless of the value of the answer’s score, the person’s vocational profile can be evaluated if at least one Descriptor is contained in the answer given by the person. Moreover, regardless of personality type, the results for these calculations are the same.
The number of Descriptors in the answer influences the rating given to each vocational group, since the more the information that is given in the answer, the higher the vocational profile (rating of the interview) that is obtained. This is evidenced in the results shown in Figure 20, where the same vocational profile is obtained in each of the interviews conducted, but the ratings assigned to each vocational group vary according to the score obtained in the general interview.
6. Conclusions
The proposed system correctly selects the behaviors according to priority and the score of the answer to each question posed by the robot. The case studies were based on situations in which the person’s responses were good or not. Hence, the match between the robot’s personality and the answers given by users during the interview is verified. Thanks to the selection of behaviors, the robot can choose the most appropriate way to behave during the vocational guidance session.
The results and analysis carried out during this proposal show how the intelligent selection of behaviors can be successfully achieved through the proposed approach, making the HRI friendlier.
This paper presents a computational system oriented to evaluate how the intelligent management of a set of behaviors allows a robot to behave most properly during a vocational guidance session. In this case, the suitability of the proposed management system is evaluated according to the matching between the robot’s personality and the variables presented in Section 5. This paper makes the following contributions with an HRI implementation of an intelligent management system of behaviors with effective interaction between a human and a robot:
- (1)
- An intelligent approach for managing a set of behaviors towards finding effective interaction between the robot and the person. The developed system allows through experimentation to give sufficient information to relate how the implemented computational intelligence complies or not with their target effectively and which parameters can intervene positively or negatively in processing. Evaluating the performance of the developed system can determine how the algorithms developed can help a robot to emulate an Intelligent Vocational Tutor effectively.
- (2)
- To improve the interaction between humans and machines in a particular environment. It allows us to take a step forward in this area, which has a marked tendency worldwide with this type of humanoid robot. The findings and results of this research are significantly useful for the following investigations. By developing an intelligent system capable of imitating a vocational tutor, it is expected to encourage the participation of more research by approaching the community with these technologies.
According to the results presented in this paper, the following future work can be considered:
- (1)
- The refinement of the behaviors developed to achieve an improvement in the human–robot interaction and therefore greater fluency in conversation.
- (2)
- The use of intelligent algorithms with the aim that the robot can make decisions appropriately from different stimuli of the environment that surrounds it and not only from previously programmed behaviors. Therefore, these behaviors will be more elaborate since they can be generated from computational intelligence techniques and from the interaction of the robot with the person and/or with its environment. In this sense, the learning algorithm of the machine can be improved, including one or more human vocational interviewers’ behaviors, asking the humans the reasons for their more significantly different reactions.
- (3)
- Experiments with different behavior imitation methods could be conducted, and subjects would be asked to rate how interesting/adequate/natural the interview with the robot was in each setting, to improve human–robot interaction.
Author Contributions
Formal analysis, S.G.; Investigation, S.G. and C.G.Q.M.; Methodology, S.G.; C.G.Q.M. and M.P.; Software, S.G. and C.G.Q.M.; Supervision, C.G.Q.M. and M.P.; Validation, S.G.; L.N.; C.G.Q.M. and M.P.; Writing—original draft, S.G.; L.N.; C.G.Q.M. and M.P.; Writing—review & editing, L.N.; C.G.Q.M. and M.P. All authors have read and agreed to the published version of the manuscript.
Funding
This research received no external funding.
Acknowledgments
This work was supported by Universidad del Norte, Barranquilla—Colombia.
Conflicts of Interest
The authors declare that there are no conflicts of interest regarding the publication of this paper.
References
- Hayashi, K.; Sakamoto, D. Humanoid robots as a passive-social medium-a field experiment at a train station. In Proceedings of the 2nd ACM/IEEE International Conference on Human-Robot Interaction (HRI), Arlington, VA, USA, 9–11 March 2007; pp. 137–144. [Google Scholar]
- Złotowski, J.; Weiss, A.; Tscheligi, M. Interaction scenarios for HRI in public space. In International Conference on Social Robotics; Springer: Berlin/Heidelberg, Germany, 2011; pp. 1–10. [Google Scholar]
- Finke, A.; Knoblauch, A.; Koesling, H.; Ritter, H. A hybrid brain interface for a humanoid robot assistant. In Proceedings of the Annual International Conference of the IEEE Engineering in Medicine and Biology Society, Boston, MA, USA, 30 August–3 September 2011; pp. 7421–7424. [Google Scholar]
- Shamsuddin, S.; Yussof, H.; Ismail, L.; Hanapiah, F.A.; Mohamed, S.; Piah, H.A.; Zahari, N.I. Initial response of autistic children in human-robot interaction therapy with humanoid robot NAO. In Proceedings of the IEEE 8th International Colloquium on Signal Processing and its Applications, Melaka, Malaysa, 23–25 March 2012; pp. 188–193. [Google Scholar]
- Robinson, W. Rescue-robot show-down. IEEE Spectr. 2014, 51, 52–55. [Google Scholar]
- Gouaillier, D.; Hugel, V.; Blazevic, P.; Kilner, C.; Monceaux, J.; Lafourcade, P.; Marnier, B.; Serre, J.; Maisonnier, B. Mechatronic design of NAO humanoid. In Proceedings of the IEEE International Conference on Robotics and Automation, Kobe, Japan, 12–17 May 2009; pp. 769–774. [Google Scholar]
- Quintero, M.; Goenaga, S.; Vásquez, J. Intelligent management of hierarchical behaviors using a nao robot as a vocational tutor. In Proceedings of the IEEE Colombian Conference on Robotics and Automation (CCRA), Bogotá, Colombia, 29–30 September 2016; pp. 1–6. [Google Scholar]
- Pot, E.; Monceaux, J.; Gelin, R.; Maisonnier, B.; Robotics, A. Choregraphe: A graphical tool for humanoid robot programming. In Proceedings of the 18th IEEE International Symposium on Robot and Human Interactive Communication, Toyama, Japan, 27 September–2 October 2009; pp. 46–51. [Google Scholar]
- Zhao, H.; Seibert, S.E. The big five personality dimensions and entrepreneurial status: A meta-analytical review. J. Appl. Psychol. 2006, 91, 259–271. [Google Scholar] [CrossRef]
- Gottfredson, G.D. John L. Holland (1919–2008). Am. Psychol. 2009, 64, 561. [Google Scholar] [CrossRef]
- Holland, J.L. Personality types. In Making Vocational Choices, 3th ed.; Psychological Assessment Resources: Odessa, FL, USA, 1997. [Google Scholar]
- Larsen, R.J. Traits and trait taxonomies. In Personality Psychology: Domains of Knowledge about Human Nature; McGraw-Hil: New York, NY, USA, 2005; pp. 62–93. [Google Scholar]
- Ashton, M.C.; Lee, K.; Goldberg, L.R. A hierarchical analysis of 1710 English personality-descriptive adjectives. J. Personal. Soc. Psychol. 2004, 87, 707–721. [Google Scholar] [CrossRef]
- Saucier, G.; Goldberg, L.R. Evidence for the Big Five in analyses of familiar English personality adjectives. Eur. J. Personal. 1996, 10, 61–77. [Google Scholar] [CrossRef]
- Nauta, M.M. The development, evolution, and status of Holland’s theory of vocational personalities: Reflections and future directions for counseling psychology. J. Couns. Psychol. 2010, 57, 11–22. [Google Scholar] [CrossRef]
- Einarsdóttir, S.; Rounds, J.; Gerstein, L.H. The structure of vocational interests in Iceland: Examining Holland’s and Gati’s RIASEC models. Eur. J. Psychol. Assess. 2002, 18, 85–95. [Google Scholar] [CrossRef]
- Armstrong, P.I.; Day, S.X.; McVay, J.P.; Rounds, J. Holland’s RIASEC model as an integrative framework for individual differences. J. Couns. Psychol. 2008, 55, 1–18. [Google Scholar] [CrossRef]
- Darcy, M.U.; Tracey, T.J.G. Circumplex structure of Holland’s RIASEC Interests across gender and time. J. Couns. Psychol. 2007, 54, 17–31. [Google Scholar] [CrossRef]
- Le, Q.A.; Hanoune, S.; Pelachaud, C. Design and implementation of an expressive gesture model for a humanoid robot. In Proceedings of the 11th IEEE-RAS International Conference on Humanoid Robot, Bled, Slovenia, 26–28 October 2011; pp. 134–140. [Google Scholar]
- Lim, A.; Ogata, T.; Okuno, H.G. Converting emotional voice to motion for robot telepresence. In Proceedings of the 11th IEEE-RAS International Conference on Humanoid Robots, Bled, Slovenia, 26–28 October 2011; 2011; pp. 472–479. [Google Scholar]
- Cohen, I.; Looije, R.; Neerincx, M. Child’s recognition of emotions in robot’s face and body. In Proceedings of the 6th international conference on Human-robot interaction, Lausanne, Switzerland, 6–9 March 2011; pp. 123–124. [Google Scholar]
- Shen, J.; Rudovic, O.; Cheng, S.; Pantic, M. Sentiment apprehension in human-robot interaction with NAO. In Proceedings of the International Conference on Affective Computing and Intelligent Interaction (ACII), Xian, China, 21–24 September 2015; pp. 867–872. [Google Scholar]
- Miskam, M.A.; Shamsuddin, S.; Yussof, H.; Ariffin, I.M.; Omar, A.R. A questionnaire-based survey: Therapist’s response on emotions gestures using humanoid robot for autism. In Proceedings of the International Symposium on Micro-Nano Mechatronics and Human Science (MHS), Nagoya, Japan, 23–25 November 2015; pp. 1–7. [Google Scholar]
- Keizer, S.; Foster, M.E.; Lemon, O.; Gaschler, A.; Giuliani, M. Training and evaluation of an MDP model for social multi-user human-robot interaction. In Proceedings of the 14th annual SIGdial meeting on discourse and dialogue, Metz, France, 22–24 August 2013. [Google Scholar]
- Klotz, D. Modeling Engagement in a Multi-Party Human-Robot Dialog. Master Thesis, Bielefeld University, Faculty of Technology, Bielefeld, Germany, 2010. [Google Scholar]
- Meena, R.; Jokinen, K.; Wilcock, G. Integration of gestures and speech in human-robot interaction. In Proceedings of the IEEE 3rd International Conference on Cognitive Infocommunications (CogInfoCom), Kosice, Slovakia, 2–5 December 2012; pp. 673–678. [Google Scholar]
- Tapus, A.; Tapus, C.; Mataric, M. User-Robot Personality Matching and Robot Behavior Adaptation for Post-Stroke Rehabilitation Therapy Maja Mataric. User-Robot Personality Matching and Robot Behavior Adaptation for Post-Stroke Rehabilitation Therapy. Intell. Serv. Robot. 2008, 1, 169–183. [Google Scholar] [CrossRef]
- Lee, K.M.; Peng, W.; Jin, S.; Yan, C. Can Robots Manifest Personality?: An Empirical Test of Personality Recognition, Social Responses, and Social Presence in Human–Robot Interaction. J. Commun. 2006, 56, 754–772. [Google Scholar] [CrossRef]
- Andrist, S.; Mutlu, B.; Tapus, A. Look like me: Matching robot personality via gaze to increase motivation. In Proceedings of the 33rd Annual ACM Conference on Human Factors in Computing Systems, Seoul, Korea, 18–23 April 2015; pp. 3603–3612. [Google Scholar]
© 2020 by the authors. Licensee MDPI, Basel, Switzerland. This article is an open access article distributed under the terms and conditions of the Creative Commons Attribution (CC BY) license (http://creativecommons.org/licenses/by/4.0/).