Abstract
Electrooculography is a technique for measuring the corneo-retinal standing potential of the human eye. The resulting signal is called the electrooculogram (EOG). The primary applications are in ophthalmological diagnosis and in recording eye movements to develop simple human–machine interfaces (HCI). The electronic circuits for EOG signal conditioning are well known in the field of electronic instrumentation; however, the specific characteristics of the EOG signal make a careful electronic design necessary. This work is devoted to presenting the most important issues related to the design of an EOG analog front-end (AFE). In this respect, it is essential to analyze the possible sources of noise, interference, and motion artifacts and how to minimize their effects. Considering these issues, the complete design of an AFE for EOG systems is reported in this work.
1. Introduction
The biopotentials generated by the human body have given rise to numerous studies and to some applications. The biopotentials recorded by the movement of the eyes are called an electrooculogram. The origin of this recording goes back to the year 1848 when the German physicist Emil du Bois-Reymond observed for the first time in history that the front of the eyeball (the cornea) is electrically positive with respect to the back (the retina), thus concluding that the eye could be modeled as a dipole. The eye, by performing different movements within its orbital cavity, generates a measurable potential by means of conveniently arranged electrodes. This is the basis of electrooculography upon which the subsequent studies are based. Figure 1 represents in a simplified way the foundation of the EOG by modeling the eye as an electrode-measurable dipole [1].
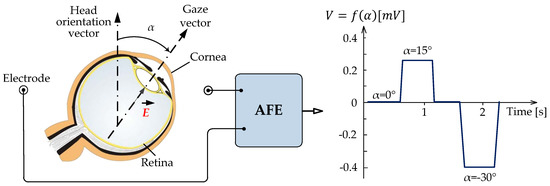
Figure 1.
Ideal representation of the foundation of the electrooculogram (EOG) when modeling the eye as a measurable dipole using surface electrodes. These electrodes make up the input to the Analog Front-End (AFE) to record the potential difference generated by eye movement.
The recording of this biopotential allows the detection of different factors such as ocular movement or light stimulation. Besides, this recording complements other systems of diagnosis and the detection of biopotentials such as electroencephalography (EEG) or electromyography (EMG). EOG recording is routinely applied diagnostically to investigate the human oculomotor system, for instance, in sleep studies [2,3], to prevent computer vision syndrome [4], or for Ataxia SCA-2 diagnosis [5,6]. This is since eye movements provide critical signs of neurological disorders [7]. Eye movement research is also of great interest in the control of human prosthesis [8], assessing driver drowsiness [9], and in the study of ergonomics [10]. Several studies have also been carried out on the development of robots controlled by eye movements [11,12,13].
The amplitude of the EOG signal varies with each person and environment; however, it is considered that it is in the range of 50–3500 µV. The amplitude of the signal obtained by placing two electrodes for registration is directly proportional to the angle of rotation of the eyes within the range of ±30°, as can be seen in Figure 1. Sensitivity is in the order of 20 µV per degree of movement [14,15]. The frequency ranges from continuous at about 50 Hz, although almost its entire spectrum, where most of the useful information resides, does not exceed 38 Hz. The fact that the EOG signal has a low bandwidth of interest is because the action potentials do not occur at extreme speed. Another interesting aspect to keep in mind is that muscle noise extends across the signal bandwidth almost steadily, which makes it very difficult to eliminate it in its entirety.
As exposed, the EOG signal is small in amplitude and consists of very low frequencies, so the presence of artifacts, interference, and noise in the biopotential recording is practically inevitable. They may occupy either some specific frequency band or the entire frequency band. Therefore, they are very difficult to remove without losing some signal information. The development of an Analog Front-End (AFE) for EOG recording is a challenging task and an active area of research; however, most work has not been developed or marketed as the BlueGain bioamplifier from Cambridge Research Systems [16] for a general purpose. The acquisition stage is usually oriented to a specific application, mainly for the control of human–computer interfaces, and oriented to individuals with amyotrophic lateral sclerosis [17,18]. Furthermore, most of these studies that can be found in the literature do not justify the design criteria followed in the proposed acquisition module. Step by step, this work exposes the design of an AFE with two differential analog input channels to record the horizontal and vertical movements of the eyes. The signals recorded by the two channels are amplified, filtered, digitized, and sent to the computer via Bluetooth. The alternatives and design criteria exposed in this work can be very useful for EOG-based equipment developers or researchers in this field.
The remainder of the article is structured as follows. Section 2 introduces two approaches to the acquisition of the EOG signal. Section 3 presents the external and internal sources of noise that affect the design of the EOG systems. In Section 4, the EOG AFE design is addressed for a general purpose. Finally, Section 5 provides conclusions.
2. Analog Front-End Approaches
Based on the resolution of the analog-to-digital converters (ADCs) used in the signal chain, there are two different approaches to the design of the AFE of an EOG system. The first one is to amplify the input signal significantly using low-noise amplifiers and a low-resolution ADC. The second approach would be to use a lower gain and a high-resolution ADC. In any case, the noise-free dynamic referred to as the input of the system is the same in both approaches.
2.1. AFE Based on Low-Resolution ADCs
Figure 2 shows a typical EOG AFE using a low-resolution ADC, typically 16-bit or less. It consists of two identical channels, the horizontal channel to acquire the biopotentials corresponding to the horizontal movements of the eyes and the vertical channel for the biopotentials relating to the vertical eye movements.

Figure 2.
Typical EOG signal chain based on low-resolution analog-to-digital converters (ADCs). (REF: Reference; IA: Instrumentation amplifier; HPF: High-pass filter; LPF: Low-pass filter.)
In Figure 2, the first block from the left is intended for user protection, which could include high-value resistors or any other kind of isolation circuitry. The lead selection circuitry determines various electrode combinations that are possible to use. In Figure 2, five electrodes are shown; however, other configurations are possible, depending on the application and the required accuracy [19].
At low frequencies, electrodes behave as a high-impedance signal source, and therefore, they would need a high-impedance circuit for measuring the EOG signals [7]. This circuit is an instrumentation amplifier (IA) that has a very high common mode rejection ratio (CMRR) (≥100 dB) and high input impedance (typically 1010 Ω).
Before the EOG signal is passed to the ADC, it must be amplified so that the entire dynamic range of the ADC is used. For example, considering a 1 mV EOG input signal and an ADC input range from 0 to +2.5 V, the total gain would be 2500. This gain is distributed between the IA and an additional gain amplifier. Gain is added to the IA in such a way that the electrode DC offset does not saturate the input buffers of the IA. The actual value of this gain depends on the operating voltage of the IA. At this point, it is necessary to remove the DC component due to changes in the electrode–skin impedance with electrode motion. Typically, a second-order active-high-pass filter (HPF) with a corner frequency of 0.05 Hz is added to each signal chain.
After the DC component is removed, the signal is amplified again to achieve the total gain. For this issue, the operational amplifiers (op-amps) must be low-noise () to avoid a noisy system. Besides, for battery-powered systems, these amplifiers must be low-power. The drawback of the low power and low noise requirements is an increase in the cost of the precision op-amps.
The amplification stage is followed by a very sharp low-pass antialiasing filter to avoid out-of-band noise, produced by successive approximation register (SAR) ADCs. Typically, a fourth-order Chebyshev low-pass filter is used. This block is followed by a multiplexer (MUX) embedded into the ADC. As can be seen in this AFE approach, there is a significant amount of analog signal processing that occurs before the signal is digitized.
2.2. AFE Based on High-Resolution ADCs
Figure 3 shows the same EOG AFE with a high-resolution ADC implemented, typically a 24-bit sigma-delta (converter. This kind of ADC is characterized by a very high-resolution based on oversampling and noise-shaping principles.
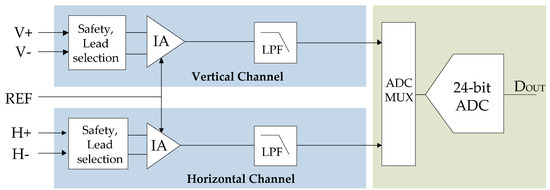
Figure 3.
EOG AFE based on high-resolution ADC (Sequential Sampling).
In this approach, the first stage of the AFE is an instrumentation amplifier with a low gain in the range of 5 to 20. Because amplification is so low, the resolution of the ADC must be high, usually 24 bits, to digitize the EOG signal in the right way. Because the filtering is not done in the analog domain, a lot of processing is generally needed to be done in the digital domain. The noise referred to the input of the system depends on the output rate of the ADC and the gain of the IA but is usually within the commercial EOG requirements [16].
In this approach, the high-pass filter, DC blocking filter, amplification stage, and active low-pass filter are removed. The ADC has an integrated MUX and a programmable gain amplifier (PGA) that eliminates the need for signal condition circuitry. In addition, to offer the advantage of higher resolution, ADCs significantly relax the antialiasing requirements before the ADC, because the input is highly oversampled. Antialiasing filters can be replaced by a simple, single-pole 150 Hz, RC filter. On the other hand, the DC high-pass filter is removed because it can be implemented digitally. Using digital filtering would be possible to implement an adaptative DC removal filter to better reject the baseline wandering.
For most EOG applications, a sequential sampling may be acceptable. However, for certain applications such as ataxic disorder diagnosis [20] where the out-of-phase between channels is the most important feature, it is necessary to use a dedicated ADC for each channel.
In conclusion, a low-resolution ADC approach requires more analog signal processing and limited flexibility. However, a high-resolution ADC approach is associated with a higher power and a higher area. All the filtering and extra gain is done in the digital domain, which increases the processing requirements and power. To manage high-resolution ADCs, manufacturers offer evaluation boards and development software that can help with the design process significantly.
3. Noise Sources
EOG signals may be corrupted by various kinds of noise, such as electrode contact noise, power line interferences, motion artifacts, muscle contraction (EMG), baseline drift, intrinsic noise generated by electronic devices, electrosurgical noise, and other less significant noise sources. A correct understanding of each kind of noise is very important because it determines the resolution and the dynamic range of the EOG system. In this article, the main kinds of noise and artifacts are briefly commented on together with common solutions to minimize them using hardware techniques. A more complete description can be found in references [7,15,21].
3.1. Electrode Contact Noise
Electrodes are the first element in the measurement channel and play an important role in the design of an AFE circuit. Biopotential electrodes must covert the flow of ionic current into an electronic current [22]. This transduction must be done as faithfully as possible, and in addition, it must not disturb the EOG signal. The important parameters are, then, impedance and noise. The impedance should be as low as possible to reduce the charging effect of the subsequent amplification stage and minimize the effect of common-mode interference appearing at the input [23].
Currently, two types of electrodes are used to register the EOG signal: traditional surface electrodes and those known as dry electrodes. The main difference between dry and wet electrodes is that wet ones require pre-positioning preparation and dry ones do not. However, these have a much higher price than wet ones. For this reason, the first are today used the most in the clinical environment and the second, in research [24,25].
By placing a surface electrode in contact with the skin through an electrolyte, a distribution of charges occurs at the electrode–electrolyte interface, which results in the appearance of a potential called half-cell potential. If the electrode moves with respect to the electrolyte, there will be an alteration in the distribution of the charge, which will cause a transient variation in the half-cell potential [25,26]. In the same way, at the electrolyte–skin interface, there will also be a distribution of charges and, therefore, an equilibrium potential that will vary if there is movement between the skin and the electrolyte. Generally, the surface electrodes have a quite powerful adhesive that limits the displacements. Even so, the potential of the interfaces may vary due to the presence of the stratum corneum. This type of interference called a motion artifact produces a fluctuation in the signal at very low frequencies (<1 Hz), not susceptible to being filtered due to the large amount of information that the EOG signal possesses at these frequencies. In a differential amplification, the EOG signal will be superimposed on a direct voltage since these contact potentials will hardly be the same in both inputs. This limits the gain of the first amplifier stage since this DC voltage could saturate the amplifier. Figure 4 shows an example of the motion artifact and the real part of the electrode impedance change at 16 Hz [27,28].
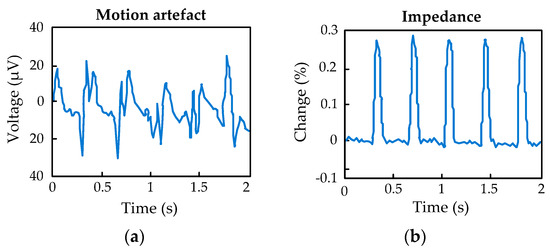
Figure 4.
(a) Measurement of the motion artifact; (b) Real part of the electrode impedance at 16 Hz.
3.2. Noise from Other Biopotentials
In the human body, the different biopotential signals are not isolated. Throughout the body, electrical signals are constantly generated from different physiological systems. The most influential are muscle activity—the EMG—and the EEG signal since both are produced close to the eyes, and the bandwidth of the EOG signal acts within the bandwidth of those signs. Cardiac activity and retinal potential have less influence, the first being in a higher frequency band and the second having a smaller amplitude.
Disturbances caused by muscular actions, such as chewing, the opening or closing of the eyes, frowning, etc., considerably affectthe EOG signal recording [24,25,26,27,28]. The most important muscular action is blinking since it is involuntary, and although it does not modify the electrostatic potential of the eye, it can move the electrodes, creating electrode–skin interference. This causes the appearance of high-frequency artifacts. In addition, blinking (Figure 5) can be confused with a saccadic movement since it has the same frequency and amplitude and involves a reflex vertical movement of the eyeball [19]. Blinks can be detected during computerized processing, using mathematical tools such as wavelet transforms [29].
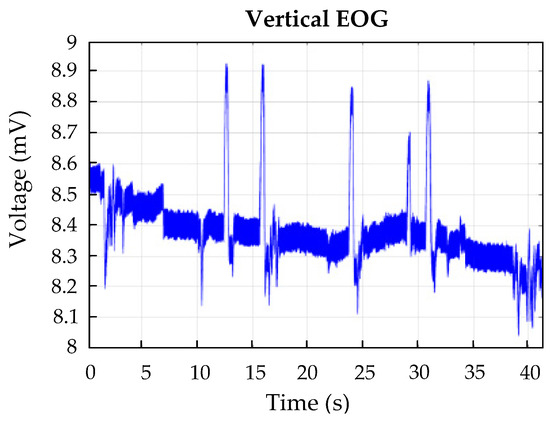
Figure 5.
Example of blinking’s effect on the vertical derivation.
3.3. Power Line Interferences
The main source of external interference is undoubtedly the electrical distribution network (50 Hz or 60 Hz) and its harmonics emitted by the conductors that run through the structure of a building. This leads to the appearance of electric and magnetic fields that interact with the measuring equipment and the user. Since these are low-frequency fields, they can be considered independent of each other since they will always be in the near field. Both will be minimized considering the design tips described in the following subsections.
3.3.1. Capacitive Interference
The capacitive coupling of the powerline is one of the main sources of interference present in the EOG registry. Figure 6 shows the human body connected to the measuring equipment by means of three electrodes including the capacitive interferences generated. The capacitive coupling with the body and the electrodes is the most influential aspect in the design of the biopotential amplifier circuit. This interference causes the appearance of displacement currents that flow to the ground through the electrode–skin interfaces and the patient’s body. This also causes common-mode and differential voltages to appear at the amplifier input, resulting in a new source of interference. The capacities associated with this type of coupling range from 100 pF to 1 nF, depending on the user’s position and the acquisition conditions. The capacities between the user and the powerline typically range from 0.2 pF to 20 pF. The capacitive coupling between the powerline and the AFE (C3) does not cause interference since the interfering current that circulates through it goes to the ground through the housing of the equipment, therefore not entering into it. This interference can be very high in case of using very long cables located near the powerline or the equipment to which they are connected [15,30].
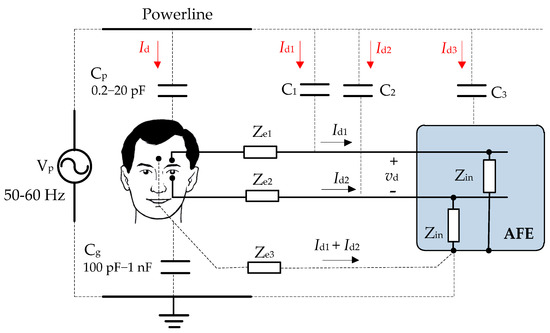
Figure 6.
Capacitive coupling between the electrical network and the user.
3.3.2. Inductive Interference
The electrical current from the powerline produces a magnetic flux that crosses the loops formed in the measurement system, inducing noise voltages at 50 Hz or 60 Hz. The most important ones are induced in the loop formed by the patient, the drivers, and the measuring equipment [27].
If the loop is stationary and the flux density is sinusoidal, varying with time but constant in the area of the loop, the root mean square (RMS) value of the noise voltage is given by, where is the frequency in rad/s, is the effective value of the flux density, is the area of the loop, and is the angle that indicates the orientation of the measurement loop with respect to the magnetic field (see Figure 7a). The inductive voltage is always proportional to the frequency (in the capacitance it is only at low frequency) and now is independent of the input impedance of the measurement circuit (in the capacitance increase with this impedance). A very effective solution to reduce the induced noise voltage due to magnetic interferences is twisting the wires of the electrodes as shown in Figure 7b [31,32,33].
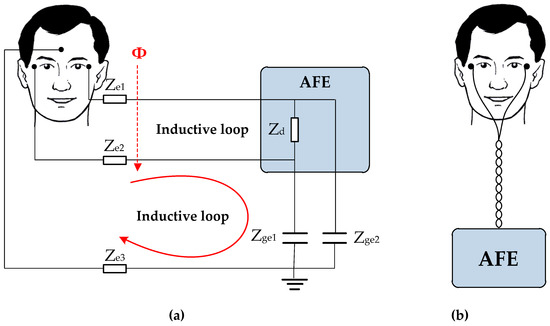
Figure 7.
(a) Inductive loop present in the measurement system; (b) Reduction of magnetic interferences by twisting the wires of the electrodes.
3.4. Intrinsic Noise
Intrinsic noise is present in almost all electronic components, such as resistors and semiconductor devices [34]. The root-mean-square (rms) noise associated with the resistor can be estimated by where R is the resistance, T is the temperature in kelvins, k is the Boltzmann’s constant, and B is the noise bandwidth in hertz. This expression illustrates the importance of using low resistance components when possible in low-noise circuits. For example, the noise in a 100 kΩ resistor at 25 °C (298 K) over the range of 0.1 Hz to 100 Hz is 0.4 µV. Large resistors are used as the input resistor of an op-amp gain circuit; their thermal noise will be amplified by the gain in the circuit. Thermal noise in resistors is often a problem in portable equipment, where resistors have been scaled up to get power consumption down.
On the other hand, noise for op-amps is usually specified with a graph of equivalent input noise versus frequency. As shown in Figure 8, these graphs usually show two distinct regions: lower frequencies where pink noise is the dominant effect, and higher frequencies where 1/f noise (white noise) is the dominant effect. The point in the frequency spectrum where 1/f noise and white noise are equal is referred to as the noise corner frequency, fce. In this way, the noise at the input of an op-amp can be estimated by the expressions: where is the voltage (current) white noise. An identical expression exists for the rms current noise.
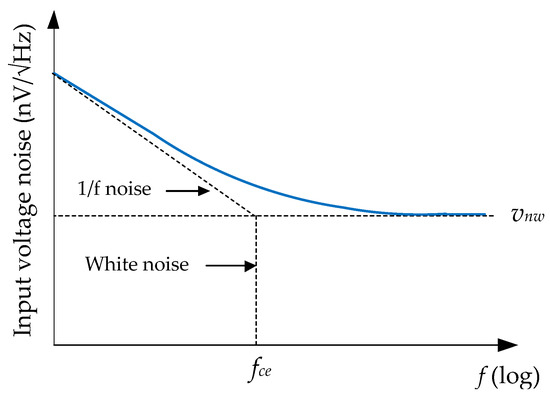
Figure 8.
Input voltage noise spectral density vs. frequency [35].
In summary, in low-noise design, the following must be considered:
- Select op-amps with low-noise floors as well as low corner frequencies.
- Keep the external resistances sufficiently small to make the current noise and thermal noise negligible compared to the voltage noise.
- Limit the noise-gain bandwidth to the strict minimum required.
3.5. Baseline Drift
The information relative to the ocular position within the orbit of the eye is given by the continuous component due to the linearity of the behavior of the dipole of the eye in the ±30° range. However, the EOG signal has a strong variability or displacement of its continuous component on the isoelectric baseline. It is known as offset or drift [36] and is produced by different factors. It also has a huge variability from one person to another [7]. The baseline drift is slower than the eye movement, and it manifests itself as a rising or declining slope in the EOG waveform, as can be seen in Figure 5.
The main reason for this effect is given by the ambient brightness and the variations in the ocular dipole potential produced by the polarization differences versus different light intensities of the two photoreceptors of the retina (cones and rods). The lengthy attachment of the adhesive electrodes to the skin also causes baseline drift on the recorded EOG signal. This causes errors in the determination of the ocular position [7]. This drift can lead to the saturation of the amplifiers due to its high gain. The level of drift can rise up to a range of 0.2 V in an interval of a minute [37].
Most interference is removed in the hardware device; however, wideband noises and the baseline drift are not easily suppressed in the hardware stage. It is more effective to remove them using mathematical tools. The EOG signal is non-stationary (its spectrum varies over time) in such a way that many of its temporal aspects cannot be adequately analyzed with the Fourier transform, or with the Fourier transform with window. For these types of signals, the Wavelet transform can concentrate better on transient and high-frequency phenomena [38], which provide a better understanding of the EOG signal [29].
4. Results
Having presented the different approaches in Section 2 and the main sources of noise in Section 3, we are ready to design a prototype of an AFE based on the low-resolution ADC approach.
The EOG signals are picked up by an AFE system consisting of horizontal and vertical channels as shown in Figure 9. Both AFE channels would have the same design, but, for simplicity, only one AFE is represented. The acquisition system employs Ag/AgCl surface electrodes for signal pickup, which includes electrolyte gel to reduce contact impedance.
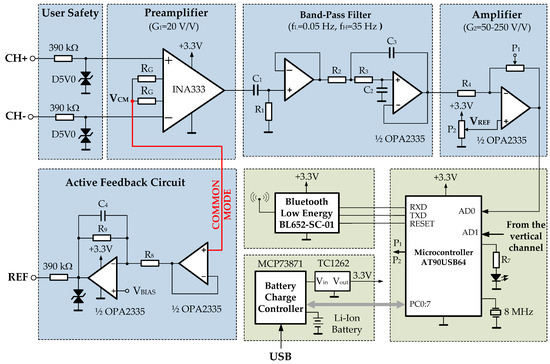
Figure 9.
The electrical diagram of each channel of the developed system.
4.1. User Safety
The safety of the user and the device is the main issue. The designer must consider all scenarios and meet regulations. The most important standard to consider is IEC-60601 [39,40] which limits the current through the electrodes to less than 10 μA rms. To ensure this limit, a 390 kΩ resistance is placed in the signal path. It is widely used as a low cost approach.
To protect the user against transient overvoltages, a transient suppressor diode (D5VO) between each electrode and ground is placed. These diodes operate suppressing all overvoltages above the breakdown voltage and shunt excess current. In medical applications, an isolated amplifier is usually placed between the IA and the filter stage. For example, ISO124 is a low-cost precision isolation amplifier for which no external components are required for operation.
4.2. Amplification
The AFE can readily be designed using the instrumentation amplifier (in-amp) as the main component. For example, considering a 1 mV EOG input signal and an ADC input range from 0 to +2.5 V, the total gain would be 2500. This gain is distributed between the in-amp (INA333) and an additional gain amplifier. The INA333 is a micro-power, zero-drift, and rail-to-rail in-amp. It is characterized by a very low offset voltage (typ. 10 µV) and high common-mode rejection (typically 115 dB). It operates with power supplies as low as 1.8 V (±0.9 V), and the quiescent current is only 50 μA—ideal for battery-operated systems, like this design.
Gain is added to the INA in such a way that the DC electrode offset does not saturate the INA. The INA333 is configured to a gain of G = 1 + 100 kΩ/RG = 10 v/v with an external 0.1% RG = 11.1 kΩ resistor. The last amplification stage simply amplifies the filtered signal to the desired output voltage range for the AFE (0–5 V). Its gain is set-up to by the digital potentiometer P1 (Microchip MCP4161), controlled via the microcontroller serial peripheral interface (SPI). Another digital potentiometer, P2, is used to adjust the reference voltage of each channel.
4.3. Filtering
In this field, it is common to use a high-pass filter to eliminate the continuous component and, therefore, its variability. It should be pointed out here that the variables measured in the human body (any biopotential) are rarely deterministic. Its magnitude varies with time, even when all possible variables are controlled. This means that the variability of the EOG reading depends on many factors that are difficult to determine: interferences caused by other biopotentials such as EEG and EMG, and those due to the positioning of the electrodes, skin–electrode contacts, head, and facial movements, lighting conditions, blinking, etc. In this case, to avoid this problem a high-pass filter with a cut-off frequency at 0.05 Hz and a relatively long time constant is used.
Different types, specifications, and responses of analog filters are used to limit the bandwidth of each stage. Before the biopotentials are amplified significantly, DC potentials from the electrode–skin interface must be filtered, to avoid the amplifier being saturated. In Figure 9, a high-pass filter formed by C1 and resistor R1 is set to 0.05 Hz. This filter could be distorting the biopotential being measured due to the artifacts of movements. In that case, mathematical tools such as the wavelet transform are used to identify and remove artifacts so they do not affect the behavior of the system [29]. The biggest problem in biopotential measurement is the interference from the powerline. Above all, RF interferences and muscle signal interference must be attenuated. For these aims, a second-order, Butterworth, 35 Hz low-pass filtering is used. Sometimes, it may be desirable to include a 50 Hz or 60 Hz notch filter to remove the power line interference, although it is possible the biopotential signal could be distorted.
4.4. Active Feedback Circuit
The common-mode interference is principally rejected by an instrumentation amplifier with a CMRR of a minimum of 100 dB. Further improvement is possible by using a circuit to actively cancel the interference, named in Figure 4 as an active feedback circuit (AFC). This circuit employs the same idea used in ECG systems. The common-mode signal is sensed from the first stage of the instrumentation amplifier, amplified, inverted, and fed back into the reference electrode. At this stage, the common-mode signal is reduced by the term (1 + 2 R9/RG) [7,15]. The AFC circuit along with a high CMRR of the amplifier permits very high-quality biopotential measurements.
4.5. Additional Features
The last gain stage is followed by a multiplexer block that feeds into a 10-bit ADC, both embedded in the microcontroller device (AT90USB1287). It is a low-power 8-bit microcontroller based on RISC architecture, 128 Kbytes of ISP Flash, and a USB controller.
The frequency range of the EOG signal is typically between 0 and 50 Hz. To fulfill the Nyquist criterion, the sampling frequency must be at least 100 samples per second. The ADC output is carried to the Bluetooth Low Energy device (BL652-SC-01 from Laird Connectivity), through the microcontroller USART (Universal Synchronous and Asynchronous serial Receiver and Transmitter). The sample rate at which each channel is scanned by the ADC is 9600 bps.
A 3.3 V power supply is obtained from 5 V associated with the USB connector by means of a low dropout regulator (Microchip TC1262). The circuitry is power supplied by a 3.7 V/2000 mAh Li-ion battery, which is recharged via a Microchip MCP73871 controller. The power consumption was estimated by dividing the battery capacity (mAh) by the average current consumed by the device. It was estimated that the average battery life was about ninety hours.
4.6. PCB Layout
A high-performance EOG system requires a careful PCB layout. The first aspect to consider is the separation of the analog and digital sections of the PCB. This keeps the noisy digital from the low-level analog circuits. Because at high frequencies, the return current takes the path of least inductance, a low-inductance ground is necessary. The ground solid plane provides a low inductance return for signal current. Discontinuities on the ground plane (slots or splits) produce large current loops that increase the inductance of the ground plane.
Related to power supply distribution, the decoupling capacitor must be used close to the VDD-GND pins. They provide a source of charge when the IC switches and offer low AC impedance between the power and ground rails. For these functions, multilayer ceramic chip capacitors (MLCC) are chosen due to their best relation of capacity to size.
Critical signal traces (clock, buses, and control signals) should be routed first and away from the edge of the PCB. These signals contain high amplitude harmonics. The clock traces should be kept as short as possible, and optimum placement should be provided by routing them first. To reduce cross-coupling effects when the analog and digital signals are mixed, the lines should be made to cross each other at 90-degree angles [15,21]. To reduce the inductive (capacitive) couplings, the long parallel traces on the same layer (on adjacent layers) should be minimized.
The EOG system is implemented on a 50 mm × 100 mm PCB. This prototype is a cost-effective solution (around USD 80, including the PCB and electrodes). Figure 10a shows a photo of the device with the leads. Figure 10b shows the waveforms obtained at the output of the vertical channel and horizontal channel, and Figure 10c shows the saccadic movements corresponding to a 0°–10°–20°–30°–40° gaze sequence. Figure 10c was obtained by limiting the bandwidth of the oscilloscope to filter the noise. The device has been tested by twenty-five people, obtaining a similar signal quality in all cases. As can be seen, the signals still require more computational processing to clean the signal.
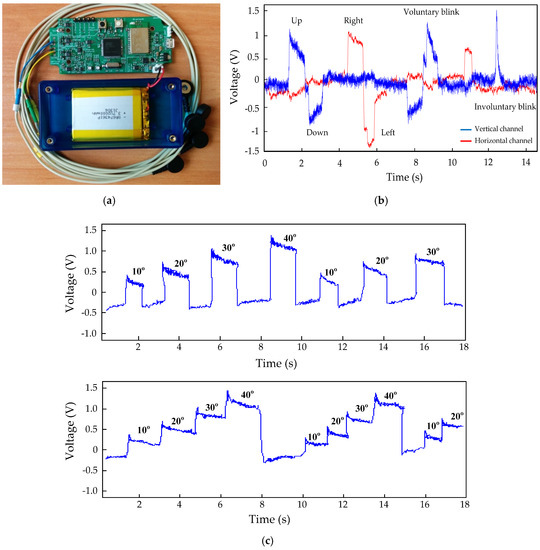
Figure 10.
(a) A photo of the EOG system; (b) Characteristic EOG potential changes due to eye movement; (c) Saccadic movements corresponding to a 0°–10°–20°–30°–40° gaze sequence.
Finally, Table 1 highlights the main differences between a reference EOG biosignal amplifier (BlueGain from Cambridge Research Systems) [16] and the proposed EOG device. As can be seen in Table 1, the figures for the resolution and sample rate of the commercial device are higher than those of the proposed EOG device. However, the resolution is limited by the noise; therefore, a resolution of nanovolts might be difficult to achieve. The sample rate of 1 kHz is enough for this type of signal, which fulfills the Nyquist criterium. On the other hand, the battery life and the cost are two important features that have been optimized by using a Bluetooth low energy module and low-cost components.

Table 1.
Comparison of characteristics between the BlueGain Amplifier and the proposed device.
5. Conclusions
This paper is focused on the characteristics of electrocardiographic signals and the different front-end approaches for EOG signal acquisition. The tradeoffs between different approaches and the effects on overall system design are discussed. EOG signals may be corrupted by various kinds of noise, and it must be filtered, which can distort the signal, requiring substantial computational postprocessing. All these issues are important design considerations for applications in real-time monitoring and were discussed in this work. To validate the study, a prototype of the EOG system was implemented in a 10 × 5 cm PCB. The PCB layout is a crucial issue for the functionality and electromagnetic compatibility performance of an EOG system.
For future work, signal processing provides a great deal of flexibility. This could be beneficial to using a high-resolution ADC, moving the signal processing to the digital domain. Therefore, in the future, it would be interesting to redesign the device using a high-resolution ADC. Once the EOG signal has been processed properly, this portable and low-cost device could be used for controlling devices such as virtual keyboards, powered wheelchairs, robots, and medical applications, etc. An important field of application is the development of assistive technology geared towards various disabled people through the development of human–computer interfaces. These kinds of people retain control of their eye movements, which can be translated into commands.
Author Contributions
Conceptualization, A.L. and F.F.; methodology, F.F.; software, J.R.V.; validation, A.L. and F.F.; formal analysis, O.P.; investigation, A.L.; resources, A.L. and F.F.; data curation, O.P.; writing—original draft preparation, A.L. and F.F.; writing—review and editing, F.F.; visualization, J.R.V.; supervision, O.P.; project administration, A.L.; funding acquisition, A.L. and F.F. All authors have read and agreed to the published version of the manuscript.
Funding
This research has been funded by the Spanish Ministry of Science and Innovation under project MINECO-TIN2017-84804-R and by the project grant FC-GRUPIN-IDI/2018/000226 from the Asturias Regional Government.
Conflicts of Interest
The authors declare no conflict of interest.
References
- Malmivuo, J.; Plonsey, R. Bioelectromagnetism, Principles and Applications of Bioelectric and Biomagnetic Fields; Oxford University Press: New York, NY, USA, 1995; Chapter 28. [Google Scholar]
- Knapp, R.B.; Lusted, H. Biological signal processing in virtual reality applications. In Proceedings of the 4th International Conference of the Virtual Reality and Persons with Disabilities, San Francisco, CA, USA, 22–25 June 1993; pp. 134–137. [Google Scholar]
- Liang, S.F.; Kuo, C.E.; Lee, Y.C.; Lin, W.C.; Liu, Y.C.; Chen, P.Y.; Cherng, F.Y.; Shaw, F.Z. Development of an EOG-based automatic sleep-monitoring eye mask. IEEE Trans. Instrum. Meas. 2015, 64, 2977–2985. [Google Scholar] [CrossRef]
- Pal, M.; Banerjee, A.; Datta, S.; Konar, A.; Tibarewala, D.N.; Janarthanan, R. Electrooculography based blink detection to prevent computer vision syndrome. In Proceedings of the International Conference on Electronics, Computing and Communication Technologies (CONECCT’14), Bangalore, India, 6–7 January 2014; pp. 1–6. [Google Scholar]
- García-Bermúdez, R.; Ruiz, F.R.; Peñalver, J.G.; Cansino, O.V.; Pérez, L.V.; Torres, C.; Becerra-García, R. Evaluation of Electro-oculography data for Ataxia SCA-2 classification. In Proceedings of the 10th International Conference on Intelligent Systems Design and Applications (ISDA’10), Cairo, Egypt, 29 November–1 December 2010; pp. 237–241. [Google Scholar]
- Becerra, R. Saccadic points classification using multilayer perceptron and random forest classifiers in EOG recordings of patients with ataxia SCA2. In Proceedings of the 12th International Work-Conference on Artificial Neural Networks (IWANN), Puerto de la Cruz, Tenerife, Spain, 12–14 June 2013; pp. 115–123. [Google Scholar]
- U.S. National Library of Medicine. The Medline Plus Merrian-Webster Medical Dictionary. Available online: http://medlineplus.gov/ (accessed on 11 February 2020).
- uvinage, M.; Cubeta, J.; Castermans, T.; Petieau, M.; Hoellinger, T.; Cheron, G.; Dutoit, T. A quantitative comparison of the most sophisticated EOG-based eye movement recognition techniques. In Proceedings of the IEEE Symposium on Computational Intelligence, Cognitive Algorithms, Mind and Brain (CCMB’13), Yew-Soon Ong, Singapore, 16–19 April 2013; pp. 44–52. [Google Scholar]
- Ebrahim, P.; Stolzmann, W.; Yang, B. Eye movement detection for assessing driver drowsiness by electrooculography. In Proceedings of the IEEE International Conference on Systems, Man, and Cybernetics, San Antonio, TX, USA, 13–16 October 2013; pp. 4142–4148. [Google Scholar]
- Schleicher, R.; Galley, N.; Briest, S.; Galley, L. Blinks and saccades as indicators of fatigue in sleepiness warnings: Looking tired? Ergonomics 2008, 51, 982–1010. [Google Scholar] [CrossRef] [PubMed]
- Nam, Y.; Koo, B.; Cichocki, A.; Choi, S. GOM-face: GKP, EOG, and EMG-based multimodal interface with application to humanoid robot control. IEEE Trans. Biomed. Eng. 2014, 61, 453–462. [Google Scholar] [CrossRef] [PubMed]
- Ma, J.; Zhang, Y.; Cichocki, A.; Matsuno, F. A novel EOG/EEG hybrid human–machine interface adopting eye movements and ERPs: Application to robot control. IEEE Trans. Biomed. Eng. 2015, 62, 876–889. [Google Scholar] [CrossRef] [PubMed]
- Úbeda, A.; Iáñez, E.; Azorín, J.M. An integrated electrooculography and desktop input bimodal interface to support robotic arm control. IEEE Trans. Human-Mach. Syst. 2013, 43, 338–342. [Google Scholar] [CrossRef]
- Cohen, A. Biomedical Signal Processing; CRC Press: Boca Raton, FL, USA, 1986; Volume 1. [Google Scholar]
- Webster, J.G. Medical Instrumentation: Application and Design; John Wiley & Sons Inc.: Hoboken, NJ, USA, 2010. [Google Scholar]
- BlueGain Cambridge Research Systems. BlueGain EOG Biosignal Amplifier. Available online: http://www.crsltd.com/tools-for-vision-science/eye-tracking/bluegain-eog-biosignal-amplifier/ (accessed on 11 March 2020).
- Larson, A.; Herrera, J.; George, K.; Matthews, A. Electrooculography based electronic communication device for individuals with ALS. In Proceedings of the IEEE Sensors Applications Symposium (SAS), Glassboro, NJ, USA, 13–15 March 2017; pp. 4142–4148. [Google Scholar]
- Heo, J.; Yoon, H.; Suk, K. A novel wearable forehead EOG measurement system for human computer interfaces. Sensors 2017, 17, 1485. [Google Scholar] [CrossRef] [PubMed]
- López, A.; Ferrero, F.J.; Valledor, M.; Campo, J.C.; Postolache, O. A study on electrode placement in EOG systems for medical applications. In Proceedings of the IEEE International Symposium on Medical Measurements and Applications (MeMeA), Benevento, Italy, 12–14 May 2016; pp. 29–33. [Google Scholar]
- López, A.; Ferrero, F.J.; Postolache, O. An Affordable Method for Evaluation of Ataxic Disorders Based on Electrooculography. Sensors 2019, 19, 3756. [Google Scholar] [CrossRef] [PubMed]
- Thakor, N.V. Biopotentials and electrophysiology measurement. In The Measurement, Instrumentation and Sensors, Handbook; Webster, J.G., Ed.; CRC Press: Boca Raton, FL, USA, 1999; Volume 74. [Google Scholar]
- Carim, H. Bioelectrodes. In Encyclopedia of Medical Devices and Instrumentation; Webster, J.G., Ed.; Wiley: New York, NY, USA, 1988; pp. 195–226. [Google Scholar]
- McAdams, E.T. Bioelectrodes. In Encyclopedia of Medical Devices and Instrumentation, 2nd ed.; John, G., Ed.; Wiley InterScience: New York, NY, USA, 2006; pp. 120–166. ISBN 0-471-26358-3. [Google Scholar]
- Srinivas, M.G.; Pandian, P.S. Dry electrodes for bio-potential measurement in wearable systems. In Proceedings of the 2nd IEEE International Conference on Recent Trends in Electronics, Information & Communication Technology (RTEICT), Bangalore, India, 19–20 May 2017; pp. 270–276. [Google Scholar]
- Yokus, M.A.; Jur, J.S. Fabric-based wearable dry electrodes for body surface biopotential recording. IEEE Trans. Biomed. Eng. 2016, 63, 423–430. [Google Scholar] [CrossRef] [PubMed]
- Fernández, M.; Pallás-Areny, R. Electrode Contact Noise in Surface Biopotential Measurements. In Proceedings of the 14th Annual International Conference of the IEEE Engineering in Medicine and Biology Society (EMBS), Paris, Francia, 29 October–1 November 1992; pp. 123–124. [Google Scholar]
- Ko, B.H.; Lee, T.; Choi, C.; Kim, Y.H.; Park, G.; Kang, K.; Bae, S.K.; Shin, K. Motion artifact reduction in electrocardiogram using adaptive filtering based on half-cell potential monitoring. In Proceedings of the Annual International Conference of the IEEE Engineering in Medicine and Biology Society (EMBS), San Diego, CA, USA, 28 August–1 September 2012; pp. 1–7. [Google Scholar]
- Simakov, A.B.; Webster, J. Motion artifact from electrodes and cables. Iran. J. Electron. Comp. Eng. 2010, 9, 139–143. [Google Scholar]
- Bulling, A.; Ward, J.A.; Gellersen, H.; Tröster, G. Eye movement analysis for activity recognition using electrooculography. IEEE Trans. Pattern Anal. Mach. Intell. 2011, 33, 741–753. [Google Scholar] [CrossRef]
- Pallás-Areny, R. Interference-rejection characteristics of biopotencial amplifiers: A comparative analysis. IEEE Trans. Biomed. Eng. 1988, 35, 953–959. [Google Scholar] [CrossRef] [PubMed]
- Rosell, J.; Colominas, P.; Riu, R.; Pallás-Areny, R.; Webster, J.G. Skin impedance from 1 Hz to 1 MHz. IEEE Trans. Biomed. Eng. 1988, 35, 649–651. [Google Scholar] [CrossRef] [PubMed]
- Frank, U.A.; Londer, R.T. The hospital electromagnetic environment. J. Assoc. Adv. Med. Inst. 1971, 5, 246–254. [Google Scholar]
- Hubta, J.C.; Webster, J.G. 60 Hz interference in electrocardiography. IEEE Trans. Biomed. Eng. 1973, 20, 91–101. [Google Scholar]
- Motchenbacher, C.D.; Connelly, J.A. Low-Noise Electronic System Design; John Wiley & Sons, Inc.: Hoboken, NJ, USA, 1993. [Google Scholar]
- Baker, B.B. Matching the noise performance of the operational amplifier to the ADC. Analog. Appl. J. Texas Instrum. 2006, 1, 5–9. [Google Scholar]
- Manabe, H.; Fukumoto, M.; Yagi, T. Automatic drift calibration for EOG-based gaze input interface. In Proceedings of the 35th Annual International Conference of the IEEE Engineering in Medicine and Biology Society (EMBS), Osaka, Japan, 3–7 July 2013; pp. 53–56. [Google Scholar]
- Estrany, B.; Fuster, P.; García, A.; Luo, Y. Human computer interface by EOG tracking. In Proceedings of the 1st International Conference on Pervasive Technologies Related to Assistive Environments (PETRA), Athens, Greece, 16–19 July 2008; pp. 1–9. [Google Scholar]
- Drongelen, W. Signal Processing for Neuroscientists; Academic Press/Elsevier: Amsterdam, The Netherlands, 2018; Chapter 15. [Google Scholar]
- Brown, M.; Marmor, M.; Zrenner, E.; Brigell, M.; Bach, M. ISCEV Standard for Clinical. Electro-Oculography (EOG). Doc. Ophthalmol. 2006, 113, 205–212. [Google Scholar] [CrossRef] [PubMed]
- International Organization for Standardization (ISO). Occupational Health and Safety Management Systems. Requirements with Guidance for Use. Available online: http://www.iso.org/iso/catalogue_detail.htm?csnumber=65529 (accessed on 15 March 2020).
© 2020 by the authors. Licensee MDPI, Basel, Switzerland. This article is an open access article distributed under the terms and conditions of the Creative Commons Attribution (CC BY) license (http://creativecommons.org/licenses/by/4.0/).