Abstract
The multi-robot system (MRS) and relevant control strategy are a potential and effective approach to assist people with weak motion capability for various forms of assisted living. However, the rising transfer, a frequent and strenuous behavior, and its human-robot interaction (HRI) process with MRS, especially mental state, has never been researched, although it directly determines the user experience and security. In this paper, Functional Near-InfraRed Spectroscopy (fNIRS), a brain imaging technique to perform a continuous measure of the mental state, is introduced to monitor the user’s mental fatigue when implementing a behavior transfer in two difficulty levels assisted by multiple welfare-robots. Twenty-five subjects performed self-rising transfer and multiple welfare robots-assisted rising transfer. After removing physiological noises, six features of oxygenated and deoxygenated hemoglobin (HbO and HbR, respectively) features, which included the mean, slope, variance, peak, skewness, and kurtosis, were calculated. To maximize the distinction of fNIRS between self-rising transfer and assisted-rising transfer (multiple welfare robots assisted rising transfer), the optimal statistical feature combination for linear discriminant analysis (LDA) classification was proposed. In addition, the classification accuracy is regarded as a standard to quantify the difference of mental states between two contrasting behaviors. By fitting the index, we established the mental fatigue model that grows exponentially as the workload increases. Finally, the mental fatigue model is applied to guide the nursing mode of caregivers and the control strategy of the MRS. Our findings disclose that the combinations containing mean and peak values significantly yielded higher classification accuracies for both HbO and HbR than the entire other combinations did, across all the subjects. They effectively quantify mental fatigue to provide an evaluation with a theoretical foundation for enhancing the user experience and optimizing the control strategy of MRS.
1. Introduction
Due to the growth of the aging population and disabled people with an incomplete motion capability, there exist great demands for auxiliary robots and a compliant control strategy under the condition of a relative lack of nursing personnel [1,2,3,4]. The multi-robot system (MRS) has been proposed as an effective and potential approach of ambient assisted living technologies to realize comprehensive nursing. However, because of the deficiency in the functionality, compliant control strategy, and good human-robot interaction (HRI) experience, the MRS has not yet been applied to nursing houses. To solve this issue, our laboratory established a smart house based on six heterogeneous welfare-robots, (including GRR: Gait Rehabilitation Robot, IWR: Intelligent Wheelchair Robot, WSR: Walking Support Robots, ESR: Excretion Assistant Robot, TR: Transportation Robot, and SB: Smart Bed), which integrates compliant assistant technologies, as shown in Figure 1 [5]. The transfer is a transition process of users from one state to another; for example, a rising transfer is a process from lying in bed to sitting in the chair. Some continuous behaviors include many transfer sub-tasks in a sequence, such as getting up to drink water, and then going to the toilet (from rising transfer to standing transfer, and then to excretion transfer). It is a frequent, repeated, continuous, and physically exhausting behavior. It has a huge impact on the physical strength and psychology of users. Physically and psychologically, it also causes secondary injuries such as fatigue, falls, and mental stress. To improve the transfer safety of the user, we propose that all the transfer behaviors be implemented by two robots [5]. Although the smart house could provide a better quality of life to different user groups, HRI in the transfer process has never been studied. The investigation of mental states in independent transfer and assisted transfer is a crucial and effective approach to quantify the workload and fatigue for the user, which has never been considered. It also contributes to guiding the control strategy of MRS to improve HRI security and experience, which has a high research value.

Figure 1.
The smart house based on multiple welfare-robots.
Monitoring people’s mental states is an effective approach to mitigate human error and enhance the safety of the HRI process [6]. This method of introducing physiological data into the HRI process, called “Physiological Computing”, could guide the system through taking the operator’s states into account [7]. Brain monitoring techniques have shown the capability to detect and characterize the operator’s mental state such as workload, fatigue, or mental stress [8,9]. Hence, building a system capable of doing continuous monitoring or detecting the operator’s state changes is a prerequisite to optimizing interaction security and comfort. Such kinds of closed-loop systems are the ultimate goals for improving the HRI process when operating robots.
In recent years, functional Near-InfraRed Spectroscopy (fNIRS) has, as a non-invasive brain functional imaging technology, received much attention. It has many advantages, such as security, portability, and ease of integration [9,10,11,12]. The fNIRS system monitors cerebral blood oxygen in a real-time and continuous way and has been applied in medical treatment, rehabilitation, exercise physiology, and other fields [13,14,15]. In closed-loop fNIRS-BCI systems, the distinct brain-signal patterns of the user are obtained by performing varying difficulty-level tasks such as motor imagery [16], mental arithmetic [17], music imagery [18], and others. The detection of the brain blood oxygen signal is based on the absorption of near-infrared light (650–1000 nm wavelength range) by hemoglobin in the tissue, to obtain the change in optical density. Combined with the modified Beer-Lambert law, the concentration changes of oxygenated hemoglobin () and deoxygenated hemoglobin () are calculated [19,20,21,22]. The brain blood oxygen signal can easily be interfered by movement and respiration, experimental instruments, and the environmental magnetic field. Therefore, the least mean squares (LMS) adaptive algorithm, wavelet transform, and empirical mode decomposition (EMD) are applied to remove noises such as physiological, experimental, and physiological noises [23]. Finally, the different advanced signal-processing techniques and improved algorithms have been used in feature extraction and classification accuracy improvement, thereby enhancing the BCI performance [21,22,23,24]. The previous studies on cerebral blood oxygen are based on time-domain parameters, such as the mean, variance, slope, kurtosis, peak value and skewness, as features for classification [25,26,27,28,29,30]. However, these parameters and classification results are only used to distinguish specific behaviors, and cannot be directly used as a standard to judge the human mental state during transfer. Meanwhile, due to the different behaviors in previous studies, these different parameter combinations and classification results only have a reference significance and no decisive significance. Especially in the quantification of the fatigue degree of transfer, the investigation of the best classification parameters of self-rising transfer and assisted-rising transfer is required. It also provides the theoretical basis for the research of the transfer tasks with various difficulty levels.
In this study, we propose a novel approach for the quantitative estimation of differentiated mental fatigue. First, to maximize the distinction of mental states when employing two tasks with different difficulty levels, we determine the feature combination and linear discriminant analysis (LDA) classifier for the classification of fNIRS signals with the best accuracy. In addition, the classification accuracy, regarded as a standard, is applied to establish the mental fatigue model. It effectively describes the difference between the mental state of self-rising and assisted rising after the continuous transfer. Finally, mental fatigue is used as feedback to optimize the transfer method from the aspect of caregivers and the control strategy of the robot. This study provides a theoretical foundation for enhancing the user experience and optimizing the control strategy of MRS. We highlight the main contributions of this paper below:
- We investigate the optimal feature-combination selection for the best classification accuracies of oxygenated (HbO) and deoxygenated hemoglobin (HbR). This provides a sound theoretical basis for distinguishing mental fatigue when employing two difficulty-level tasks of MRS.
- We propose the mental fatigue model, regarding classification accuracy as an evaluation index, which comprehensively quantifies the mental fatigue between the mental states, such as workload, fatigue, and other mental factors. It could effectively guide the nursing mode of caregivers and optimize the “follow-up” control strategy of the multiple welfare-robots for the ultimate goal of a safe and comfortable transfer, which could also be applied in similar scenarios, such as standing transfer and excretion transfer.
2. Hardware and Overview
2.1. The Smart House Based on Multiple Welfare Robots
The overall system is shown in Figure 1. The smart house integrated with multiple welfare-robots provides many forms of behavior assistance in daily life, such as rising transfer, standing transfer, excretion transfer, and so on. In this paper, we focus on the quantitative estimation of the mental fatigue of rising transfer. Two behaviors are defined as follows:
- Self-rising transfer: First, the subject moves his legs to the ground by himself. Then, he supports his trunk with his arms to complete the movement from the bed to the wheelchair robot. The whole process relies on the user’s arms to support his body for completing all the actions.
- Assisted-rising transfer: First, the subject sends out the rise instructions, and SB is automatically lifted to a comfortable angle. Meanwhile, the robot moves autonomously to the bedside based on path planning. Then, the nursing staff lifts the user gently to the sitting state and then moves the feet slowly to the ground. Finally, the nursing staff lifts and moves the user’s shoulders to a standing position. In the standing stage, the IWR installed with a laser can recognize the position and angle of both legs of the user, and then the PD controller is used for follow-up control. In this way, it can make the interaction process more flexible and labor-saving.
2.2. fNIRS Detection
A dynamic near-infrared brain optical imaging system (WOT-100: two wavelengths: 695 and 830 nm) is used to acquire brain signals at a sampling rate of 1.81 Hz, as shown in Figure 2. The continuous-wave fNIRS detects the and in the microvessels of the cortex according to the modified Beer- Lambert’s law:
where is the unit-less absorbance variation of a light emitter of wavelength , is the extinction coefficient t of HbX (HbO and HbR) in , is the unit-less differential path length factor, and is the distance (in millimeters) between the emitter and detector. To acquire brain signals resulting from mental arithmetic tasks, 16 detectors are positioned over the prefrontal cortex, in which each channel corresponds to a specific area of the prefrontal lobe. Multiple notch filters are applied to reduce physiological noises [31,32]. In the measurement process, the signal acquisition equipment is worn on the head, and the signal is transmitted to the PC through Wi-Fi. In the preliminary experiment, it is found that there is a significant difference in the topology diagram of the blood oxygen between self-rising transfer (Figure 2c) and assisted-rising transfer (Figure 2d). The blood oxygen content of the subject in the assisted-rising transfer (red area in Figure 2d) is larger than that in the self-rising transfer (red area in Figure 2c).
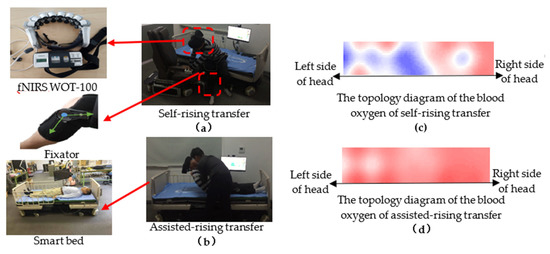
Figure 2.
Rising transfer based on the platform of multiple welfare-robots in smart house.
3. Experimental Method
3.1. The System Block Diagram
We propose a novel approach to quantitatively estimate the degree of mental fatigue. The flow chart of the system is shown in Figure 3. The self-rising transfer and assisted-rising transfer are required to obtain the optimal classification results. Then, the mental fatigue model for the individual subjects can be constructed and validated. Finally, we optimize the method of assisted-rising transfer based on the analysis of mental fatigue.
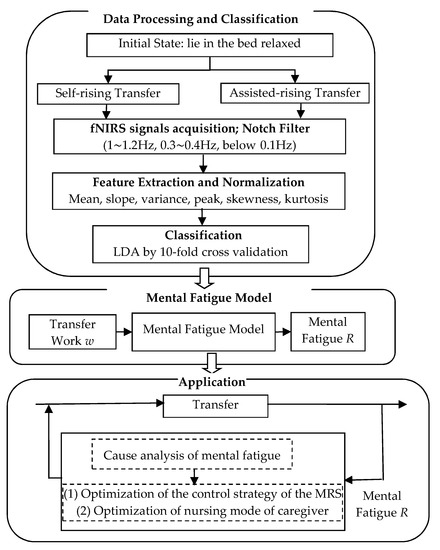
Figure 3.
The block diagram of the whole system.
3.2. Participants
Fifteen subjects (Group A: including 13 healthy subjects with a fixator to simulate a disabled lower limb, one subject with a plantar fracture, and one subject with weak motion mobility) and 10 subjects (Group B: including 10 patients with weak motion ability) participated in the experiments. The subjects of Group A were asked to lie relaxed in bed and then perform the self-rising transfer and assisted-rising transfer. Finally, the LDA (Linear Discriminant Analysis) classifier and fatigue models were established according to the block diagram in Figure 3. To verify the effectiveness and rationality, the proposed method was applied to test the subjects of Group B. In this paper, all the participants agreed to the experimental protocol and gave permission for the publication of their photographs for scientific purposes.
3.3. Procedure
The self-rising transfer and assisted-rising transfer were individually performed seven times in one group experiment, as shown in Figure 4 and Figure 5, respectively. There are seven groups of experiments for each subject. The transfer position of each experiment is the same. In the rising transfer experiment, first, 1 min was defined as a rest period to set up the baseline condition; this was followed by a 30 s self-rising transfer task period, and then followed in turn by a 10 s interval period for the next trial. The time interval was used to return to the original lying state. The experiment of assisted-rising transfer was implemented in the same sequence and time interval. To reduce the influence of fatigue accumulation on the results, enough rest time was reserved between the two experiments. This kind of continuous behavior transfer without rest will seriously affect the physical workload, fatigue, and mental fatigue of different user groups. It can be used as a reference for continuous action that integrates multi sub-tasks, such as rising-standing-walk rehabilitation training-drinking-sitting, etc. Some behaviors would consume more physical strength than simple behavior due to the complexity and particularity of their conditions, especially for people with mobility difficulties. Therefore, in this paper, we investigated experiments between the two tasks with different difficulty levels.
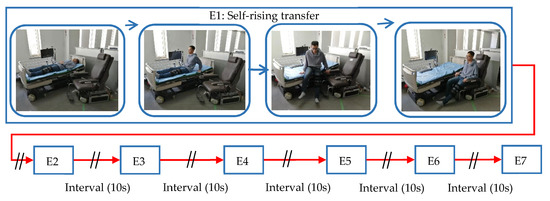
Figure 4.
Experiments conducted: a total of 7 group experiments were performed by subjects with 10 s intervals.
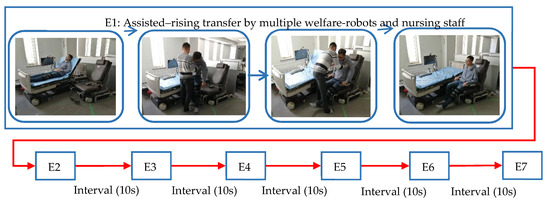
Figure 5.
Experiments conducted: a total of 7 group experiments were performed by subjects with 10 s intervals.
3.4. Signal Processing and Feature Extraction
and signals were obtained by Equation (1). Based on the notch filter with band-reject ranges in Figure 3, 0.1–0.3 Hz signals were acquired and analyzed [31,32]. The signal mean, signal slope, signal variance, signal peak, signal kurtosis, and signal skewness were extracted as classification features. The signal mean of and is calculated as given in the equation below:
where is the mean value, is the number of observations, and represents the and data. The slope is calculated as follows:
where slope is the signal slope, and ti is the sample time. The variance is calculated as follows:
where is the variance, and is the mean value of . The skewness is computed as follows:
where is the skewness, is the expected value of , and is the standard deviation of . The kurtosis is computed as follows:
The signal peak is obtained by the Matlab max function. All the feature values are scaled based on the Min-max normalization between 0 and 1, as shown in Equation (7):
where denotes the original feature values, denotes the rescaled feature values between 0 and 1, xmax is the maximum value, and xmin is the minimum value.
3.5. Classification
The method utilized in the present study to classify all 2- and 3-feature possible combinations of features extracted from the and signals is classified using LDA. The LDA algorithm is used to find an allocated vector in the specified feature dimensions such that the desired target classes can be divided into distinct groups that maintain an effective variance. LDA solves an optimal discrimination projection matrix Wopt by Equation (8):
where Sb, Sw, and St are the scatter matrixes:
where Sb is between-class scatter matrixes; Sw is the within-class scatter; and St = Sb + Sw is the total scatter matrix. μi is the mean feature vector of class i, and ni is the number of samples in class i. J is the total number of the samples in the whole set. xi is the feature vector of a sample, and μki is the vector of the class that xi belongs to. Data is processed to obtain six dimensions in a feature vector. Each subject performed 7 group experiments (14 transfers of each of two conditions, 588 samples). The classifier was trained with samples generated from 5 group experiments (35 transfers of each of the conditions, 420 samples) and tested with samples from the last 2 groups (14 transfer of each condition, 168 samples). Each classification performance was evaluated by a 10-fold cross-validation throughout the 10 runs. Finally, the LDA classifier was applied to test 10 patients of Group B.
3.6. Mental Fatigue Model
The mental fatigue model is defined as the difference between the mental state of self-rising and assisted rising after the continuous transfer. By fitting the classification result, the mental fatigue model and parameters are obtained based on the least square method, as shown in Equation (11). It represents the relationship between the number of the transfer behavior (t) and mental fatigue (R), as shown in Figure 6.
where and are the individual parameters based on the physiological condition of the subject. The optimal classification result R(t) of the statistical feature combination is applied to evaluate the fatigue degree. Assuming that at an initial time t0, the mental fatigue for two contrasting behaviors is R(t0), then, after the continuous behavior time , the amount of the increased difference is:
where . By integrating , the discrimination degree R(t1), after the number of the transfer behavior () from its initial condition R(t0), can be estimated by Equation (13):
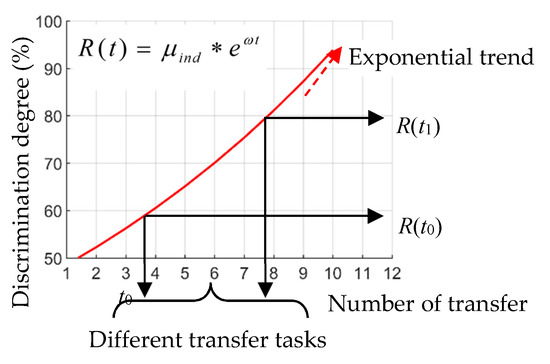
Figure 6.
The mental fatigue model.
4. Results
4.1. Classification and Accuracy
The classification accuracies obtained for all possible combinations of both features extracted using and are shown in Figure 7. Here, we list the classification accuracies of 10 subjects using the mean and peak values, as shown in Table 1, Table 2 and Table 3. The feature is numbered in Table 4. It is found that the classification result of 1-feature is lower than that of the parameter combination. The classification accuracy of combining the mean and the peak is higher than other feature combinations. The classification accuracies acquired using the 2-feature combination of the peak and mean values are 91.78% and 90.86% using and signals, respectively.
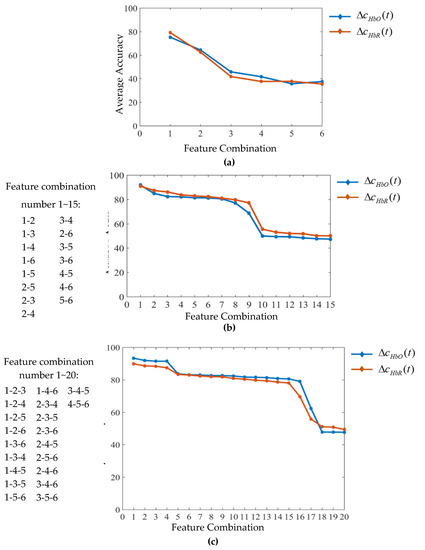
Figure 7.
The comparison among classification accuracies. (a) All 1-feature averaged across all subjects using and signals; (b) all 2-feature possible combinations averaged across all subjects using and signals; and (c) all 3-feature possible combinations averaged across all subjects using and signals.

Table 1.
The classification accuracies of the mean-peak combinations obtained from HbR signals and HbO signals.

Table 2.
The classification accuracies of the mean-peak feature combinations obtained from HbR signals.

Table 3.
The classification accuracies of the mean-peak feature combinations obtained from HbO signals for subjects.

Table 4.
Feature number.
The classification accuracies obtained using the 3-feature combinations are correspondingly higher in the combinations including the mean and peak values. There are the same characteristics in 4-feature combinations and 5-feature combinations, as shown in Table 5 and Table 6. These accuracies are higher compared with all other possible combinations across all subjects for both and signals. There is little difference in the classification accuracy of multiple feature combinations. To verify that the higher classification accuracies acquired using the peak and mean values are statistically significant, we apply the permutation test. The p-values obtained using the mean and peak values versus all other combinations are less than 0.05 for both and signals, which established that the performance of the mean and peak values combination is statistically significant. To prove the validity and generalization of the proposed method, 10 patients of Group B were tested. The best classification result was obtained when combining the mean and peak features, as shown in Table 7. The classification results are sensitive to these feature parameters (mean and peak). This proves that the self-rising transfer leads to a severe mental burden, which directly causes a great difference in mental states between self-rising transfer and assisted-rising transfer. The difference is not only reflected in the distributed feature parameters, but also more in “holistic” feature parameters.

Table 5.
The highest classification accuracy of the 4-feature combination.

Table 6.
The highest classification accuracy of the 5-feature combination.

Table 7.
The classification accuracies of the mean-peak combinations by Group B.
4.2. The Validation of Mental Fatigue Model
By fitting the data, we obtained the mental fatigue model (95% confidence) with the increase in the number of continuous transfers based on the least square method (5 subjects: a, b, c, d, and e, calibrated according to Table 8; SSE: the sum of squares due to error; R-square: Coefficient of determination; RMSE: Root mean squared error). Figure 8 illustrates the “exponential increase” trend of the classification accuracy of 5 subjects’ classification accuracy with the increase of the number of the continuous transfer (subjects a, b, and c with fixator, subject d with a plantar injury, and subject e with weak motion mobility). This represents that the self-rising transfer and assisted-rising transfer have an increasing influence on the user’s psychological state, and that there is a growing difference between the two behaviors. The autonomous behavior causes mental fatigue on the user. On the contrary, this MRS and its control strategy almost do not produce a large physical and psychological burden, which contributes in amplifying the differential features of various difficulty-level tasks. Therefore, we define difference degrees as mental fatigue. The healthy subjects a, b, and c imitate people with a weak motion capability; however, they have the physical strength and confidence to complete the transfer independently. Thus, there is a smaller difference than for subjects d and e between the two types of difficulty-level behaviors at the beginning stage [33,34,35,36]. Especially for subject e, the weak physical condition makes it extremely difficult for him to complete the autonomous behavior transfer. Meanwhile, continuous transfer further increases the workload of the subject e. In contrast, the whole process of assisted-rising transfer completely depends on the cooperation with the medical staff and robots. The repeated behavior transfer will produce an extremely obvious workload and mental load for all the subjects, thus amplifying the difference between two mental states. In this paper, an exponential-based model was established based on the least square method to evaluate the fatigue degree. The reasons are as follows:

Table 8.
The model parameter and goodness of fitness for 5 subjects.
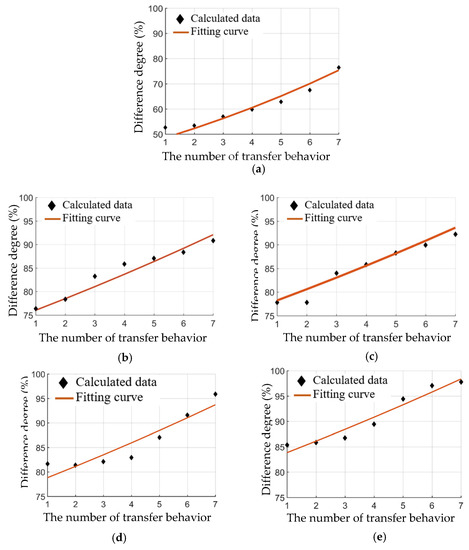
Figure 8.
The comparison of different degrees of mental states. (a) Subject 1; (b) subject 2; (c) subject 3; (d) subject 4; and (e) subject 5.
- The exponential model is an application-specific model to measure the fatigue degree of human-computer interaction, which has been successfully applied to evaluate human fatigue in rehabilitation training [36,37,38,39]. The ultimate purpose of the fatigue index is to evaluate the state of users during the transfer process, which is used in the adaptive planning of MRS according to the actual situation.
- The parameters of the model are very sensitive to the function of the relationship between task quantity and fatigue. By matching the two parameters of the model, the fatigue degree increases exponentially with the increase of the workload.
- The fitting function is verified by comprehensive experiments and error analysis. The estimated error of the model (mean and standard deviation) for all subjects is shown in Figure 9. The results show no significant difference (p > 0.05). The accuracy is high for less transfer time (2 and 4 times) tasks, where the error is lower than 5%. The performance of the proposed differentiated model slightly declined as the transfer time increased (6 and 8 times).
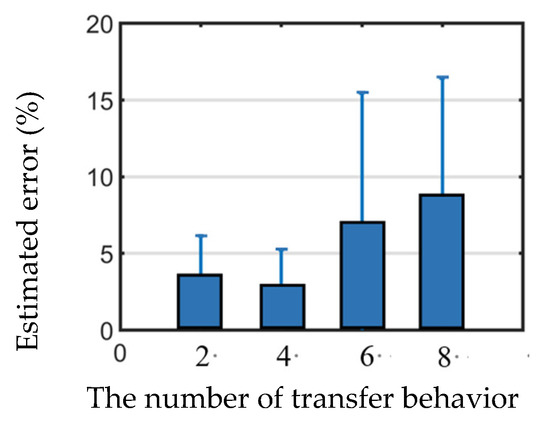 Figure 9. The mean and standard deviation of the error calculated.
Overall, the error of the model is within the acceptable effective range. This implies that the proposed method is reliable to estimate the discrimination degree, provided that the assumption that the adaptive auxiliary strategy for rising transfer for different users is maintained.
4.3. Optimization of the Assisted-Rising Transfer Based on the Analysis of Mental Fatigue
In the transfer process, the causes of mental fatigue include the following aspects:
- The weight of the body is fully supported by the user’s hands and feet during the transfer process, as shown in Figure 10a. This would cause huge physical consumption to the user. Meanwhile, due to the lack of motion balance and the weak physical condition, the user needs to concentrate to complete the transfer to prevent the fall and an unstable center of gravity (Figure 10b). This directly causes mental fatigue and stress to the user;
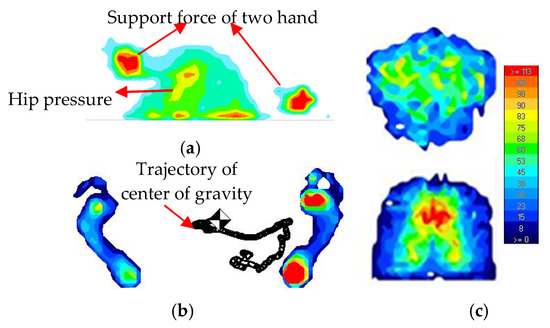 Figure 10. The pressure distribution of each part during the self-rising transfer. (a) Support pressure of rising; (b) plantar pressure and trajectory of center gravity; and (c) trunk pressure.
 - The continuous transfer directly increases the workload of the user. With the increase of transfer time, great physical consumption and mental stress cause the mental fatigue of a user with a weak motion capability;
- The instant impact force on the waist and buttocks during the seating process is too large, as shown in Figure 10c. It reduces the user’s safety and comfort in the transfer process, which affects the user’s mental pressure;
- Because the transfer way and real-time state of the user are different, the user would psychologically know that transfer behavior would consume physical strength and entail the risk of falling, which would cause psychological panic, boredom, and mental fatigue to the user.
We optimized the HRI process to reduce the user’s fatigue, as shown in Figure 11. Taking the rising-seating-excretion transfer as an example, the nursing staff carried most of the bodyweight of the user and reduced the pressure on the hands, feet, hips, and back. This also improved the stability of the transfer process. Meanwhile, the robot recognized the standing positing and angle of the user based on two lasers, and implemented a “follow-up” control. The user did not worry about the seating way and occurrence of dangerous behavior. The process of the user’s driving force was changed from an active one to a passive one, with the collaboration of the nursing staff. The mental fatigue is a parameter with a fuzzy boundary. Therefore, it could not be used as a precise real-time signal as feedback to establish a precise closed-loop system. Therefore, this paper only optimized the MRS and transfer mode by the parameter to reduce the mental fatigue of the HRI process.
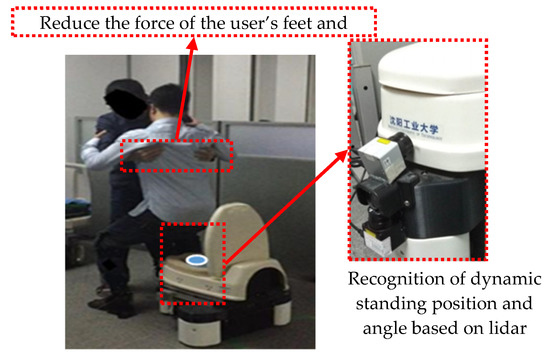
Figure 11.
Optimization of the transfer process from the aspect of the multiple welfare-robots system and nursing staff.
Aiming at measuring the robot-induced stress on humans during coexistence, a subjective evaluation (acceptance level) and task performance (decline rate of mental fatigue/transfer time/instantaneous pressure) were implemented. During the comprehensive experiment, the acceptance level was evaluated by a questionnaire result from 10 subjects with weak action ability, which verified the effectiveness and comfort of the proposed method. In the 1-to-6 scale, a lower score meant a better acceptance level. Table 9 shows the score change of the acceptance level from the questionnaire survey. The “○” represents an improvement in the acceptance level, and the “×” represents no significant change or a less acceptance level than the previous methods. From this survey, we can find that most subjects felt more comfortable and acceptable after an adjustment than before. Meanwhile, the mental fatigue, transfer time, and the instantaneous pressure show a significant downward trend, as shown in Table 10, Table 11 and Table 12. The optimization of the transfer method not only reduces the mental fatigue of the users but also improves the safety of transfer. The comprehensive experiments prove that the proposed method is effective in optimizing the HRI process in a subjective and in an objective aspect.

Table 9.
Changes of the acceptance level from the questionnaire.

Table 10.
Decline rate of mental fatigue.

Table 11.
Changes of the average transfer time.

Table 12.
Changes of the instantaneous pressure.
5. Discussion
To improve the accuracy discrimination of self-rising transfer versus assisted-rising transfer, various feature combinations were used to determine the best combination for an fNIRS-based HRI system. Then, and signals of two tasks were classified using LDA. Different from previous studies, the signal mean and signal slope were used as the best classification combination for distinguishing the right- and left-wrist motor [40]. This paper demonstrates that the feature combination of the peak and mean is the best among all possible combinations for both and signals. Similarly, the classification approach based on the combination of the signal mean and signal peak in statistical features is also an optimal result for distinguishing a mental arithmetic task and right-hand motor-imagery task [41,42]. This is due to the different objects of action generating signals with different characteristics. It directly leads to the difference in the best classification parameters. Furthermore, the peak and mean feature combination was the only one for which all subjects showed classification accuracies over 87%. When self-rising transfer and assisted-rising transfer were carried out with the increased times, the difference in the mental state between different behaviors increased, due to the excessive physical load, behavior constraints, and inadequate physical conditions. This phenomenon directly reflects the huge fluctuation of the HbO and HbR. The classification accuracy was significantly improved when real mobility-impaired patients employed behavior transfer [30,33]. To the best of our knowledge, this is the first study to investigate the highest classification performance based on statistical feature combinations applied to the feedback of a fatigue analysis in MRS. Compared with the traditional fNIRS experiment that analyzes the relationships between the feature value and corresponding behaviors separately, our proposed approach combined two significant features by comparative experiments for a comprehensive evaluation. Compared with the previous studies, the optimal parameter combination of different behaviors may be the same [40,41,42]. However, due to the different target behavior, this parameter combination only has a reference significance and no decisive significance for other behaviors. Thus, the combination of the optimal parameter cannot be directly applied to other behaviors. Meanwhile, the ultimate goal of the classification result is to quantify the differentiated mental state during transfer process. Then, the results are required to be calculated and fed back to the robot system. Therefore, the classification accuracy is a parameter of the process variable, not the final output of the system. Thus, the continuous transfer applied in this paper can effectively simulate the behavior of multi behavior integration in daily life. This evaluation approach can be transplanted to various difficulty level tasks for providing reference and guidance. Therefore, this paper regards the highest classification accuracy of the combination of the peak and mean for distinguishing two opposite behaviors, which provides a sound theoretical basis for follow-up research.
In view of the shortcoming in the research of HRI between MRS and different user groups, we propose a novel approach to quantify the impact of different levels of assistant strategy. The classification accuracy regarded as an evaluation standard can effectively quantify the mental fatigue between self-rising transfer and assisted-rising transfer. Especially with the increase in the workload, the model increases exponentially. This directly implies that the auxiliary cooperation based on multiple welfare-robots and control strategies can reduce the user’s workload, physical load, mental pressure, fatigue, etc. The quantification of mental fatigue is beneficial in the auxiliary mode by MRS. Generally, all users are given the same rest period in between the transfer tasks at a fixed interval. However, the responses and the user experience by each user from the same workload differ among individuals. This is because the development of mental fatigue is associated with gender, age, physical differences, and physical fitness [43]. Even for the same person, the physiological and psychological conditions vary from day to day. This could be affected by muscle injuries, nerve injury, pressure, and other factors [44]. Therefore, the smooth control strategy of MRS and the auxiliary mode should be planned according to the user’s physiological condition. Through the above method, the purpose of reducing mental fatigue is finally achieved.
In the present study, the proposed method is only applicable to the rising transfer task. This is because the impact of the multi-transfer task and physical recovery was ignored at the current research stage to reduce the complexity of the model. However, human tasks are mostly performed in a dynamic condition which involves continuous behavior in integrated multiple behavior transfers. Meanwhile, in a real scenario, transfer times, transfer complexity, and the special physical condition of the patient would produce a greater physical and psychological burden for different user groups. However, we do not need to consider all the conditions to calculate the precise division of mental fatigue. We investigated which assisted approach had the least impact on the user’s mental fatigue based on the value of different degrees. Then, we held that this auxiliary strategy of rising transfer was suitable for the user. Otherwise, we would re-optimize the MRS and control strategy based on the preferences of different users. Therefore, in the case of a simplification, continuous transfers are used to simulate the behavior of multi-behavior integration in daily life. The influence of each behavior transfer on mental fatigue should be identified before the proposed method is applied to the real-world environment.
In this paper, we used the multiple robot system and follow-up control strategy to effectively relieve the mental pressure caused by workload and lack of motion capability. Finally, the mental fatigue would be fed back to MRS and the control strategy for the purpose of reducing the fluctuation of mental state and stress. This gives effective feedback to the mental fatigue of the users when implementing autonomous behavior, auxiliary behavior, or derivative behavior. From the viewpoint of the smooth interaction process, several studies have shown that the mental information during HRI performs significant roles, such as behavior selection, which makes the robot more attractive and optimizes the approach of the cognitive information [45,46]. Our proposed approach provides a sound theoretical basis for the optimization of MRS and the improvement of user experience. However, in fNIRS-based BCI studies, 7–12 persons are usually considered enough for data acquisition [47,48]. However, using more subjects might be desirable to validate the findings. In future research, more subjects and various difficulty-level auxiliary strategies by MRS will be investigated based on our method.
6. Conclusions
In this study, we investigated the optimal feature combination (mean-peak) for the LDA classification of fNIRS of transfer tasks. Then, through a comprehensive error analysis, we established a comprehensive mental fatigue model based on the classification accuracy for autonomous behavior and auxiliary behavior with the increase of workload. The differentiated model for a comprehensive discriminant evaluation (based on the classification results) combined two significant features and fully amplified the mental difference between the various workload tasks. The proposed model directly reflects the difference in the mental fatigue of the user at that time. It is also strong evidence for judging and optimizing the current auxiliary approach based on MRS and the control strategy according to users with different physical conditions and motion capabilities. Our proposed method provides a sound theoretical basis for quantifying the estimation of mental states and guiding the control strategy of multiple robots for the ultimate purpose of a rising transfer with safety and comfort. It could also be applied to similar scenarios, for example for standing transfer, seating transfer, and excretion transfer.
Author Contributions
All authors have actively contributed to the elaboration of the manuscript, more particularly D.Z. and J.Y. have performed the integration of the human-robot interaction system in MRS, D.B. have focused on the data processing and statistical analysis, M.O.O. and Y.H. on performing the test scenario and collect the necessary data. All authors have read and agree to the published version of the manuscript.
Funding
This research was funded in part by “Nature Science Foundation of Liaoning province” under Grant 20162536, in part by “Liaoning Special Professor Foundation Subsidized Project” under Grant [2012]145, in part by “Science and Technology Bureau Project of Shenyang City” under Grant Z17-5-068.
Acknowledgments
Given thanks to all the entities that have financed part of this research, as well as, to all the users who have wanted to participate and contribute to the development of this work.
Conflicts of Interest
The authors declare no conflict of interest.
References
- Wilson, G.; Pereyda, C.; Raghunath, N.; Cruz, G.D.; Goel, S.; Nesaei, S.; Minor, B.; Edgecombe, M.S.; Taylor, M.E.; Cook, D.J. Robot-enabled support of daily activities in smart home environments. Cogn. Sys. Res. 2019, 54, 258–272. [Google Scholar] [CrossRef] [PubMed]
- Shishehgar, M.; Kerr, D.; Blake, J. A systematic review of research into how robotic technology can help older people. Smart Heath. 2018, 17, 1–18. [Google Scholar] [CrossRef]
- Dhiman, C.; Vishwakama, D.K. A review of state-of-the-art techniques for abnormal human activity recognition. Eng. Appl. Artif. Intel. 2019, 77, 21–45. [Google Scholar] [CrossRef]
- Danielsen, A.; Olofsen, H.; Bremdal, B.A. Increasing fall risk awareness using wearables: A fall risk awareness protocol. J. Biomed. Inform. 2016, 63, 184–194. [Google Scholar] [CrossRef] [PubMed]
- Li, Y.; Li, K.C.; Sun, B.Q.; Zhang, Q.H.; Wang, Y.N.; Yang, J.Y. Multi-robot-multi-task coordination framework based on the integration of intelligent agent and petri net. Acta Autom. Sin. 2019, 45, 1–21. [Google Scholar]
- Xu, L.; Wang, B.; Xu, G.; Wang, W.; Liu, Z.; Li, Z. Functional connectivity analysis using fNIRS in healthy subjects during prolonged simulated driving. Neurocomputing. Neurosci. Lett. 2017, 640, 21–28. [Google Scholar] [CrossRef]
- Fairclough, S.H. Fundamentals of physiological computing. Interact. Comput. 2008, 21, 133–145. [Google Scholar] [CrossRef]
- Zander, T.O.; Kothe, C.; Jatzev, S.; Gaertner, M. Enhancing human-computer interaction with input from active and passive brain-computer interfaces. In Brain-Computer Interfaces; Springer: Cham, Switzerland, 2010; pp. 181–199. [Google Scholar]
- Khan, M.J.; Hong, K.S. Passive BCI based on drowsiness detection: An fNIRS study. Biomed. Opt. Express. 2015, 6, 4063–4078. [Google Scholar] [CrossRef]
- Thongpang, S.; Richner, T.J.; Brodnick, S.K.; Schendel, A.; Kim, J.; Wison, J.A.; Hippensteel, J.; Higby, L.K.; Moran, D.; Ahmed, A.S. A micro-electrocorticography platform and deployment strategies for chronic BCI applications. Clin. EEG Neurosci. 2011, 42, 259–265. [Google Scholar] [CrossRef]
- Hong, K.S.; Nguyen, H.D. State-space models of impulse hemodynamic responses over motor somatosensory and visual cortices. Biomed. Opt. Express. 2014, 5, 1778–1798. [Google Scholar] [CrossRef][Green Version]
- Naseer, N.; Hong, M.J.; Hong, K.-S. Online binary decision decoding using functional near-infrared spectroscopy for the development of brain-computer interface. Exp. Brain Res. 2014, 232, 555–564. [Google Scholar] [CrossRef] [PubMed]
- Irani, F.; Platek, S.M.; Bunce, S.; Ruocco, A.C.; Chute, D. Functional near-infrared spectroscopy (fNIRS): An emerging neuroimaging technology with important applications for the study of brain disorders. Clin. Neuropsychol. 2007, 21, 9–37. [Google Scholar] [CrossRef] [PubMed]
- Ferrari, M.; Quaresima, V. A brief review on the history of human functional near-infrared spectroscopy (fNIRS) development and fields of application. NeuroImage 2012, 63, 921–935. [Google Scholar] [CrossRef] [PubMed]
- Hong, K.S.; Santosa, H. Decoding four different sound-categories in the auditory cortex using function near-infrared spectroscopy. Hear. Res. 2016, 333, 157–166. [Google Scholar] [CrossRef]
- Coyle, S.M.; Ward, T.E.; Markham, C.M. Brain-computer interface using a simplified functional near-infrared spectroscopy system. J. Neural Eng. 2007, 4, 219–226. [Google Scholar] [CrossRef]
- Bauernfeind, G.; Scherer, R.; Pfurtscheller, G.; Neuper, C. Single-trial classification of antagonistic oxyhemoglobin responses during mental arithmetic. Med. Biol. Eng. Comput. 2011, 49, 979–984. [Google Scholar] [CrossRef]
- Falk, T.H.; Guirgis, M.; Power, S.; Chau, T. Taking NIRS-BCIs outside the lab: Towards achieving robustness against environment noise. IEEE Trans. Neural Syst. Rehabil. Eng. 2011, 19, 136–146. [Google Scholar] [CrossRef]
- Villringer, A.; Planck, J.; Hock, C.; Schleinkofer, L.; Dirnagl, U. Near-infrared spectroscopy (NIRS): A new tool to study hemodynamic changes during activation of brain function in human adults. Neurosci. Lett. 1993, 154, 101–104. [Google Scholar] [CrossRef]
- Hoshi, Y.; Tamura, M. Near-infrared optical detection of sequential brain activation in the prefrontal cortex during mental tasks. NeuroImage. 1997, 5, 292–297. [Google Scholar] [CrossRef]
- Delpy, D.T.; Cope, M.; Zee, P.; Arridge, S.; Wray, S.; Wyat, J. Estimation of optical path length through tissue from direct time of flight measurement. Phys. Med. Biol. 1988, 33, 1433–1442. [Google Scholar] [CrossRef]
- Sassaroli, A.; Fantini, S. Comment on the modified Beer-lambert law for scattering media. Phys. Med. Biol. 2004, 49, 255–257. [Google Scholar] [CrossRef]
- Santosa, H.; Hong, M.J.; Hong, K.S. Lateralization of music processing with noises in the auditory cortex: An fNIRS study. Front. Behav. Neurosci. 2014, 8, 418. [Google Scholar] [CrossRef] [PubMed]
- Abibullaev, B.; An, J. Classification of frontal cortex hemodynamic responses during cognitive tasks using wavelet transforms and machine learning algorithms. Med. Eng. Phys. 2012, 34, 1394–1410. [Google Scholar] [CrossRef] [PubMed]
- Naseer, N.; Hong, K.S. Decoding answers to four-choice questions using functional near-infrared spectroscopy. J. Near Infrared Spectrosc. 2015, 23, 23–31. [Google Scholar] [CrossRef]
- Hong, K.S.; Naseer, N.; Kim, Y.H. Classification of prefrontal and motor cortex signals for three-class fNIRS-BCI. Neurosci. Lett. 2014, 587, 87–92. [Google Scholar] [CrossRef]
- Sperber, D.; Wilson, D. Relevance-Communication and Cognition; Oxford University Press: New York, NY, USA, 1995. [Google Scholar]
- Maren, A.J.; Harston, C.T.; Pap, R.M. Handbook of Neural Computing Applications; Academic Press: Gainesville, FL, USA, 2014. [Google Scholar]
- Reyes, L.M.D. Evaluation motion processing algorithms for use with fNIRS based from young children. Neurophotonics. 2018, 9, 1–26. [Google Scholar] [CrossRef]
- Pollonini, L. Optical properties and molar hemoglobin concentration of skeletal muscles measured in vivo with wearable near infrared spectroscopy. IEEE Sens. J. 2018, 18, 2326–2334. [Google Scholar] [CrossRef]
- Khan, R.A.; Naseer, N.; Qureshi, N.K.; Noori, F.M.; Nazeer, H.; Khan, M.U. fNIRS-based neurorobotic interface for gait rehabilitation. J. Neuroeng. Rehabil. 2018, 15, 1–17. [Google Scholar] [CrossRef] [PubMed]
- Wang, F.C.; Mao, M.C.; Duan, L.; Huang, Y.X.; Li, Z.; Zhu, C.Z. Instersession instability in fnirs-based emotion recognition. IEEE T. Neur. Sys. Reh. 2018, 26, 1324–1333. [Google Scholar] [CrossRef]
- Zhang, Y.; Yang, J.; Bai, D.; Wang, Y. A research about the mental fatigue of using an intelligent artificial limb based on functional near-infrared spectrum technique. In Proceedings of the IEEE International Intelligence and Safety for Robotics (ISR), Shenyang, China, 24–27 August 2018. [Google Scholar]
- Min, B.C.; Chung, S.C.; Park, S.J.; Kim, C.J.; Sim, M.K.; Sakamoto, K. Autonomic responses of young passengers contingent to the speed and driving mode of a vehicle. Int. J. Ind. Ergon. 2002, 29, 187–198. [Google Scholar] [CrossRef]
- Li, W.; He, Q.C.; Fan, X.M.; Fei, Z.M. Evaluation of driver fatigue on two channels of EEG data. Neurosci. Lett. 2012, 506, 235–239. [Google Scholar] [CrossRef] [PubMed]
- Ma, L.; Chablat, D.; Bennis, F.; Zhang, W.; Hu, B.; Guillaume, F. A new simple dynamic muscle fatigue model and its validation. Int. J. Ind. Ergon. 2009, 39, 211–220. [Google Scholar] [CrossRef]
- Mehta, R.K.; Agnew, A.J. Analysis of individual and occupational risk factors on task performance and biomechanical demands for a simulated drilling task. Int. J. Ind. Ergon. 2010, 40, 584–591. [Google Scholar] [CrossRef]
- Soo, Y.; Sugi, M.; Nishino, M.; Yokoi, H.; Arai, T.; Kato, R.; Nakamura, T.; Ota, J. Quantitative estimation of muscle fatigue using surface electromyography during static muscle contraction. In Proceedings of the IEEE Engineering in Medicine and Biology Society (EMBS), Minneapolis, MN, USA, 3–6 September 2009; pp. 2975–2978. [Google Scholar]
- English, A.W.; Wolf, S.L. The motor unit: Anatomy and physiology. Phys. Ther. 1982, 62, 1763–1772. [Google Scholar] [CrossRef]
- Naseer, N.; Hong, K.S. Classification of functional near-infrared spectroscopy signals corresponding to the right- and left-wrist motor imagery for development of a brain–computer interface. Neurosci. Lett. 2013, 553, 84–89. [Google Scholar] [CrossRef]
- Naseer, N.; Noori, F.M.; Qureshi, N.K.; Hong, K.S. Determining optimal feature-combination for LDA classification of functional near-infrared spectroscopy signals in brain-computer interface application. Front. Hum. Neurosci. 2016, 10, 1–10. [Google Scholar] [CrossRef]
- Noori, F.M.; Naseer, N.; Qureshi, N.K.; Nazeer, H. Optimal feature selection from fNIRS signals using genetic algorithms for BCI. Neurosci. Lett. 2017, 647, 61–66. [Google Scholar] [CrossRef]
- Yassierli, M.A. Effects of age, gender, and task parameters on fatigue development during intermittent isokinetic torso extensions. Int. J. Ind. Ergonomics 2009, 1, 185–191. [Google Scholar] [CrossRef]
- Bu, U. Fatigue and psychological distress in the working population: Psychometrics, prevalence, and correlates. J. Psychosom. Res. 2002, 52, 445–452. [Google Scholar]
- Gadanho, S.C. Learning behavior-selection by emotions and cognition in a multi-goal robot task. J. Mach. Learn. Res. 2003, 4, 385–412. [Google Scholar]
- Fellous, J.M.; Arbib, M.A. Who Needs Emotions? The Brain Meets the Robot; Oxford University Press: New York, NY, USA, 2005. [Google Scholar]
- Hu, X.S.; Hong, K.S.; Ge, S.S. fNIRS-based online deception decoding. J. Neural Eng. 2012, 9. [Google Scholar] [CrossRef] [PubMed]
- Zimmermann, R.; Marchal-Crespo, L.; Edelmann, J.; Lambercy, O.; Fluet, M.C.; Riener, R. Detection of motor execution using a hybrid fNIRS-biosignal BCI: A feasibility study. J. Neuroeng. Rehabil. 2013, 10, 1–15. [Google Scholar] [CrossRef] [PubMed]
© 2020 by the authors. Licensee MDPI, Basel, Switzerland. This article is an open access article distributed under the terms and conditions of the Creative Commons Attribution (CC BY) license (http://creativecommons.org/licenses/by/4.0/).