Abstract
A wavelet transform twofold subspace-based optimization method (WT-TSOM) is proposed to solve the highly nonlinear inverse scattering problems with contraction integral equation for inversion (CIE-I). While the CIE-I is able to suppress the multiple scattering effects within inversion (without compromising the accuracy of the physics), proper regularization is needed. In this paper, we investigate a new type subspace regularization technique based on wavelet expansions for the induced currents. We found that the bior3.5 wavelet is a good choice to stabilize the inversions with the CIE-I model and in the meanwhile it also can rectify the contrast profile. Numerical tests against both synthetic and experimental data show that WT-TSOM is a promising regularization technique for inversion with CIE-I.
1. Introduction
The electromagnetic inverse scattering problems (ISPs) are to reconstruct the geometric shape, constitutive parameters of the unknown scatterers by using the measured scattering data outside the domain of interest (DOI). In recent years, the ISPs have been widely used in target recognition, nondestructive testing, biomedical imaging, microwave remote sensing and so on [1,2,3]. The ISPs are usually cast into optimization problems to minimize the mismatches between the synthetic physical model and the measured field data. For a long time, ill-posedness and nonlinearity have been the two major difficulties faced in ISPs. To alleviate the ill-posedness, different regularization techniques can be employed such as norm total variation in [4,5,6]. On the other hand, according to the model of Lippmann–Schwinger integral equation (LSIE), due to the multiple scattering effects of electromagnetic waves within the DOI, the interaction of the secondary induced current leads to serious nonlinearity in searching the solutions of ISPs, especially when dealing with strong scatterers (the ones with high contrast and/or electrically large dimensions). Researchers in mathematical, physical, and engineering societies have dedicated great efforts in developing more stable and more efficient solvers for decades.
To solve the problem of high computational complexity caused by nonlinear problems, a linearization method based on Born approximation has been proposed in [7]. In this method, the total field in the target area is approximated by the incident field, which however is only valid for weak scatterers (those with low contrast and small physical dimensions—compared with the probing wavelength). When dealing with moderate or strong scatterers (those with large medium contrast and/or large physical dimensions), multiple scattering effects can no longer be ignored. In this scenario, fully nonlinear optimization schemes counting in all multiple scattering effects are needed. In recent years, different nonlinear inversion methods have been proposed by researchers. Some deterministic nonlinear inversion models and algorithms have been proposed, such as distorted Born iteration method (DBIM) and subspace-based DBIM [8], Gauss–Newton-type methods [9], contrast source inversion method (CSI) [10,11,12,13] and subspace-based optimization method (SOM) [14]. Although these methods are efficient to find the local minima of the ISPs, they are also very sensitive to initial guesses. These methods above can only handle problems with the limitation of low nonlinearity. Consequently, some stochastic optimization methods have been used for finding the global solutions [15,16]. However, those stochastic optimization schemes often consume a very large amount of computational resources, including CPU/GPU time and memory usages.
In order to reduce the nonlinearity of the model, some new source-type integral equation models are proposed, such as contrast source extended born (CS-EB) [17], and a family of new integral equations, namely as contraction integral equation for inversion (CIE-I) [18,19], the former of which is a special case of the latter. It is found that, with CIE-I, the multiple scattering effects within inversion are effectively reduced and replaced by a local type nonlinearity, therefore the nonlinearity of the ISPs is reduced compared with the case of using LSIE. To take care of the new local type nonlinearity and to stabilize the inversions with CIE-I, proper regularization should be imposed onto the unknowns to balance the stability of the inversion and the resolvability of handling the nonlinearity. In [18], Fourier basis type twofold subspace constraint (FFT-TSOM) [20] is used to stabilize the inversion by imposing strong subspace constrains onto the unknown induced secondary sources, where numerical tests show that such a type regularization is very effective to stabilize inversions with CIE-I. Later, in [19], a hybrid regularization inversion method with TSOM and multiplicative regularization applied directly on the unknowns was proposed to solve the highly ISPs based on CIE-I, where it shows that the TV regularization can help to release the stringent subspace constraint from TSOM, therefore could help to increase the resolvability of the inversion method. Lately, another regularization is also investigated within the inversion model of CIE-I, i.e., the iterative multiscaling approach (IMSA), and it is shown that IMSA can also help to stabilize the inversions with CIE-I [21].
Due to the sparse properties property and intrinsic multiresolution property of wavelet bases, they have been used in solving ISPs, such as in [12,22,23,24,25]. Basically, the wavelet transforms are used to either convert the unknowns or the whole physical problem or both into wavelet spectral domains, such that the transformed problems enjoy better formulations with less numbers of unknowns and thus more stabilities. While in [12,25] they have been used in the CSI/SOM-type inversion methods, all these efforts were carried out within the frame of LSIE. In this paper, we investigate a wavelet-expansion based subspace regularization technique, namely, wavelet transform twofold subspace-based optimization method (WT-TSOM), on the unknowns for the inversion with CIE-I to solve highly nonlinear ISPs. Instead of using Fourier bases, the wavelet bases are used to represent the induced currents for the CIE-I model within the TSOM frame. The major reason of using wavelet bases to span the low-dimensional subspace is due to their good flexibilities (having different types of wavelets) and stability. Through analyses and numerical studies, it is shown that the bior3.5 wavelet could be a good choice to stabilize the inversions with CIE-I, and meanwhile could provide total-variation like rectifications on the contrast profile. Consequently, the contributions of this paper could be summarized as, (1) the wavelet bases expansion based subspace regularization method, i.e., WT-TSOM, for inversions with CIE-I is proposed; (2) by studying the well known db20 and bior3.5 wavelets for the performances of representing the induced currents (from the direct problem perspective) and of reconstructing the induced currents (from the inverse problem perspective), it is found that the bior3.5 wavelet is a better choice in terms of stability and accuracy for reconstructions.
This paper is organized as follows. In Section 2, the wavelet transform and the CIE-I model are introduced. In Section 3, the proposed inversion method is provided. Numerical studies of wavelet bases and several benchmark tests, against both synthetic and experimental data, in Section 4 verify the interests. A conclusion follows in Section 5.
2. Some Preliminaries
In this section, we briefly introduce the wavelet transform and the fundamentals of the scattering model used in the proposed inversion method.
2.1. Review of the Discrete Wavelet Transform
Given the scaling function and wavelet function , a two-dimensional (2-D) scaling function and three 2-D wavelet functions can be combined as,
where is derived from the mother wavelet, and are the corresponding scaling funcitons, the details of which can be found in the standard textbook, like [26].
A continuous function in can be linearly expressed by a terms of scaling function and wavelet functions in the following form,
where the approximation coefficients and the j-level detail coefficients are defined as,
For convenience, operator W is denoted as the 2-D discrete wavelet transform, which maps from to a sparse set of coefficients in this paper. The 2-D discrete inverse wavelet transform is denoted as in this paper, i.e.,
Wavelet transform is a multi-scale signal analysis method. In view of the complete separated high- and low-frequency components of wavelet bases, the high-frequency spectral signal regarding with the edge part and the noise signal can be filtered out freely with the complete low-frequency components. By the nested scheme with more high-frequency components for constructing the signal, clearer profiles with the detail information can be finally obtained. Compared to the Fourier transform, the wavelet decomposition can well separate the low- and high-frequency components and the wavelet bases are more complete.
2.2. Introduction to the CIE-I Model
Herein, the 2-D electromagnetic ISPs with the transverse magnetic (TM) setting are considered, as in [13,14,18], and the time harmonic fields are deduced with exp(-) assumption from now on. As depicted in Figure 1, the domain of interest (DOI) D located within a free space background with permittivity and permeability is invariant along the z-axis of the rectangular coordinate system. The nonmagnetic scatterers are located in the DOI. In practice, the DOI is discretized into a total number of M subunits, with the centers of the subunits located at , . There are finite number of transmitting antennas located at with on the domain of S to illuminate the area of D. For each incidence, the scattered fields are measured by the receiving antennas located at , where . Similarly, denotes the number of receiving antennas here.
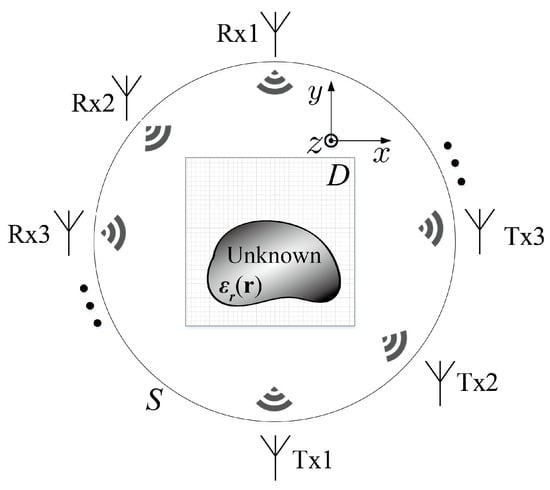
Figure 1.
Configuration of ISPs with homogeneous background.
Herein we use and to denote the matrix and vector of the discretization of parameter X, respectively.
The traditional Lippmann–Schwinger integral equation (LSIE) reads as
where , and are the total field and incident field in the DOI, respectively, g is the Green’s function of the background medium, and is the relative permittivity. With the contrast function being denoted as , the induced current can be denoted as
The second equation describes the scattered field as a re-radiations of the induced current,
For the pth incidence, the above equations can be written as discrete form,
where the Green’s function maps the induced current to the scattered fields in the DOI, and represents the mapping between the induced current in the DOI and the scattered fields of the measurement domain S.
In order to reduce the nonlinearity of the ISPs, a new source-type integral equation proposed in [18] is used for modeling, which is denoted as CIE-I and can be expressed as,
where is denoted as modified contrast function. has a positive real part and a nonpositive imaginary part. It is shown that by choosing an appropriate value, the multiple scattering effects can be effectively alleviated in inversions such that the nonlinearity of ISPs can be reduced accordingly. More details can be found in [18].
3. Inverse Problem
3.1. Inversion with WT-TSOM
Based on the subspace optimization method (SOM) [14], in the inversion, the induced current is accordingly divided into two parts, i.e., the deterministic part and the ambiguous part ,
According to [14], singular value decomposition (SVD) of tells
With sorted singular values in a descending order, i.e., , the deterministic part of the induced current corresponding to the singular value can be uniquely calculated by
The ambiguous part of the induced current is obtained through the optimization process. In the WT-TSOM, a suitable wavelet basis is selected to reconstruct the , that is,
where denotes the wavelet coefficients of the ambiguous part of the induced current. We adopt the nested inversion scheme (multi-round optimization) as mentioned in [18,20]. In the first round of optimization, the background air and null as the initial guess of the unknown target, and the reconstruction result of the previous round is used as the initial guess of the next round. Similar to the case with FFT-TSOM, in the first round of optimization, a small number of low-frequency components (approximation wavelet coefficients) are used for the inversion. With the inversion proceeding, more wavelet components are used in the subsequent round. In the next section, we will study how to choose the number of wavelet components to reconstruct the induced currents.
With this current expression, the object equation and data equation can be written as follows:
the mismatches of which can be given as,
Consequently, the objective function is given as,
The unknown variables, i.e., the wavelet coefficients and the modified contrast are to be found by searching the minimum of the object function. The CSI/SOM-type iterative inversion method is summarized as:
- Calculate the Green’s functions in terms of and , which can be defined aswhere denotes an equivalent radius so as to approximate every square subunit as a small circle of the same area, and is the area of the subunit. represents the mth subunit in DOI. denotes the qth receiver in domain S. Then do SVD to , and the deterministic part of the induced current can be calculated by (13). Set for the first round of optimization.
- Initialization with and set the initial searching direction . For the , a large value of and a small number of wavelet coefficients (i.e., a small ) should be chosen. Set the initial values , and with the dimensions of ( represents the number of the selected wavelet coefficients). In the subsequent rounds of optimization, i.e., , decreases and increases as K increases, and the initial values of and are the results of the previous round of optimization.
- . Update the wavelet coefficients . Firstly, taking the derivative of the object function, gradient of the object function with respect to the wavelet coefficients (19),where c denotes that full wavelet coefficients are used, the superscript * and H represent transpose and conjugate transpose of the matrix, respectively. If we use to represent the index number of the selected wavelet coefficients, then the actual used derivative can be expressed as . One can use the Polak-Ribière conjugate gradient (CG) search directions, which can be calculated as (22),Similarly, .The exact search step size can be calculated bywhere .Then update the wavelet coefficients,
- Update the induced current:
- Calculate the total field, , then use the least squares method to update the modified contrast function.
- If the maximum iteration is reached, output the obtained contrast. Otherwise, go to Step 7.
- If the termination condition is not met, go to Step 3. If termination condition is met, the Kth round of optimization is terminated. In this case, if K does not reach the maximum value, set before going to Step 2. Otherwise, output the obtained contrast.
In breif, the proposed method adopts the new wavelet bases to span the subspace needed in inversions, replacing the subspace spanned by the Fourier bases in [18]. Note that such a subspace regularization technique was firstly developed in [20] for inversions with LSIE. In the next subsection, two types of wavelet bases will be investigated and compared with the Fourier bases.
3.2. Wavelet Choices
Here, we use the well known “Austria” profile to study the efficiency of the two different wavelets, db20 and bior3.5, to represent the induced currents from the perspective of direct problem (knowing the induced currents). The rectangle domain with the side length of 2 m is selected as the DOI, and its center is located at m. The operating frequencies are 400 MHz and 800 MHz, i.e., the wavelengths of the incident wave are m and m in the background medium air, respectively. As shown in Figure 2, the “Austria” profile (with ) consists of two discs and one ring. The radius of the two discs both are m, and the centers are located at m, and m. The ring has an inner radius m and an exterior radius m, and the center is located at m. There are 16 line sources and 32 line receivers are evenly placed on the circle of radius 3 m. In the forward problem, the scattered fields can be obtained by the full-wave solver with grid meshes and the scattering data matrix size is .
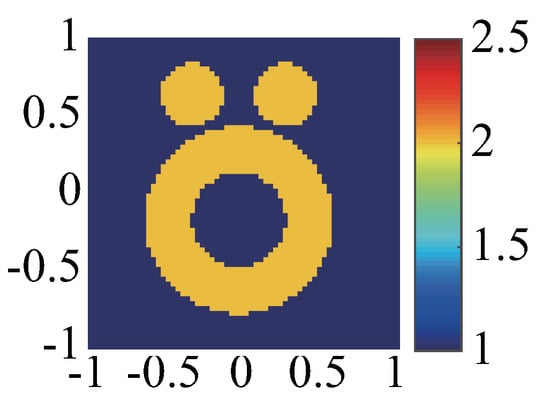
Figure 2.
The exact profile of “Austria” profile (with ). The colorbar shows the value of relative permittivity.
The wavelet bases are not unique and a suitable choice of wavelet bases is crucial for the inversion. Herein, the strategy for choosing the wavelet is to compare the compression performance of various decomposition bases for the induced currents with “Austria” profile, such as db20 wavelet bases, bior3.5 wavelet bases and Fourier bases. Table 1 and Table 2 show the compression performances with the selected 3-level and 2-level wavelet approximate components and low-frequency Fourier components on the expansion of induced currents. Figure 3 shows the retrieved results of the induced currents with low-frequency components for two types of strong scatterers with different bases. Figure 3a depicts the modulus of the induced currents in the DOI at the incidence. Figure 3b depicts the results by using 64 low-frequency Fourier components, 3-level bior3.5 and db20 wavelet approximate components. Figure 3c depicts the results by using 256 low-frequency Fourier components, 2-level bior3.5 and db20 wavelet approximate components. From these results, it is obviously shown in each case that bior3.5 wavelet bases have the best energy compression ratio even when dealing with strong scatterers (ones with high contrast and/or electrically large dimensions). Note that the total number of freedom is 4096 (with 64 by 64 grids). When comparing the 2-level and 3-level wavelet representations, we see that with more level decomposition, we use less number of basis functions, and thus the energy drops in all the cases. Again, we see that bior3.5 wavelet has less of a decrease in all the three different cases (in terms of percentages). This means that when using the same number of basis functions, the bior3.5 wavelet bases could provide better representations of the induced currents. On the other hand, we also notice that when testing on the case with large electrical dimensions (higher frequency one), the losses of the energy due to the decrease of the number of basis functions are large. This could imply that we need to use lower level wavelet decomposition (such that more basis functions) to represent the induced currents in such a circumstance, which is physically reasonable due to the more spatial variations of induced currents appear in an electrical large domain.

Table 1.
Energy compression ratio of induced currents using 3-level wavelet approximate components and low-frequency Fourier components (64 bases).

Table 2.
Energy compression ratio of induced currents using 2-level wavelet approximate components and low-frequency Fourier components (256 bases).
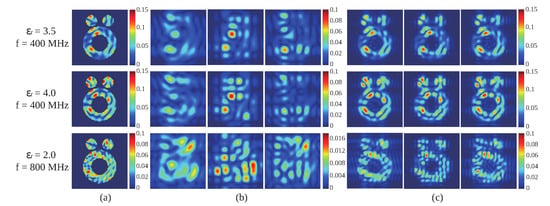
Figure 3.
(a) The modulus of the induced currents in the domain of interest (DOI) at the incidence. (b) The 1st, 2nd, and 3rd columns correspond to approximation results by using 64 low-frequency Fourier components, 3-level bior3.5 wavelet approximate components, and 3-level db20 wavelet approximate components, respectively. (c) The 1st, 2nd, and 3rd columns correspond to approximation results by using 256 low-frequency Fourier components, 2-level bior3.5 wavelet approximate components, and 2-level db20 wavelet approximate components, respectively.
To be more specific, there are two strategies for choosing the number of wavelet coefficients in handing these two types of highly nonlinear ISPs (i.e., the ones with high contrast and electrically large dimensions): (1) when dealing with the strong scatterers with high contrast, the 3-level wavelet decomposition could be used, where in the first round optimization the highest level bases are used, like 64 in the above energy test, and more number of bases need to be included in the subsequent rounds of optimization. (2) When dealing with the strong scatterers with electrically large dimensions, the 2-level wavelet decomposition is used, so as to have more wavelet bases in the first round optimization. Then more bases are needed in the subsequent rounds of optimization. Note that in choosing the number of wavelet bases, unlike in the case with Fourier bases, one has only a certain limit choices, such as, in 3-level decomposition case, one has only 64, 128, 256, etc., which are basically the portion of the number of cells along x and y directions. Regarding the selection of , there is a detailed description in [18]. should has a big value in the first round and be reduced in the subsequent rounds. The obtained results from the current round of optimization will be used as the initial guesses of the next round. As more and more bases are used, the fine features of the profile will be obtained.
In this subsection, we provide analyses from the direct problem perspective on the two types of wavelets, db20 and bior3.5, by using the energy compression ratio. We here emphasize that, due to the many possible choices of wavelets, there certainly exist other good or even better choices, so does for the criterion to evaluate the suitabilities of these wavelets.
4. Numerical Tests
In this section, in order to test the inversion performance of the proposed WT-TSOM, we use both synthetic data and experimental data from the Fresnel Institute [27] to verify the method. All tests in this section, the DOI is discretized into grid meshes, additive white Gaussian noise (AWGN) is added on the synthetic data. To evaluate the quality of reconstructed images, the mean square error of the estimation is designed as
where M denotes the total number of subunits, denotes the relative permittivity of the reconstructed images at the ith subunit, denotes the real relative permittivity of the scatterers at the ith subunit. To further evaluate the reconstruction qualities exactly on the unknown scatterers, another type of relative reconstructed error is defined with the summation of indexes over only the domain where scatterers distribute.
As did in [18], the inversion also adopts a nested optimization scheme, that is, multiple rounds of optimization are performed, and the results of the previous round are used as the initial values of the next round. In order to ensure that each round of optimization has converged, the optimization is terminated when the change of the unknown is smaller than a predefined threshold. Such a change is defined as,
which is calculated at every iteration, and once it is less than 0.001 in the first round of optimization, or less than 0.0001 in the subsequent rounds of optimization, we stop the current round optimization.
4.1. Tests with Synthetic Data
In the first example, the “Austria” profile with the relative permittivity of (a strong scatterer with high contrast) is used as the unknown target. According to above strategies, we choose the values of being 6, 3, 0.5, and 0 for the four rounds of optimization, coupled with being 64, 128, 256, 1024 and the is set to 15. Under the same parameter settings, we tested the inversion performance of the WT-TSOM by using the db20 wavelet bases and the bior3.5 wavelet bases. Figure 4a,b depict the reconstructed results after the four rounds of optimization by WT-TSOM with two different wavelet bases. It can be clearly seen that, compared with the db20 wavelet bases, the WT-TSOM using the bior3.5 wavelet bases can get much better reconstructed profiles. Table 3 shows the number of iterations (NoI) required for each round of optimization and the corresponding errors of the reconstructed results, so do the following tables. Both the reconstructed results and the errors all validate that the WT-TSOM with bior3.5 wavelet bases to expand the ambiguous part of the induced current outperforms the one with the db20 wavelet bases. In addition, we also observe that, using bior3.5 wavelet, the obtained reconstructed result by the last round of optimization is well rectified that contrast values within scatterers vary within a small range, which is also reflected by the errors in Table 3.
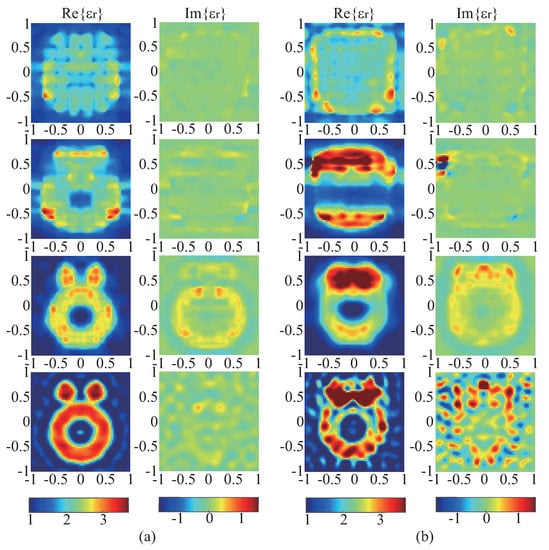
Figure 4.
Reconstructed results by WT-TSOM with (a) the bior3.5 wavelet bases and (b) the db20 wavelet bases for “Austria” profile with . The 1st, 2nd, 3rd, and 4th rows correspond to the reconstructed results of the first, second, third, and fourth rounds of optimization, respectively. The 1st, 2nd, 3rd, and 4th rounds of optimization correspond to being 6, 3, 0.5, and 0, coupled with being 64, 128, 256, and 1024, respectively.

Table 3.
Errors of the reconstructed results by WT-TSOM with the bior3.5 and db20 wavelet bases.
In the second example, in order to test the capability of the proposed WT-TSOM to handle strong scatterers (the ones with the high contrast), we increase the relative permittivity of “Austria” profile to 4.0 with the contrast being 3.0. The parameter settings are exactly the same as the previous example. The reconstructed results are shown in Figure 5. Errors of reconstructed results at the final round, i.e., , and are 0.6002 and 0.1017, respectively. From this example, we clearly see that WT-TSOM is effective in dealing with strong scatterers with high contrast. Similar to the previous case, the obtained reconstruction profile at the end is rectified.
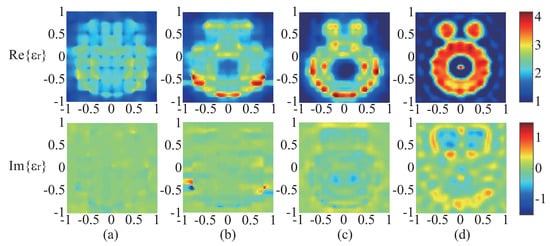
Figure 5.
Reconstructed results of (a) first round of optimization, (b) second round of optimization, (c) third round of optimization, and (d) fourth round of optimization by WT-TSOM for “Austria” profile with . The real (first row) and imaginary (second row) of the reconstructed results. The 1st, 2nd, 3rd, and 4th rounds of optimization correspond to being 6, 3, 0.5, and 0, coupled with being 64, 128, 256, and 1024, respectively.
In the third example, to validate the versatility of the WT-TSOM, a lossy and corrugated (e.g., rectangles) profile is utilized for reconstruction. Figure 6a depicts the real part (upper) and imaginary part (down) of the exact profile, which consists of two disks, a coated rectangle and background material. The radius of each disk is 0.3 m. They have the same relative permittivity of 3.5. Their centers are located at (−0.4, 0.6) m and (0.4, 0.6) m, respectively. The lossy coated rectangle is centered at (0, −0.3) m. The inner rectangle has a long side of 1.0 m and a short side of 0.6 m, and the outer rectangle has a long side of 1.6 m and a short side of 1.0 m. The relative permittivity of the inner rectangle is , and the one of the outer rectangle is . The parameter settings are exactly the same as the previous example, and the is set to 5. The reconstructed results are shown in Figure 6b–e, and Table 4 shows the details of the results. It can be seen from the results that after four rounds of optimization, the lossy profile can be well reconstructed, although some artifacts exist in the imaginary parts. Please note that the reconstructed results by the last round of optimization clearly show the effects of noise, meaning that when more and more high-frequency wavelet components are used, results tend to be affected by noise, similar to the case with FFT-TSOM. For the results after three round optimization, shown in Figure 6d, the rectangular shapes of the bottom scatterers are well reconstructed, showing again the rectification effect on the contrast profile with bior3.5 wavelet.
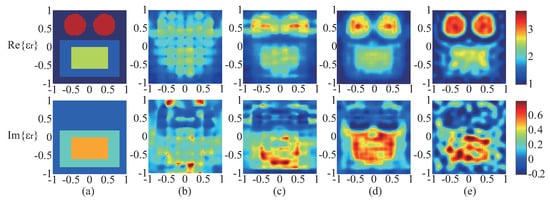
Figure 6.
(a) The real part (first row) and imaginary part (second row) of the exact profile. (b–e) Reconstructed results correspond to fourth rounds of optimization, respectively. The real (first row) and imaginary (second row) of the reconstructed results. The 1st, 2nd, 3rd and 4th rounds of optimization correspond to being 6, 3, 0.5 and 0, coupled with being 64, 128, 256, and 1024, respectively.

Table 4.
Errors of the reconstructed results by WT-TSOM.
In the fourth example, we choose “Austria” profile with the relative permittivity of 2.0 as the unknown target, but the operating frequency is increased to 800 MHz, with the measurement and inversion setting the same as in the previous examples. At 800 MHz, the electrical size of the DOI becomes , meaning “Austria” profile is a strong scatterer with electrically large dimensions. In the first round of optimization, more wavelet bases should be used represent the induced currents, as mentioned in the previous section. So in this example, we choose the values of being 6, 3, and 0.5 for the three rounds of optimization, coupled with being 256, 512, 768, and is set to 5. The reconstructed results of the three rounds of optimization are shown in Figure 7a–c, in which the first and second rows show the real and imaginary parts of the reconstructed results, respectively. Table 5 shows the errors of the reconstruction results after each round of optimization. It can be seen from the reconstruction results and errors that WT-TSOM can also handle strong scatterers with electrically large dimensions well.
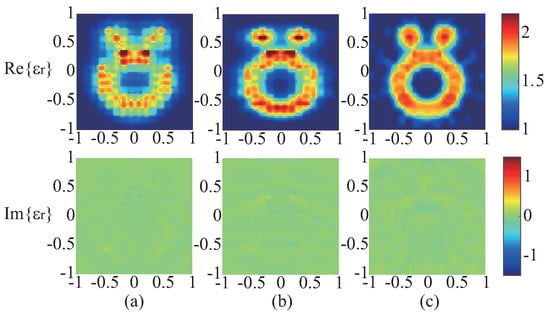
Figure 7.
Reconstructed results for the “Austria” profile at 800 MHz by the WT-TSOM. (a–c) Reconstructed results correspond to three rounds of optimization, respectively. The real (first row) and imaginary (second row) of the reconstructed results. The 1st, 2nd, and 3rd rounds of optimization correspond to being 6, 3, and 0.5, coupled with being 256, 512, and 768, respectively.

Table 5.
Errors of the reconstructed results by WT-TSOM.
To summarize, above testing results show that, if proper wavelet bases are chosen, the WT-TSOM provides very good performances in stabilizing the inversions with CIE-I, which are at least equivalent if not better than those by FFT-TSOM in [18]. In addition, the rectification on the profiles by the proposed WT-TSOM is a very welcome advantage, since no additional computational costs is needed to achieve this. Note that, as discussed in [18], all these results are far better than those obtained by inversion methods with LSIE model, as these cases are too nonlinear to be properly handled by the LSIE model.
4.2. Tests with Experimental Data
In the last example, the experimental data from Institute Fresnel is utilized to test the proposed method. The used FoamTwinDiel data set is collected with 18 transmitters and 241 receivers at the different frequencies (from 2 GHz to 10 GHz) [27]. As shown in Figure 8a, the FoamTwinDiel consists of three scatterers, i.e., two smaller cylinders with diameter being 3.1 cm and the relative permittivity of 3.0, and a larger cylinder with diameter being 8 cm and . In the inversion, the cm2 DOI with subunits is selected, and the is set to 5. Through numerical testing, it is validated that 9 GHz is the highest frequency which the proposed method can handle. The background air and null as the initial guesses, and the is set to 0.001, 0.0001, and 0.0001 for three rounds of optimization. We choose the values of being 6, 3, and 0.5 for the three rounds of optimization, coupled with being 256, 512, 768, which are the same as those used in the 800 MHz case. The reconstructed results of the three rounds of optimization at 9 GHz by the proposed method are shown in Figure 8b–d, respectively, and the first and second rows show the real and imaginary parts of the reconstructed results, respectively. The errors of reconstructed results are 0.2948, 0.2680, and 0.1591, whereas are 0.2436, 0.1346, and 0.0864, which are obtained after three rounds of optimization with 336, 2678, 1626 iterations, respectively. Again, we see good reconstruction results with the proposed method, esp. the well rectified profile with the coated cylinder on the right hand side, as shown in Figure 8d.
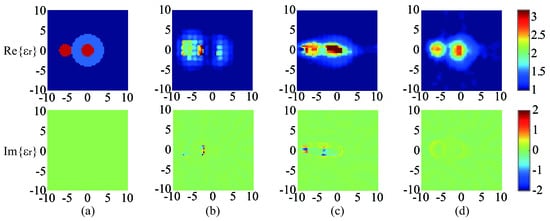
Figure 8.
(a) Exact profile “FoamTwinDiel”; (b–d) Reconstructed results against FoamTwinDiel data set at 9 GHz, corresponding to three rounds of optimization, respectively. The real (first row) and imaginary (second row) of the reconstructed results. The 1st, 2nd, and 3rd rounds of optimization correspond to being 6, 3, and 0.5, coupled with being 256, 512, and 768, respectively.
5. Conclusions
This paper presents a wavelet based twofold subspace-based optimization method, i.e., WT-TSOM, for solving highly nonlinear ISPs by using of the CIE-I model. While the nonlinearity of the ISPs can be alleviated and the multiple scattering effects within inversion can be suppressed by the CIE-I model, the wavelet-expansion-based regularization on the unknown induced currents can effectively stabilize inversions with CIE-I. With nested optimization scheme, profiles of strong scatterers can be roughly reconstructed with one or two rounds of optimization, based on which the fine features of the profiles can then be retrieved with another one or two rounds of optimization. Although the number of wavelet bases cannot be chosen flexibly as with Fourier bases, different types of wavelets provide more possibilities. In this paper, we have studied the well known db20 and bior3.5 for the performances of representing the induced currents (from the direct problem perspective) and of reconstructing the induced currents (from the inverse problem perspective), and have found that the latter is a better choice in terms of stability and accuracy for reconstructions. Numerical tests against both synthetic and experimental data have validated that the WT-TSOM with the bior3.5 wavelet bases exhibits promising reconstruction performances in tackling highly nonlinear inverse scattering problems and therefore provides a new regularization tool for the CIE-I model.
Author Contributions
Conceptualization, K.X. and Y.Z.; methodology, K.X.; software, L.Z.; validation, L.Z., K.X. and Y.Z.; formal analysis, K.X.; investigation, L.Z.; resources, K.X.; data curation, K.X.; writing—original draft preparation, L.Z. and Z.M.; writing—review and editing, K.X. and Y.Z.; visualization, L.Z. and K.X.; supervision, K.X.; project administration, K.X. and Y.Z.; funding acquisition, K.X. All authors have read and agreed to the published version of the manuscript.
Funding
This research was funded by the Zhejiang Provincial Natural Science Foundation of China under Grant LY19F010012, in part by the National Natural Science Foundation of China under Grant 61971174, in part by the Talent Project of Zhejiang Association for Science and Technology under Grant SKX201901, and in part by the China Postdoctoral Science Foundation under Grant 2019M661984.
Conflicts of Interest
The authors declare no conflict of interest.
References
- Chandra, R.; Zhou, H.; Balasingham, I.; Narayanan, R.M. On the opportunities and challenges in microwave medical sensing and imaging. IEEE Trans. Biomed. Eng. 2015, 62, 1667–1682. [Google Scholar] [CrossRef]
- Caorsi, S.; Massa, A.; Pastorino, M.; Donelli, M. Improved microwave imaging procedure for nondestructive evaluations of twodimensional structures. IEEE Trans. Antennas Propag. 2004, 52, 1386–1397. [Google Scholar] [CrossRef]
- Wang, X.; Qin, T.; Witte, R.S.; Xin, H. Computational feasibility study of contrast-enhanced thermoacoustic imaging for breast cancer detection using realistic numerical breast phantoms. IEEE Trans. Microw. Theory Tech. 2015, 63, 1489–1501. [Google Scholar] [CrossRef]
- Xu, K.; Zhong, Y.; Song, R.; Chen, X.; Ran, L. MultiplicativeRegularized FFT twofold subspace-based optimization method for inverse scattering problems. IEEE Trans. Geosci. Remote Sens. 2015, 53, 841–850. [Google Scholar]
- Abubaker, A.; Van Den Berg, P.M. Total variation as a multiplicative constraint for solving inverse problems. IEEE Trans. Image Process. 2001, 10, 1384–1392. [Google Scholar] [CrossRef] [PubMed]
- Van den Berg, P.; Kleinman, R. A total variation enhanced modified gradient algorithm for profile reconstruction. Inv. Probl. 1995, 11, L5–L10. [Google Scholar] [CrossRef]
- Wang, Y.; Chew, W. An iterative solution of two-dimensional electromagnetic inverse scattering problem. Int. J. Iamging Syst. Technol. 1989, 1, 100–108. [Google Scholar] [CrossRef]
- Ye, X.; Chen, X. Subspace-based distorted-born iterative method for solving inverse scattering problems. IEEE Trans. Antennas Propag. 2017, 65, 7224–7232. [Google Scholar] [CrossRef]
- De Zaeytijd, J.; Franchois, A.; Eyraud, C.; Geffrin, J. Full-wave three-dimensional microwave imaging with a regularized Gauss–Newton method—theory and experiment. IEEE Trans. Antennas Propag. 2007, 55, 3279–3292. [Google Scholar] [CrossRef]
- Abubakar, A.; van den Berg, P.M. The contrast source inversion method for location and shape reconstructions. Inverse Probl. 2002, 18, 495–510. [Google Scholar] [CrossRef]
- Gilmore, C.; Mojabi, P.; LoVetri, J. Comparison of an enhanced distorted born iterative method and the multiplicative-regularized contrast source inversion method. IEEE Trans. Antennas Propag. 2009, 57, 2341–2351. [Google Scholar] [CrossRef]
- Li, M.; Semerci, O.; Abubakar, A. A contrast source inversion method in the wavelet domain. Inverse Probl. 2013, 29, 025015. [Google Scholar] [CrossRef]
- Van den Berg, P.M.; van Broekhoven, A.L.; Abubakar, A. Extended contrast source inversion. Inverse Probl. 1999, 15, 1325–1344. [Google Scholar] [CrossRef]
- Chen, X. Subspace-based optimization method for solving inverse-scattering problems. Trans. Geosci. Remote Sens. 2010, 48, 42–49. [Google Scholar] [CrossRef]
- Pastorino, M. Stochastic optimization methods applied to microwave imaging: A review. IEEE Trans. Antennas Propag. 2007, 55, 538–548. [Google Scholar] [CrossRef]
- Rocca, P.; Benedetti, M.; Donelli, M.; Franceschini, D.; Massa, A. Evolutionary optimization as applied to inverse scattering problems. Inverse Probl. 2009, 25, 123003. [Google Scholar] [CrossRef]
- Isernia, T.; Crocco, L.; D’Urso, M. New tools and series for forward and inverse scattering problems in lossy media. IEEE Geosci. Remote Sens. Lett. 2004, 1, 327–331. [Google Scholar] [CrossRef]
- Zhong, Y.; Lambert, M.; Lesselier, D.; Chen, X. A new integral equation method to solve highly nonlinear inverse scattering problems. IEEE Trans. Antennas Propag. 2016, 64, 1788–1799. [Google Scholar] [CrossRef]
- Xu, K.; Zhong, Y.; Wang, G. A hybrid regularization technique for solving highly nonlinear inverse scattering problems. IEEE Trans. Microw. Theory Tech. 2018, 66, 11–21. [Google Scholar] [CrossRef]
- Zhong, Y.; Chen, X. An FFT twofold subspace-based optimization method for solving electromagnetic inverse scattering problems. IEEE Trans. Antennas Propag. 2011, 59, 914–927. [Google Scholar] [CrossRef]
- Zhong, Y.; Salucci, M.; Xu, K.; Polo, A.; Massa, A. A multiresolution contraction integral equation method for solving highly nonlinear inverse scattering problems. IEEE Trans. Microw. Therory Tech. 2020, 68, 1234–1247. [Google Scholar] [CrossRef]
- Miller, E.L.; Willsky, A.S. Wavelet-based methods for the nonlinear inverse scattering problem using the extended Born approximation. Radio Sci. 1996, 31, 51–65. [Google Scholar] [CrossRef]
- Winters, D.W.; Veen, B.D.V.; Hagness, S.C. A sparsity regularization approach to the electromagnetic inverse scattering problem. IEEE Trans. Antennas Propag. 2010, 58, 145–154. [Google Scholar] [CrossRef] [PubMed]
- Scapaticci, R.; Kosmas, P.; Crocco, L. Wavelet-based regularization for robust microwave imaging in medical applications. IEEE Trans. Biomed. Eng. 2015, 62, 1195–1202. [Google Scholar] [CrossRef]
- Yin, T.; Wei, Z.; Chen, X. Wavelet transform subspace-based optimization method for inverse scattering. IEEE Multiscale Multiphys. Comput. Tech. 2018, 3, 176–184. [Google Scholar] [CrossRef]
- Mallat, S.G. A Wavelet Tour of Signal Processing; Academic: New York, NY, USA, 1999. [Google Scholar]
- Geffrin, J.-M.; Sabouroux, P.; Eyraud, C. Free space experimental scattering database continuation: Experimental set-up and measurement precision. Inverse Probl. 2005, 21, 117–130. [Google Scholar] [CrossRef]
Publisher’s Note: MDPI stays neutral with regard to jurisdictional claims in published maps and institutional affiliations. |
© 2020 by the authors. Licensee MDPI, Basel, Switzerland. This article is an open access article distributed under the terms and conditions of the Creative Commons Attribution (CC BY) license (http://creativecommons.org/licenses/by/4.0/).