Features Dimensionality Reduction Approaches for Machine Learning Based Network Intrusion Detection

 , , ,
, , ,  and
and
Abstract
1. Introduction
1.1. Problem Statement
1.2. Key Contributions and Paper Organization
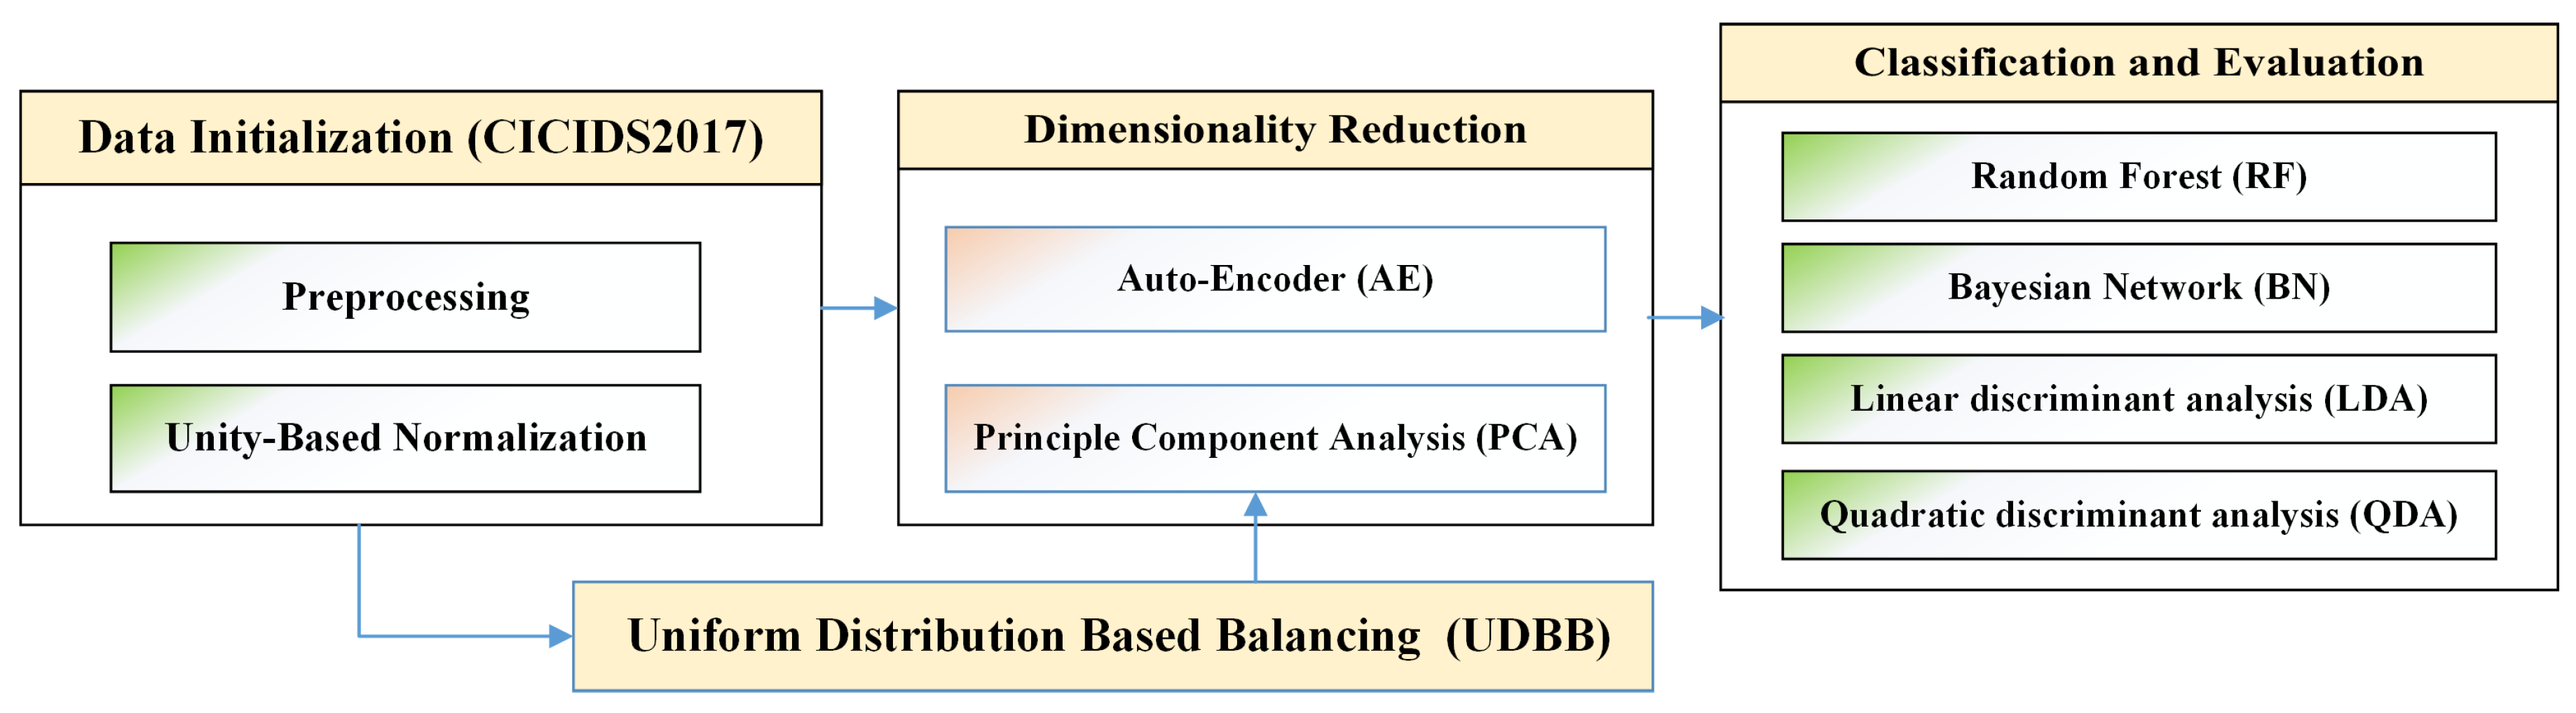
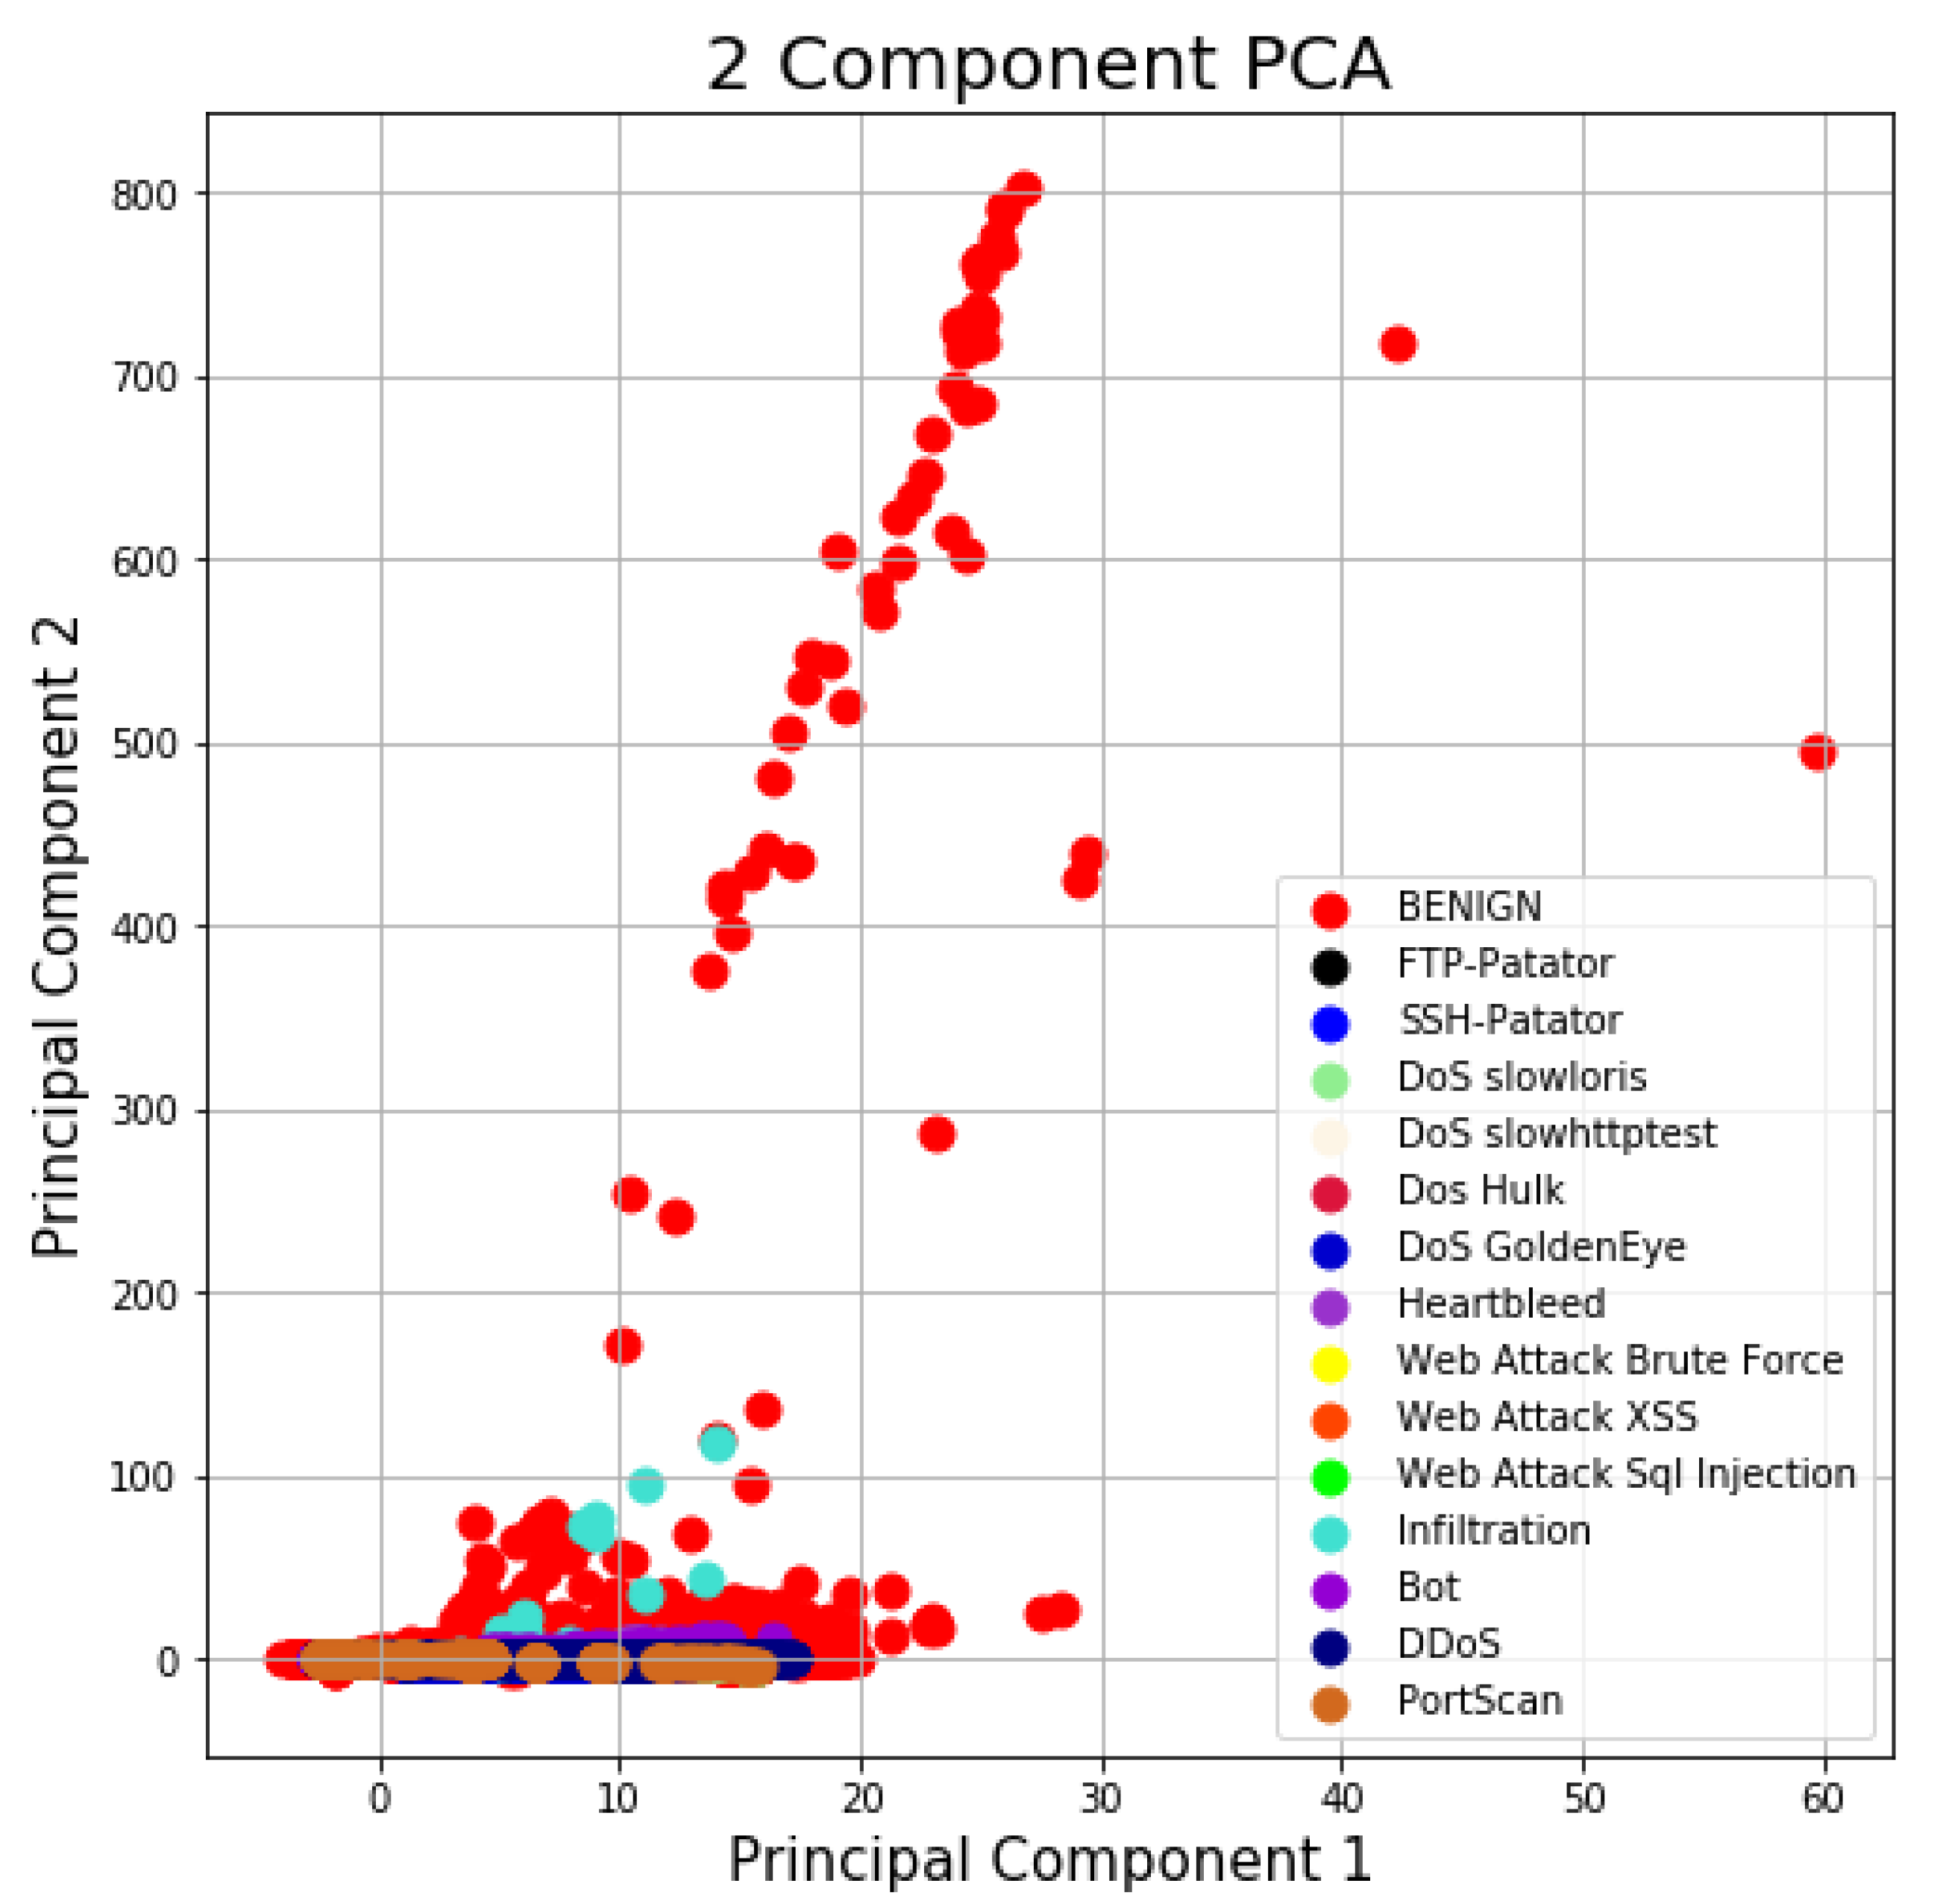
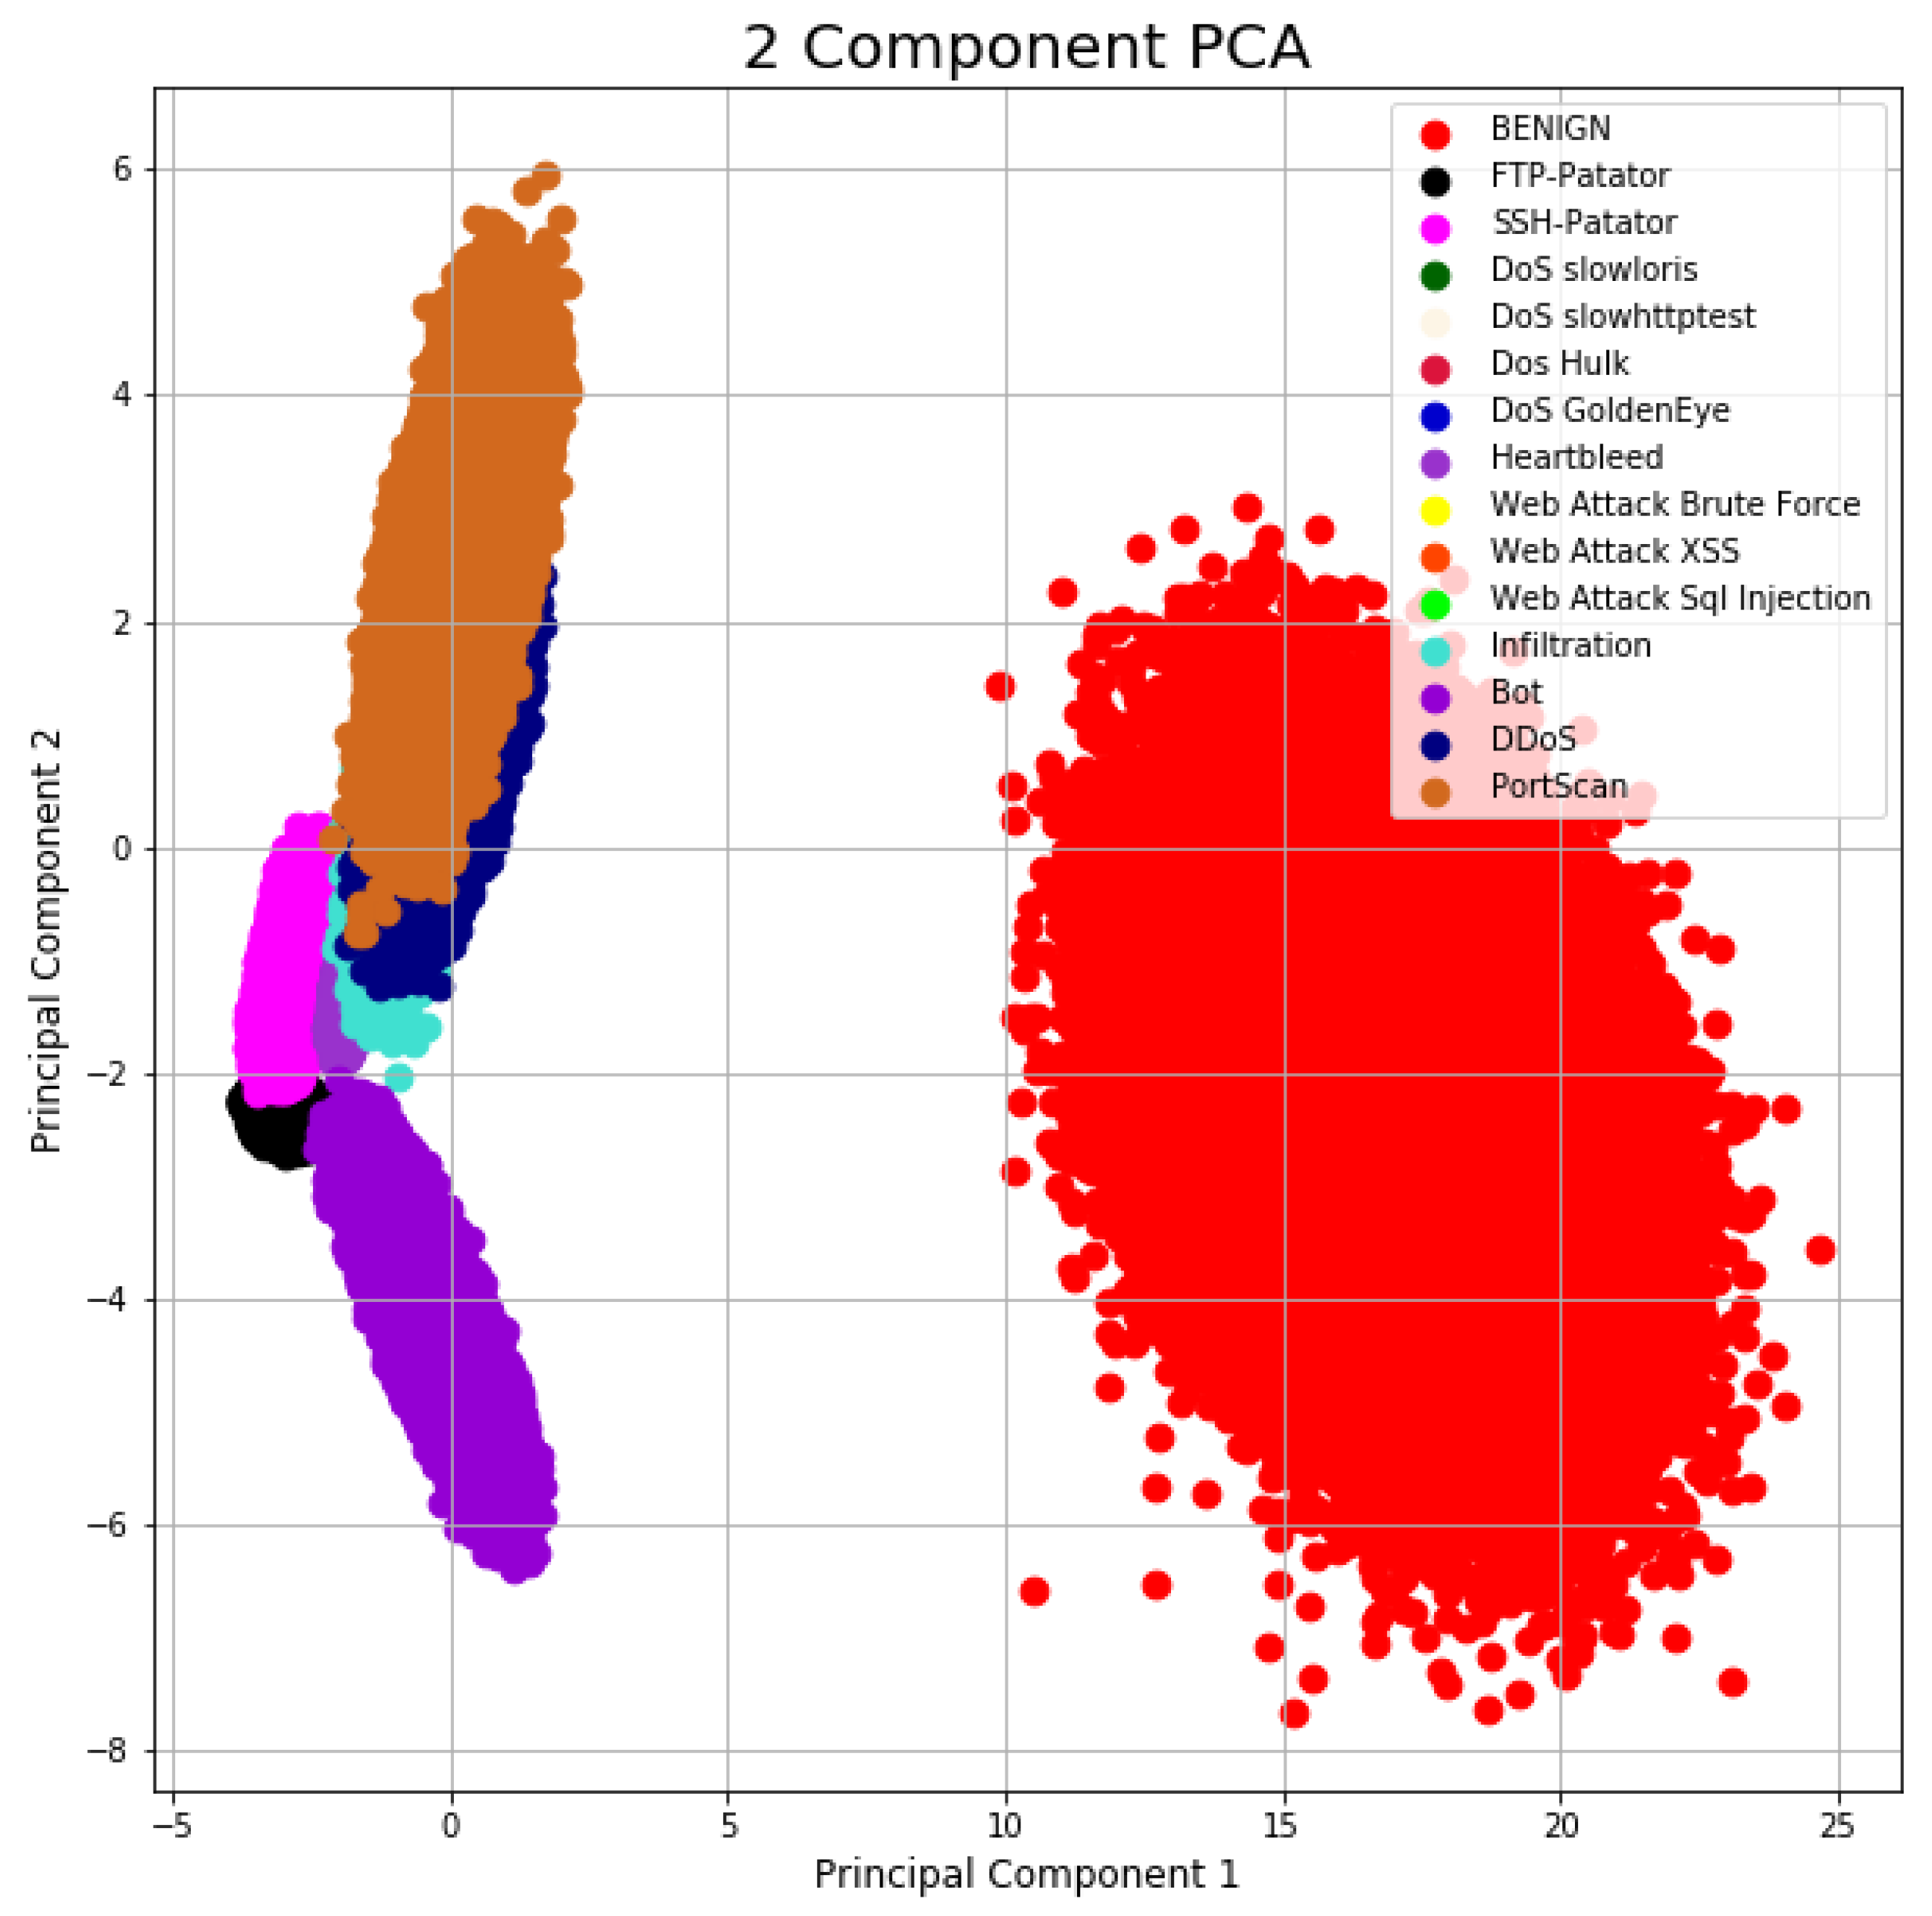
- We achieved effective pattern representation and dimensionality reduction of features in the CICIDS2017 dataset using AE and PCA.
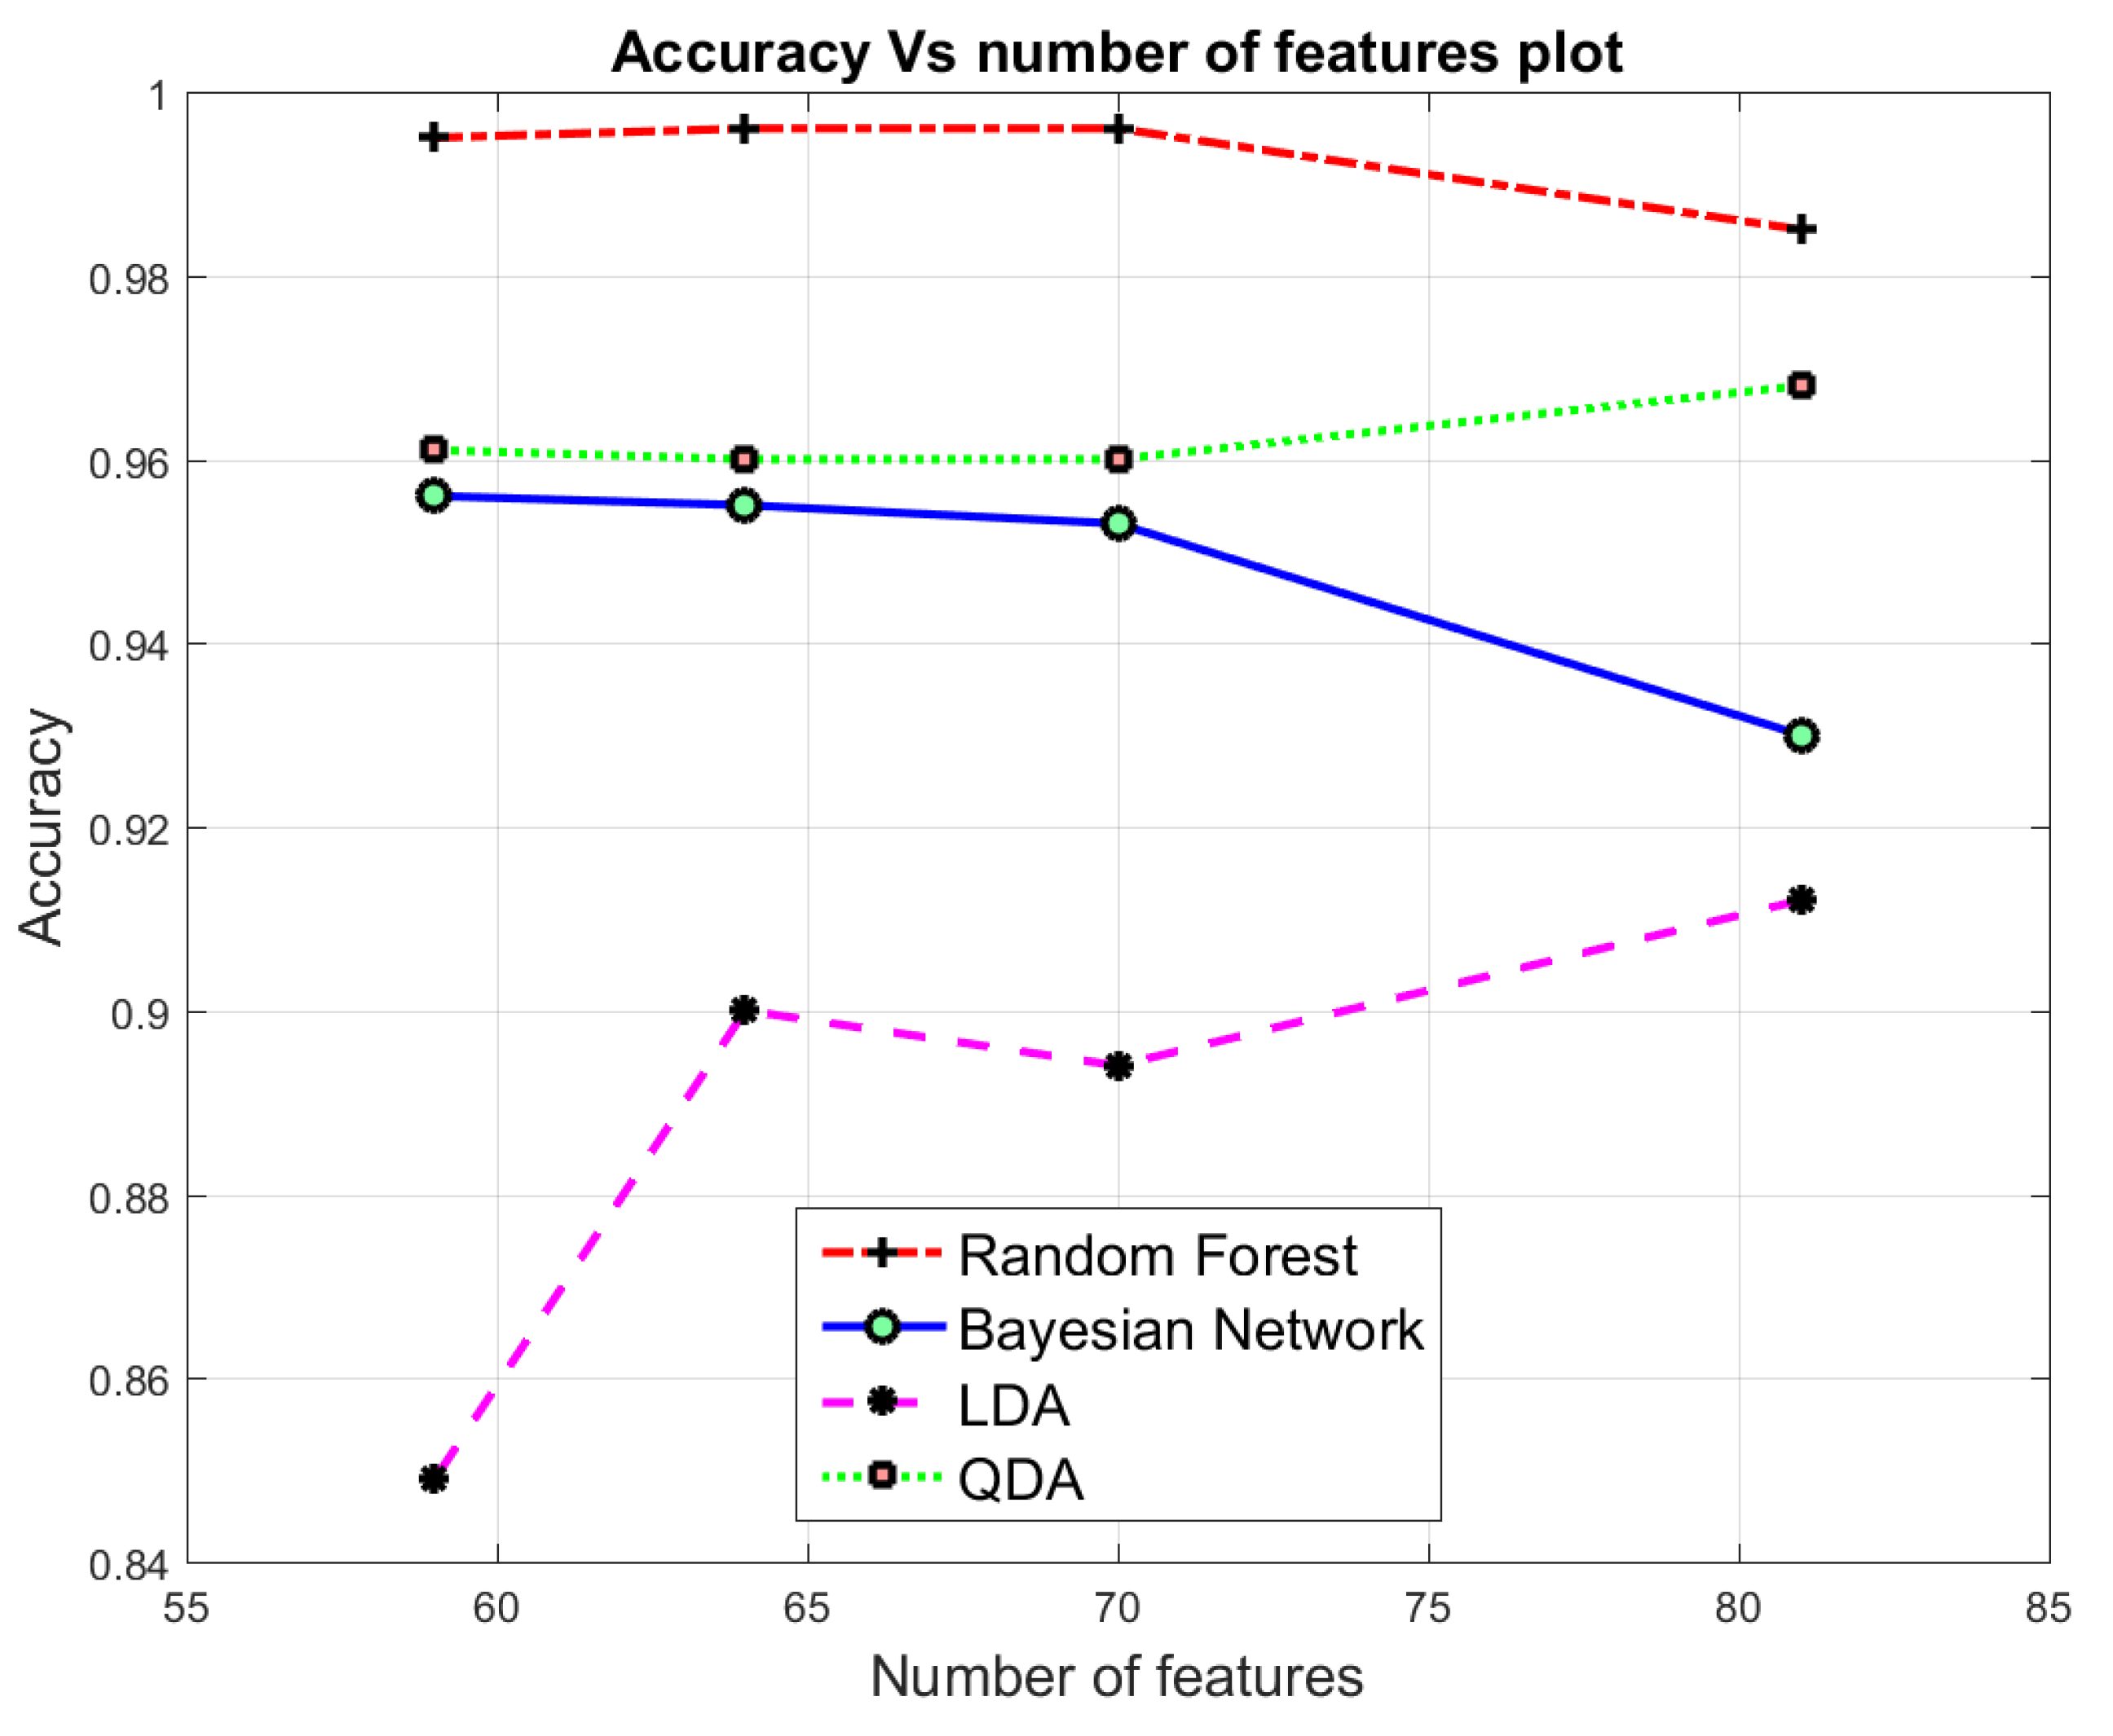
- We used the CICIDS2017 dataset to compare the efficiency of the dimensionality reduction approaches with different classification algorithms, such as Random Forest, Bayesian Network, LDA and QDA in binary and multi-class classification.
- We developed a combined metric with respect to class distribution to compare various multi-class classification systems through incorporating the False Alarm Rate (FAR), Detection Rate (DR), Accuracy and class distribution parameters.
- We developed a Uniform Distribution Based Balancing (UDBB) approach for imbalanced classes.
2. Dimensionality Reduction Approaches Selection Criteria and Related Work
- Being relevant to the CICIDS2017 dataset
- Being relevant to dimensionality reduction approaches; precisely, the auto-encoder and the PCA
- Being relevant to machine learning-based intrusion detection
2.1. CICIDS2017 Related Work
2.2. Auto-Encoder Related Work
2.3. PCA Related Work
3. CICIDS2017 Dataset
- The distribution of the packet size
- The number of packets per flow
- The size of the payload
- The request time distribution of the protocols
- Certain patterns in the payload
- The full packet payloads in Packet CAPture (PCAP) format
- The corresponding profiles and labeled flows as CSV files for machine and deep learning purposes
3.1. Preprocessing
3.2. Unity-Based Normalization
4. Features Dimensionality Reduction
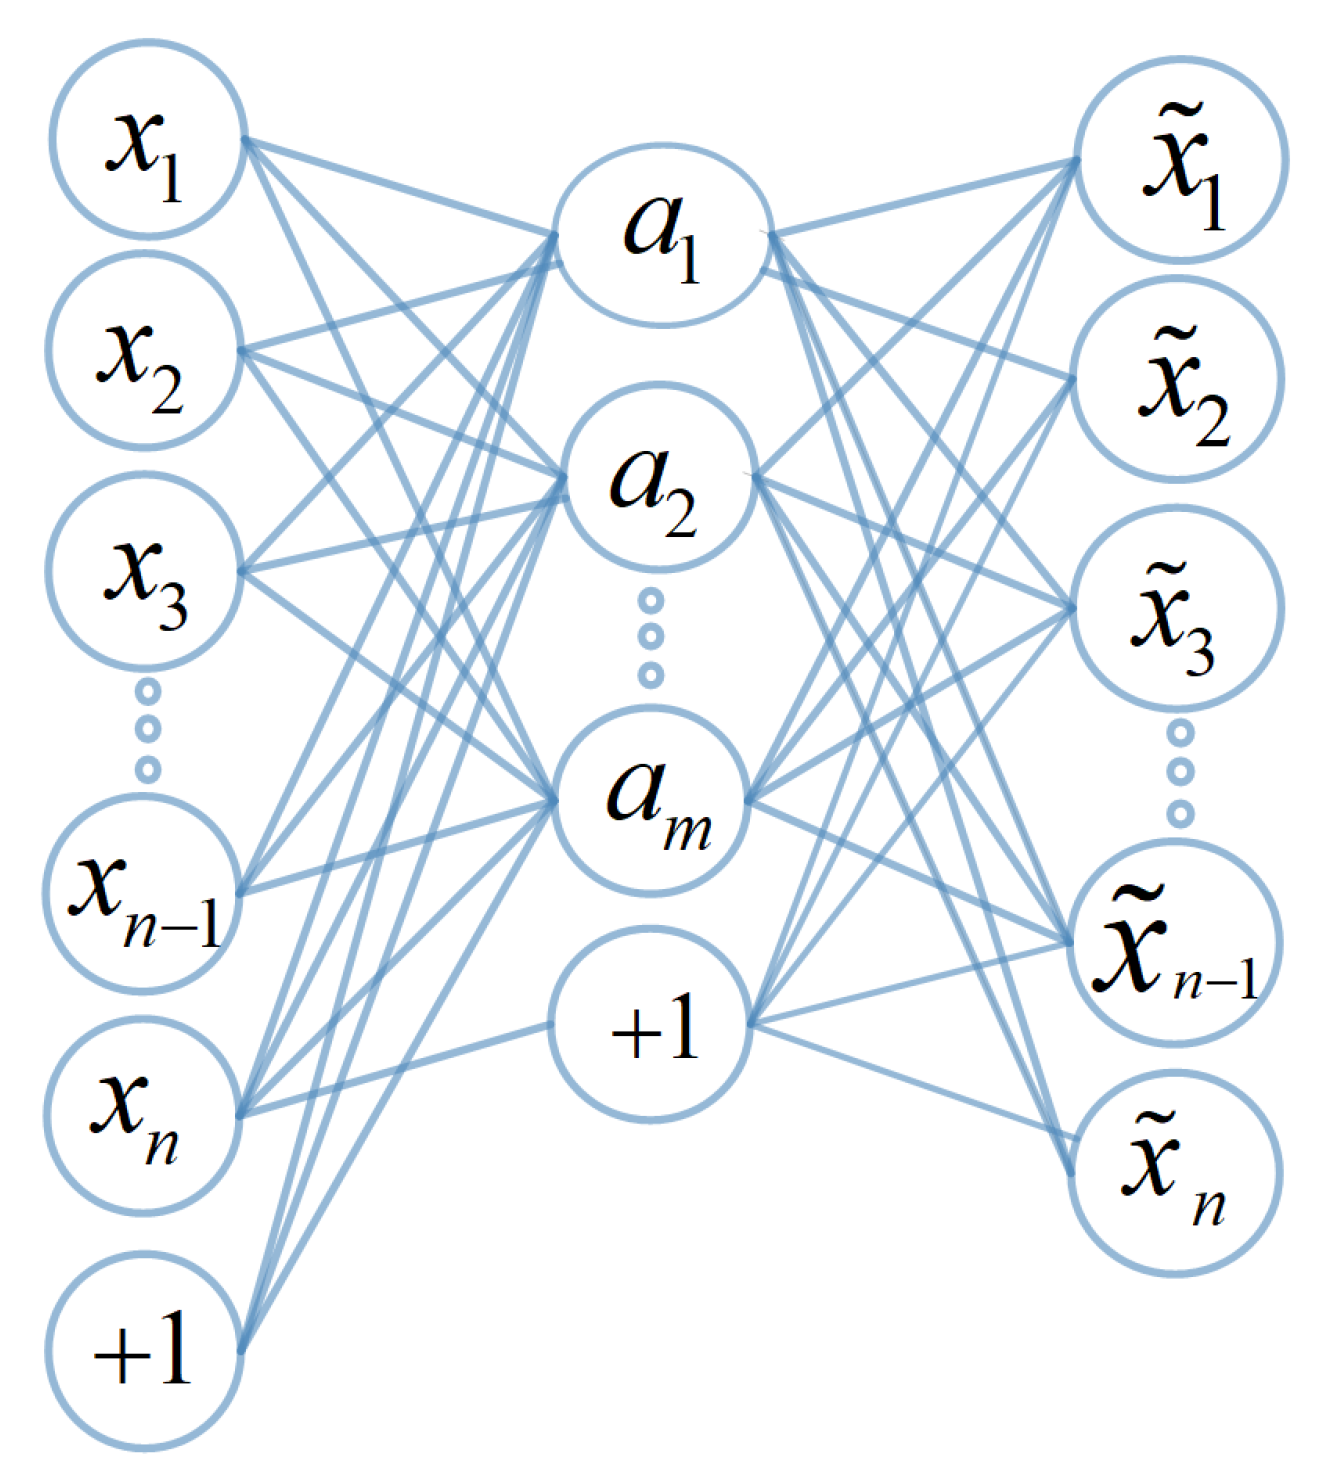
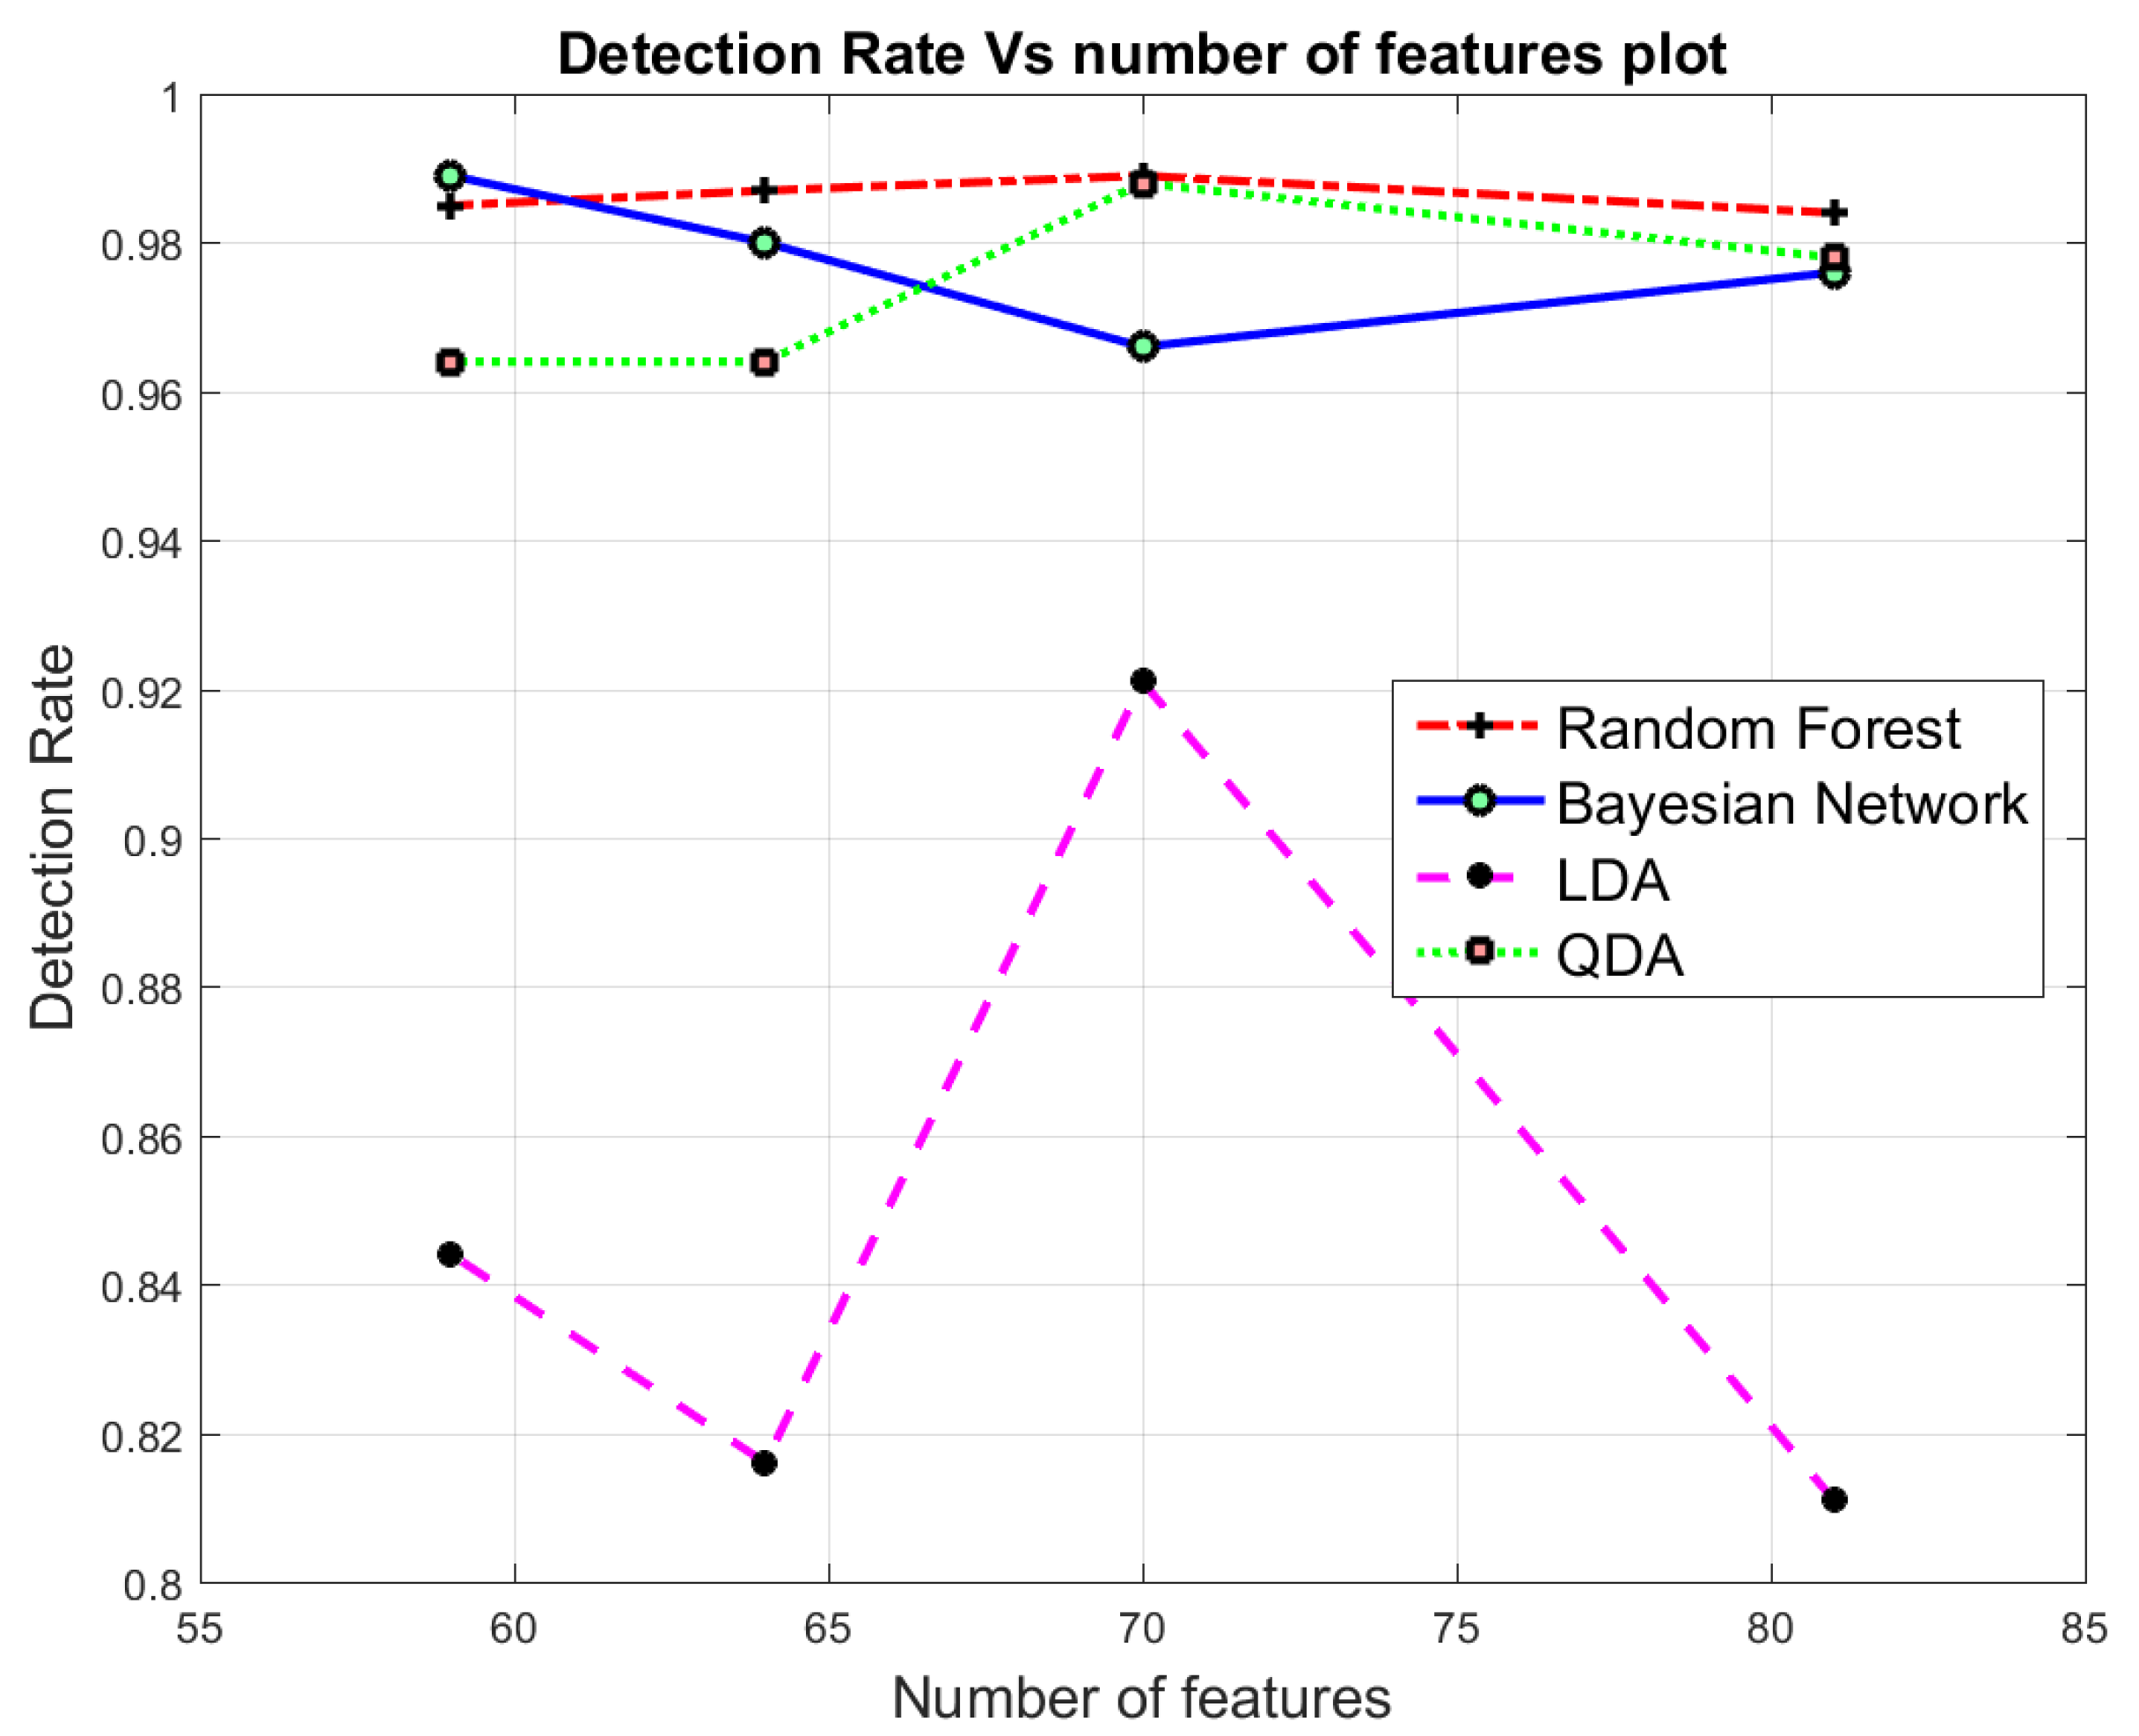
4.1. Auto-Encoder (AE) Based Dimensionality Reduction
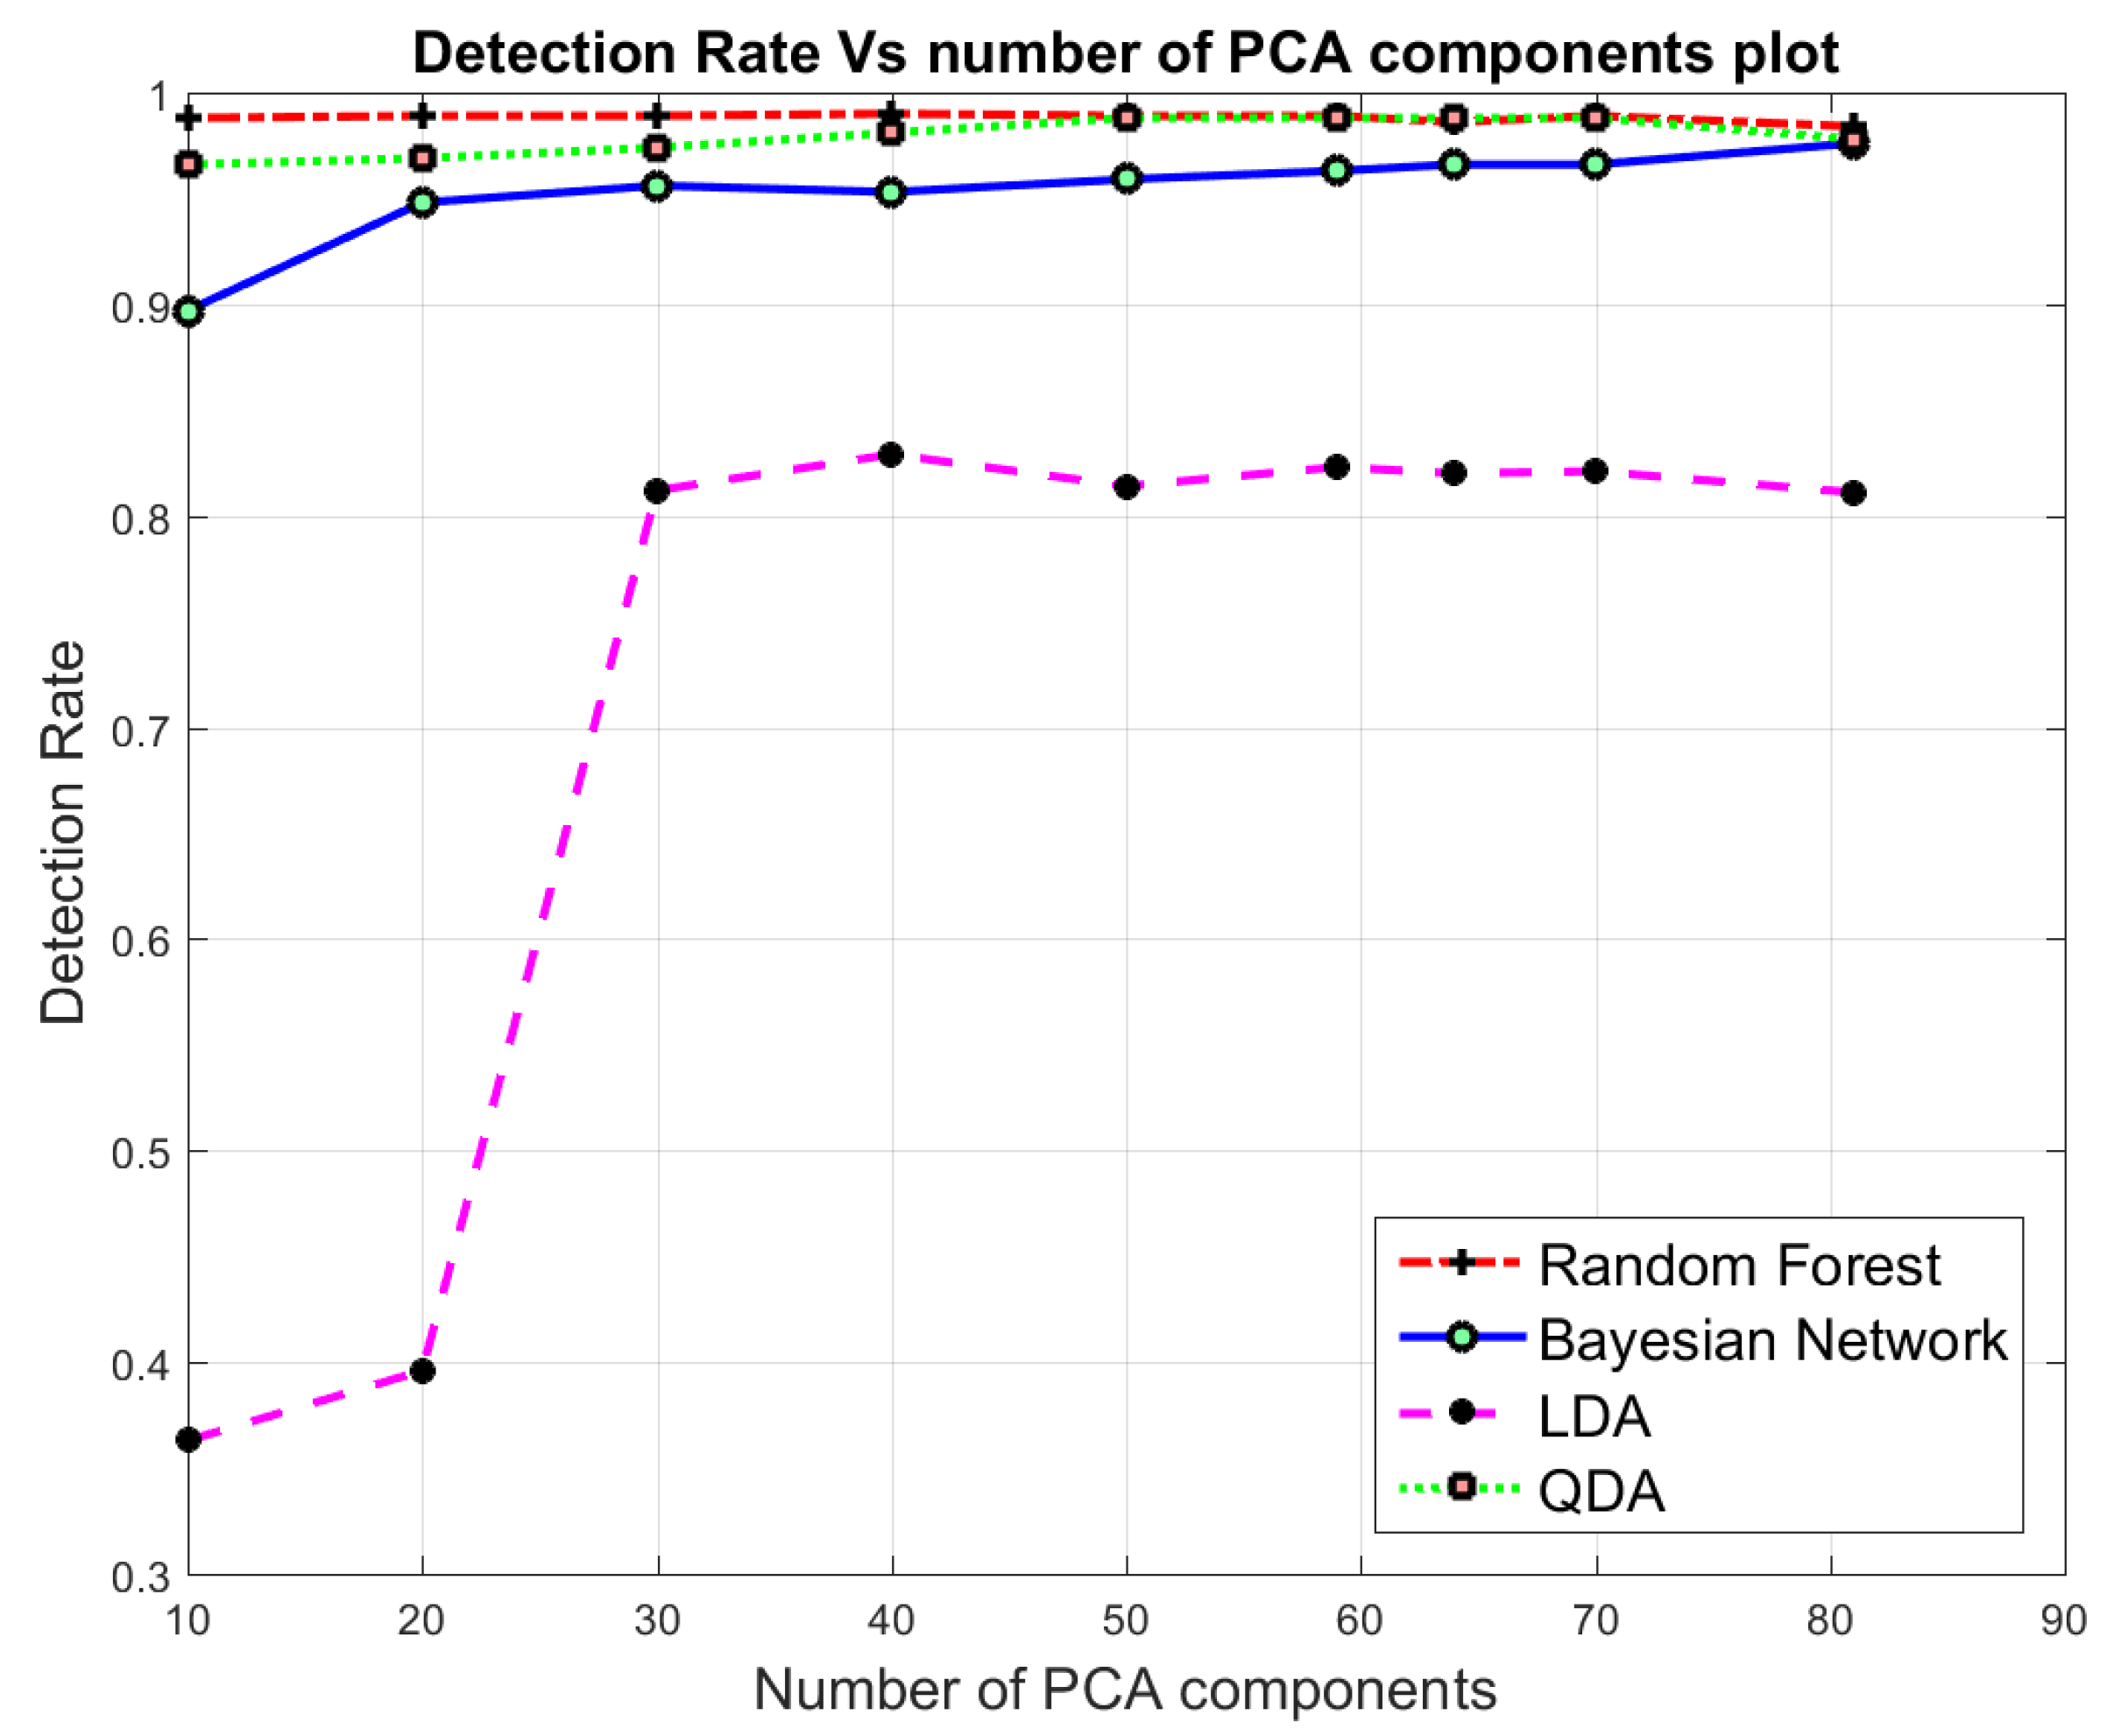
4.2. Principle Component Analysis (PCA) Based Dimensionality Reduction
- Normalize the the original feature values of data by its mean and variance using Equation (7), where m is the number of instances in the dataset and are the data points.
- Replace with .
- Rescale each vector to have unit variance using Equation (8).
- Replace each with .
- Compute the Covariance Matrix as follows:
- Calculate the Eigen-vectors and corresponding Eigen-values of .
- Sort the Eigen-vectors by decreasing the Eigen-values and choose k Eigen-vectors with the largest Eigen-values to form W.
- Use W to transform the samples onto the new subspace using Equation (10).where X is a dimensional vector representing one sample, and y is the transformed dimensional sample in the new subspace.
5. Performance Evaluation Metrics
- (1)
- False Alarm Rate (FAR) is a common term which encompasses the number of normal instances incorrectly classified by the classifier as an attack, and can be estimated through Equation (12).
- (2)
- Accuracy (Acc) is defined as the ability measure of the classifier to correctly classify an object as either normal or attack. The Accuracy can be defined using Equation (13).
- (3)
- Detection Rate (DR) indicates the number of attacks detected divided by the total number of attack instances in the dataset. DR can be estimated by Equation (14).
- (4)
- The F-measure (F-M) is a score of a classifier’s accuracy and is defined as the weighted harmonic mean of the Precision and Recall measures of the classifier. F-Measure is calculated using Equation (15).
- (5)
- Precision represents the number of positive predictions divided by the total number of positive class values predicted. It is considered as a measure for the classifier exactness. A low value indicates large number of False Positives. The precision is calculated using Equation (16).
- (6)
Proposed Multi-Class Combined Performance Metric with Respect to Class Distribution
6. Uniform Distribution Based Balancing (UDBB)
7. Results and Discussion
7.1. Preliminary Assumptions and Requirements
7.2. Binary class Classification
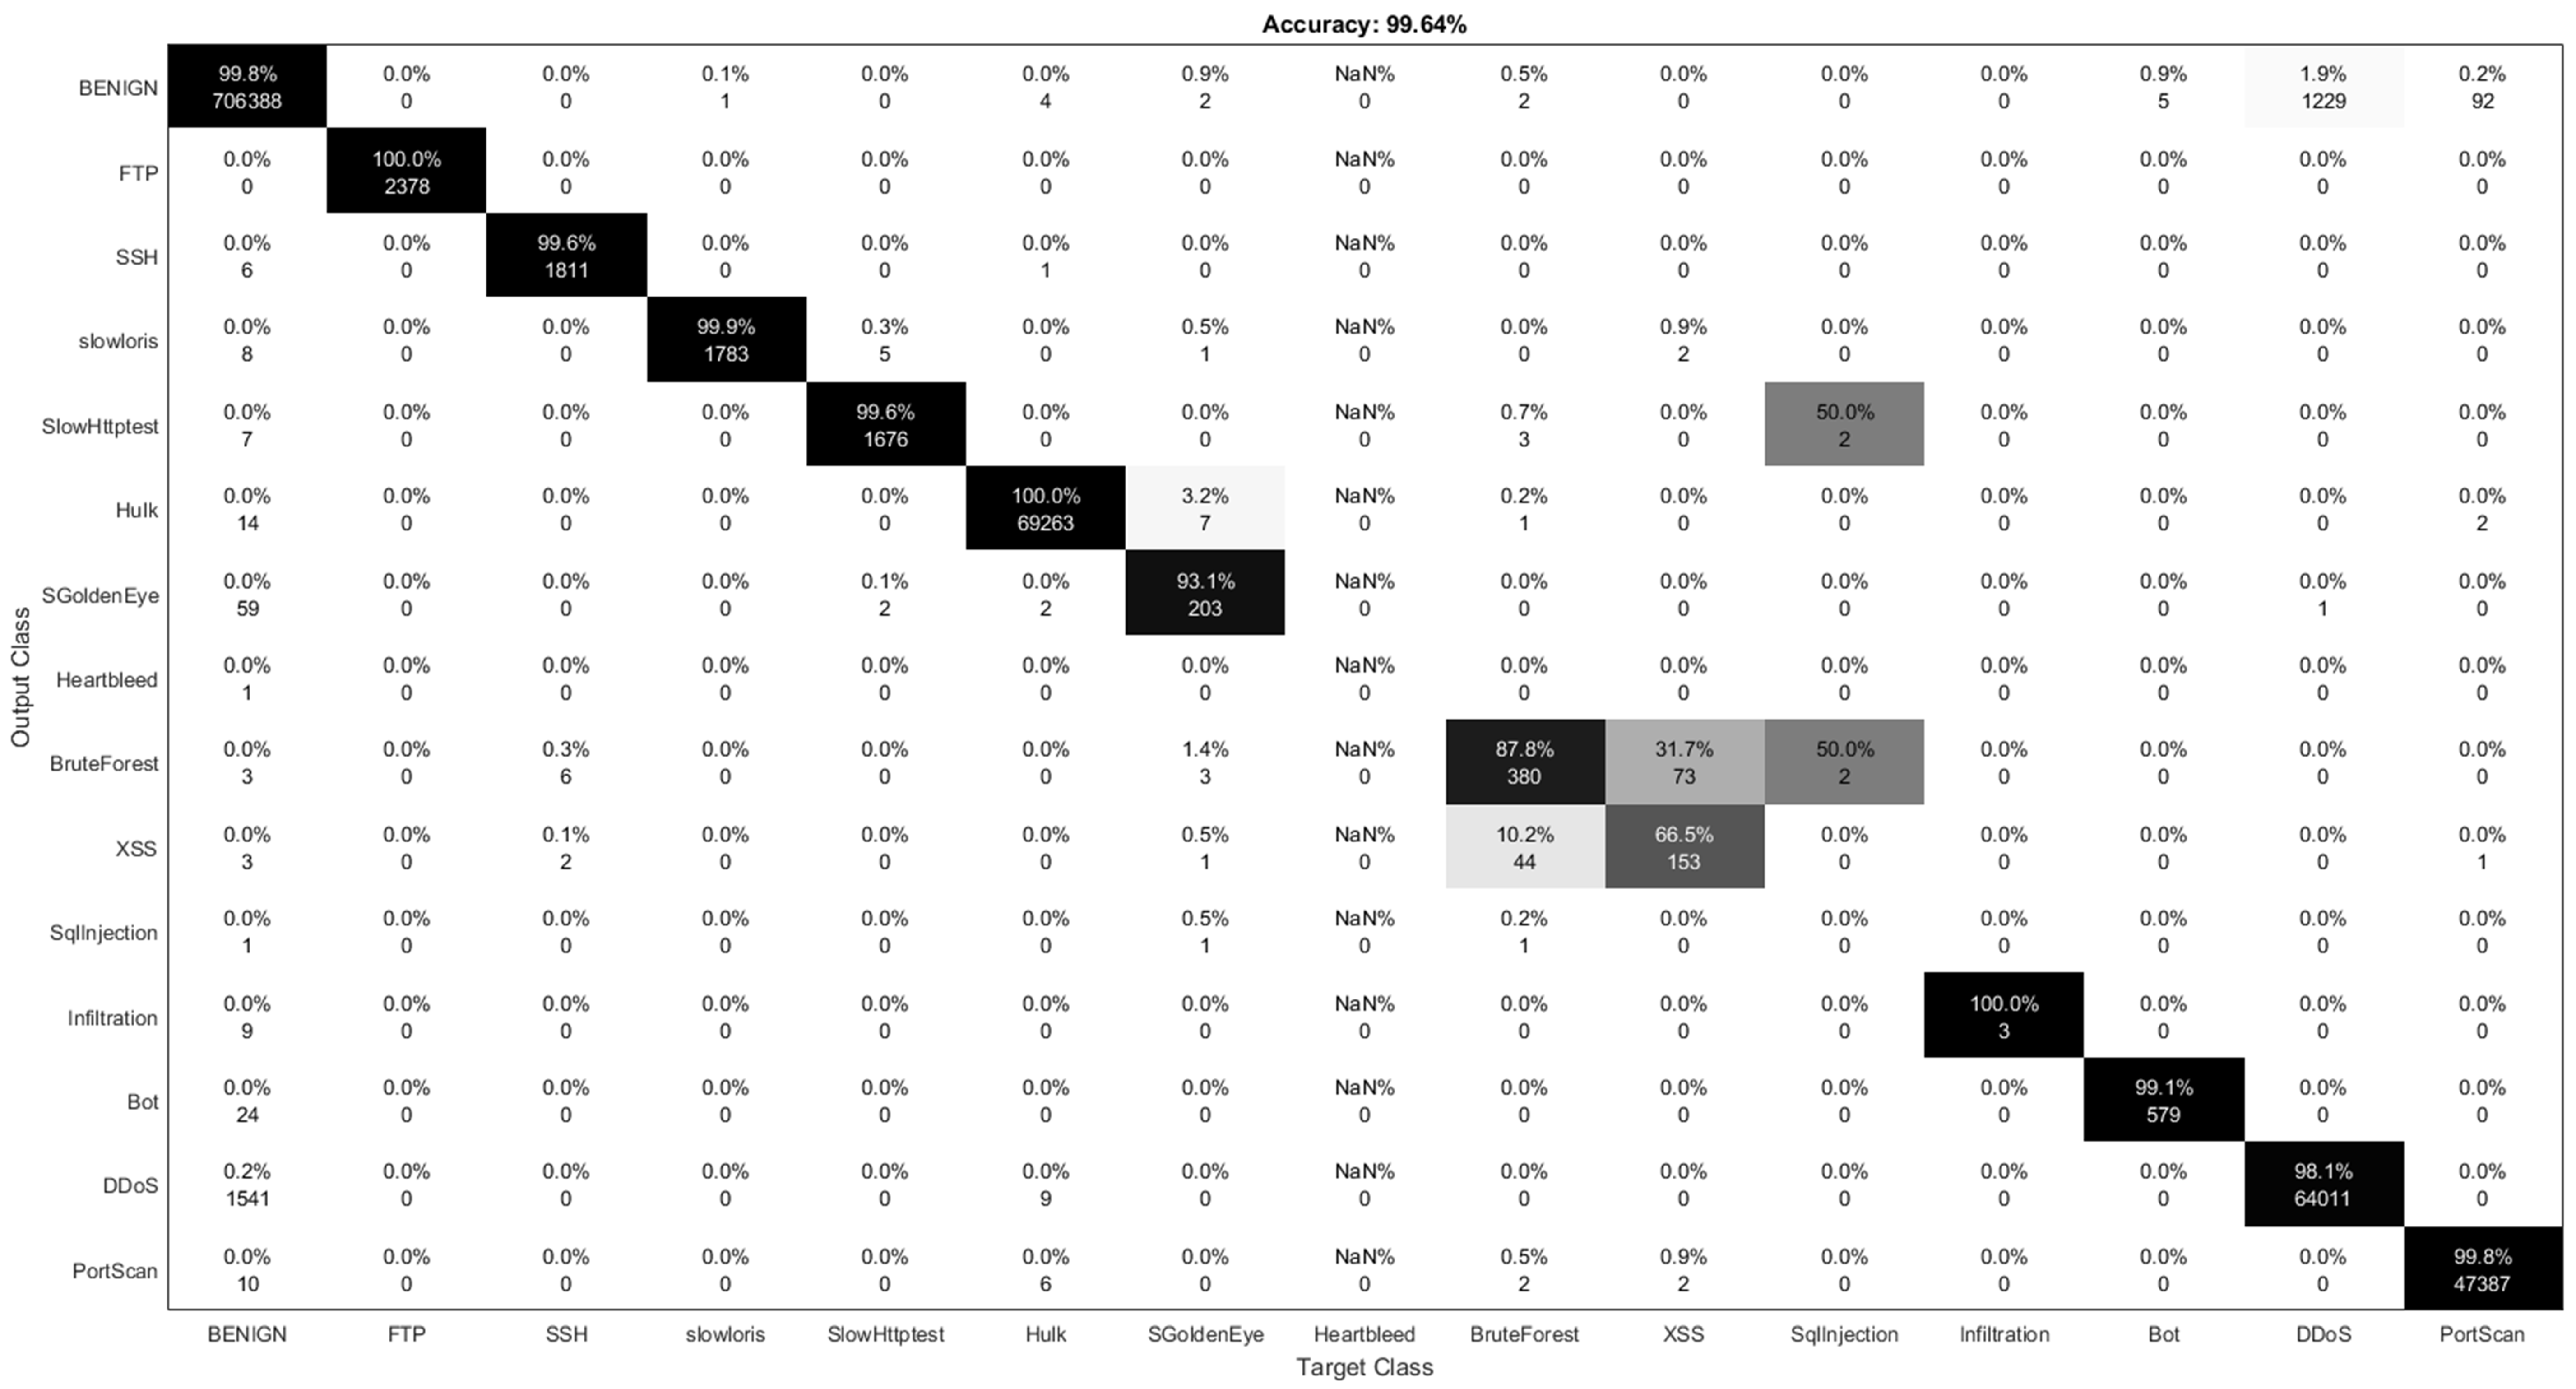
7.3. Multi-Class Classification
8. Challenges and Limitations
8.1. Fault Tolerance
8.2. Adaption to Non-Stationary Traffic/Nonlinear Models
8.3. Model Resilience
8.4. Ease of Dataset Acquisition/Model Building
8.5. Quality of Experience
9. Conclusion and Future Work
Author Contributions
Funding
Conflicts of Interest
Abbreviations
| IDS | Intrusion Detection System |
| CICIDS2017 | Canadian Institute for Cybersecurity Intrusion Detection System 2017 dataset |
| AE | Auto-Encoder |
| PCA | Principle Component Analysis |
| LDA | Linear Discriminant Analysis |
| QDA | Quadratic Discriminant analysis |
| UDBB | Uniform Distribution-Based Balancing |
| KNN | K-Nearest Neighbors |
| RF | Random Forest |
| SVM | Support Vector Machine |
| XGBoost | eXtreme Gradient Boosting |
| MLP | Multi Layer Perceptron |
| FFC | Forward Feature Construction |
| BFE | Backward Feature Elimination |
| Acc | Accuracy |
| FAR | False Alarm Rate |
| F-M | F-Measure |
| MCC | Matthews Correlation Coefficient |
| DR | Detection Rate |
| RR | Reduction Rate |
| ( | Auto-Encoder-Random Forest-Multi-Class |
| ( | Auto-Encoder-Linear Discriminant Analysis-Multi-Class |
| ( | Auto-Encoder-Quadratic Discriminant Analysis-Multi-Class |
| ( | Auto-Encoder-Bayesian Network-Multi-Class |
| ( | Auto-Encoder-Random Forest-Binary-Class |
| ( | Auto-Encoder-Linear Discriminant Analysis-Binary-Class |
| ( | Auto-Encoder-Quadratic Discriminant Analysis-Binary-Class |
| ( | Auto-Encoder-Bayesian Network-Binary-Class |
| ( | Principle Components Analysis-Random Forest-Multi-Class |
| ( | Principle Components Analysis-Linear Discriminant Analysis-Multi-Class |
| ( | Principle Components Analysis-Quadratic Discriminant Analysis-Multi-Class |
| ( | Principle Components Analysis-Bayesian Network-Multi-Class |
| ( | Principle Components Analysis-Random Forest-Binary-Class |
| ( | Principle Components Analysis-Linear Discriminant Analysis-Binary-Class |
| ( | Principle Components Analysis-Quadratic Discriminant Analysis-Binary-Class |
| ( | Principle Components Analysis-Bayesian Network-Binary-Class |
| Combined Metrics for Binary Class | |
| Combined Metrics for MultiClass |
References
- Albanese, M.; Erbacher, R.F.; Jajodia, S.; Molinaro, C.; Persia, F.; Picariello, A.; Sperlì, G.; Subrahmanian, V. Recognizing unexplained behavior in network traffic. In Network Science and Cybersecurity; Springer: Berlin, Germany, 2014; pp. 39–62. [Google Scholar]
- Abdulhammed, R.; Faezipour, M.; Elleithy, K. Intrusion Detection in Self organizing Network: A Survey. In Intrusion Detection and Prevention for Mobile Ecosystems; Kambourakis, G., Shabtai, A., Kolias, C., Damopoulos, D., Eds.; CRC Press Taylor & Francis Group: New York, NY, USA, 2017; Chapter 13; pp. 393–449. [Google Scholar]
- Lee, C.H.; Su, Y.Y.; Lin, Y.C.; Lee, S.J. Machine learning based network intrusion detection. In Proceedings of the 2017 2nd IEEE International Conference on Computational Intelligence and Applications (ICCIA), Beijing, China, 8–11 September 2017; pp. 79–83. [Google Scholar]
- Sharafaldin, I.; Lashkari, A.H.; Ghorbani, A.A. Toward generating a new intrusion detection dataset and intrusion traffic characterization. In Proceedings of the Fourth International Conference on Information Systems Security and Privacy, ICISSP, Funchal, Madeira, Portugal, 22–24 January 2018. [Google Scholar]
- Sorzano, C.O.S.; Vargas, J.; Montano, A.P. A survey of dimensionality reduction techniques. arXiv, 2014; arXiv:1403.2877. [Google Scholar]
- Fodor, I.K. A Survey of Dimension Reduction Techniques; Center for Applied Scientific Computing, Lawrence Livermore National Laboratory: Livermore, CA, USA, 2002; Volume 9, pp. 1–18. [Google Scholar]
- Rosaria, S.; Adae, I.; Aaron, H.; Michael, B. Seven Techniques for Dimensionality Reduction; KNIME: Zurich Switzerland, 2014. [Google Scholar]
- Van Der Maaten, L.; Postma, E.; Van den Herik, J. Dimensionality reduction: A comparative review. J. Mach. Learn. Res. 2009, 10, 66–71. [Google Scholar]
- Bertens, P. Rank Ordered Autoencoders. arXiv, 2016; arXiv:1605.01749. [Google Scholar]
- Vijayan, R.; Devaraj, D.; Kannapiran, B. Intrusion detection system for wireless mesh network using multiple support vector machine classifiers with genetic-algorithm-based feature selection. Comput. Secur. 2018, 77, 304–314. [Google Scholar] [CrossRef]
- Radford, B.J.; Richardson, B.D. Sequence Aggregation Rules for Anomaly Detection in Computer Network Traffic. arXiv, 2018; arXiv:1805.03735. [Google Scholar]
- Lavrova, D.; Semyanov, P.; Shtyrkina, A.; Zegzhda, P. Wavelet-analysis of network traffic time-series for detection of attacks on digital production infrastructure. SHS Web Conf. EDP Sci. 2018, 44, 00052. [Google Scholar] [CrossRef]
- Watson, G. A Comparison of Header and Deep Packet Features When Detecting Network Intrusions; Technical Report; University of Maryland: College Park, MD, USA, 2018. [Google Scholar]
- Aksu, D.; Üstebay, S.; Aydin, M.A.; Atmaca, T. Intrusion Detection with Comparative Analysis of Supervised Learning Techniques and Fisher Score Feature Selection Algorithm. In International Symposium on Computer and Information Sciences; Springer: Berlin, Germany, 2018; pp. 141–149. [Google Scholar]
- Marir, N.; Wang, H.; Feng, G.; Li, B.; Jia, M. Distributed Abnormal Behavior Detection Approach based on Deep Belief Network and Ensemble SVM using Spark. IEEE Access 2018. [Google Scholar] [CrossRef]
- Spark, A. PySpark 2.4.0 Documentation. 2018. Available online: https://spark.apache.org/docs/latest/api/python/index.html (accessed on 10 November 2018).
- Bansal, A. DDR Scheme and LSTM RNN Algorithm for Building an Efficient IDS. Master’s Thesis, Thapar Institute of Engineering and Technology, Punjab, India, 2018. [Google Scholar]
- Chen, T.; He, T.; Benesty, M. Xgboost: Extreme Gradient Boosting. R Package Version 0.4-2. 2015, pp. 1–4. Available online: http://cran.fhcrc.org/web/packages/xgboost/vignettes/xgboost.pdf (accessed on 11 March 2019).
- Hothorn, T.; Hornik, K.; Zeileis, A. Ctree: Conditional Inference Trees. The Comprehensive R Archive Network. 2015. Available online: https://cran.r-project.org/web/packages/partykit/vignettes/ctree.pdf (accessed on 23 January 2019).
- Aminanto, M.E.; Choi, R.; Tanuwidjaja, H.C.; Yoo, P.D.; Kim, K. Deep abstraction and weighted feature selection for Wi-Fi impersonation detection. IEEE Trans. Inf. Forensics Secur. 2018, 13, 621–636. [Google Scholar] [CrossRef]
- Zhu, J.; Ming, Y.; Song, Y.; Wang, S. Mechanism of situation element acquisition based on deep auto-encoder network in wireless sensor networks. Int. J. Distrib. Sens. Netw. 2017, 13. [Google Scholar] [CrossRef]
- Al-Qatf, M.; Lasheng, Y.; Alhabib, M.; Al-Sabahi, K. Deep Learning Approach Combining Sparse Autoen-coder with SVM for Network Intrusion Detection. IEEE Access 2018, 6, 52843–52856. [Google Scholar] [CrossRef]
- Tavallaee, M.; Bagheri, E.; Lu, W.; Ghorbani, A.A. Nsl-Kdd Dataset. 2012. Available online: http://www.unb.ca/research/iscx/dataset/iscx-NSL-KDD-dataset.html (accessed on 28 February 2016).
- Bay, S.D.; Kibler, D.; Pazzani, M.J.; Smyth, P. The UCI KDD archive of large data sets for data mining research and experimentation. ACM SIGKDD Explor. Newsl. 2000, 2, 81–85. [Google Scholar] [CrossRef]
- Javaid, A.; Niyaz, Q.; Sun, W.; Alam, M. A deep learning approach for network intrusion detection system. In Proceedings of the 9th EAI International Conference on Bio-inspired Information and Communications Technologies (formerly BIONETICS), ICST (Institute for Computer Sciences, Social-Informatics and Telecommunications Engineering), Cotonou, Benin, 24 May 2016; pp. 21–26. [Google Scholar]
- Min, E.; Long, J.; Liu, Q.; Cui, J.; Cai, Z.; Ma, J. SU-IDS: A Semi-supervised and Unsupervised Framework for Network Intrusion Detection. In International Conference on Cloud Computing and Security; Springer: Cham, Switzerland, 2018; pp. 322–334. [Google Scholar]
- Xia, D.; Yang, S.; Li, C. Intrusion Detection System Based on Principal Component Analysis and Grey Neural Networks. In Proceedings of the 2010 Second International Conference on Networks Security, Wireless Communications and Trusted Computing, Wuhan, Hubei, China, 24–25 April 2010; Volume 2, pp. 142–145. [Google Scholar] [CrossRef]
- Vasan, K.K.; Surendiran, B. Dimensionality reduction using Principal Component Analysis for network intrusion detection. Perspect. Sci. 2016, 8, 510–512. [Google Scholar] [CrossRef]
- Shiravi, A.; Shiravi, H.; Tavallaee, M.; Ghorbani, A.A. Toward developing a systematic approach to generate benchmark datasets for intrusion detection. Comput. Secur. 2012, 31, 357–374. [Google Scholar] [CrossRef]
- Aminanto, M.E.; Kim, K. Improving Detection of Wi-Fi Impersonation by Fully Unsupervised Deep Learning. In Proceedings of the Information Security Applications: 18th International Workshop (WISA 2017), Jeju Island, Korea, 24–26 August 2017. [Google Scholar]
- Aminanto, M.E.; Kim, K. Detecting Active Attacks in WiFi Network by Semi-supervised Deep Learning. In Proceedings of the Conference on Information Security and Cryptography 2017 Winter, Sochi, Russian Federation, 8–10 September 2017. [Google Scholar]
- Kolias, C.; Kambourakis, G.; Stavrou, A.; Gritzalis, S. Intrusion detection in 802.11 networks: Empirical evaluation of threats and a public dataset. IEEE Commun. Surv. Tutor. 2016, 18, 184–208. [Google Scholar] [CrossRef]
- Vilela, D.W.; Ed’Wilson, T.F.; Shinoda, A.A.; de Souza Araujo, N.V.; de Oliveira, R.; Nascimento, V.E. A dataset for evaluating intrusion detection systems in IEEE 802.11 wireless networks. In Proceedings of the 2014 IEEE Colombian Conference on Communications and Computing (COLCOM), Bogota, Colombia, 4–6 June 2014; pp. 1–5. [Google Scholar]
- Ring, M.; Wunderlich, S.; Grüdl, D.; Landes, D.; Hotho, A. Flow-based benchmark data sets for intrusion detection. In Proceedings of the 16th European Conference on Cyber Warfare and Security, Dublin, Ireland, 29–30 June 2017; pp. 361–369. [Google Scholar]
- Canadian Institute of Cybersecurity, University of New Brunswick. CICFlowMeter. 2017. Available online: https://www.unb.ca/cic/research/applications.html#CICFlowMeter (accessed on 23 January 2019).
- CIC. Canadian Institute of Cybersecurity. List of Extracted Traffic Features by CICFlowMeter-V3. 2017. Available online: https://www.unb.ca/cic/datasets/ids-2017.html (accessed on 23 January 2019).
- Kingma, D.P.; Welling, M. Auto-encoding variational bayes. arXiv, 2013; arXiv:1312.6114. [Google Scholar]
- Rezende, D.J.; Mohamed, S.; Wierstra, D. Stochastic backpropagation and approximate inference in deep generative models. arXiv, 2014; arXiv:1401.4082. [Google Scholar]
- Sakurada, M.; Yairi, T. Anomaly detection using autoencoders with nonlinear dimensionality reduction. In Proceedings of the MLSDA 2014 2nd Workshop on Machine Learning for Sensory Data Analysis, Gold Coast, QLD, Australia, 2 December 2014; p. 4. [Google Scholar]
- Makhzani, A. Unsupervised Representation Learning with Autoencoders. Ph.D. Thesis, University of Toronto, Toronto, ON, Canada, 2018. [Google Scholar]
- Mirsky, Y.; Doitshman, T.; Elovici, Y.; Shabtai, A. Kitsune: An ensemble of autoencoders for online network intrusion detection. arXiv, 2018; arXiv:1802.09089. [Google Scholar]
- Johnstone, I.M.; Lu, A.Y. Sparse principal components analysis. arXiv, 2009; arXiv:0901.4392. [Google Scholar]
- Espíndola, R.; Ebecken, N. On extending f-measure and g-mean metrics to multi-class problems. WIT Trans. Inf. Commun. Technol. 2005, 35. [Google Scholar] [CrossRef]
- García, V.; Sánchez, J.S.; Mollineda, R.A. On the effectiveness of preprocessing methods when dealing with different levels of class imbalance. Knowl.-Based Syst. 2012, 25, 13–21. [Google Scholar] [CrossRef]
- Hamed, T.; Dara, R.; Kremer, S.C. Network intrusion detection system based on recursive feature addition and bigram technique. Comput. Secur. 2018, 73, 137–155. [Google Scholar] [CrossRef]
- Bermejo, P.; Gámez, J.A.; Puerta, J.M. Improving the performance of Naive Bayes multinomial in e-mail foldering by introducing distribution-based balance of datasets. Expert Syst. Appl. 2011, 38, 2072–2080. [Google Scholar] [CrossRef]
- Abdulhammed, R.; Faezipour, M.; Abuzneid, A.; AbuMallouh, A. Deep and Machine Learning Approaches for Anomaly-Based Intrusion Detection of Imbalanced Network Traffic. IEEE Sens. Lett. 2019, 3, 7101404. [Google Scholar] [CrossRef]
- Louppe, G. Understanding Random Forests: From Theory to Practice. Ph.D. Thesis, University of Liège, Belgium, 2014. [Google Scholar]
- Aksu, D.; Aydin, M.A. Detecting Port Scan Attempts with Comparative Analysis of Deep Learning and Support Vector Machine Algorithms. In Proceedings of the 2018 International Congress on Big Data, Deep Learning and Fighting Cyber Terrorism (IBIGDELFT), Ankara, Turkey, 3–4 December 2018; pp. 77–80. [Google Scholar]
- Ustebay, S.; Turgut, Z.; Aydin, M.A. Intrusion Detection System with Recursive Feature Elimination by Using Random Forest and Deep Learning Classifier. In Proceedings of the 2018 International Congress on Big Data, Deep Learning and Fighting Cyber Terrorism (IBIGDELFT), Ankara, Turkey, 3–4 December 2018; pp. 71–76. [Google Scholar]
- Bansal, A.; Kaur, S. Extreme Gradient Boosting Based Tuning for Classification in Intrusion Detection Systems. In International Conference on Advances in Computing and Data Sciences; Springer: Singapore, 2018; pp. 372–380. [Google Scholar]
- Kaur, P.; Rattan, D.; Bhardwaj, A.K. An analysis of mechanisms for making ids fault tolerant. Int. J. Comput. Appl. 2010, 1, 22–25. [Google Scholar] [CrossRef]
- Viegas, E.; Santin, A.; Neves, N.; Bessani, A.; Abreu, V. A Resilient Stream Learning Intrusion Detection Mechanism for Real-time Analysis of Network Traffic. In Proceedings of the GLOBECOM 2017—2017 IEEE Global Communications Conference, Singapore, 4–8 December 2017; pp. 1–6. [Google Scholar]
- Al-Shehri, S.M.; Loskot, P.; Numanoglu, T.; Mert, M. Common Metrics for Analyzing, Developing and Managing Telecommunication Networks. arXiv, 2017; arXiv:1707.03290. [Google Scholar]
- Belgiu, M.; Drăguţ, L. Random forest in remote sensing: A review of applications and future directions. ISPRS J. Photogramm. Remote Sens. 2016, 114, 24–31. [Google Scholar] [CrossRef]


| Technique | Computational | Memory | Pros | Cons |
|---|---|---|---|---|
| Complexity | Complexity | |||
| PCA | Can deal with large datasets; fast run time | Hard to model nonlinear structures | ||
| AE | Can model linear and nonlinear structures | Slow run time; prone to overfitting |
| Traffic Type | Size | Description |
|---|---|---|
| Benign | 2,358,036 | Normal traffic behavior |
| DoS Hulk | 231,073 | The attacker employs the HULK tool to carry out a denial of service attack on a web server through generating |
| volumes of unique and obfuscated traffic. Moreover, the generated traffic can bypass caching engines and strike | ||
| a server’s direct resource pool | ||
| Port Scan | 158,930 | The attacker tries to gather information related to the victim machine such as type of operating system |
| and running service by sending packets with varying destination ports | ||
| DDoS | 41,835 | The attacker uses multiple machines that operate together to attack one victim machine |
| DoS GoldenEye | 10,293 | The attacker uses the GoldenEye tool to perform a denial of service attack |
| FTP Patator | 7938 | The attacker uses FTP Patator in an attempt to perform a brute force attack to guess the FTP login password |
| SSH Patator | 5897 | The attacker uses SSH Patator in an attempt to perform a brute force attack to guess the SSH login Password |
| DoS Slow Loris | 5796 | The attacker uses the Slow Loris tool to execute a denial of service attack |
| DoS Slow HTTP Test | 5499 | The attacker exploits the HTTP Get request to exceed the number of HTTP connections allowed on |
| a server, preventing other clients from accessing and giving the attacker the opportunity to open multiple | ||
| HTTP connections to the same server | ||
| Botnet | 1966 | The attacker uses trojans to breach the security of several victim machines, taking control of these machines |
| and organizes all machines in the network of Bot that can be exploited and managed remotely by the attacker | ||
| Web Attack: Brute Force | 1507 | The attacker tries to obtain privilege information such as password and Personal Identification Number (PIN) |
| using trial-and-error | ||
| Web Attack: XSS | 625 | The attacker injects into otherwise benign and trusted websites using a web application that sends malicious scripts |
| Infiltration | 36 | The attacker uses infiltration methods and tools to infiltrate and gain full unauthorized access to the networked |
| system data | ||
| Web Attack: SQL Injection | 21 | SQL injection is a code injection technique, used to attack data-driven applications, |
| in which nefarious SQL statements are inserted into an entry field for execution | ||
| HeartBleed | 11 | The attacker exploits the OpenSSL protocol to insert malicious information into OpenSSL memory, |
| enabling the attacker with unauthorized access to valuable information |
| No. | Feature | No. | Feature | No. | Feature |
|---|---|---|---|---|---|
| 1 | Flow ID | 29 | Fwd IAT Std | 57 | ECE Flag Count |
| 2 | Source IP | 30 | Fwd IAT Max | 58 | Down/Up Ratio |
| 3 | Source Port | 31 | Fwd IAT Min | 59 | Average Packet Size |
| 4 | Destination IP | 32 | Bwd IAT Total | 60 | Avg Fwd Segment Size |
| 5 | Destination Port | 33 | Bwd IAT Mean | 61 | Avg Bwd Segment Size |
| 6 | Protocol | 34 | Bwd IAT Std | 62 | Fwd Avg Bytes/Bulk |
| 7 | Time stamp | 35 | Bwd IAT Max | 63 | Fwd Avg Packets/Bulk |
| 8 | Flow Duration | 36 | Bwd IAT Min | 64 | Fwd Avg Bulk Rate |
| 9 | Total Fwd Packets | 37 | Fwd PSH Flags | 65 | Bwd Avg Bytes/Bulk |
| 10 | Total Backward Packets | 38 | Bwd PSH Flags | 66 | Bwd Avg Packets/Bulk |
| 11 | Total Length of Fwd Pck | 39 | Fwd URG Flags | 67 | Bwd Avg Bulk Rate |
| 12 | Total Length of Bwd Pck | 40 | Bwd URG Flags | 68 | Subflow Fwd Packets |
| 13 | Fwd Packet Length Max | 41 | Fwd Header Length | 69 | Subflow Fwd Bytes |
| 14 | Fwd Packet Length Min | 42 | Bwd Header Length | 70 | Subflow Bwd Packets |
| 15 | Fwd Pck Length Mean | 43 | Fwd Packets/s | 71 | Subflow Bwd Bytes |
| 16 | Fwd Packet Length Std | 44 | Bwd Packets/s | 72 | Init_Win_bytes_fwd |
| 17 | Bwd Packet Length Max | 45 | Min Packet Length | 73 | Act_data_pkt_fwd |
| 18 | Bwd Packet Length Min | 46 | Max Packet Length | 74 | Min_seg_size_fwd |
| 19 | Bwd Packet Length Mean | 47 | Packet Length Mean | 75 | Active Mean |
| 20 | Bwd Packet Length Std | 48 | Packet Length Std | 76 | Active Std |
| 21 | Flow Bytes/s | 49 | Packet Len. Variance | 77 | Active Max |
| 22 | Flow Packets/s | 50 | FIN Flag Count | 78 | Active Min |
| 23 | Flow IAT Mean | 51 | SYN Flag Count | 79 | Idle Mean |
| 24 | Flow IAT Std | 52 | RST Flag Count | 80 | Idle Packet |
| 25 | Flow IAT Max | 53 | PSH Flag Count | 81 | Idle Std |
| 26 | Flow IAT Min | 54 | ACK Flag Count | 82 | Idle Max |
| 27 | Fwd IAT Total | 55 | URG Flag Count | 83 | Idle Min |
| 28 | Fwd IAT Mean | 56 | CWE Flag Count | 84 | Label |
| Dimensionality Reduction Using AE |
|---|
| Training: |
| 1. Perform the feedforward pass on all the training |
| instances and compute |
| Equation (2) |
| 2. Compute the output, sparsity mean, |
| and the error of the cost function |
| Equation (3) |
| Equation (4) |
| 3. Compute the cost function of the sparse auto-encoder |
| Equation (5) |
| 4. Backpropagate the error to update the weights and |
| the bias for all the layers |
| Dimensionality Reduction: |
| Compute the reduced features from the hidden layer |
| Equation (2) |
| Parameters | Value | Description |
|---|---|---|
| 0.0008 | Weight decay | |
| 6 | Sparsity penalty | |
| 0.05 | Sparsity parameter |
| Calculate with respect to Class Distribution |
|---|
| Feed Confusion Matrix CM |
| For i =1 to C |
| Calculate the total number of FP for as the sum of values in the column excluding TP |
| Calculate the total number of FN for as the sum of values in the row excluding TP |
| Calculate the total number of TN for as the sum of all columns and rows excluding the row and column |
| Calculate the total number of TP for as the diagonal of the cell of CM |
| Calculate the total number of instances for as the sum of the row |
| Calculate the total number of instances in the dataset as the sum of all rows |
| Calculate Acc using Equation (13), DR using Equation (14), and FAR using Equation (12) for each class |
| Calculate the distribution of each using Equation (19) |
| i ++ |
| Calculate using Equation (18) |
| Input Training Set: Set Distribution to Uniform C: Number of Classes : Total number of features in Training Set : Total number of Instances in Calculate the required number of Instances in each class: |
| For each class Do |
| While |
| For each feature |
| Generate new sample using uniform distribution |
| Assign Class label |
| Return |
| ( | ( | ( | ( | |||||||||||||||||
|---|---|---|---|---|---|---|---|---|---|---|---|---|---|---|---|---|---|---|---|---|
| Acc | FAR | DR | F-M | Acc | FAR | DR | F-M | Acc | FAR | DR | F-M | Acc | FAR | DR | F-M | |||||
| 81 | 0.995 | 0.002 | 0.984 | 0.996 | 0.987 | 0.975 | 0.025 | 0.976 | 0.976 | 0.951 | 0.937 | 0.254 | 0.811 | 0.937 | 0.846 | 0.782 | 0.237 | 0.978 | 0.807 | 0.632 |
| 70 | 0.997 | 0.001 | 0.989 | 0.997 | 0.991 | 0.970 | 0.029 | 0.966 | 0.970 | 0.938 | 0.947 | 0.274 | 0.821 | 0.947 | 0.856 | 0.792 | 0.247 | 0.988 | 0.817 | 0.642 |
| 64 | 0.996 | 0.002 | 0.986 | 0.996 | 0.988 | 0.969 | 0.029 | 0.966 | 0.970 | 0.968 | 0.947 | 0.027 | 0.820 | 0.947 | 0.466 | 0.793 | 0.245 | 0.988 | 0.818 | 0.891 |
| 59 | 0.997 | 0.0017 | 0.989 | 0.997 | 0.991 | 0.968 | 0.030 | 0.963 | 0.969 | 0.934 | 0.947 | 0.027 | 0.823 | 0.947 | 0.858 | 0.794 | 0.244 | 0.988 | 0.819 | 0.646 |
| 50 | 0.996 | 0.0017 | 0.989 | 0.997 | 0.991 | 0.971 | 0.025 | 0.959 | 0.972 | 0.939 | 0.945 | 0.028 | 0.814 | 0.945 | 0.880 | 0.809 | 0.226 | 0.988 | 0.832 | 0.898 |
| 40 | 0.997 | 0.001 | 0.990 | 0.997 | 0.991 | 0.974 | 0.021 | 0.953 | 0.974 | 0.941 | 0.944 | 0.032 | 0.829 | 0.945 | 0.856 | 0.808 | 0.226 | 0.981 | 0.831 | 0.646 |
| 30 | 0.997 | 0.001 | 0.989 | 0.997 | 0.990 | 0.979 | 0.026 | 0.956 | 0.971 | 0.703 | 0.944 | 0.030 | 0.821 | 0.945 | 0.852 | 0.830 | 0.198 | 0.974 | 0.849 | 0.703 |
| 20 | 0.996 | 0.001 | 0.989 | 0.997 | 0.991 | 0.965 | 0.031 | 0.948 | 0.966 | 0.926 | 0.878 | 0.025 | 0.396 | 0.862 | 0.612 | 0.717 | 0.332 | 0.969 | 0.754 | 0.511 |
| 10 | 0.996 | 0.001 | 0.988 | 0.997 | 0.991 | 0.952 | 0.036 | 0.897 | 0.953 | 0.889 | 0.869 | 0.028 | 0.363 | 0.852 | 0.588 | 0.712 | 0.048 | 0.966 | 0.749 | 0.911 |
| ( | ( | ( | ( | |||||||||||||||||
|---|---|---|---|---|---|---|---|---|---|---|---|---|---|---|---|---|---|---|---|---|
| Acc | FAR | DR | F-M | Acc | FAR | DR | F-M | Acc | FAR | DR | F-M | Acc | FAR | DR | F-M | |||||
| 81 | 0.995 | 0.002 | 0.984 | 0.996 | 0.987 | 0.975 | 0.025 | 0.976 | 0.976 | 0.951 | 0.937 | 0.254 | 0.811 | 0.937 | 0.846 | 0.782 | 0.237 | 0.978 | 0.807 | 0.632 |
| 70 | 0.997 | 0.001 | 0.989 | 0.997 | 0.991 | 0.970 | 0.029 | 0.966 | 0.970 | 0.938 | 0.947 | 0.274 | 0.921 | 0.947 | 0.856 | 0.792 | 0.247 | 0.988 | 0.817 | 0.642 |
| 64 | 0.996 | 0.002 | 0.987 | 0.996 | 0.973 | 0.974 | 0.026 | 0.980 | 0.975 | 0.948 | 0.947 | 0.027 | 0.816 | 0.946 | 0.854 | 0.935 | 0.070 | 0.964 | 0.939 | 0.894 |
| 59 | 0.995 | 0.002 | 0.985 | 0.996 | 0.988 | 0.975 | 0.027 | 0.989 | 0.976 | 0.955 | 0.948 | 0.030 | 0.844 | 0.949 | 0.866 | 0.942 | 0.063 | 0.964 | 0.944 | 0.890 |
| Acc | F-M | Acc | F-M | Acc | F-M | Acc | F-M | |||||
|---|---|---|---|---|---|---|---|---|---|---|---|---|
| 81 | 0.985 | 0.995 | 0.986 | 0.930 | 0.953 | 0.925 | 0.901 | 0.914 | 0.801 | 0.972 | 0.974 | 0.961 |
| 70 | 0.996 | 0.988 | 0.988 | 0.948 | 0.964 | 0.942 | 0.894 | 0.906 | 0.735 | 0.967 | 0.975 | 0.967 |
| 64 | 0.996 | 0.997 | 0.986 | 0.949 | 0.966 | 0.955 | 0.893 | 0.906 | 0.745 | 0.967 | 0.975 | 0.985 |
| 59 | 0.996 | 0.995 | 0.987 | 0.952 | 0.967 | 0.917 | 0.893 | 0.906 | 0.677 | 0.967 | 0.975 | 0.880 |
| 50 | 0.996 | 0.996 | 0.987 | 0.924 | 0.941 | 0.916 | 0.859 | 0.880 | 0.679 | 0.927 | 0.946 | 0.885 |
| 40 | 0.996 | 0.997 | 0.9884 | 0.964 | 0.974 | 0.954 | 0.890 | 0.546 | 0.727 | 0.966 | 0.974 | 0.967 |
| 30 | 0.996 | 0.997 | 0.988 | 0.960 | 0.971 | 0.897 | 0.643 | 0.643 | 0.720 | 0.964 | 0.972 | 0.965 |
| 20 | 0.996 | NAN | 0.987 | 0.987 | 0.952 | 0.855 | 0.859 | NAN | 0.4805 | 0.892 | 0.886 | 0.886 |
| 10 | 0.996 | NAN | 0.986 | 0.953 | 0.964 | 0.946 | 0.850 | NAN | 0.363 | 0.856 | 0.886 | 0.886 |
| Acc | F-M | Acc | F-M | Acc | F-M | Acc | F-M | |||||
|---|---|---|---|---|---|---|---|---|---|---|---|---|
| 81 | 0.985 | 0.995 | 0.983 | 0.930 | 0.953 | 0.895 | 0.912 | 0.922 | 0.908 | 0.968 | 0.969 | 0.920 |
| 70 | 0.996 | 0.996 | 0.959 | 0.953 | 0.996 | 0.913 | 0.894 | 0.906 | 0.875 | 0.960 | 0.970 | 0.931 |
| 64 | 0.996 | 0.996 | 0.985 | 0.955 | 0.968 | 0.954 | 0.900 | 0.908 | 0.743 | 0.960 | 0.969 | 0.963 |
| 59 | 0.995 | 0.995 | 0.983 | 0.956 | 0.969 | 0.958 | 0.849 | 0.906 | 0.737 | 0.961 | 0.969 | 0.963 |
| ( Original Distribution | ||||
|---|---|---|---|---|
| Recall | Precision | FP Rate | TP Rate | |
| Benign | 0.998 | 0.998 | 0.012 | 0.998 |
| FTP-Patator | 1.000 | 1.000 | 0.000 | 1.000 |
| SSH-Patator | 0.996 | 0.996 | 0.000 | 0.996 |
| DDoS | 0.877 | 0.900 | 0.001 | 0.877 |
| HeartBleed | NAN | NAN | 0.000 | 0.000 |
| PortScan | 1.000 | 0.998 | 0.000 | 1.000 |
| DoSHulk | 1.000 | 1.000 | 0.000 | 1.000 |
| DoSGoldenEye | 0.979 | 0.995 | 0.000 | 0.979 |
| WebAttack: Brute Force | 0.813 | 0.878 | 0.000 | 0.814 |
| WebAttack:XSS | 0.750 | 0.665 | 0.000 | 0.750 |
| Infiltration | 0.250 | 1.000 | 0.000 | 0.250 |
| WebAttack:SQL | 0.000 | 0.000 | 0.000 | 0.000 |
| Botnet | 0.960 | 0.991 | 0.000 | 0.960 |
| Dos Slow HTTP Test | 0.993 | 0.996 | 0.000 | 0.993 |
| DoS Slow Loris | 0.991 | 0.999 | 0.000 | 0.991 |
| Weighted Average | 0.996 | 0.965 | 0.010 | 0.996 |
| ( UDBB | ||||
|---|---|---|---|---|
| Recall | Precision | FP Rate | TP Rate | |
| Benign | 1.000 | 1.000 | 0.000 | 1.000 |
| FTP-Patator | 1.000 | 1.000 | 0.000 | 1.000 |
| SSH-Patator | 1.000 | 1.000 | 0.000 | 1.000 |
| DDoS | 1.000 | 1.000 | 0.000 | 1.000 |
| HeartBleed | 1.000 | 1.000 | 0.000 | 1.000 |
| PortScan | 1.000 | 0.999 | 0.000 | 1.000 |
| DoSHulk | 0.999 | 1.000 | 0.000 | 0.999 |
| DoSGoldenEye | 1.000 | 1.000 | 0.000 | 1.000 |
| WebAttack: Brute Force | 0.945 | 0.891 | 0.008 | 0.945 |
| WebAttack:XSS | 0.884 | 0.943 | 0.004 | 0.884 |
| Infiltration | 1.000 | 1.000 | 0.000 | 1.000 |
| WebAttack:SQL | 1.000 | 0.998 | 0.000 | 1.000 |
| Botnet | 1.000 | 1.000 | 0.000 | 1.000 |
| Dos Slow HTTP Test | 0.999 | 0.999 | 0.000 | 0.999 |
| DoS Slow Loris | 0.999 | 0.999 | 0.000 | 0.999 |
| Weighted Average | 0.988 | 0.989 | 0.001 | 0.988 |
| Classifier | Acc | F-M | |
|---|---|---|---|
| Before applying UDBB | |||
| PCA-Random Forest ( | 0.996 | NAN | 0.9866 |
| PCA-Bayesian Network ( | 0.953 | 0.964 | 0.9464 |
| PCA-LDA ( | 0.850 | NAN | 0.3626 |
| PCA-QDA ( | 0.856 | 0.886 | 0.8862 |
| After applying UDBB | |||
| PCA-Random Forest ( | 0.988 | 0.988 | 0.9882 |
| PCA-Bayesian Network ( | 0.976 | 0.977 | 0.9839 |
| PCA-LDA ( | 0.957 | 0.957 | 0.6791 |
| PCA-QDA ( | 0.989 | 0.990 | 0.8851 |
| Classifier | Time to Build the Model (Sec.) | Time to Test the Model (Sec.) |
|---|---|---|
| Binary-class Classification | ||
| LDA | 12.16 | 5.56 |
| QDA | 12.84 | 6.57 |
| RF | 752.67 | 21.52 |
| BN | 199.17 | 11.07 |
| Multi-class Classification | ||
| LDA | 17.5 | 2.96 |
| QDA | 15.35 | 3.16 |
| RF | 502.81 | 41.66 |
| BN | 175.17 | 10.07 |
| Reference | Classifier Name | F-Measure | Feature |
|---|---|---|---|
| Selection/Extraction | |||
| (Features Count) | |||
| [4] | KNN | 0.96 | Random Forest |
| RF | 0.97 | Regressor (54) | |
| ID3 | 0.98 | ||
| Adaboost | 0.77 | ||
| MLP | 0.76 | ||
| Naïve Bayes | 0.04 | ||
| QDA | 0.92 | ||
| [13] | MLP | 0.948 | Payload related |
| features | |||
| [15] | SVM | 0.921 | DBN |
| [14] | KNN | 0.997 | Fisher Scoring (30) |
| [51] | XGBoost | 0.995 | (80) |
| for DoS Attacks | |||
| [49] | Deep Learning | Accuracy | (80) |
| for Port Scan Attacks | 97.80 | ||
| [49] | SVM | Accuracy | (80) |
| for Port Scan Attacks | 69.79 | ||
| [17] | XGBoost | Accuracy | DDR Features |
| 98.93 | Selections (36) | ||
| [50] | Deep Multi Layer | Accuracy | Recursive feature |
| Perceptron (DMLP) | 91.00 | elimination | |
| for DDoS Attacks | with Random Forest | ||
| Proposed | |||
| Framework | Random Forest | 0.995 | Auto-encoder (59) |
| Proposed | PCA with Original | ||
| Framework | Random Forest | 0.996 | Distribution (10) |
| Proposed | PCA With | ||
| Framework | Random Forest | 0.988 | UDBB(10) |
© 2019 by the authors. Licensee MDPI, Basel, Switzerland. This article is an open access article distributed under the terms and conditions of the Creative Commons Attribution (CC BY) license (http://creativecommons.org/licenses/by/4.0/).
Share and Cite
Abdulhammed, R.; Musafer, H.; Alessa, A.; Faezipour, M.; Abuzneid, A. Features Dimensionality Reduction Approaches for Machine Learning Based Network Intrusion Detection. Electronics 2019, 8, 322. https://doi.org/10.3390/electronics8030322
Abdulhammed R, Musafer H, Alessa A, Faezipour M, Abuzneid A. Features Dimensionality Reduction Approaches for Machine Learning Based Network Intrusion Detection. Electronics. 2019; 8(3):322. https://doi.org/10.3390/electronics8030322
Chicago/Turabian StyleAbdulhammed, Razan, Hassan Musafer, Ali Alessa, Miad Faezipour, and Abdelshakour Abuzneid. 2019. "Features Dimensionality Reduction Approaches for Machine Learning Based Network Intrusion Detection" Electronics 8, no. 3: 322. https://doi.org/10.3390/electronics8030322
APA StyleAbdulhammed, R., Musafer, H., Alessa, A., Faezipour, M., & Abuzneid, A. (2019). Features Dimensionality Reduction Approaches for Machine Learning Based Network Intrusion Detection. Electronics, 8(3), 322. https://doi.org/10.3390/electronics8030322