1. Introduction
With the wide deployment of smart devices and the advancement of computing and communication technology, Internet traffic is experiencing explosive growth. By 2022, Internet traffic is expected to be three times that of 2017 [
1]. In 2017, 75% of traffic was generated from video services such as Internet video, Internet Protocol Video on Demand (IP VoD) and video-streamed gaming. Web service and data transmission such as sensing data accounts for 17% of all Internet traffic; therefore, video streaming, web services and data transmission are the most preferred services by Internet users. Traditionally, these services use the Transmission Control Protocol (TCP) as a transport layer, which provides several features such as reliability, in-order delivery, congestion control and flow control. Various types of TCPs have been proposed for throughput improvement, some of which have been developed to increase utilization of the network bandwidth, whereas others have dealt with throughput degradation due to frequent bit errors in wireless networks [
2,
3,
4,
5,
6,
7,
8,
9].
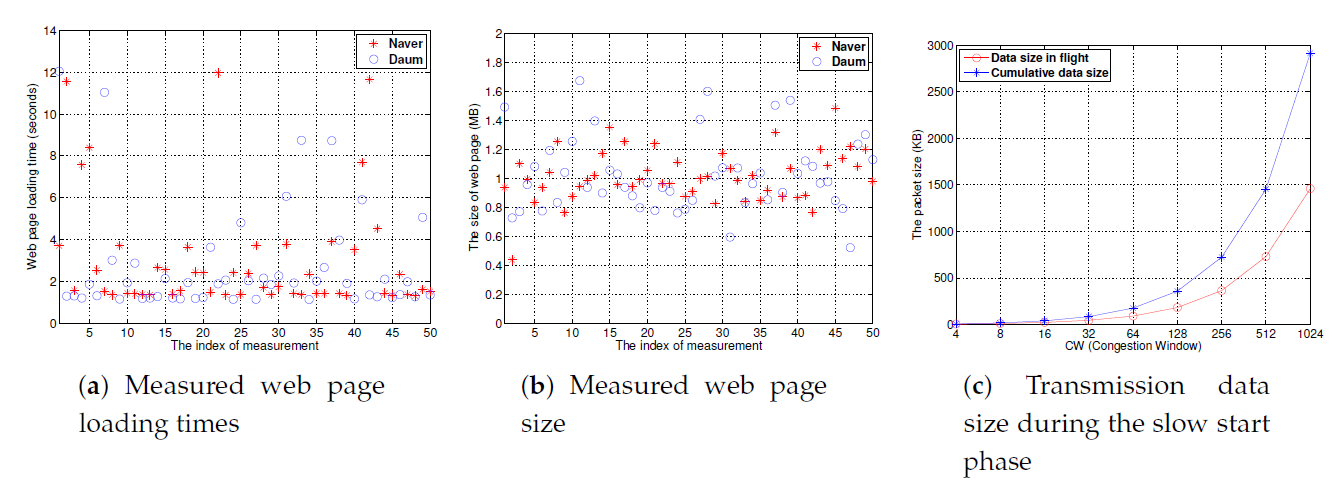
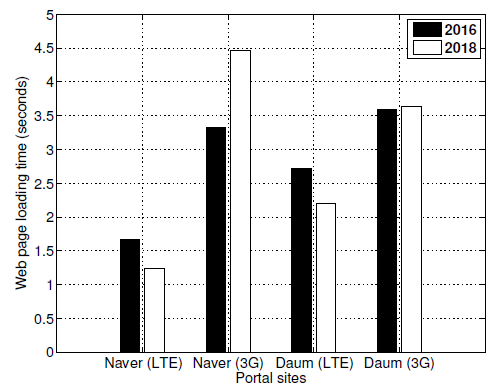
Despite the throughput increase achieved by previous studies, the latency reduction of TCP is not large. Therefore, video streaming and web and data service users experience low quality. When using video streaming, web services and data transmission, users determine the quality of experience based on the response time. If web page access, sensing data transmission or video buffering are completed quickly, the quality of experience increases. To observe the access latency from the desktop to a web page in a portal, we measured the web page loading time of Naver and Daum, which are famous portals in South Korea. According to the results in
Figure 1a, the web page loading times of Naver and Daum are approximately 3 s and 2.7 s, respectively. However, the average web page size is small (approximately 1 MB in
Figure 1b) and the network bandwidth is large (more than 100 Mbps); therefore, the time required to download a web page is slower than expected. This is due to the fact that TCP utilizes three-way handshaking and a slow start in TCP [
10,
11]. Indeed, as shown in
Figure 1c, for a congestion window value of 512, which has a cumulative data size of approximately 1.5 MB, eight Round Trip Time (RTT) are required to download 1 MB of data.
Therefore, to improve the quality of experience for Internet users, latency reduction is necessary, which has been proposed by several previous studies [
10,
11,
12,
13]. To rapidly fetch data from a website, the initial congestion window size increases or the data is piggybacked during the three-way handshake and Domain Name System (DNS) lookup. However, these approaches require modification of the kernel, which leads to backward compatibility issues. For fast video streaming, User Datagram Protocols (UDPs) are employed but they also require modification [
14,
15]. Google developed the Quick UDP Internet Connections (QUIC) protocol to support low access latency [
16,
17,
18]. As the QUIC protocol uses a UDP for backward compatibility, it can be used without any modification. The QUIC protocol utilizes 1-RTT and 0-RTT connection establishment to decrease the overhead of three-way handshaking. However, latency reduction in the QUIC protocol is limited because it also sets a small initial congestion window and employs slow start. Several studies have been conducted focusing on performance improvement, implementation validation and security [
19,
20,
21,
22,
23,
24,
25,
26,
27,
28]. Among these studies, some authors have proposed latency reduction schemes for QUIC. In References [
21,
22], either the number of connections between the client and the server is adjusted or the congestion window is controlled based on object priority. However, as these schemes transmit QUIC packets aggressively without considering the network conditions, congestion in the networks can be aggravated. A partial reliable transmission is used to decrease latency; however, this causes data loss [
23,
24].
The aim of this study is to reduce access latency in the QUIC protocol. First, because mobile traffic accounted for 52% of IP traffic in 2017 [
1], we observe the quality of the web service experience for users of smart devices with commercial mobile networks. Specifically, we measure the throughput and web page loading time in both Long-Term Evolution (LTE) and 3G networks. While the throughput of LTE and 3G networks is approximately 120 Mbps and 5 Mbps, respectively, the gap in web page loading time between LTE and 3G networks is 1–3 s. This implies that users experience low quality in terms of latency, even though the difference in throughput between LTE and 3G networks is very large.
Second, we propose a light-weight latency reduction scheme based on communication history. The proposed scheme sets the initial transmission rate according to the network conditions. If the network environment is good, the initial transmission is high. The proposed scheme determines the larger value of the average congestion window and the default congestion window as the initial congestion window. To obtain the average congestion window, our scheme calculates the average congestion window under two conditions: when the connection is closed or when the 0-RTT handshake occurs. To avoid a latency increase due to computational overheads, our algorithm has low complexity and the proposed scheme boasts a small computational effort.
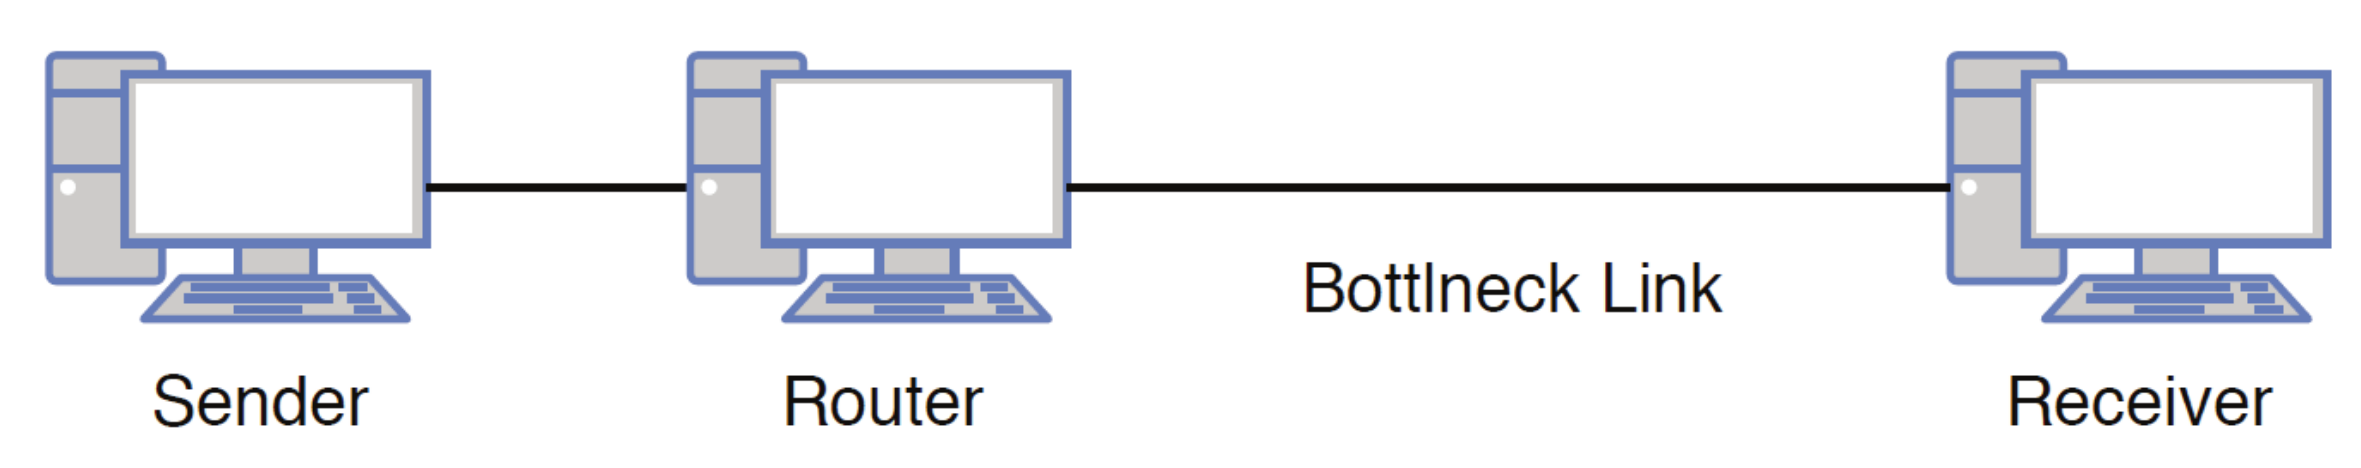
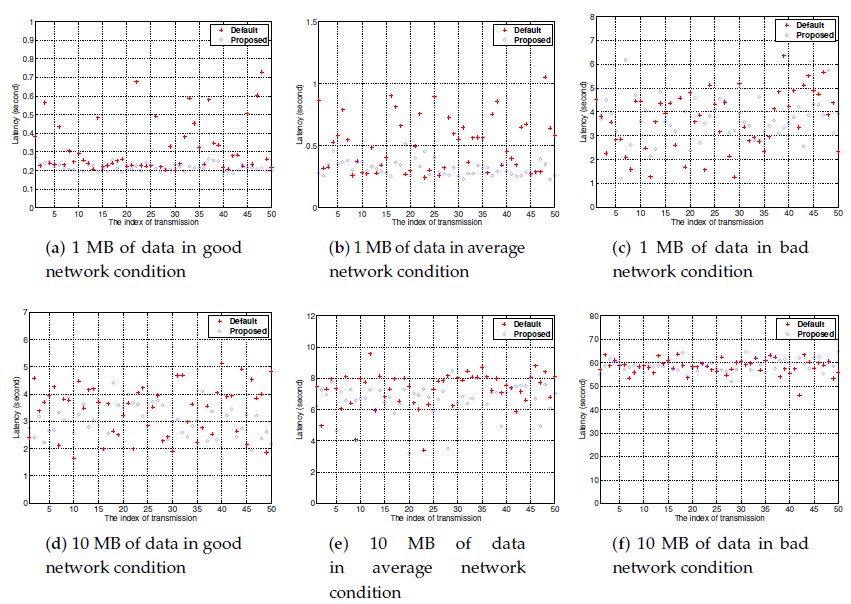
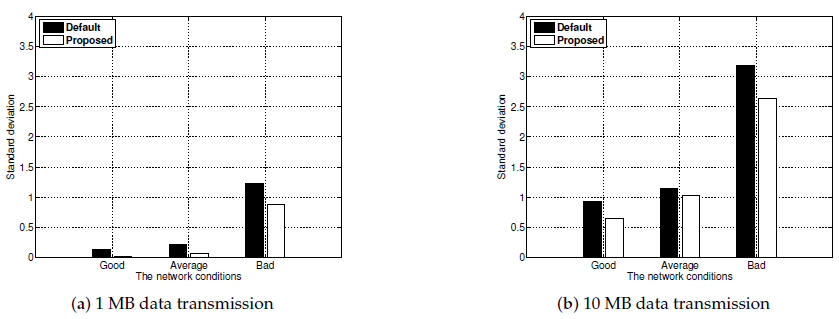
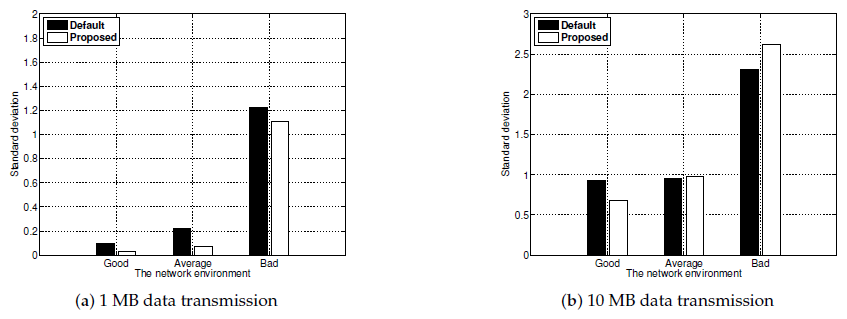
Finally, we evaluate the proposed scheme using two experimental topologies with different numbers of desktops. Our scheme achieves significant latency reduction in good and average network environments. Additionally, the standard deviation of latency indicates that our scheme adapts well to network conditions.
The remainder of this paper is organized as follows. Related works are presented in the
Section 2.
Section 3 describes the measurement results of the throughput and web page loading time in LTE and 3G networks. In the
Section 4, we propose a light-weight latency reduction scheme and evaluate our scheme with experiments using a testbed in
Section 5. Finally, we present the conclusions in
Section 6.
2. Related Work
In TCP, several studies have addressed the impact of changing the initial congestion window size. In Reference [
12], Aggregated TCP (ATCP) enabled an intermediate router to divide one connection into two connections. The initial congestion window sizes of both connections were set to the average congestion window size of other connections for decrement of the download time of web page. However, ATCP requires the modification of the intermediate router and the management of multiple connections. In Reference [
13], to decrease the latency without the intervention of the intermediate router, a sender used a specific value for the initial congestion window size. However, because the initial congestion window size was fixed, if the network environment such as its bandwidth and RTT was changed, the initial congestion window size became unsuitable and performance gain decreased. In cellular networks, performance varies with different initial congestion window sizes; that is, the performance is proportional to the size [
29]. If a delay spike (an unexpected long delay) occurs, as the initial congestion window size increases, the performance decreases owing to the increased queueing delay.
Many studies have addressed latency reduction to provide fast services to users. The TCP Fast Open protocol has been proposed to decrease the latency of short transmissions such as web page access [
10]. When a connection is initiated, a client piggybacks data in an SYN packet then a server transmits data to the client. Because modification of this three-way handshake causes security vulnerability, the TCP Fast Open protocol utilizes security cookies to deal with security issues such as a SYN flood attack. In Reference [
11], the Accelerated Secure Association Protocol (ASAP) was proposed to reduce access delay by modifying the DNS lookup process and connection establishment process. In ASAP, the DNS query message including data is transmitted from the client to the DNS server, which forwards the DNS query message to the server. Then, after receiving the DNS query with the data request message, the server sends data to the client without a three-way handshake. However, as TCP Fast Open and ASAP protocols require kernel modification, they exhibit low backward compatibility. For efficient video frame transmission, the Complete User Datagram Protocol (CUDP) utilizes a Cyclic Redundancy Check (CRC) to check the UDP header error. Because multimedia applications are resilient to any frame error, the UDP payload is delivered to the application. In Reference [
15], Lightweight Secure Streaming Protocol (LSSP) was proposed for a light weight secure streaming service. This inserts authentication data into the UDP header. However, both these protocols require modification of the kernel.
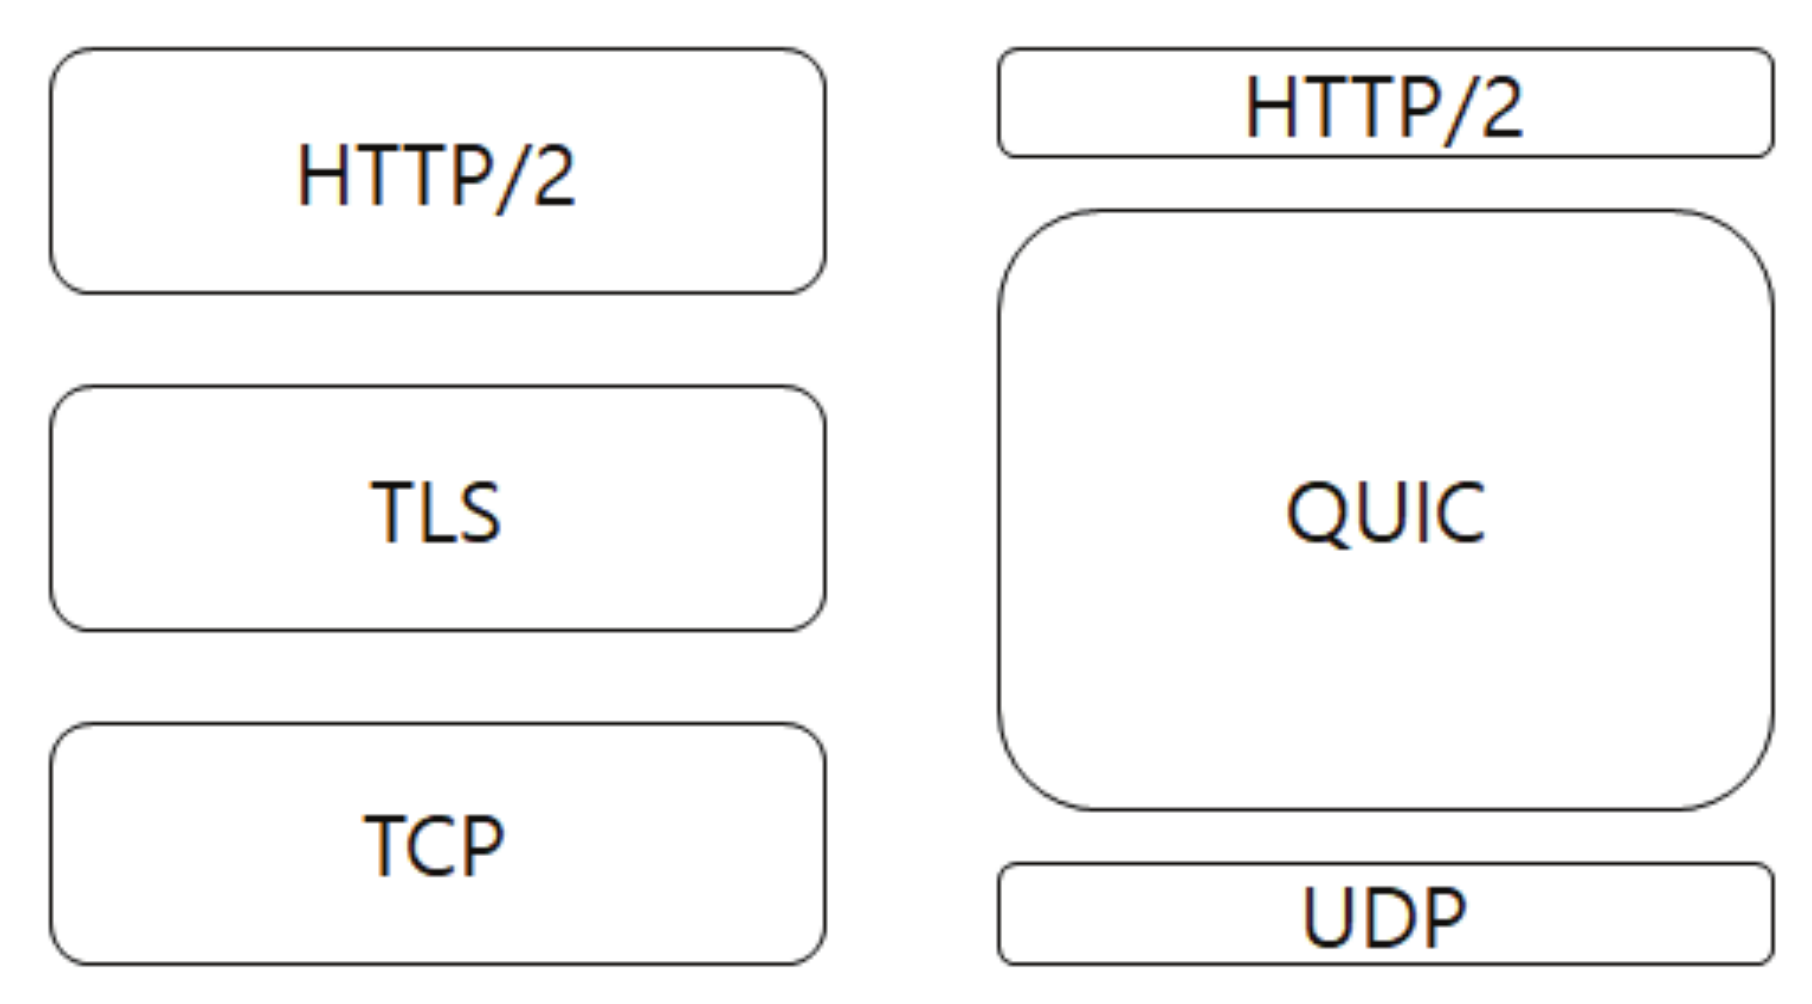
The QUIC protocol proposed by Google is a new transport layer protocol for providing fast access and easy deployment for users that is implemented in a Chrome browser [
16,
17,
18]. As shown in
Figure 2, to support backward compatibility, the QUIC protocol, which is built on UDP, provides encryption, congestion control, flow control and reliability to substitute Transport Layer Security (TLS) and TCP. Therefore, it is widely deployed without kernel modification.
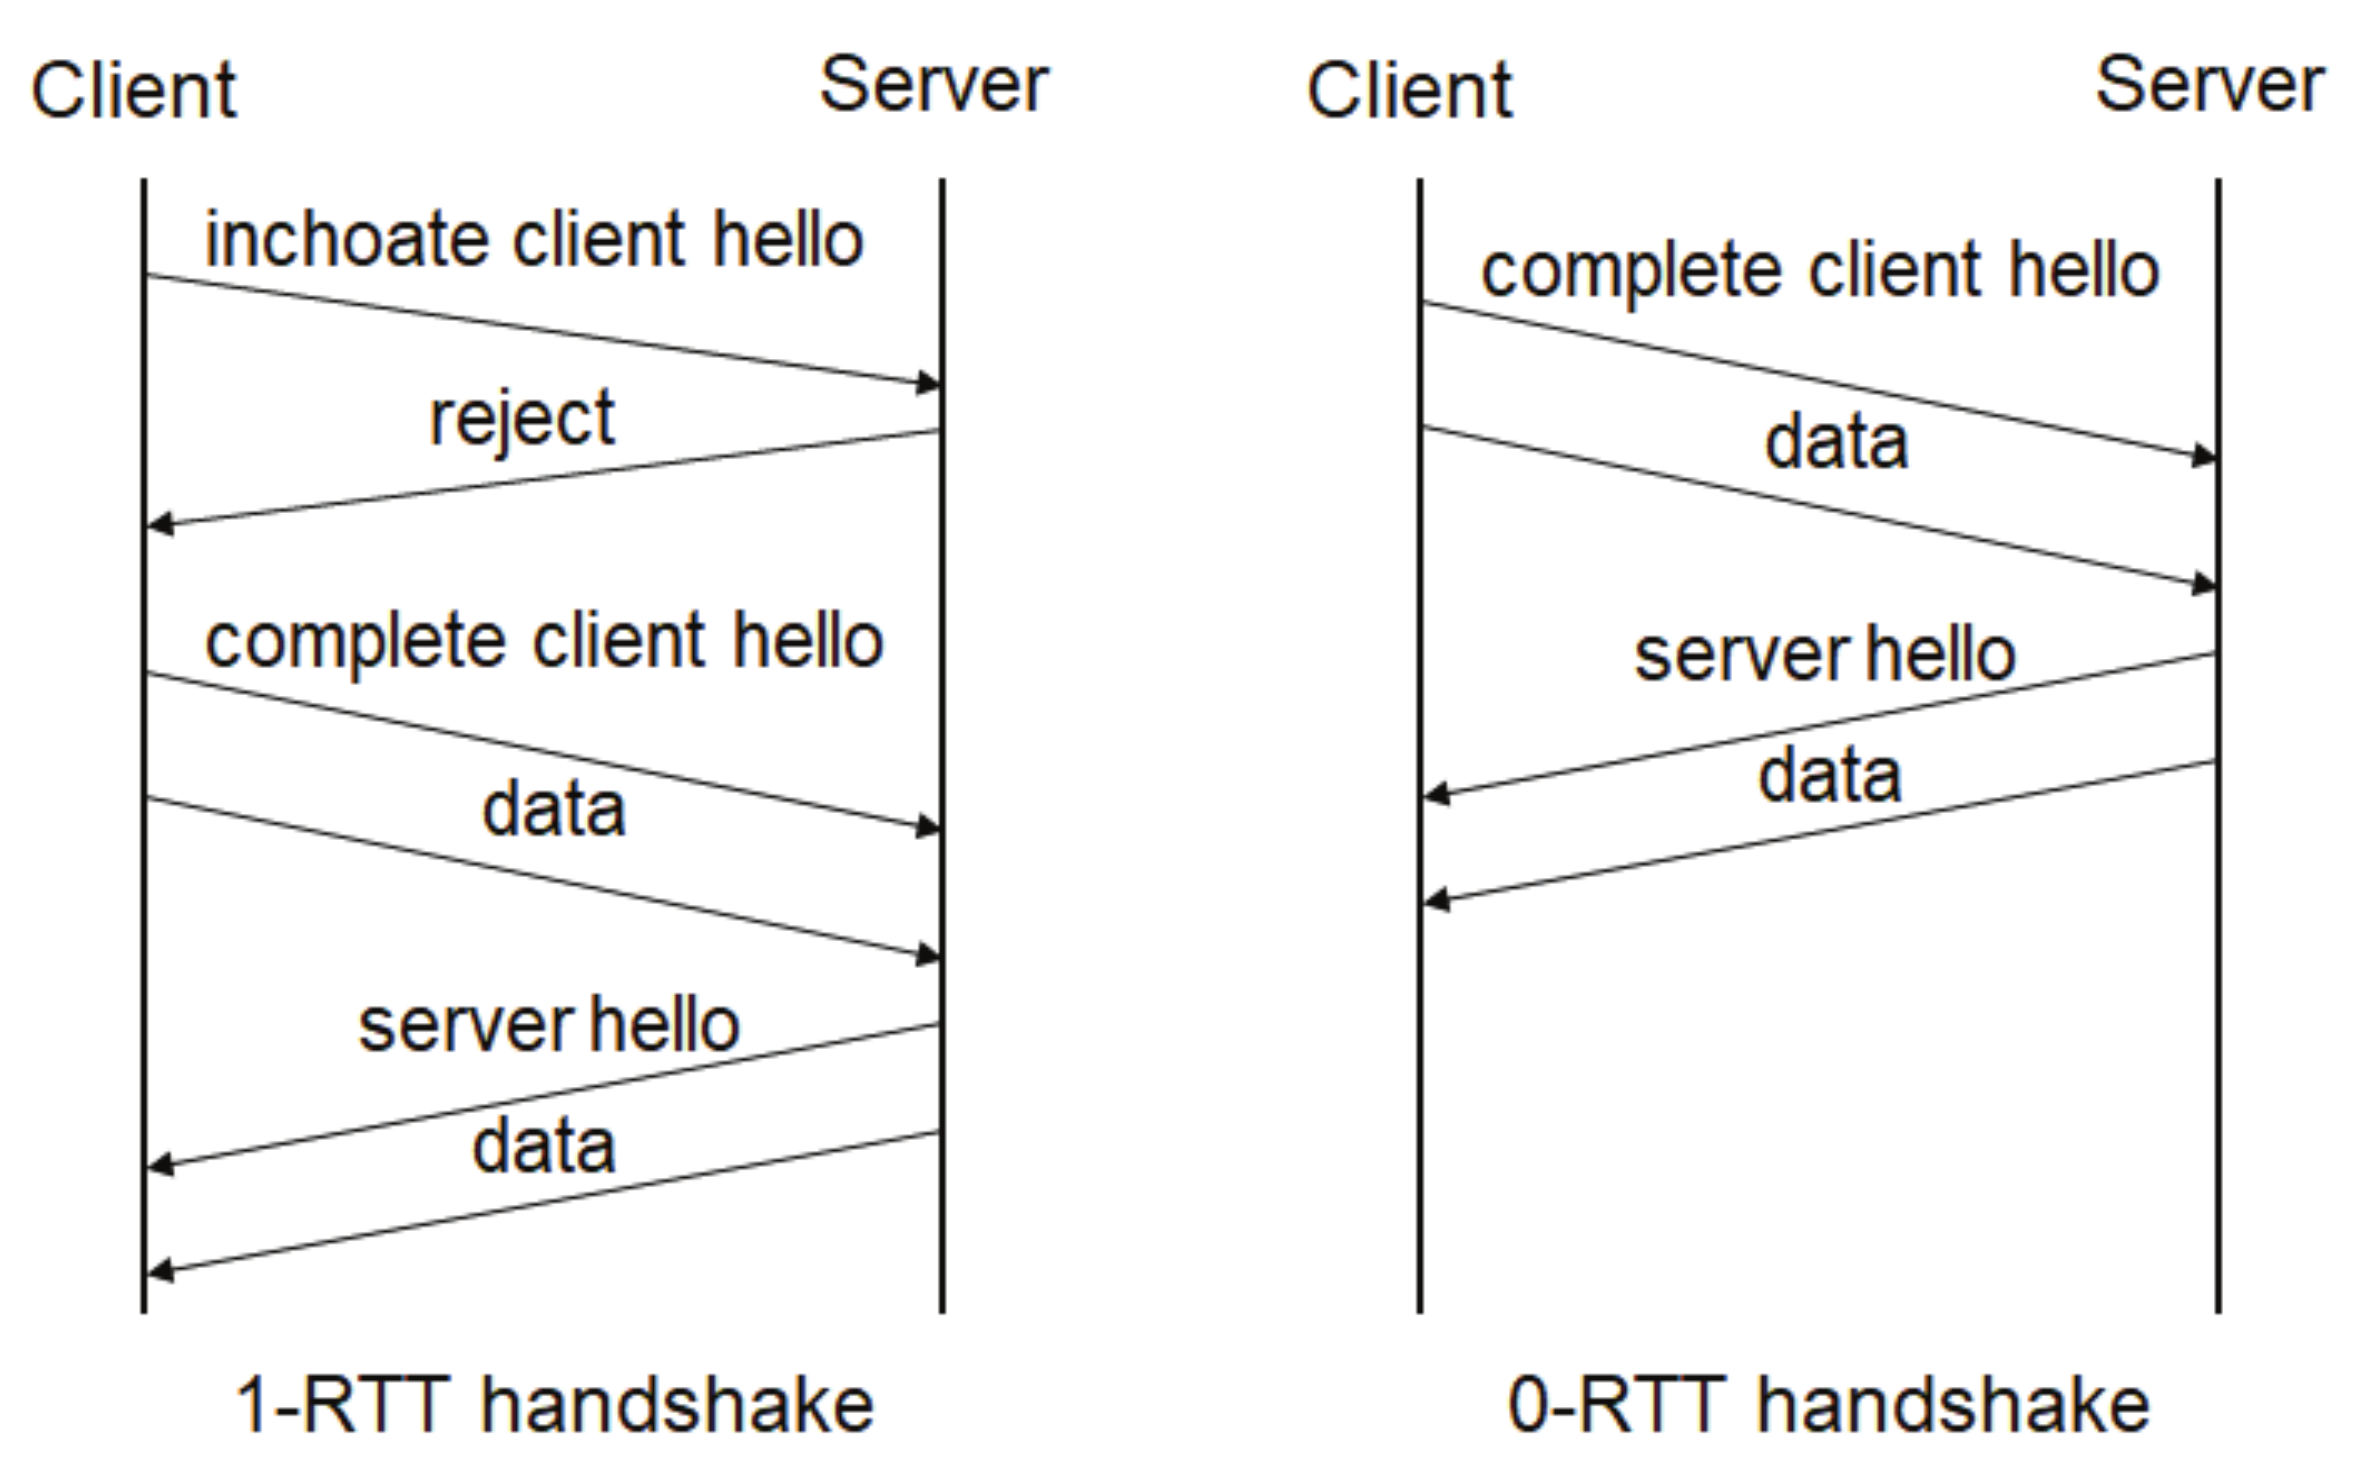
The QUIC protocol provides different functionalities for performance enhancement, three of which are discussed here. First, QUIC supports 1-RTT and 0-RTT handshakes to reduce the connection establishment delay as depicted in
Figure 3. If the client sets up the first connection to the server, the 1-RTT handshake is used to exchange connection information including the connection identifier and encryption/decryption key. After a successful 1-RTT handshake, the client sends and receives data via the 0-RTT handshake; therefore, the connection establishment delay decreases. If the 0-RTT handshake is not used for a period of time, the connection information is deleted and the connection is closed. Then, the client initializes a new connection using the 1-RTT handshake. Second, the QUIC protocol provides stream multiplexing to deal with head-of-line blocking due to in-order delivery. If a packet is dropped, a destination node cannot receive subsequent packets until the dropped packet is successfully retransmitted. To reduce performance degradation, QUIC divides a connection into multiple streams and utilizes flow control for each stream. Third, QUIC exploits the connection ID instead of a four-tuple including the source IP address, source port number, destination IP address and destination port number. As the connection ID does not depend on the IP address, QUIC provides seamless connectivity to mobile users.
Since the standardization of the QUIC protocol by the Internet Engineering Task Force (IETF), multiple QUIC implementations have been developed. To enhance the interoperability of QUIC implementations, some studies have proposed test cases, log formats and visual tools for debugging [
25,
26,
27]. Several works have attempted to improve the performance of the QUIC protocol. In Reference [
19], Multipath QUIC (MPQUIC) was used to exploit several paths in parallel to increase the throughput. The path manager, which selected the transmission path based on the lowest RTT and the path identifier were used. The packet number was maintained for each path for reliability. To deal with throughput degradation owing to asymmetric multipaths, Stream-Aware Earliest Completion First (SA-ECF) scheduler was proposed in Reference [
20]. The SA-ECF scheduler determined the path to minimize the transmission completion time on each stream. However, MPQUIC focuses on increasing the throughput rather than reducing the latency.
Some works have also addressed latency decrement. Adaptive Segment Retrieval (ASR) based on QUIC has been proposed to reduce initial buffering and latency for video streaming services [
21]. ASR adapts the number of emulated connections to control the window size. If ASR increases the number of emulated connections, the file is downloaded quickly; otherwise, the download speed decreases. In Reference [
22], QUIC was employed for the performance enhancement of multimedia services by managing the congestion window based on object priorities that are acquired from the web browser. If the priority of the multimedia content is high, QUIC increases the throughput by increasing the aggressiveness of congestion control. However, because these studies do not consider network conditions such as the throughput, loss ratio and the number of concurrent connections, aggressive downloads can lead to excessive competition and performance degradation. In Reference [
23,
24], QUIC was extended to support partial reliable transmission for the performance enhancement of multimedia applications. In partial reliable transmission, essential data were transmitted reliably and, less important data were transmitted unreliably to avoid retransmission. However, while these works permit packet loss for optimization of multimedia services, our approach maintains reliability.
Unlike previous research, the purpose of our study is latency reduction by minimizing computational and network overheads. The proposed scheme determines the initial transmission rate based on previous network conditions. To estimate network conditions, we calculate the average congestion window when a connection is terminated or a 0-RTT connection establishment is used. As the proposed approach employs a low complexity algorithm, it has low computational overheads.
3. Measurement of Mobile Network Performance
In this section, we describe the performance measurement results for LTE and 3G networks, which are operated by the KT corporation, a well-known telecommunications corporation in South Korea. We used a Nexus 5X with Android 6.0.1. We used the Speedtest app and NIA app with different TCP protocols to precisely measure the throughput in LTE networks and 3G networks [
30,
31]. We varied the type of TCP in 2016 and conducted the measurement with TCP Cubic in 2018. To observe the quality of the web service experience for smart device users, we measured web page loading times for Naver and Daum, which are famous portals in South Korea. The measurements were conducted from 3 June 2016 to 20 September 2016 at Keimyung University, Daegu, South Korea and from 7 August 2018 to 28 August 2018 at Changwon National University, Changwon, South Korea.
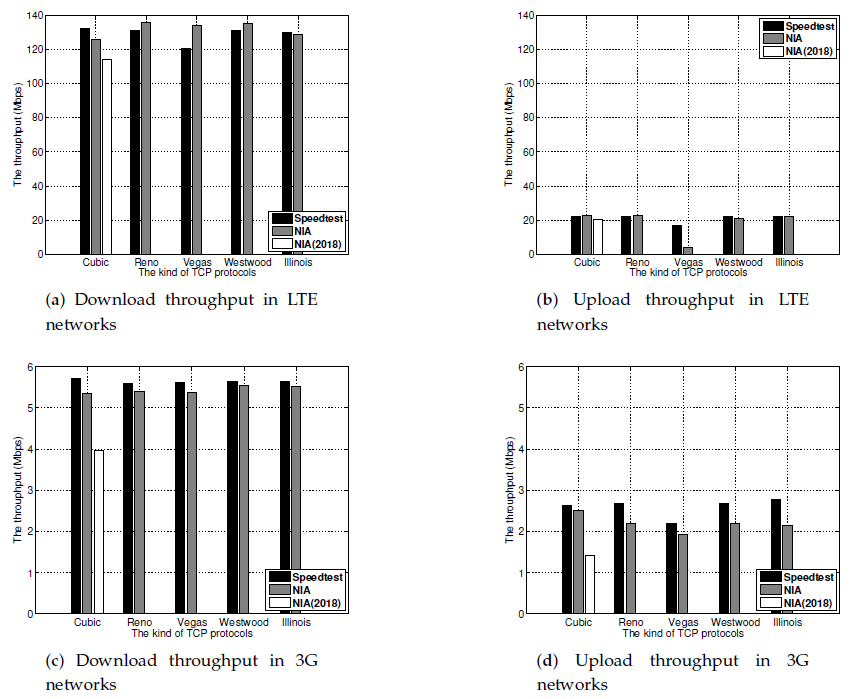
Figure 4 presents the measured throughput for LTE and 3G networks. In LTE networks, the average download and upload throughput values were approximately 129 and 20 Mbps, respectively. In 3G networks, the respective throughput values were 5.4 and 2.4 Mbps. For both networks, the download throughput was similar for all types of TCP protocol. In LTE networks, the upload throughput of TCP Vegas was lower than that of the others because TCP Vegas maintains the congestion window to avoid unnecessary transmission failure. The throughput was lower in 2018 than in 2016 because the measurement location had changed; however, the download throughput was sufficient to support video streaming and web services.
We then measured the web page loading times for both networks and the results are presented in
Figure 5. In LTE networks, the web page loading time for both portals decreased from 2016 to 2018. However, the average access time for Naver and Daum portals was still approximately 1.4 s and 2.4 s, respectively. In 3G networks, the average web page loading time for Naver and Daum was approximately 3.9 s and 3.6 s, respectively. 3G networks require a longer web page loading time than LTE networks due to the low transmission rate. However, the gap between LTE and 3G networks was less than the difference in throughput between the networks; therefore, the large loading time is due to the slow start phase and connection initiation overheads, even though the network bandwidth is large and the RTT for sites in South Korea is tens of milliseconds. This results in a low quality experience due to large latency.
4. Proposed Scheme
This section explains the details of the proposed scheme. Our scheme consists of two parts: observation of the network conditions and adaptation of the initial transmission rate to the network conditions. To observe network conditions, we measure the size of the congestion window and then calculate the average value. As the measurement and calculation require computational effort, more frequent calculation leads to a greater computational cost, which results in an unnecessary delay. However, if network observations are rare, the proposed scheme can incorrectly interpret the network conditions.
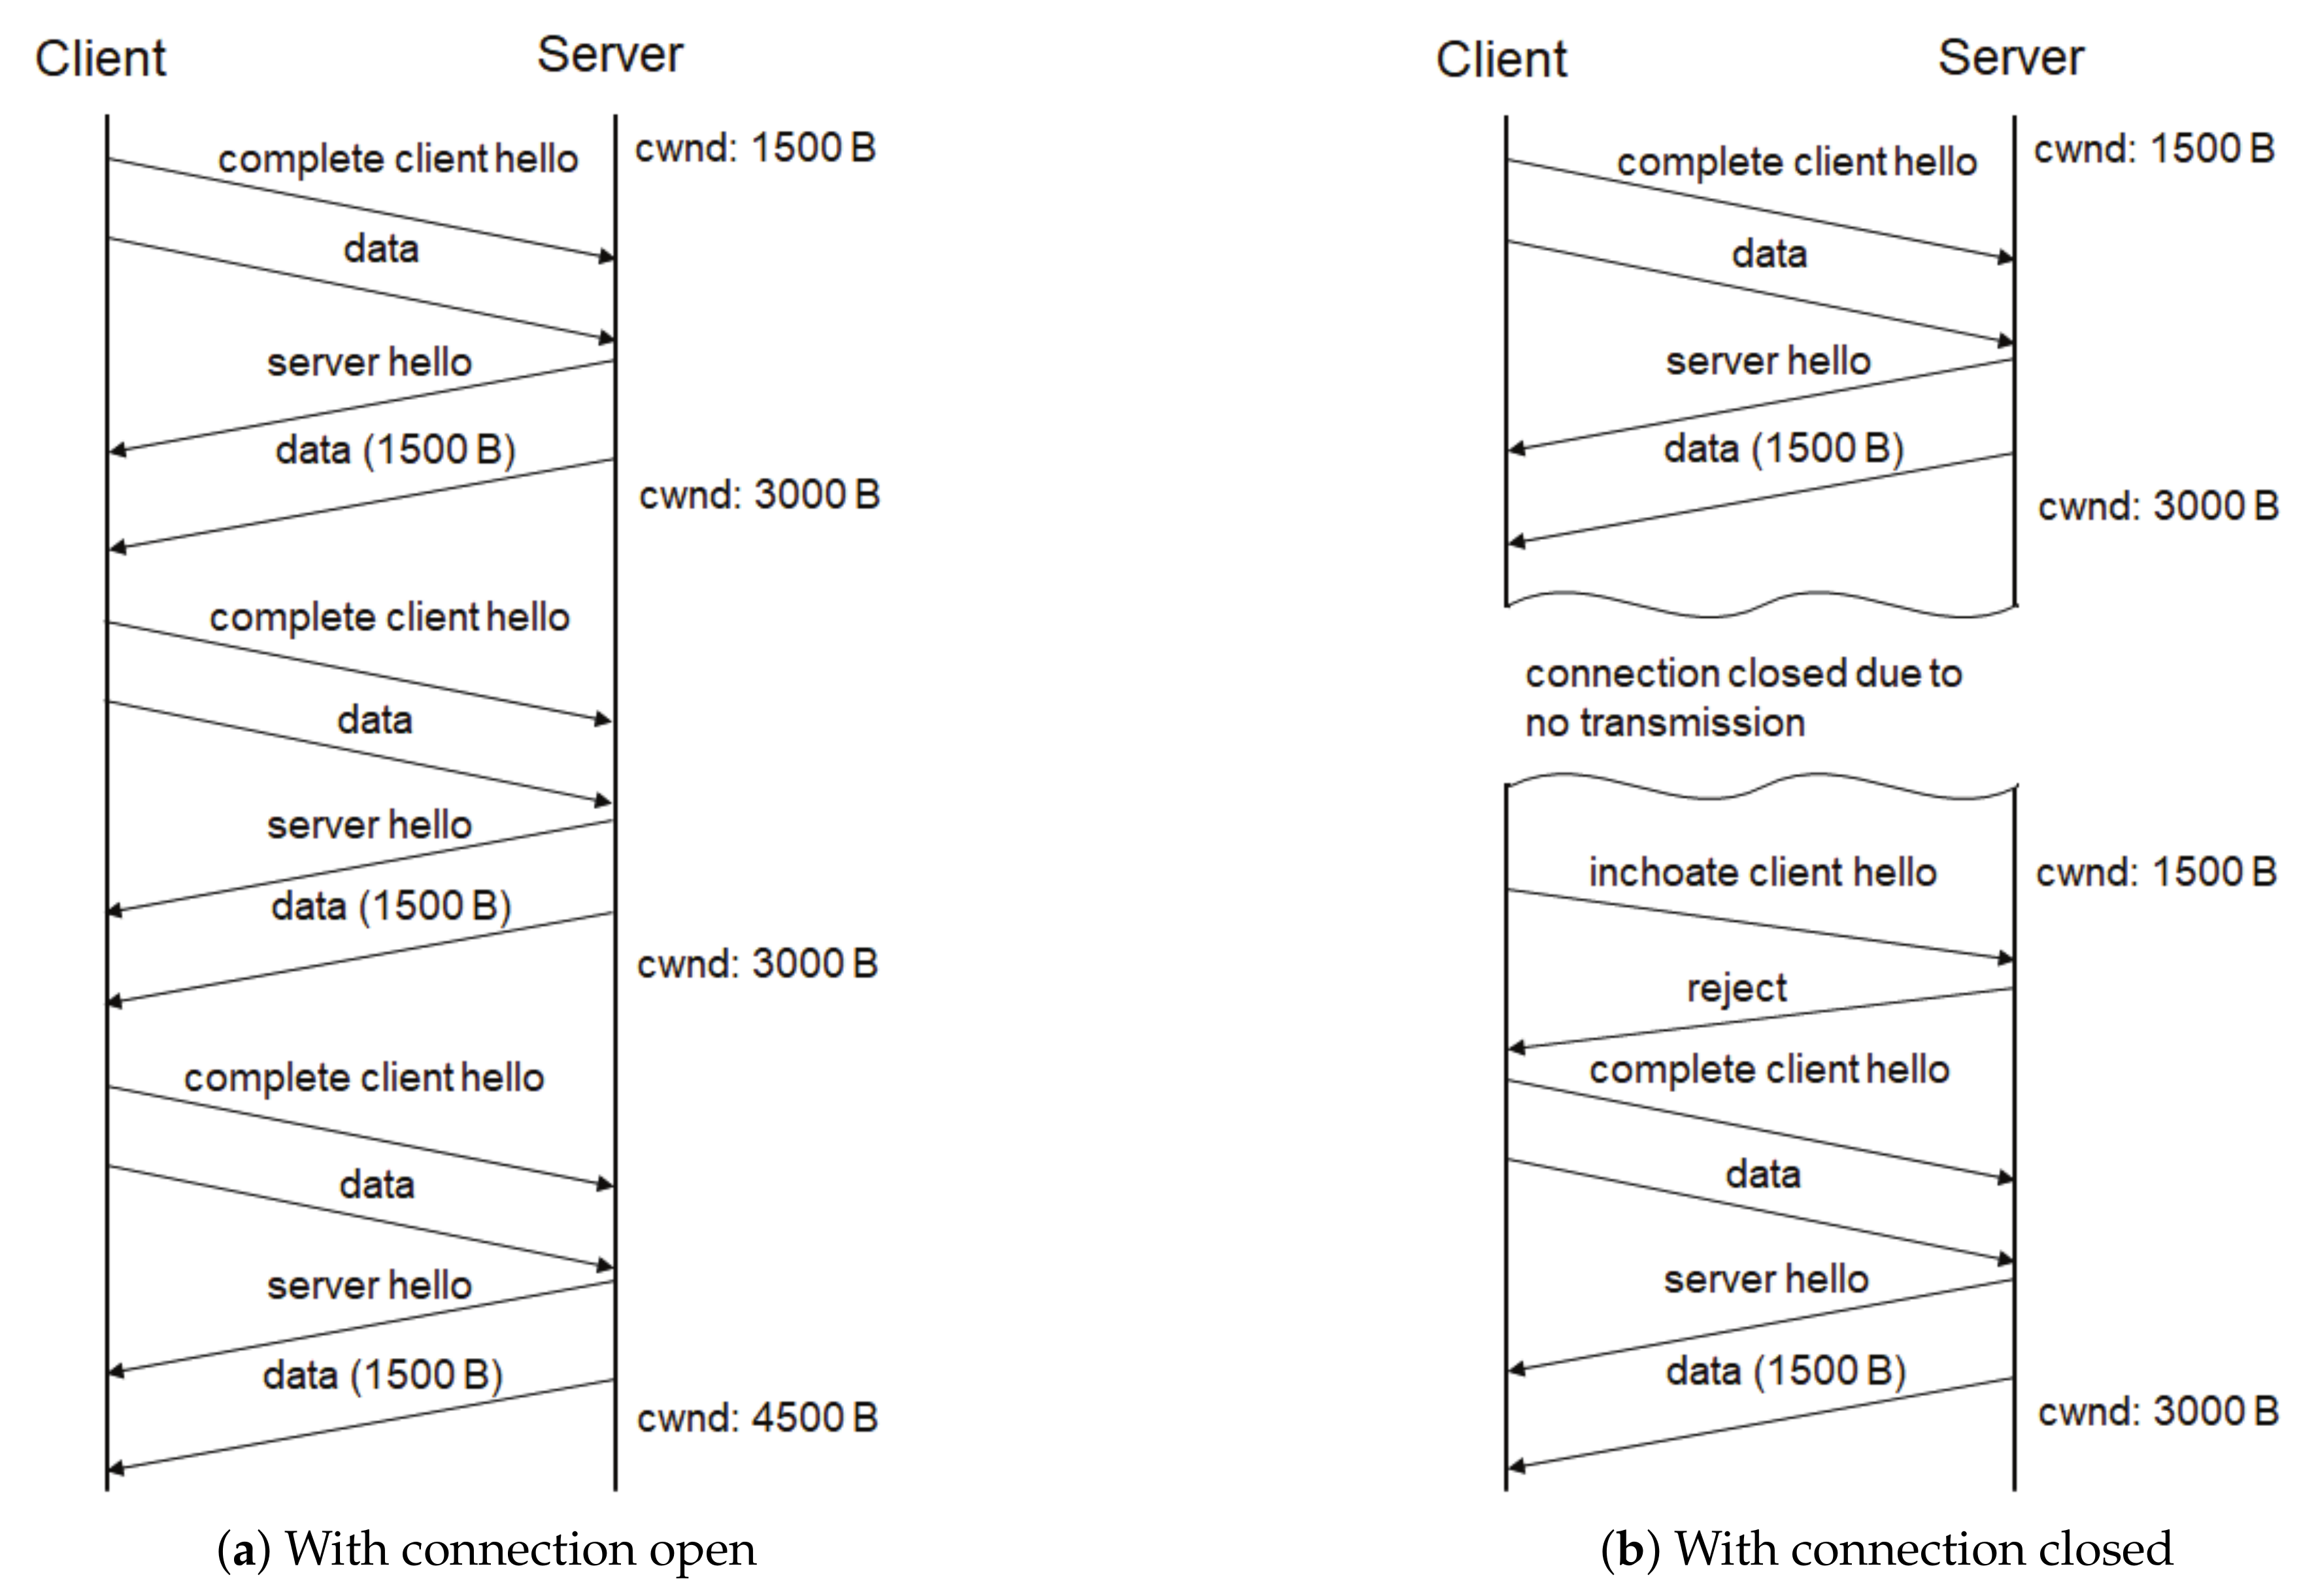
To decrease the computation overheads and estimate the network condition, the proposed scheme collects the value of the congestion window when two events occur. The first event is the 0-RTT handshake. QUIC maintains the congestion window while the connection is active. For example, we assumed that the initial congestion window size was 1500 B and that the connection had already been established. As shown in
Figure 6a, the server sends 1500 B of data to the client after 0-RTT initiation, then the congestion window becomes 3000 B. After two transmissions from the server to the client, the congestion window size is 4500 B. When the proposed scheme receives complete client hello messages by the 0-RTT handshake, it calculates the average congestion window size to estimate the network conditions. The second event is connection termination. When a connection is closed due to no communication during a period of time, the proposed scheme calculates the average value. For example, as shown in
Figure 6b, if the connection is closed, the connection information is deleted. After the 1-RTT handshake and successful transmission, the congestion window increases from 1500 B to 3000 B. Therefore, our scheme exploits 3000 B of the congestion window for the average calculation before the value of the congestion window is initialized.
Algorithm 1 presents the pseudo-code for the light-weight latency reduction scheme. The proposed scheme calculates the average size of the congestion window when the 0-RTT handshake occurs or when the connection is closed. To calculate the average, the arithmetic mean or moving average can be used. Then, if the 1-RTT handshake occurs, our scheme determines the initial congestion window size as either the average congestion window size or the default congestion window size. If the average size is larger than the default size, the proposed scheme sets the initial congestion window size to the average congestion window size. If not, the initial congestion window size is set to the default size.
| Algorithm 1 Algorithm for the Proposed Scheme. |
| average size of congestion window
|
| default value for congestion window
|
| initial value for congestion window
|
|
| loop |
|
if receive complete client hello message or close a connection then |
| measure the current congestion window size |
| calculate average size of congestion window using the measured size |
|
new average congestion window size |
| end if |
| if receive inchoate client hello message then |
|
|
| end if |
| end loop |
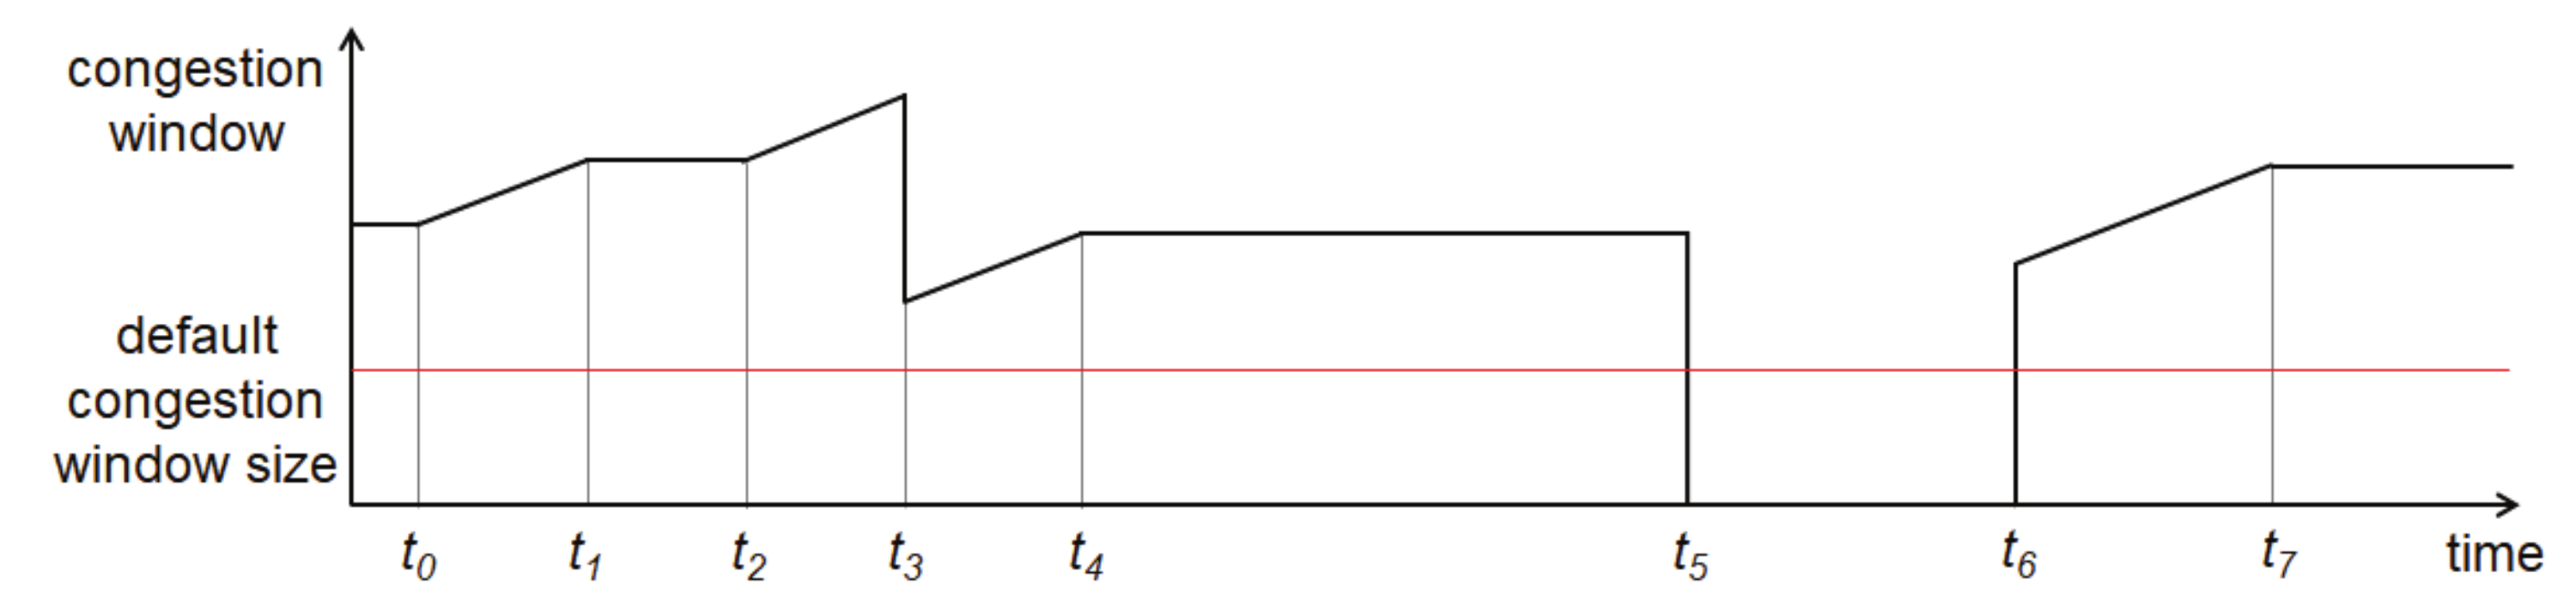
For example,
Figure 7 describes the congestion window variation by event over time, where the
x-axis and
y-axis present time and the congestion window size, respectively. The slope indicates the increment rate of the congestion window. At
, the 0-RTT handshake occurs and the node calculates the average congestion window size with simultaneous data transmission. The node increases the congestion window because the data is successfully transmitted without loss. At
, the node completes transmission and maintains connection information such as congestion window and connection ID until the connection is closed. At
, when the node receives the complete client hello message by the 0-RTT handshake, it calculates the average size of the congestion window. During transmission from hl
to
, data is lost and the congestion window size decreases at
. All data including lost data are transmitted at
. At
, the node calculates the average congestion window size before the connection is terminated because no communication occurs for a period of time. At
, the 1-RTT handshake occurs. As the average congestion window is larger than the default size, the node sets the initial congestion window size to the average congestion window then sends the data. As the node transmits more data, the latency decreases. At
, the node finishes the transmission.


