Abstract
With the increasing deployment of grid-forming static var generators (GFM-SVG) in modern power systems, the reliability of the valve hall that houses the core power modules has become a critical concern. To overcome the limitations of conventional wired monitoring systems—complex cabling, poor scalability, and incomplete state perception—this paper proposes and implements a multi-source fusion wireless data acquisition system specifically designed for GFM-SVG valve halls. The system integrates acoustic, visual, and infrared sensing nodes into a wireless sensor network (WSN) to cooperatively capture thermoacoustic visual multi-physics information of key components. A dual-mode communication scheme, using Wireless Fidelity (Wi-Fi) as the primary link and Fourth-Generation Mobile Communication Network (4G) as a backup channel, is adopted together with data encryption, automatic reconnection, and retransmission-checking mechanisms to ensure reliable operation in strong electromagnetic interference environments. The main innovation lies in a multi-source information fusion algorithm based on an improved Dempster–Shafer (D–S) evidence theory, which is combined with the object detection capability of the You Only Look Once, Version 8 (YOLOv8) model to effectively handle the uncertainty and conflict of heterogeneous data sources. This enables accurate identification and early warning of multiple types of faults, including local overheating, abnormal acoustic signatures, and coolant leakage. Experimental results demonstrate that the proposed system achieves a fault-diagnosis accuracy of 98.5%, significantly outperforming single-sensor approaches, and thus provides an efficient and intelligent operation-and-maintenance solution for ensuring the safe and stable operation of GFM-SVG equipment.
1. Introduction
Building a new type of power system dominated by renewable energy sources is a key pathway toward reducing global carbon emissions [1]. However, the large-scale integration of wind and photovoltaic generation has gradually replaced conventional synchronous machines as the main power sources. As a result, the overall system inertia is continuously decreasing, while frequency and voltage stability are becoming increasingly critical issues, posing unprecedented challenges to the secure and stable operation of power grids [2,3].
Under this circumstance, grid-forming (GFM) converter technology has emerged and is widely recognized in both academia and industry as a cornerstone for maintaining the stability of future renewable-dominated power systems [4,5]. In contrast to traditional grid-following (GFL) units, a GFM-SVG can emulate the dynamic characteristics of a synchronous generator, actively establishing and regulating system voltage and frequency. By providing synthetic inertia and damping, it greatly enhances grid stability and resilience [6,7].
As the core power component of the GFM-SVG, the valve hall integrates a large number of insulated-gate bipolar transistors (IGBT), DC capacitors, snubber circuits, and water cooling subsystems [8]. These units are subjected to extremely high transient currents and voltages and operate under severe electro-thermal stress cycles, making them prone to failures [9]. Typical fault modes include local overheating of power devices caused by cooling fan failure or loose electrical connections, leading to thermal runaway or device burnout; abnormal acoustic signatures resulting from mechanical vibration or insulation degradation (such as arcing or partial discharge); and coolant leakage due to seal aging or rupture, which can trigger short circuits or insulation breakdown [10].
If a GFM-SVG unexpectedly trips offline because of valve hall faults, it not only leads to significant economic losses but also undermines the converter’s grid support capability. Such failures may induce power shortages, voltage collapse, or cascading outages, posing serious threats to regional system security [11,12]. Therefore, achieving real-time, comprehensive, and accurate online monitoring and intelligent diagnosis of valve hall operating conditions is essential for ensuring the reliable operation of GFM-SVG systems and, in turn, safeguarding the stability of the next-generation power grid.
2. Related Research
To address the operational risks discussed above, extensive research on equipment condition monitoring has been conducted in both academia and industry. Traditional approaches mainly rely on a limited number of wired sensors—such as thermocouples and ultrasonic probes—and on periodic infrared inspections carried out manually [13,14]. However, wired monitoring systems suffer from inherent limitations, including complex cabling, high installation and maintenance costs, and poor scalability, which make their deployment extremely difficult in the confined and electromagnetically harsh environment of a valve hall [15]. Manual inspection, on the other hand, lacks real-time capability and objectivity, and often fails to detect latent faults, falling short of the stringent operation-and-maintenance (O&M) requirements of GFM-SVG installations that serve as key grid-supporting units [16].
In recent years, wireless sensor network (WSN) technology has shown great potential in smart-grid condition monitoring due to its advantages of flexible deployment, low cost, and easy scalability [17,18]. Several representative studies have provided technical foundations for wireless perception of equipment states. For instance, ref. [19] proposed an intelligent monitoring architecture for distribution-network terminals based on ZigBee communication, enabling accurate sensing of equipment status and improving system service performance. Reference [20] presented a passive radio frequency identification (RFID)-based hydrogen concentration monitoring system compliant with ISO/IEC 18000-6 C standards. By incorporating a microcontroller-based tag design, the proposed solution achieved low-cost hydrogen sensing suitable for integration into WSNs. These works have laid important groundwork for wireless and networked condition monitoring of power-system equipment.
Despite this progress, most existing studies focus on temperature measurement [21] or other single-field sensing [22]. In reality, faults within a valve hall are often diverse and mutually correlated, and single-dimensional data leave sensing blind spots that make it difficult to describe equipment health comprehensively and accurately, leading to false alarms or missed detections. For example, localized overheating may stem from a faulty cooling fan (typically accompanied by abnormal noise) or from coolant blockage or leakage (accompanied by temperature anomalies and water traces). In such cases, relying solely on temperature sensors cannot identify the root cause. Therefore, integrating heterogeneous information from multiple modalities—temperature, acoustic signature, visual imagery, and infrared data—for cooperative perception and comprehensive diagnosis has become a necessary and forward-looking approach for achieving in-depth equipment health assessment and early fault warning [23].
Despite the progress achieved in equipment condition monitoring, implementing multi-source fusion-based wireless monitoring inside a valve hall still faces several challenges. First, the extremely strong electromagnetic interference (EMI) environment imposes stringent requirements on the reliability and anti-interference capability of wireless communication [24]. Second, heterogeneous sensing data differ markedly in temporal–spatial scale, dimension, and feature representation. Designing an efficient and robust data fusion algorithm—particularly one capable of managing the uncertainty and conflict among multiple sensor sources—is essential to improve diagnostic accuracy and overall system reliability [25,26]. Finally, there is a distinct research gap regarding multi-source wireless monitoring systems tailored to grid-forming static var generator (GFM-SVG) valve halls. Their special operating conditions, such as transient overcurrents introduced by synthetic inertia support, place even higher demands on the real-time responsiveness and reliability of any monitoring solution [27,28,29].
To address these challenges, this paper designs and implements a multi-source fusion wireless acquisition and intelligent diagnostic system specifically for the valve hall of a GFM-SVG installation. The main contributions are summarized as follows:
- (1)
- Development of a heterogeneous wireless sensing network. A WSN integrating temperature, acoustic, and visual sensing nodes is designed. An EMI-resilient communication scheme is proposed to ensure reliable collection and stable transmission of multi-physics information within the valve hall.
- (2)
- Proposal of an improved Dempster–Shafer (D–S) evidence theory-based fusion model. The proposed multi-source information-fusion fault-diagnosis algorithm effectively resolves data uncertainty and evidence conflict across heterogeneous sensing modalities, achieving high-accuracy and high-reliability diagnosis of abnormal sound, local overheating, coolant leakage, and compound faults.
3. Design of the Multi-Source Fusion Wireless Acquisition System for the GFM-SVG Valve Hall
The architecture of the proposed multi-source fusion wireless acquisition system for the grid-forming static var generator (GFM-SVG) valve hall is shown in Figure 1. The system employs visual, infrared, acoustic, and temperature sensors to achieve comprehensive abnormal condition monitoring within the valve hall.
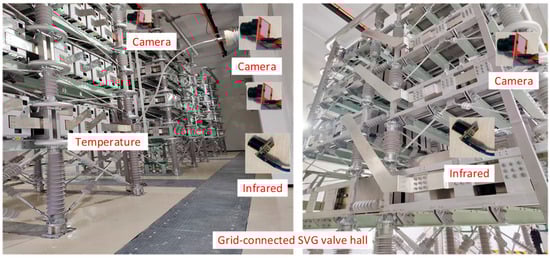
Figure 1.
Architecture of the multi-source fusion wireless acquisition system for the GFM-SVG valve hall.
To realize real-time, reliable, and intelligent monitoring, the system is organized into a four-layer collaborative framework consisting of the perception layer, transmission layer, processing layer, and application layer. Each layer has clearly defined responsibilities while maintaining close interaction:
- (1)
- The perception layer serves as the data source, responsible for the comprehensive sensing of equipment status and environmental parameters.
- (2)
- The transmission layer functions as the data bridge, ensuring stable data flow under strong electromagnetic interference conditions.
- (3)
- The processing layer acts as the data brain, where intelligent algorithms perform data analysis and decision-making.
- (4)
- The application layer provides the output interface, presenting diagnostic and monitoring results through an intuitive visualization platform to support operation and maintenance (O&M) decisions.
This hierarchical framework seamlessly integrates the entire workflow—from raw-data collection to intelligent model processing and result visualization—forming a closed-loop system compatible with the operation and maintenance requirements of valve hall applications. It fulfills the core research objectives of multi-source fusion, fault diagnosis, and performance evaluation.
The overall system structure is illustrated in Figure 2, while the functional relationships among the four layers are presented in Figure 3.
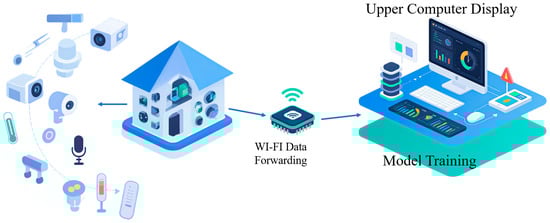
Figure 2.
Overall structure of the multi-source fusion wireless acquisition system.
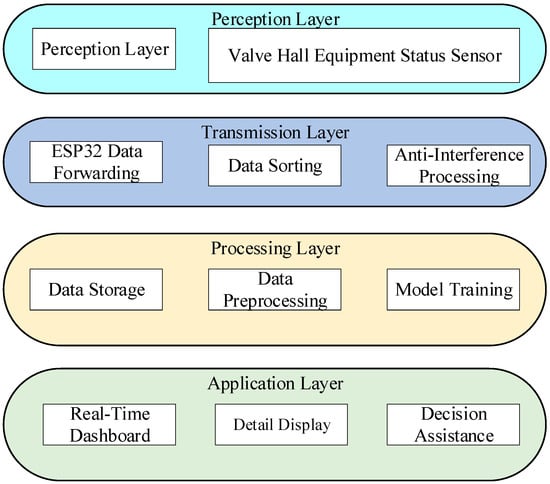
Figure 3.
Functional diagram of the four-layer collaborative architecture.
The proposed system deploys a cluster of heterogeneous sensors, organized according to the monitored objects. The valve hall condition monitoring subsystem incorporates three primary sensing modules:
- (1)
- A visible light camera (Guangdong Tianqian Embedded Technology Co., Ltd., Guangzhou, China) for detecting external defects such as loose screws, surface water accumulation, and other visual anomalies;
- (2)
- An infrared thermographic sensor (Shenzhen Yuekeyuanxing Technology Co., Ltd., Shenzhen, China) for capturing temperature distributions and identifying thermal hot spots on equipment surfaces;
- (3)
- An acoustic sensor (Guangzhou Yingsheng Electronic Technology Co., Ltd., Guangzhou, China) for acquiring sound signatures indicative of mechanical friction or abnormal vibration.
Each type of sensor group is connected to an edge wireless node, which employs an STM32 microcontroller (STMicroelectronics, Plan-les-Ouates, Switzerland) as the core processor and is enclosed in a metallic shielding case to resist strong electromagnetic interference within the valve hall. Functionally, each node receives raw sensor data; appends a timestamp, device coordinates, and a unique identifier; and then encapsulates the information in JSON format. The processed data are transmitted via Wi-Fi or 4G links to a host PC-based upper-computer platform for centralized monitoring and management.
The host computer interface provides real-time visualization of operating parameters for the GFM-SVG valve hall, including ambient temperature, infrared thermal images, acoustic waveforms, and visual image data. This configuration enables on-site, comprehensive monitoring and intuitive data presentation for efficient operation and maintenance.
4. System Adaptation Design and Data Calibration
Environmental parameters in the valve hall of the grid-forming static var generator (GFM-SVG) are wirelessly collected by distributed edge nodes. The design of the multi-source fusion acquisition module is illustrated in Figure 4, while Figure 5 presents the simulated environment used for data acquisition through a PC connected to a single module.
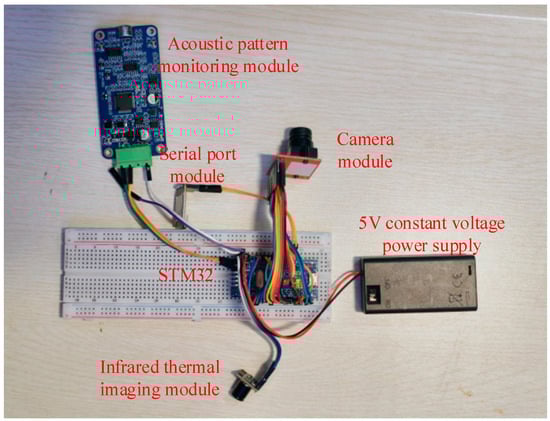
Figure 4.
Multi-source fusion acquisition module.
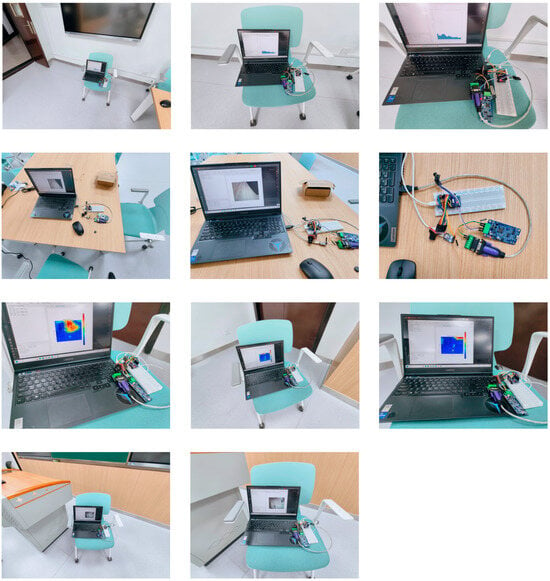
Figure 5.
Simulated environment for data acquisition testing.
4.1. GFM-SVG-Specific Adaptation Design
The proposed system is specifically designed for the valve hall of a GFM-SVG installation. It addresses the fundamental differences between grid-forming (GFM-SVG) and grid-following (GFL-SVG) devices (Nanjing NARI-Relays Electric Co., Ltd., Nanjing, China). Unlike a GFL-SVG, which operates in a passive mode following the grid, a GFM-SVG must actively establish system voltage and frequency and provide synthetic inertia support. Consequently, transient overcurrents and voltage fluctuations occur more frequently, and the insulated-gate bipolar transistor (IGBT) modules experience intense thermal stress cycling. These conditions increase the risk of local overheating and aggravate failure probability. Moreover, a sudden shutdown of a GFM-SVG due to valve hall faults can trigger voltage collapse, placing stricter demands on the monitoring system in terms of real-time performance, electromagnetic immunity, and the capability for both early warning and root-cause diagnosis.
On the hardware side, all sensors adopt industrial-grade, electromagnetic interference-resistant models. The camera, infrared thermal imager, and acoustic sensor are respectively reinforced with metallic shielding covers, vibration-isolated mounts, and conductive coatings to enhance EMI protection. Each edge node is built around an STM32 microcontroller enclosed in a sealed aluminum alloy casing, ensuring measurement accuracy deviation below ±2% even under severe electromagnetic interference. Data transmission follows a dual-mode configuration, using Wi-Fi as the primary channel and 4G as a backup, adaptable to varying data volumes. Encryption, automatic reconnection, and retransmission-checking mechanisms are integrated within the communication protocol to guarantee data security and stability, maintaining a packet-loss rate below 1.5%.
On the algorithmic side, the system optimizes dynamic sensor weighting according to the distribution of GFM-SVG fault types. A transient-compensation coefficient is introduced into the improved Dempster–Shafer (D–S) evidence theory-based fusion model to mitigate misjudgments caused by electromagnetic transients. In addition, fault warning thresholds are dynamically adjusted according to system loading conditions to predict and prevent thermal failures under high load operation in advance.
4.2. Sensor Deployment and Multi-Source Data Calibration
In view of the difficulties associated with accurate sensor installation and calibration under the harsh conditions of industrial environments, the system achieves precise deployment through three-dimensional spatial positioning. Based on the valve hall CAD model, the 3D coordinates of all sensor nodes are pre-defined to ensure that each monitoring point is precisely aligned with its corresponding target device.
To guarantee the accuracy of data fusion, spatiotemporal calibration among multiple sensors is performed prior to system operation. Each sensing unit is driven by an STM32 microcontroller, which automatically assigns a millisecond-level timestamp to every acquired data frame. All sensor outputs are encapsulated in JSON format and include a unique device ID, three-dimensional coordinates, and the timestamp. The data packets are then transmitted over Wi-Fi or 4G networks to the host computer.
At the host side, data are first temporally sorted according to their timestamps and then spatially matched using device IDs and coordinate information. This process ensures accurate spatiotemporal alignment among heterogeneous sensing sources, keeping the sampling time deviation of the visual sensing nodes. The precisely synchronized dataset provides a standardized foundation for subsequent multi-source fusion and feature-level computation.
5. Multi-Source Data Acquisition for the GFM-SVG Valve Hall
This section presents detailed testing and analysis of the camera, infrared, and acoustic sensors used in the proposed system.
5.1. Camera Data
The valve hall of a grid-forming static var generator (GFM-SVG) serves as the core facility for dynamic reactive-power compensation and precise power-quality regulation in modern power systems. Inside the hall, key components such as insulated-gate bipolar transistor (IGBT) modules, reactors, converter valves, and water cooling units operate continuously under high voltage, strong electromagnetic, and enclosed environmental conditions. The mechanical integrity and electrical connection reliability of these components directly determine the overall stability of the SVG system.
Minor external anomalies—such as loosened screws or contaminated insulators—often act as early visible indicators of internal faults, including poor electrical contact or insulation degradation. Moreover, the surrounding valve hall environment, such as the presence of floor water or accumulated debris, not only affects equipment cooling and insulation performance but also poses potential safety risks to on-site maintenance personnel. Therefore, visual monitoring is essential for real-time perception of both equipment and environmental conditions.
To meet these monitoring requirements, the system employs an industrial-grade visible light camera with strong electromagnetic interference resistance. The camera lens is enclosed in a metallic shield to prevent image distortion caused by high electromagnetic radiation. Image acquisition is conducted across the entire valve hall domain at a dynamic resolution ranging from 320 × 240 to 1600 × 1200 pixels, with a frame rate of 2 fps, balancing real-time responsiveness and wireless bandwidth limitations.
The monitored area covers key regions including the IGBT modules, water cooling pumps, and inspection aisles. The collected image data comprehensively record equipment surface conditions, component connections, and environmental variations. These images provide fundamental input for subsequent computer vision-based defect detection and condition assessment, effectively addressing the limitations of manual inspection under strong EMI conditions. As a result, the proposed system enables unattended, around-the-clock visual monitoring of the entire valve hall.
The raw image data acquired by the camera are stored in hexadecimal encoding format, with each pixel occupying two bytes that correspond to the RGB565 color space. This encoding allows accurate distinction between equipment surfaces and environmental backgrounds within the valve hall, fully meeting the visual recognition requirements for detecting surface defects and environmental anomalies.
The hexadecimal data are arranged in a row-major sequence, where each row contains 320 pixels (i.e., 320 groups of 2-byte data) and a total of 24 rows are captured, covering the complete monitoring area of the valve hall. Taking the first eight pixel groups of Row 1 in Frame 1—292D2C 282C2B 282C2B 272B2A 252928 242827 242827 232726—as an example, the decoding procedure is summarized as follows:
- (1)
- Each 16-bit hexadecimal value is divided into two bytes, where, for example, 292D corresponds to 0 × 29 (high byte) and 0 × 2D (low byte), representing one pixel encoded in the RGB565 format.
- (2)
- The actual color values are converted from RGB565 to RGB888 using the following equations:
R = (high_byte [15:11]) << 3,
G = ((high_byte [2:0] << 5)|(low_byte [7:5])),
B = (low_byte [4:0]) << 3.
For instance, for pixel 292D, where the high byte is 0 × 29 (binary 101001) and the low byte is 0 × 2D (binary 101101), the parsed results are
which corresponds to an RGB color of (80, 37, 104). This dark purple tone matches the shading characteristics typically observed on the reactor housing region of the valve hall.
R = (10100 << 3) = 80, G = ((1 << 5)|101) = 37, B = (1101 << 3) = 104,
To illustrate the consistency of image acquisition, a subset of raw data from Frame 1 and Frame 2 is presented in Table 1, showing representative pixel samples encoded in hexadecimal form.

Table 1.
Sample hexadecimal data extracted from Frame 1 and Frame 2 of the camera.
The camera test image is presented in Figure 6.
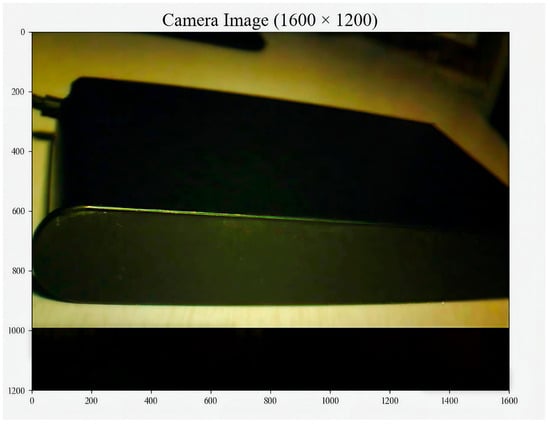
Figure 6.
Camera-acquired visual data from the GFM-SVG valve hall.
The captured visual data comprehensively cover the external appearance of GFM-SVG equipment as well as the overall environmental conditions within the valve hall. When combined with the multi-scale feature extraction and precise localization capability of the YOLOv8 model, this dataset enables multi-dimensional fault monitoring and intelligent visual analysis.
For equipment surface defect detection, the system focuses on key components such as the IGBT modules and water cooling pumps. It specifically identifies critical visual defects, including loose or missing screws on IGBT modules and leakage along water cooling pipelines. By recognizing these characteristic patterns, potential risks such as increased contact resistance, chip temperature rise, and heat dissipation failure can be prevented at an early stage.
For environmental condition monitoring within the valve hall, the panoramic visual coverage allows accurate detection of floor water accumulation beneath equipment and along inspection passages. This capability effectively prevents secondary hazards such as electrical short circuits, operator safety risks, interference to nearby sensors, and delays in fault handling.
5.2. Infrared Thermal Map Data
Within the valve hall of the grid-forming static var generator (GFM-SVG), key components such as insulated-gate bipolar transistor (IGBT) modules, reactors, and converter valves generate significant heat losses during operation. The IGBT modules incur both conduction and switching losses caused by high-frequency switching actions; the reactors exhibit iron and copper losses induced by electromagnetic excitation; and the converter-valve thyristors experience conduction losses during current commutation. All these losses are ultimately dissipated as heat.
Given the enclosed configuration of the valve hall and its high voltage, strongly electromagnetic operating environment, heat accumulation can become severe. Such conditions obscure early indicators of temperature anomalies—such as localized hot spots—and, if not monitored in time, may lead to accelerated insulation aging, drift of power-device electrical parameters, or even catastrophic failures, including thermal breakdowns and short circuits. These faults pose direct threats to the stable operation of the entire power system.
To achieve real-time temperature perception and fault warning, the proposed system employs an industrial-grade infrared thermal imager mounted on a metallic shielding bracket positioned 0.5 to 1 m in front of critical heat-generating areas. This installation effectively minimizes the influence of electromagnetic interference and mechanical vibration. The imager captures temperature data at a frequency of one frame per second, producing raw thermal map matrices of 32 × 24 pixels. These matrices represent the spatial distribution of surface temperatures, overcoming the inherent limitations of traditional point-type thermocouples, which only provide single-point measurements with limited coverage.
The resulting thermal map data serve as the core dataset for thermal safety monitoring of the GFM-SVG valve hall. They provide complete temperature field information for evaluating device thermal behavior, identifying fault locations, and assessing the effectiveness of the cooling system, thereby establishing a comprehensive basis for subsequent multi-source data fusion and intelligent diagnosis.
The thermal map data are stored in a structured matrix format with dimensions of 32 rows × 24 columns, comprising a total of 768 temperature data points. Each data point corresponds to a single pixel element within the field of view of the infrared thermal imager. The data are represented as floating point values with two-decimal precision, and the temperature unit is °C. A typical example of the thermal map matrix, showing the first five rows and five columns, is presented in Table 2.
Table 2.
Sample temperature matrix section of the infrared thermal map (°C).
The raw temperature matrix is converted into an intuitive thermal image representation through a pseudo-color mapping algorithm. In this process, areas with temperatures ≤ 28 °C are displayed in blue, representing normal conditions; regions between 28 °C and 35 °C are shown in yellow, indicating areas of concern; and zones exceeding 35 °C are marked in red to denote alarm or warning conditions. This color mapping visualization enables clear identification of temperature gradients and spatial distribution across the monitored equipment surfaces.
The infrared thermal map image captured is illustrated in Figure 7.
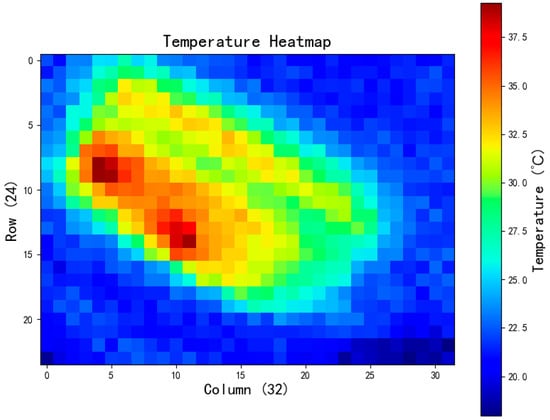
Figure 7.
Infrared thermal map data.
Based on the spatial distribution characteristics observed in the infrared thermal maps, the system integrates the structural parameters of key components, such as the IGBT modules and the water cooling system, to perform accurate identification of thermal faults through differentiated temperature threshold settings.
For instance, in the case of the IGBT modules, the analysis focuses on the chip’s core heat generation region, where temperature is directly coupled with power loss and cooling efficiency. By continuously monitoring inter-chip temperature differentials and localized hot spot formation, the system issues early warnings of potential issues such as cooling channel blockage or abnormal chip power dissipation.
After preprocessing, the infrared temperature data are transformed into fault-feature information, which serves as one of the key evidence sources in the multi-source fusion diagnostic framework. These thermal features are cross-validated with visual and acoustic characteristics and incorporated into the fusion calculation through a dynamic weight allocation strategy, thereby providing reliable support for precise detection and diagnosis of thermal faults.
5.3. Audio Data
Within the valve hall of the grid-forming static var generator (GFM-SVG), various operating components produce inherent and relatively stable acoustic signatures that define the system’s normal acoustic environment. The high-frequency switching operations of the IGBT modules, the electromagnetic vibrations of the reactors, and the mechanical motion of water-pump assemblies in the cooling system all generate characteristic sounds associated with healthy operation.
However, under long-term exposure to high voltage and intense electromagnetic fields, hidden faults may gradually develop. For example, continuous electromagnetic vibration can cause loosening of reactor bolts, resulting in friction-induced changes in the acoustic signature; aging of the IGBT insulation layer may lead to localized breakdown accompanied by high-frequency arc discharge noise. These incipient faults typically show no visible deformation or temperature abnormality at an early stage, manifesting only as subtle fluctuations in the sound pressure levels at specific frequency bands. Such variations are extremely difficult to capture through manual inspection or single-source temperature or vision monitoring and can easily progress from latent to severe faults, leading to equipment damage or deterioration of grid power quality.
To achieve early identification of latent faults, the proposed monitoring system employs industrial-grade, electromagnetic interference-resistant acoustic sensors, installed following a precision placement strategy that targets the critical mechanical and electrical components of the valve hall. Each sensor acquires acoustic signals in the 63 Hz–8 kHz frequency range at a sampling rate of one measurement per second. The resulting structured dataset contains 22 one-third-octave-band sound pressure values accompanied by accurate timestamps.
This acoustic information provides an essential sound signature dimension for early diagnosis of both mechanical and electrical faults, compensating for the limitations of temperature- and vision-based monitoring. Together, these sensors establish a sound pattern safety monitoring subsystem for the GFM-SVG valve hall, enabling comprehensive multi-domain condition awareness.
The acoustic data are stored in a structured “timestamp multi-band sound pressure” format. Each record consists of one timestamp field and 22 sound pressure fields. The dataset is saved in CSV format, which facilitates parsing by edge node processors and supports seamless integration within multi-source data fusion. The timestamp, accurate to one second, allows spatiotemporal synchronization with the corresponding camera images and infrared thermal maps.
The 22 frequency bands are defined based on one-third-octave intervals, covering a comprehensive range from low to high frequencies. Specifically, they include:
- Low-frequency bands: 63 Hz, 80 Hz, 100 Hz, 125 Hz, 160 Hz;
- Mid-frequency bands: 200 Hz, 250 Hz, 315 Hz, 400 Hz, 500 Hz, 630 Hz, 800 Hz, 1 kHz, 1.25 kHz, 1.6 kHz, 2 kHz, 2.5 kHz;
- High-frequency bands: 3.15 kHz, 4 kHz, 5 kHz, 6.3 kHz, 8 kHz.
Each frequency band corresponds to an unweighted sound pressure value expressed in decibels (dB), with a measurement range of 40–110 dB and an accuracy of ±1.5 dB. These acoustic features fully capture the spectral distribution characteristics of the valve hall sound signatures. Representative data samples are shown in Table 3.
Table 3.
Partial dataset of sound pressure values at different frequency bands (dB).
The acoustic waveforms acquired by the sound pattern sensors are illustrated in Figure 8.
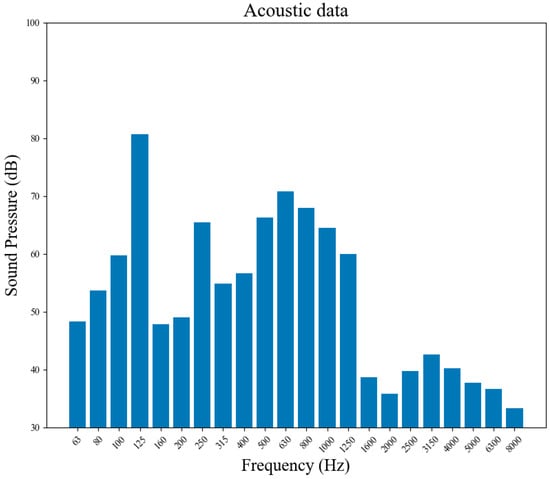
Figure 8.
Acoustic data collected by the sound pattern sensor.
Based on the frequency characteristics and sound pressure variations extracted from the acoustic data, and in combination with the inherent acoustic signatures generated by mechanical vibrations of the valve hall equipment, the system performs comparative analysis between the real-time sound pressure values and a predefined normal acoustic baseline. This enables the detection of abnormal signals for early localization and identification of potential mechanical faults.
Particular attention is given to the low-frequency bands, which directly reflect the fastening condition of mechanical structures and the precision of moving components. By identifying abnormal increases or periodic fluctuations in the sound pressure amplitude within these frequency ranges, the system can promptly issue early warnings of possible issues such as reactor bolt loosening or mechanical friction among moving parts.
After preprocessing and fault-feature extraction, the acoustic data are incorporated into the multi-source fusion framework as a critical evidence source. These features are cross-validated with visual-appearance detections and infrared-temperature characteristics, and further participate in the fusion computation through a fault type-dependent dynamic weighting strategy. This integrated approach provides a reliable acoustic dimension for precise mechanical fault diagnosis within the GFM-SVG valve hall monitoring system.
6. Visual Detection Model Construction and Multi-Source Information Fusion Design
6.1. YOLOv8-Based Visual Detection Model
The YOLOv8 model, a state-of-the-art single-stage object detection framework, adopts the classical three-part architecture consisting of a backbone, neck, and detection head. Its balanced performance between detection accuracy and inference speed makes it highly suitable for identifying small-scale faults in the valve hall of a grid-forming static var generator (GFM-SVG). The model offers several technical advantages that directly address the engineering requirements of power equipment monitoring. By introducing an anchor-free detection mechanism, YOLOv8 simplifies the localization process, while the integration of the Complete Intersection over Union (CIoU) loss function significantly improves bounding box regression precision. Together, these features provide a solid technical foundation for reliable detection of subtle valve hall defects.
The main structural optimizations of the model are summarized as follows.
6.1.1. Network Architecture Optimization
To accommodate the computational constraints of on-site edge computing applications, the C2f module is employed in the backbone network to replace the traditional C2 block used in earlier YOLO models. This modification preserves deep feature extraction capability while reducing computational overhead by approximately 20%. In the neck stage, a Spatial Pyramid Pooling-Fast (SPPF) module is introduced to enhance multi-scale feature fusion, thereby improving the model’s sensitivity to small-sized targets such as minor water leak points or screw displacements. Finally, the detection head adopts a decoupled structure that separates classification and regression branches, producing independent outputs for class confidence and bounding box coordinates. This architecture minimizes feature interference between the two tasks and effectively increases detection accuracy.
6.1.2. Loss Function Design
To address the core requirement of accurate localization and clear classification in valve hall fault detection, a composite loss function combining the Complete Intersection over Union () bounding box regression loss and the cross-entropy classification loss is formulated, as expressed below:
In Equation (1), represents the weighting factor of the classification loss, which is set to 1.0 according to the class distribution characteristics of the valve hall fault dataset. denotes the bounding box regression loss, which jointly considers the overlap, the center point distance, and the aspect ratio consistency between the predicted and ground-truth boxes. This formulation effectively improves the localization precision for small-scale faults such as minor leaks or screw displacements. The mathematical expression is given as
where IoU is the intersection over union between the predicted box and its ground truth, is the Euclidean distance between their center points, is the diagonal length of the minimum enclosing box covering both, is a balance coefficient, and is the aspect ratio consistency term. Through these multi-dimensional constraints, the loss enhances the model’s sensitivity to subtle shifts in bounding box geometry, enabling precise detection of fine-scale defects such as screw loosening and micro-leakage.
6.1.3. Inference Pipeline Design
The inference procedure begins with the on-site valve hall images captured by the industrial camera, which are first preprocessed and then fed into the trained YOLOv8 model. Features are extracted by the backbone network and fused through the neck module to generate multi-scale candidate bounding boxes. Redundant detections are subsequently removed using the Non-Maximum Suppression (NMS) algorithm with a confidence threshold of 0.5, after which the model outputs the final results—fault category, confidence score, and bounding box coordinates.
6.2. Construction of the Multi-Source Information Fusion Algorithm
6.2.1. Fusion Architecture Design Centered on Visual Detection
To address the multi-dimensional characteristics of complex valve hall faults in grid-forming static var generators (GFM-SVG)—including local overheating and electrical discharge phenomena—a three-sensor fusion framework is developed, integrating accurate visual detection with infrared and acoustic cross-verification. Within this framework, the YOLOv8-based visual detection results serve as the primary evidence source, while the infrared data provide complementary temperature features and the acoustic data supply additional vibration and sound pattern information. This tri-modal design enables comprehensive perception of fault features under complex operating conditions.
A three-level fusion architecture is introduced to balance diagnostic timeliness and accuracy:
Level 1—Single-Sensor Feature Extraction and Preliminary Evaluation: Each sensor undergoes data preprocessing to extract relevant features and compute an initial fault confidence level.
Level 2—Feature-Level Dynamic Weighted Fusion: The extracted features are combined using dynamically adjusted weighting factors that reflect each sensor’s relevance to a specific fault type, ensuring reliable feature integration across heterogeneous modalities.
Level 3—Fault-Decision Output: Multi-sensor information is synthesized through a Dempster–Shafer (D–S) evidence theory-based decision model to deliver a final, unified diagnostic result.
This hierarchical fusion framework effectively meets the fast O&M (operation and maintenance) requirements of industrial valve hall environments and provides robust support for accurate and real-time fault diagnosis.
6.2.2. Single-Sensor Feature Extraction and Preliminary Evaluation Model
- (1)
- Visual Sensor (i = 1):
An industrial-grade high-definition camera (2 MP, aperture f/2.0) is installed along the valve hall overhead inspection track. The initial fault confidence value is directly derived from the category confidence output of the YOLOv8 model. According to the characteristics of valve hall faults, an initial detection is considered valid when the confidence is ≥0.8, ensuring the reliability of the visual evidence entering the fusion framework.
- (2)
- Infrared Sensor (i = 2):
An industrial-grade infrared thermal imager (temperature range −20–300 °C, accuracy ±2 °C) is deployed near critical monitoring points on the side of the SVG equipment. Key temperature-related features—such as the average temperature of the monitored region and the temperature difference between the IGBT module and its heat sink—are extracted. These features are combined with predefined thresholds and evaluated using a fuzzy comprehensive evaluation method to compute the initial fault confidence .
- (3)
- Acoustic Sensor (i = 3):
An electromagnetic interference-resistant acoustic sensor module (monitoring range 63 Hz–8 kHz, sound pressure accuracy ±1.5 dB) is positioned around the major mechanical and electrical components of the valve hall. The acoustic signals are processed using short-time Fourier transform (STFT) to extract time-frequency features such as sound pressure peaks and abnormal band occupancy ratios. These metrics are then matched with a fault sound pattern template library through cosine similarity analysis to determine the initial fault confidence .
To ensure the consistency of multi-source data fusion, all confidence outputs from the three sensors are normalized within the range [0, 1], where 0 indicates a normal condition and 1 represents definite fault occurrence. This normalization provides a standardized input basis for subsequent fusion computations.
6.2.3. Dynamic Weight-Assignment Mechanism
Considering that each sensor exhibits different suitability for various fault types, a fault-type-driven dynamic weighting strategy is adopted.
The visual sensor contributes the dominant evidence in appearance-related faults such as water accumulation or leakage; the infrared sensor primarily targets localized overheating faults; and the acoustic sensor is crucial for detecting abnormal mechanical sounds from key components.
Weight coefficients are assigned to the three evidence sources according to their respective recognition accuracies under different fault scenarios, subject to the normalization constraint: . This weighting scheme ensures balanced contribution from each modality and maintains the overall normalization required for robust fusion computations.
6.2.4. Core Formulation of the Fusion Algorithm and Conflict Resolution
To enhance the robustness of the fusion system, a weighted Dempster–Shafer (D–S) evidence theory-based model is developed. The model incorporates a visual evidence reliability correction factor and an electromagnetic interference (EMI) compensation coefficient to improve fusion performance under strong interference conditions. The core computational formulations are as follows:
- (1)
- Visual sensor evidence confidence:
Let denote the reliability coefficient of the YOLOv8 model. The confidence for the visual evidence source, , is calculated as
where is the weight coefficient assigned to the visual sensor, is its initial confidence value, and serves to adjust the trust level of the visual detection results.
- (2)
- Infrared and acoustic sensor evidence confidence:
Considering the impact of the valve hall’s strong EMI environment on sensor reliability, an interference correction factor of 0.95 is applied to the infrared and acoustic evidence sources. Accordingly, their confidence values, , are given by
where and are the assigned weight and initial confidence for each respective sensor.
- (3)
- Evidence conflict handling and overall confidence computation:
A conflict factor is defined to quantify the inconsistency among the evidence sources. When approaches 1, it indicates strong disagreement between diagnostic conclusions from different sensors; in such cases, historical patterns and characteristic thresholds from the fault knowledge base are used to adjust the corresponding evidence. Conversely, when is close to 0, the evidence sources are considered consistent, and direct fusion can proceed.
The conflict factor and the combined confidence are computed by
In Equation (5), a larger value reflects greater conflict among sensors, while Equation (6) represents the D–S evidence combination rule, where denotes the common fault type identified by all evidence sources. The fusion result is normalized to produce the final composite confidence .
The fusion decision rule is defined as follows: the comprehensive confidence is compared with a preset threshold of 0.5. If m(A) ≥ 0.5, the system determines the presence of the corresponding fault type. When multiple fault categories simultaneously exceed this threshold, the highest-confidence fault is identified as the primary fault, and the second-highest as the secondary fault. This approach enables precise distinction and prioritization in multi-fault scenarios, providing effective decision support for maintenance personnel.
7. System Performance Testing and Validation
7.1. YOLOv8 Visual Detection Model Performance Evaluation
7.1.1. Test Plan Design
To address the engineering challenges associated with the dense equipment layout, strong electromagnetic interference (EMI), and overlapping fault features within the GFM-SVG valve hall, a lightweight YOLOv8-based detection model was developed and evaluated. The test targeted three primary categories of visual faults—water accumulation/leakage, component loosening, and external appearance anomalies. The experimental procedure consisted of three main parts: dataset construction, hardware configuration, and evaluation metric selection.
- (1)
- Dataset construction:The dataset was collected from a simulated valve hall fault environment of a 500 kV substation GFM-SVG installation. An industrial-grade camera continuously captured fault simulation images over ten days. The acquired images were manually filtered, labeled, and augmented through image rotation, scaling, noise injection, and light-variation simulation, resulting in 2000 valid samples. The dataset was divided into training, validation, and test sets in a 7:2:1 ratio. The images covered three representative complex scenarios to ensure adequate engineering representativeness:
- ➀
- Electromagnetic interference scenarios;
- ➁
- Equipment occlusion scenarios;
- ➂
- Fault severity gradients.
- (2)
- Hardware configuration:The experiment was implemented on an industrial edge computing platform with the following specifications:
- CPU: Intel Core i7-14700KF (16 cores, 24 threads, 3.4 GHz base clock);
- GPU: NVIDIA RTX 4070 Super with 12 GB GDDR6X memory and 3840 CUDA cores;
- Memory: 32 GB DDR5 5600 MHz;
- Storage: 2 TB NVMe SSD;
- Operating system: Windows 11 Professional (64-bit);
- Software environment: Python 3.9, PyTorch 2.0 framework, Ultralytics YOLOv8 package for model development, and OpenCV 4.8.0 for image preprocessing and visualization.
7.1.2. Training Process and Convergence Characteristics
The training parameters of the YOLOv8 model were configured as follows: the initial learning rate was set to 0.01, and a cosine-annealing learning-rate decay strategy was applied. The batch size was fixed at 16, with a maximum of 100 training epochs. The evolution curves of the key performance metrics—precision, recall, and mean average precision at IoU = 0.5 (mAP50)—are shown in Figure 9. The model exhibits a typical three-stage convergence behavior: rapid convergence, fine optimization, and steady convergence.
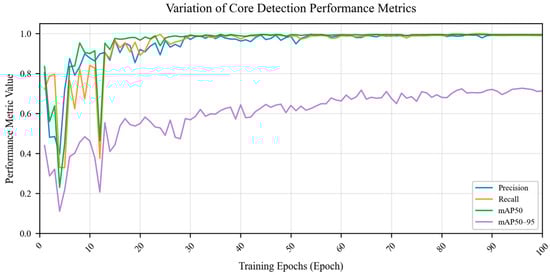
Figure 9.
Performance metric evolution curves of the YOLOv8 model.
- (1)
- Rapid convergence (epochs 1–30):
Starting from random initialization, the model rapidly learns key fault features. Precision improves from 0.3967 to 0.9521, recall from 0.3288 to 0.9345, and mAP50 rises sharply from 0.2306 to 0.9513. During this stage, the feature extraction network quickly captures discriminative patterns between faulty regions and background areas, resulting in a significant boost in detection performance.
- (2)
- Fine optimization (epochs 31–80):
The performance metrics continue to improve steadily. Precision increases to 0.9864, recall reaches 0.9823, and mAP50 stabilizes within 0.98–0.99, indicating refined optimization and solid feature generalization.
- (3)
- Stable convergence (epochs 81–100):
Metric fluctuations remain below 0.005. Precision stabilizes between 0.985 and 0.995, recall remains within 0.98–0.99, and mAP50 is maintained around 0.99. The validation set loss reaches its minimum value of 0.021 at epoch 90 and shows no notable decrease thereafter, meeting the early stopping criterion. Training thus terminates automatically, and the network parameters converge to their optimal state.
Note: “Precision” denotes the ratio of correctly detected fault samples to all predicted faults, “Recall” represents the ratio of correctly detected faults to the total actual faults, and “mAP50” refers to the mean average precision at an intersection-over-union (IoU) threshold of 0.5.
7.1.3. Quantitative Evaluation of Model Performance
The trained YOLOv8 model was quantitatively evaluated using 200 independent test set samples that were not involved in training or validation. Four performance metrics were selected as key evaluation indicators: Precision, Recall, mAP50, and mAP50–95. The test results are summarized in Table 4, demonstrating that the model achieves high accuracy and strong robustness under complex valve hall monitoring conditions.
Table 4.
Performance evaluation of the YOLOv8-based visual detection model.
- (1)
- High accuracy detection capability:
The precision of 0.9735 indicates that 97.35% of the predicted faults correspond to actual faults, effectively reducing false alarm rates during operation and maintenance. The recall rate of 0.9712 confirms that the model successfully identifies 97.12% of simulated faults, including subtle defects such as minor water leak points and slight screw displacements—an achievement difficult to replicate through manual inspection.
- (2)
- Strong environmental robustness:
The mAP50 value of 0.9762 reflects near-optimal performance in both object localization and classification tasks. The mAP50–95 value of 0.7128 further indicates the model’s adaptability to various engineering scenarios, supporting applications that require different levels of precision—for instance, estimating the volume of accumulated water or measuring the degree of screw displacement.
7.2. Performance Testing and Analysis of the Multi-Source Information Fusion System
7.2.1. Test Environment and Experimental Design
The field tests were conducted in the valve hall of a 500 kV substation equipped with a grid-forming static var generator (GFM-SVG). The environment was characterized by strong electromagnetic interference, and additional disturbances were present on the 2.4 GHz frequency band due to harmonics generated by the SVG equipment.
The hardware configuration used for the tests was identical to that of the model-training environment to ensure consistency and objectivity in performance evaluation.
To verify system performance under real operating conditions, standardized artificial disturbances were introduced to simulate four representative fault scenarios, such as minor water leakage and screw loosening. A total of 520 effective test samples were collected.
Two key performance metrics were adopted for quantitative evaluation:
Fault Detection Rate (FDR) = (correctly detected faults/total faults) × 100%
Diagnostic Accuracy Rate (DAR) = (correctly diagnosed faults/total detections) × 100%
7.2.2. System Performance Across Different Fault Types
The results of the system’s performance for individual fault categories are summarized in Table 5, which highlights the diagnostic capability achieved through the fusion of the visual, infrared, and acoustic data sources.
Table 5.
Performance evaluation of the multi-source information fusion system.
From the data presented in Table 5, it can be concluded that the multi-source fusion system enhanced with the YOLOv8-based visual detection model demonstrates outstanding capability in recognizing and diagnosing various fault types, as well as distinguishing normal operating conditions within the GFM-SVG valve hall. The detailed performance is summarized as follows:
- (1)
- Fault detection rate:
All four fault categories achieved detection rates exceeding 98%. Among them, the highest rate of 99.6% was achieved for valve hall water accumulation or leakage, primarily because the YOLOv8 model effectively captures distinct grayscale and contour features in the flooded regions. When combined with infrared temperature difference verification, the feature signals become more stable and easily recognizable. The slightly lower detection rate for abnormal acoustic events (98.6%) can be attributed to the weak early-stage discharge signals and the susceptibility of acoustic patterns to background noise generated by operating equipment within the valve hall.
- (2)
- Diagnostic accuracy:
The diagnostic accuracy for all fault categories and the normal operating condition exceeds 98.5%. The system achieved the highest accuracy of 99.3% in identifying the normal operation state, indicating its strong ability to distinguish between faulty and healthy conditions and thereby minimize false alarms. Moreover, the algorithm accurately correlates fault types with their corresponding feature data, providing maintenance engineers with explicit localization and classification information. In this way, the system enables early detection and precise diagnosis of valve hall faults in GFM-SVG installations.
8. Conclusions
This study addresses the urgent requirement for real-time condition monitoring of grid-forming static var generator (GFM-SVG) valve halls by designing and implementing a multi-source fusion wireless acquisition and intelligent diagnostic system. The proposed system integrates acoustic, visual, and infrared sensing units within an electromagnetic interference-resilient wireless sensor network, effectively solving the challenges of reliable data acquisition and stable transmission of multi-physics information in complex valve hall environments. The core innovation lies in the development of an enhanced Dempster–Shafer (D–S) evidence theory-based multi-source information fusion algorithm, enabling accurate diagnosis and early warning of multiple fault types—including local overheating, mechanical abnormal noise, surface defects, and coolant leakage.
Although the system demonstrates excellent overall performance, several limitations remain. The current diagnostic model shows limited generalization when facing previously unseen or novel fault types, as it primarily relies on supervised training with labeled data. Consequently, its recognition accuracy decreases for faults not yet included in the existing knowledge base. Additionally, sensor deployment and calibration still require partial manual assistance, which constrains scalability in large and complex valve hall installations. Furthermore, the present system is specifically optimized for GFM-SVG applications; adapting it to other types of power equipment requires parameter adjustments, as a standardized rapid configuration framework has not yet been established.
Future work will focus on integrating transfer learning and few-shot learning approaches to enhance the system’s capability for novel fault identification. A standardized adaptation framework will be developed to facilitate deployment in other power system assets, such as transformers and photovoltaic inverters. In parallel, integration with industrial Internet platforms will be explored to establish comprehensive lifecycle health assessment functions, thereby providing a more complete and intelligent support system for the operation of next-generation power networks.
Author Contributions
Conceptualization, Y.Z.; Methodology, P.W. and B.Y.; Software, J.Z.; Validation, L.X.; Formal analysis, B.Y.; Investigation, G.T. and J.D.; Resources, Y.Z.; Data curation, L.X. and H.Z.; Writing—original draft, J.Z. and H.Z.; Writing—review & editing, J.D.; Supervision, G.T.; Project administration, L.L. and P.W. All authors have read and agreed to the published version of the manuscript.
Funding
This research received no external funding.
Data Availability Statement
The data presented in this study are not publicly available due to ethical and confidentiality restrictions. Requests to access the datasets can be directed to the corresponding author, provided that valid ethical approval and a data use agreement (signed by the requesting party and the authors’ affiliated institution) are obtained to ensure compliance with data privacy and security guidelines.
Acknowledgments
State Grid Provincial Company’s Key Science and Technology Project: Research on Key Technologies for the Operation, Maintenance, and Inspection of Grid-Forming SVG.
Conflicts of Interest
Authors Liqian Liao, Jiayi Ding, Guangyu Tang, Yuanwei Zhou were employed by the State Grid Chengdu Electric Power Supply Company. The remaining authors declare that the research was conducted in the absence of any commercial or financial relationships that could be construed as a potential conflict of interest.
References
- Kang, C.; Chen, Q.; Xia, Q. Prospects of Low-Carbon Electricity. China Power Syst. Technol. 2009, 33, 1–7. [Google Scholar]
- Shu, Y.; Zhang, Z.; Guo, J. Study on Key Factors and Solution of Renewable Energy Accommodation. China Proc. CSEE 2017, 37, 1–9. [Google Scholar]
- Lu, Z.; Li, H.; Qiao, Y. Flexibility planning and challenges of power systems with a high proportion of renewable energy sources. China Autom. Electr. Power Syst. 2016, 40, 147–158. [Google Scholar]
- Blaabjerg, F.; Teodorescu, R.; Liserre, M.; Timbus, A.V. Overview of Control and Grid Synchronization for Distributed Power Generation Systems. IEEE Trans. Ind. Electron. 2006, 53, 1398–1409. [Google Scholar] [CrossRef]
- Zhang, H.; Ma, R.; Cao, Y.; Liu, Y.; Zou, S. Review and prospect of research on new power system synchronous stability. China J. Shandong Univ. (Eng. Sci.) 2025, 55, 1–15. [Google Scholar]
- Rocabert, J.; Luna, A.; Blaabjerg, F.; Rodríguez, P. Control of Power Converters in AC Microgrids. IEEE Trans. Power Electron. 2012, 27, 4734–4749. [Google Scholar] [CrossRef]
- Pei, X. Research on the Application of Mesh-Type and Network-Type Converters in Power Systems. China Mech. Electr. Inf. 2025, 60–63. [Google Scholar] [CrossRef]
- Zhong, C.; Wang, Y. Review of the Droop Coordinated Control Method for Multiple Inverters. China Electr. Autom. 2017, 39, 7–10+62. [Google Scholar]
- Wu, T.; Castellazzi, A. Temperature adaptive IGBT gate-driver design. In Proceedings of the 2011 14th European Conference on Power Electronics and Applications, Birmingham, UK, 30 August–1 September 2011. [Google Scholar]
- Du, M.; Xin, J.; Wang, H.; Ouyang, Z.; Wei, K. Bond wire lift-off monitoring based on intersection point movement characteristic in IGBT module. Microelectron. J. 2021, 116, 105202. [Google Scholar] [CrossRef]
- Hong, Z.; Xu, H.; Hou, Z.; Zhan, M. Origin of anomalous instability of grid-forming converters tied to stiff grid. IET Renew. Power Gener. 2023, 17, 2563–2574. [Google Scholar] [CrossRef]
- Zhao, F.; Wang, X.; Zhu, T. Power dynamic decoupling control of grid-forming converter in stiff grid. IEEE Trans. Power Electron. 2022, 37, 9073–9088. [Google Scholar] [CrossRef]
- Xiao, Y.; Luo, D.; Jiang, Q.; Hu, L.; Li, C.; Zhang, L. Thermal Infrared Image Recognition Method for High Voltage Equipment Failure in Substation Based on Temperature Probability Density. China High Volt. Eng. 2022, 48, 307–318. [Google Scholar]
- Ji, Y.; Qian, J.; Miao, X.; Yang, R.; Wang, M. Design of Power Equipment Monitoring and Management System Based on Internet of Things. Environ. Technol. 2024, 42, 120–124+133. [Google Scholar]
- Gungor, V.C.; Lambert, F.C. A survey on communication networks for electric system automation. Comput. Netw. 2006, 50, 877–897. [Google Scholar] [CrossRef]
- Liu, C.; Zhang, G.; Cheng, Y.; Qin, X.; Lin, H. Research and Implementation of Integrated Monitoring Technology for Intelligent Substation. China Electr. Eng. 2024, 138–140. [Google Scholar] [CrossRef]
- Liu, J.; Zhao, Z.; Ji, J.; Hu, M. Research and application of wireless sensor network technology in power transmission and distribution system. Intell. Converg. Netw. 2020, 1, 199–220. [Google Scholar] [CrossRef]
- Samanta, S.K.; Chanda, C.K. Wireless power network design through smart grid transmission system model. In Proceedings of the 2015 International Conference on Energy, Power and Environment: Towards Sustainable Growth (ICEPE), Shillong, India, 12–13 June 2015; pp. 1–5. [Google Scholar]
- Liu, T.; Fang, Z.; Guo, H.; Tong, S.; Meng, B. Architecture Design of Intelligent Monitoring System for Distribution Network Terminals Based on ZigBee Technology. China Northeast. Electr. Power Technol. 2025, 46, 13–17+22. [Google Scholar]
- Li, G.; Li, Z.; Guan, D.; Huang, Z.; Hu, W.; Inserra, D.; Li, J.; Huang, Y.; Wen, G. A Hydrogen Concentration Monitoring System With Passive Tags. IEEE Internet Things J. 2021, 8, 9244–9256. [Google Scholar] [CrossRef]
- Chen, H.; Nan, X.; Xia, S. Data Fusion Based on Temperature Monitoring of Aquaculture Ponds With Wireless Sensor Networks. IEEE Sens. J. 2023, 23, 6–20. [Google Scholar] [CrossRef]
- Li, Z.; Li, G.; Wen, G.; Xu, R.; Li, J.; Huang, Y.; Sun, H.; Wu, P.; Inserra, D.; Xie, F. Intermittent Magnetic Field Monitoring System Based on Passive RFID Sensor Tags. IEEE Sens. J. 2022, 22, 819–831. [Google Scholar] [CrossRef]
- Heinzelman, W.R.; Chandrakasan, A.; Balakrishnan, H. Energy-Efficient Communication Protocol for Wireless Microsensor Networks. In Proceedings of the 33rd Hawaii International Conference on System Sciences, Maui, HI, USA, 7 January 2000. [Google Scholar]
- Liu, S.; Xu, Z. Study on Stable Operating Region of VSC-HVDC Connected to Weak AC Systems. China Proc. CSEE 2016, 36, 133–144. [Google Scholar]
- Liu, Q.; Zhang, Q. Heterogeneous Multi-Sensor Data Fusion in Radar Signal Processing. In Proceedings of the 2019 4th International Conference on Electromechanical Control Technology and Transportation (ICECTT), Guilin, China, 26–28 April 2019; pp. 134–137. [Google Scholar]
- Yager, R.R. On the Dempster–Shafer framework and new combination rules. Inf. Sci. 1987, 41, 93–137. [Google Scholar] [CrossRef]
- Roscoe, A.; Brogan, P.; Elliott, D.; Knueppel, T.; Gutierrez, I.; Campion, J.-C.P.; Da Silva, R. Practical experience of operating a grid forming wind park and its response to system events. In Proceedings of the 18th Wind Integration Workshop, Dublin, Ireland, 16–18 October 2019; pp. 14–18. [Google Scholar]
- Liu, J.; Miura, Y.; Ise, T. Comparison of dynamic characteristics between virtual synchronous generator and droop control in inverter-based distributed generators. IEEE Trans. Power Electron. 2016, 31, 3600–3611. [Google Scholar] [CrossRef]
- Amin, M.; Rygg, A.; Molinas, M. Self-synchronization of wind farm in an MMC-based HVDC system: A stability investigation. IEEE Trans. Energy Convers. 2017, 32, 458–470. [Google Scholar] [CrossRef]


Disclaimer/Publisher’s Note: The statements, opinions and data contained in all publications are solely those of the individual author(s) and contributor(s) and not of MDPI and/or the editor(s). MDPI and/or the editor(s) disclaim responsibility for any injury to people or property resulting from any ideas, methods, instructions or products referred to in the content. |
© 2026 by the authors. Licensee MDPI, Basel, Switzerland. This article is an open access article distributed under the terms and conditions of the Creative Commons Attribution (CC BY) license.